FIGURE 1.9 U. S. COMPUTER AND INTERNET ACCESS Computers Internet Access 0 10 20 30 40 50 60 70 2003 1998 Source: National Telecommunications and Information Administration Percentage of households Year CONCEPT REVIEW Economics is the study of how individuals and societies satisfy their unlimited wants with limited resources. CHAPTER 1 KEY CONCEPT Scarcity is the situation that exists because wants are unlimited and resources are limited. WHY THE CONCEPT MATTERS You confront the issue of scarcity constantly in everyday life. Look again at the caption on page 2. Suppose you have $20 to cover the cost of lunches for the week. How will you use your limited funds to meet your wants (lunch for Monday through Friday)? What if you stayed late at school twice a week and bought a $1 snack each day? How would this affect your lunch choices? Identify one or two other examples of scarcity in your everyday life. How do economists use graphs? See Section 4 of this chapter. CHAPTER The Economic Way of Thinking 3 1 SECTION 1 Scarcity: The Basic Economic Problem SECTION 2 Economic Choice Today: Opportunity Cost SECTION 3 Analyzing Production Possibilities SECTION 4 The Economist’s Toolbox C ASE STUDY The Real Cost of Expanding O’Hare Airport Go to ECONOMICS UPDATE for chapter updates and news on the cost of expansion plans at O’Hare Airport in Chicago. (See Case Study, pages 32–33). Go to INTERACTIVE REVIEW for concept review and activities. Go to ANIMATED ECONOMICS for interactive lessons on the graphs and tables in this chapter. More at ClassZone.com The Economic Way of Thinking
Transcript
FIGURE 1.9 U.S. COMPUTER ANDINTERNET ACCESS
Computers Internet Access
0
10
20
30
40
50
60
70
20031998
Source: National Telecommunications and Information Administration
Perc
enta
ge
of
ho
use
ho
lds
Year
CONCEPT REVIEW
Economics is the study of how individuals and societies satisfy theirunlimited wants with limited resources.
CHAPTER 1 KEY CONCEPT
Scarcity is the situation that exists because wants are unlimited andresources are limited.
WHY THE CONCEPT MATTERS
You confront the issue of scarcity constantly in everyday life. Lookagain at the caption on page 2. Suppose you have $20 to cover thecost of lunches for the week. How will you use your limited fundsto meet your wants (lunch for Monday through Friday)? What ifyou stayed late at school twice a week and bought a $1 snack eachday? How would this affect your lunch choices? Identify one or twoother examples of scarcity in your everyday life.
How do economists use graphs?See Section 4 of this chapter.
CHAPTER
The Economic Way of Thinking 3
1SECTION 1Scarcity: The
Basic EconomicProblem
SECTION 2Economic
Choice Today:Opportunity
Cost
SECTION 3AnalyzingProductionPossibilities
SECTION 4The Economist’s
Toolbox
CASE STUDYThe Real Costof Expanding
O’Hare Airport
Go to ECONOMICS UPDATE forchapter updates and news on thecost of expansion plans at O’HareAirport in Chicago. (See Case Study,pages 32–33).
Go to INTERACTIVE REVIEW forconcept review and activities.
Go to ANIMATED ECONOMICS forinteractive lessons on the graphsand tables in this chapter.
More at ClassZone.com
The EconomicWay of Thinking
1SECT ION
4 Chapter 1
Scarcity: The BasicEconomic Problem
As you read Section 1, completea cluster diagram showing howscarcity is the central conceptof economics. Use the GraphicOrganizer at Interactive Review@ ClassZone.com
In Section 1, you will
• explain how the economicdefinition of scarcity differsfrom the common definition
• understand why scarcityaffects everyone
• learn three economicquestions that societies facebecause of scarcity
• describe the four factors ofproduction and their uses
wants, p. 4
needs, p. 4
scarcity, p. 4
economics, p. 4
goods, p. 5
services, p. 5
consumer, p. 5
producer, p. 5
factors ofproduction, p. 8
land, p. 8
labor, p. 8
capital, p. 8
entrepreneurship,p. 9
What Is Scarcity?
KEY CONCEPTS
Have you ever felt you wanted a new cell phone, a car, a new pair of running shoes,or the latest MP3 play er? You are not alone. Consumers have many economic wants.Wants are desires that can be satisfied by consuming a good or service. When mak-ing purchases, people often make a distinction between the things they need andthe things they want. Some things that people desire, like a house or an apartment,are more important than other things, like a flat-screen television. Needs are things,such as food, clothing, and shelter, that are necessary for survival.
People always want more, no matter how much they have already. In fact, wantsare unlimited, but the resources available to satisfy them are limited. The resultof this difference is scarcity, the situation that exists when there are not enoughresources to meet human wants. Scarcity is not a temporary shortage of some desiredthing. Rather, it is a fundamental and ongoing tension that confronts individuals,businesses, governments, and societies. Indeed, it is so basic to human experiencethat a social science has developed to understand and explain it. That social scienceis economics, the study of how people choose to use scarce resources to satisfy theirwants. Economics involves
1. examining how individuals, businesses, governments, and societies choose touse scarce resources to satisfy their wants
2. organizing, analyzing, and interpreting data about those economic behaviors3. developing theories and economic laws that explain how the economy works
and to predict what might happen in the future.
Wants are desiresthat can be satisfied byconsuming a good or aservice.
Needs are things thatare necessary for survival.
Scarcity exists whenthere are not enoughresources to satisfyhuman wants.
Economics is the studyof how individuals andsocieties satisfy theirunlimited wants withlimited resources.
QUICK REFERENCE
OBJECT IVES KEY TERMS TAKING NOTES
Scarcity
Find an update aboutcomputer ownershipin the United States atClassZone.com
5The Economic Way of Thinking
PRINCIPLE 1 People Have Wants
Choice is central to the use of scarce resources. People make choices about all thethings they desire—both needs and wants. You might think of food as a need,because it is necessary for your survival. Nevertheless, you make choices about food.What do you want for dinner tonight? Will you cook a gourmet creation or heat upa frozen dinner? Or will you treat yourself to a meal at your favorite restaurant? Youmake choices about other needs too. For example, consider the choices you makeabout the clothes you wear.
Wants are not only unlimited, they also are ever changing. Twenty-five yearsago, for example, few Americans owned a personal computer. Today, however, fewAmericans can imagine life without computers and computer-related technology.
PRINCIPLE 2 Scarcity Affects Everyone
Because wants are unlimited and resources are scarce, choices have to be madeabout how best to use these resources. Scarcity, then, affects which goods are madeand which services are provided. Goods are physical objects that can be purchased,such as food, clothing, and furniture. Services are work that one person performsfor another for payment. Services include the work of sales clerks, technical supportrepresentatives, teachers, nurses, doctors, and lawyers. Scarcity affects the choices ofboth the consumer, a person who buys goods or services for personal use, and theproducer, a person who makes goods or provides services.
APPLICATION Applying Economic Concepts
A. Identify five wants that you have right now. Describe how scarcity affects your effortsto meet these wants.
Goods are objects, suchas food, clothing, andfurniture, that can bebought.
Services are workthat one person doesfor another.
A consumer is a personwho buys or uses goodsor services.
A producer is a makerof goods or a providerof services.
QUICK REFERENCE
Shortages and Scarcity Shortages often are temporary. Movie tickets may be in short supply today, but ina few days’ time they may be easy to come by. Scarcity, however, never ends because wants always exceed theresources available to satisfy them.
6 Chapter 1
Scarcity Leads to ThreeEconomic Questions
KEY CONCEPTS
If you have ever had to decide whether something you want is worth the money,then you have experienced scarcity firsthand. Scarcity in the lives of individual con-sumers—the gap between their unlimited wants and limited resources—is all tooeasy to understand. Scarcity, however, also confronts producers and whole societies.Indeed, scarcity requires every society to address three basic economic questions:What will be produced? How will it be produced? For whom will it be produced?
QUESTION 1 What Will Be Produced?
To answer the first fundamental eco-nomic question, a society must decidethe mix of goods and services it willproduce. Will it produce mainly food,or will it also produce automobiles,televisions, computers, furniture,and shoes? The goods and services asociety chooses to produce depend, inpart, on the natural resources it pos-sesses. For example, a country thatdoes not possess oil is unlikelyto choose to produce petroleumproducts. Resources, however,do not completely control whata country produces. Japan doesnot possess large amounts ofthe iron ore needed to makesteel. Yet Japan is a leading pro-ducer of automobiles, whoseconstruction requires a greatdeal of steel.
Some countries, including the United States, resolve the issue of what goodsand services to produce by allowing producers and consumers to decide. For exam-ple, if consumers want cars with automatic transmissions, automobile companieswould be unwise to make only cars that have manual transmissions. In other coun-tries—Cuba and North Korea, for example—the consumer plays little or no part inanswering this question. Rather, the government decides what goods and serviceswill be produced.
This first fundamental economic question involves not only what to produce,but also how much to produce. To answer this, societies must review what theirwants are at any time. A country at war, for example, will choose to produce moreweapons than it would during peacetime.
What to Produce? The availability of natural resources, suchas gold, influences what the country of South Africa produces.
Some Leading Products
China South Africa United States
CoalMachineryRiceSteelTextiles
ChemicalsCoalGoldMetal oresMetal products
AutomobilesCoalTextilesTimberWheat
7The Economic Way of Thinking
QUESTION 2 How Will It Be Produced?
Once a society has decided what it will produce, it must then decide how thesegoods and services will be produced. Answering this second question involves usingscarce resources in the most efficient way to satisfy society’s wants. Again, deci-sions on methods of production are influenced, in part, by the natural resources asociety possesses.
In deciding how to grow crops, for example, societies adopt different approaches.Societies with a large, relatively unskilled labor force might adopt labor-intensivefarming methods. For this society, using many workers and few machines is the mostefficient way to farm. The United States, however, has a highly skilled work force.So, using labor-intensive methods would be an inefficient use of labor resources.Therefore, the United States takes a capital-intensive approach to farming. In otherwords, it uses lots of machinery and few workers.
QUESTION 3 For Whom Will It Be Produced?
The third fundamental economic question involves how goods and services are dis-tributed among people in society. This actually involves two questions. Exactly howmuch should people get and how should their share be delivered to them?
Should everyone get an equal share of the goods and services? Or should a per-son’s share be determined by how much he or she is willing to pay? Once the ques-tion of how much has been decided, societies must then decide exactly how theyare going to get these goods and services to people. To do this, societies developdistribution systems, which include road and rail systems, seaports, airports, trucks,trains, ships, airplanes, computer networks—anything that helps move goods andservices from producers to consumers in an efficient manner.
APPLICATION Analyzing Cause and Effect
B. Why does the basic problem of scarcity lead societies to ask the three fundamentaleconomic questions?
How to Produce For some societies, using a large amount of human labor is the most efficient way toproduce food (left). For other societies, using a lot of machinery is a more efficient method of production (right).
8 Chapter 1
The Factors of Production
KEY CONCEPTS
To understand how societies answer the first two basic questions—what to produceand how to produce it—economists have identified the factors of production, or theeconomic resources needed to produce goods and services. They divide the factorsof production into four broad categories: land, labor, capital, and entrepreneurship.All of these factors have one thing in common—their supply is limited.
FACTOR 1 Land
In everyday terms, the word land usually refers to a stretch of ground on the earth’ssurface. In economic terms, however, land includes all the natural resources foundon or under the ground that are used to produce goods and services. Water, forests,and all kinds of wildlife belong in the category of land. So, too, do buried depositsof minerals, gas, and oil.
FACTOR 2 Labor
The word labor usually brings to mind images of hard physical work. In economicterms, however, its meaning is far broader. Labor is all the human time, effort, andtalent that go into the making of products. Labor, then, is not only the work done bygarbage collectors, factory workers, and construction workers. It also includes thework of architects, teachers, doctors, sales clerks, and government officials.
FACTOR 3 Capital
When you hear the word capital, you probably think of money. In economic terms,however, capital is all the resources made and used by people to produce and distrib-ute goods and services. Tools, machinery, and factories are all forms of capital. Soare offices, warehouses, stores, roads, and airplanes. In other words, capital is all ofa producer’s physical resources. For this reason capital is sometimes called physicalcapital, or real capital.
While businesses invest in real capital, workers invest in human capital—theknowledge and skills gained through experience. Human capital includes such thingsas a college degree orgood job training. Whenworkers possess morehuman capital, they aremore productive.
Factors of productionare the resources neededto produce goods andservices.
Land refers to all naturalresources used to producegoods and services.
Labor is all of the humaneffort used to producegoods and services.
Capital is all of theresources made and usedby people to producegoods and services.
QUICK REFERENCE
Human Capital Educationincreases your human capitaland makes you more productivein the workplace.
9The Economic Way of Thinking
FACTOR 4 Entrepreneurship
The fourth factor of production, entrepreneurship, brings the other three factorstogether. Entrepreneurship is the combination of vision, skill, ingenuity, and will-ingness to take risks that is needed to create and run new businesses. Most entrepre-neurs are innovators. They try to anticipate the wants of consumers and then satisfythese wants in new ways. This may involve developing a new product, method ofproduction, or way of marketing or distributing products. Entrepreneurs are alsorisk takers. They risk their time, energy, creativity, and money in the hope of makinga profit. The entrepreneurs who build a massive shopping mall or who open a newhealth club do so because they think they could profit from these business ventures.The risk they take is that these enterprises might fail.
APPLICATION Applying Economic Concepts
C. Think of a product that you recently purchased. How do you think the four factors ofproduction were used to create this product?
Land All the naturalresources foundon or under theground that are usedto produce goodsand services areconsidered land.
F I G U R E 1.1 Factors of Production
ECONOMICS ESSENTIALS
ANALYZE CHARTSTwo new businesses have opened in your neighborhood—a coffee bar called Lou’s Café and ahealth club called BodyPower. Construct your own Economics Essentials diagram to show how thefour factors of production are used in one of these businesses.
Labor All the humantime, effort, andtalent that go intothe production ofgoods and servicesare considered labor.
Entrepreneurship The combination ofvision, skill, ingenuity, and willingnessto take risks that is needed to createand run new businesses is calledentrepreneurship.
Whatare the
Factors ofProduction?
Capital All the physical resources made andused by people to produce and distributegoods and services are considered capital.So, too, are the knowledge and skills thatmake workers more productive.
Entrepreneurshipinvolves the vision, skills,and risk-taking needed tocreate and run businesses.
QUICK REFERENCE
ECONOMICSSKILLBUILDER
For more on cause and effect, see the SkillbuilderHandbook, page R20.
EFFECT/CAUSE:increased
shipping costs
CAUSE:war in Iraq
CAUSE:unrest inNigeria
CAUSE:continuedMideastturmoil
EFFECT:decrease in
use of planes
EFFECT:increased use
of double-stacking
railroad cars
EFFECT/CAUSE:crude oil
availabilityreduced
EFFECT/CAUSE:higher energy
prices
10 Chapter 1
Analyzing Cause and EffectCauses are the events that explain why something happens and effects are whathappens. An effect can become the cause of other effects, resulting in a chain ofevents or conditions. Identifying causes and effects helps economists understandhow economic conditions occur. Use the strategies below to help you identifycauses and effects using a graphic organizer.
THINKING ECONOMICALLY Analyzing Causes and Effects
Locate and read an economics-related article in a current affairs magazine, such asTime, Newsweek, or U.S. News & World Report. Make a diagram to summarize thecauses and effects discussed in the article.
Identify causes byusing the word why toformulate questionsabout the topic of thepassage. Example: Whydid oil become morescarce in 2003? Why didthis situation continue?The answers you find willbe the causes.
Turmoil Reduces Oil SupplyOil is a scarce resource, but events in the Middle East havemade it more so. The invasion of Iraq in 2003 by U.S.- andBritish-led coalition forces led to an almost immediate shut-down of Iraq’s oil exports, thereby reducing the availabilityof crude oil by some 1.8. million barrels per day. Unrest inNigeria, Africa’s largest oil producer, further added to globalscarcity. More than two years later, in part due to continuedunrest in the Middle East, oil production was still sluggish.One result of the continued scarcity was a rise in energy prices.Increased energy prices in turn caused shipping costs to rise.The increased costs of shipping led shippers to seek more eco-nomical means of transport. Some shippers have decreasedtheir use of planes and trucks. Instead, they have turned toless fuel-dependent modes of transport. One example is theuse of double stacked railroad cars that can carry two shippingcontainers stacked one on top of the other.
Identify effectsby looking for results orconsequences. Theseare sometimes indicatedby words such as led to,brought about, thereby,and as a result.
Look for cause-effect chains,where an effect may bethe cause of anotherevent and so on.
Diagram the causes andeffects in a flowchart likethis one.
ClassZone.com
11The Economic Way of Thinking
1. Explain the relationship between the terms in each of these pairs:
a. wantsscarcity
c. factors of productionentrepreneurship
b. consumerproducer
2. What is the difference between needs and wants? Explain how aneed may also be a want.
3. How does scarcity affect consumers? Producers?
4. What services that individuals or businesses provide do you useevery day?
5. Describe how the owners of a computer repair store might use thefour factors of production to run their business.
6. Using Your Notes How doesscarcity affect methods ofproduction? Refer to yourcompleted cluster diagram.
Use the Graphic Organizer at Interactive Review @ ClassZone.com
7. Drawing Conclusions Many high schools throughout theUnited States have faced a serious shortage of math and scienceteachers. Many prospective teachers choose to go into businessand industry because of higher salaries. In some communities,businesses are “loaning” employees who want to teach part-timeto schools to fill the math and science teacher gap. Does thisscenario illustrate scarcity? Why or why not?
8. Applying Economic Concepts Consider the followingentrepreneurs: Lucy, who runs an organic farm, and Ron, a sportssuperstar who owns several restaurants. Describe how they mayhave used entrepreneurship to establish and run their businesses.
9. Writing About Economics Select a 10-minute period of time inyour day-to-day life—when you are in the cafeteria at lunchtime,for example. Analyze how scarcity affects your activities duringthis time period. Write your analysis in a paragraph.
10. Challenge At one time or another, you have probably madea choice about how to use your scarce resources that youlater regretted. For example, you may have purchased a musicdownload instead of going to the movies. What led you to yourchoice? What did you learn later that might have led you to adifferent choice?
C RIT IC AL THINKING
Using Scarce ResourcesSuppose you are moving into yourfirst apartment like the young womanabove. You have saved $1,200 touse for this purpose. When you goshopping, you learn that these arethe prices for things you had on yourlist of furnishings.
Make Economic Choices Use theseprices to decide how you will spendyour budget for furnishings. Make alist of the things you will buy.
Challenge What did you have togive up to get the things you chose?Why did you decide to give thosethings up?
Item Price ($)
Kitchen table and chairs 200
TV set 150
Dishes 45
Silverware 25
Towels 35
Couch 300
Desk & chair 175
Bed 350
Computer 400
Stereo system 300
ECONOMICS IN PR ACTICE
SECTION 1 AssessmentREVIEWING KEY CONC EP TS
Scarcity
2SECT ION
12 Chapter 1
OBJECT IVES KEY TERMS TAKING NOTES
Economic Choice Today:Opportunity Cost
As you read Section 2, completea cluster diagram to help yousee how the key concepts relateto one another. Use the GraphicOrganizer at Interactive Review@ ClassZone.com
In Section 2, you will
• understand why choice is atthe heart of economics
• explain how incentives andutility influence people’seconomic choices
• consider the role of trade-offs and opportunity costs inmaking economic choices
• demonstrate how to do a cost-benefit analysis
incentives, p. 12
utility, p. 12
economize, p. 12
trade-off, p. 14
opportunity cost, p. 14
cost-benefit analysis, p. 15
marginal cost, p. 16
marginal benefit, p. 16
Making Choices
KEY CONCEPTS
As you recall from Section 1, scar-city forces everyone to choose. Butwhat shapes the economic choicesthat people make? One fac-tor involves incentives, orbenefits offered to encour-age people to act in certain ways.Grades in school, wages paid to work-ers, and praise or recognition earnedin personal and public life are allincentives. Choice is also influencedby utility, or the benefit or satisfactiongained from the use of a good or service.When they economize, people considerboth incentives and utility. In commonusage, the word economize means to“cut costs” or “do something cheaply.”In strict economic terms, however,economize means to “make decisionsaccording to what you believe is the bestcombination of costs and benefits.”
Incentives The chance ofwinning a championship trophyserves as an incentive for athletesto train and play hard.
Incentives are methodsused to encourage peopleto take certain actions.
Utility is the benefit orsatisfaction received fromusing a good or service.
To economize means tomake decisions accordingto the best combinationof costs and benefits.
QUICK REFERENCE
EconomicChoice
YOUR ECONOMIC CHOICES
?
13The Economic Way of Thinking
FACTOR 1 Motivations for Choice
Choice powers an economy, but what powers choice? The choices people makeare shaped by incentives, by expected utility, and by the desire to economize. Forexample, look at Your Economic Choices above. How will you decide between thetwo options? Like other economic decision makers, you weigh the costs against thebenefits, and you make your choice purposefully. Perhaps you decide to go out todinner. Even though you’ll spend more money, you feel that the tips your friend cangive you on writing your college application essay are invaluable. You’ve economizedby choosing what represents the best mix of costs and benefits.
In making this decision, you were guided by self-interest. This does not meanthat you behaved selfishly. Rather, it simply means that you looked for ways to maxi-mize the utility you’d get from spending time with your friend.
FACTOR 2 No Free Lunch
An old saying can sum up the issue of choice in economics: “There is no such thingas a free lunch.” Every choice involves costs. These costs can take the form of money,time, or some other thing you value. Let’s revisit your choices. If you chose to goto dinner rather than to a movie, you gained the benefit of a satisfying, informa-tive, and beneficial conversation with a friend. Even so, you also paid a cost—youdidn’t see the movie. On the other hand, if you chose to go to the movie, you gainedthe benefit of an entertaining evening and having more money to save or spend onsomething else. Once again, however, your choice involved a cost. You sacrificed thetime you could have spent getting advice and guidance on the college applicationprocess from your friend.
APPLICATION Using a Decision-Making Process
A. You have enough money to buy either an MP3 player that is on sale or some fitnessequipment you want. What incentives and utility would guide your decision?
MAKING CHOICES
How will you spend time with a friend?You and a friend have the choice of going to dinner or going to a movie. There is an incentivefor choosing the movies, since dinner would surely cost more. On the other hand, your friendhas offered to help you with college applications. So dining out, which allowstime for conversation, has more utility to you than seeing a movie.
Dinner
Movie
14 Chapter 1
Trade-Offs and Opportunity Cost
KEY CONCEPTS
Choices, as you have learned, always involve costs. For every choice you make, yougive up something. The alternative that you give up when you make an economicchoice is called a trade-off. Usually, trade-offs do not require all-or-nothing choices.Rather, they involve giving up some of one thing to gain more of another.
EXAMPLE 1 Making Trade-Offs
To understand how trade-offs work,let’s take a look at decisions madeby Shanti, who has just finished herjunior year in high school. Shantiwants to go to summer school toearn some credits she can apply tocollege. She could take a semes-ter-long course at a local univer-sity, or she could take an intensivesix-week course at her high school.She decides on the six-week course,even though she’ll earn fewer cred-its. However, she will have severalweeks of the summer vacation tohave fun and relax.
EXAMPLE 2 Counting the Opportunity Cost
Shanti’s friend Dan, who has just graduated, has decided to take off a year beforegoing to college. He’s been offered a full-time job for the whole year. However, hedecides to take the job for six months and then spend time traveling.
Dan’s choice, like all economic choices, involves an opportunity cost. Theopportunity cost of a decision is the value of the next-best alternative, or what yougive up by choosing one alternative over another. Dan decided to travel around thecountry and visit friends. The opportunity cost of that decision is the income hecould have earned at his job. If, however, Dan had decided to work for the wholeyear, his opportunity cost would have been the trip around the country that hedidn’t take. Note that Dan’s opportunity cost is not the value of all the things hemight have done. Rather, it is the value of his next-best alternative, or what he gaveup to get what he most wanted.
APPLICATION Applying Economic Concepts
B. Look again at Shanti’s decision. What was the opportunity cost of her choice? If shehad chosen the semester course, what would her opportunity cost have been?
A trade-off is thealternative people give upwhen they make choices.
QUICK REFERENCE
Trade-Offs All the decisions you make, includingselecting school or college courses, involve choosingamong alternatives.
Opportunity cost is thevalue of something that isgiven up to get somethingelse that is wanted.
QUICK REFERENCE
15The Economic Way of Thinking
Analyzing Choices
KEY CONCEPTS
Shanti and Dan did not make their choices randomly. Rather, they carefully lookedat the benefits they would gain and the opportunity costs they would incur fromtheir decisions. This practice of examining the costs and the expected benefits ofa choice as an aid to decision making is called cost-benefit analysis. Cost-benefitanalysis is one of the most useful tools for individuals, businesses, and governmentswhen they need to evaluate the relative worth of economic choices.
EXAMPLE Max’s Decision-Making Grid
Perhaps the simplest application of cost-benefit analysis is the decision-making grid,which shows what you get and what you give up when you make choices. Look atMax’s decision-making grid in Figure 1.2 below. Max has to decide how to spend hisscarce time—studying for his government class or going out with his friends. Maxlikes nothing better than to spend hours talking with his friends at the local juicebar. However, the F he has in the government class at the moment will not look goodon his transcript. So he certainly could benefit from some extra study time.
Max knows that he has six hours available for extra study or socializing eachweek. He begins to build his decision-making grid by listing all the options he hasfor using these six hours. He then lists the benefits and opportunity costs of each ofthese options. After reviewing all of this information, he chooses three extra hoursof study a week. He feels that the opportunity cost, three hours of time with hisfriends, is worth the expected benefit, a B grade.
Cost-benefit analysisis an approach that weighsthe benefits of an actionagainst its costs.
QUICK REFERENCE
Choice Benefit Opportunity Cost
One hour of extra study D in government class One hour with friends
Two hours of extra study C in government class Two hours with friends
Three hours of extra study B in government class Three hours with friends
Four hours of extra study B� in government class Four hours with friends
Five hours of extra study A� in government class Five hours with friends
Six hours of extra study A in government class Six hours with friends
A decision-making grid helps you to see what you gain and what you lose whenyou make choices. Max’s decision-making grid shows the costs and benefits ofhours spent studying versus time spent socializing.
F I G U R E 1. 2 Max’s Decision-Making Grid
ANALYZE TABLES
1. What is Max’s opportunity cost of three extra hours of study?
2. Read the information about marginal costs on the next page. What is Max’s marginalcost of moving from a grade of B� to a grade of A�?
YOUR ECONOMIC CHOICES
?
16 Chapter 1
Costs and benefits change over time. So do goals and circumstances. Suchchanges will influence the decisions people make. For instance, Max learns thatPine Tree State, the college he wants to attend, only considers applicants with a 3.4or better grade point average. If he needs to get a B+ or better to raise his GPA to 3.4,he might decide to spend less time with his friends and study four or five hours perweek rather than three.
EXAMPLE Marginal Costs and Benefits
How did Max arrive at his decision? To explain it, economists would look at mar-ginal costs and marginal benefits. Marginal cost is the cost of using one more unit ofa good or service, while marginal benefit refers to the benefit or satisfaction receivedfrom using one more unit of a good or service. Max’s choice was to study three extrahours, which gave him a B grade at the opportunity cost of three hours with hisfriends. Look again at Max’s decision-making grid in Figure 1.2. What would be themarginal cost of one more hour of study? As you can see, it is the loss of one morehour with his friends. The marginal benefit of that extra hour would be an improve-ment in grade from B to B+. Max decided that the benefit of a slight improvement inhis grade was not worth the cost of one less hour with his friends.
The analysis of marginal costs and marginal benefits is central to the study ofeconomics. It helps to explain the decisions consumers, producers, and governmentsmake as they try to meet their unlimited wants with limited resources.
Marginal cost is theadditional cost of usingone more unit of a product.
Marginal benefit is theadditional satisfaction fromusing one more unit of aproduct.
QUICK REFERENCE
Basketball practice
MARGINAL BENEFITS AND COSTS
Which will you do—basketball practice or after-school job?For every hour you practice basketball, yougain in skill and increase your chances ofmaking the team. However, each hour youpractice is an hour you could have spentworking at an after-school job to save for acar or college or something else you want.
Part-time job
APPLICATION Using a Decision-Making Process
C. Look at Your Economic Choices above. Construct a decision-making grid that analyzesthe potential choices of attending basketball practice and working at an after-schooljob. Which option would you choose?
ClassZone.com
C RIT IC AL THINKING
17The Economic Way of Thinking
Making ChoicesSome of the incentives that spur peopleto action are money, recognition,self-esteem, good grades, immediatebenefit, future benefit, and altruism(doing good for others, such asworking for Habitat for Humanity).
Consider Economic Choices Copyand complete the chart by noting theincentives that might motivate peopleto take the listed actions. (Severalincentives might apply in some cases.)
Challenge Have you ever had twoor more conflicting incentives for acertain behavior? If so, how wouldyou choose among them? If not,which of the incentives abovemotivates you most often?
Action Incentive
Donate to charity.
Get a promotion.
Buy a friend apresent.
Attend a goodcollege.
Buy organic foods.
Buy inexpensiveimported goods.
ECONOMICS IN PR ACTICE
SECTION 2 Assessment
1. Explain the relationship between the terms in each of these pairs:
2. Two action movies are playing at your movie-theater complex. Youhave a half-price coupon for one. However, you choose to see theother. How might this still be an example of economizing?
3. Think of some of the options you have for spending time afterschool—sports practice, hobby clubs, work, or extra study, forexample. Which option would you choose? What is the opportunitycost of your choice?
4. How is a decision-making grid an example of cost-benefit analysis?
5. Use the concepts of marginal costs and marginal benefits to explainwhy some people might see the same movie ten times while otherswill watch it only once or twice.
6. Using Your Notes How do marginal costsand benefits relate to trade-offs? Refer toyour completed cluster diagram. Use theGraphic Organizer at Interactive Review @ ClassZone.com
7. Applying Economic Concepts A Web site reviewing new CDsoffers you a free subscription. All you have to do is completea brief online application. What is the opportunity cost of this“free” offer? Why do you think the offer is being made?
8. Evaluating Economic Decisions Explain how self-interest ispart of each economic choice. Use an example from your ownexperience that shows how you purposely served your own self-interest in a choice you made.
9. Conducting Marginal Cost–Marginal Benefit Analysis Youare on a limited budget and planning a four-day camping trip toa national park. Bus fare is $75 each way and the ride takes 12hours. Plane fare is $150 each way and the ride takes an hour anda half. Conduct a cost-benefit analysis to help you choose yourmethod of travel.
10. Challenge Why are all choices economic choices? Illustrate youranswer with examples.
REVIEWING KEY CONC EP TS
a. incentiveutility
b. trade-offopportunity cost
c. marginal costmarginal benefit
EconomicChoice
3SECT ION
18 Chapter 1
OBJECT IVES KEY TERMS TAKING NOTES
As you read Section 4, completea summary chart to identifythe most important points onproduction possibilities. Use theGraphic Organizer at InteractiveReview @ ClassZone.com
In Section 3, you will
• describe what a productionpossibilities curve is and how itis constructed
• explain what economistslearn from using productionpossibilities curves
• analyze how productionpossibilities curves showeconomic growth
economic model, p. 18
production possibilities curve(PPC), p. 18
efficiency, p. 20
underutilization, p. 20
law of increasing opportunitycosts, p. 21
Graphing the Possibilities
KEY CONCEPTS
In Section 2 you learned that all economic choices involve trade-offs. Economists havecreated economic models—simplified representations of complex economic activities,systems, or problems—to clarify trade-offs. One such model is a production possibilities
curve (PPC), a graph used to illustrate the impact of scarcity on an economy by showing themaximum number of goods or services that can be produced using limited resources.
Like all other economic models, the PPC is based on assumptions that simplifythe economic interactions. For the PPC these assumptions are:
1. Resources are fixed. There is no way to increase the availability of land, labor,capital, and entrepreneurship.
2. All resources are fully employed. There is no waste of any of the factors of pro-duction. In other words, the economy is running at full production.
3. Only two things can be produced. This assumption simplifies the situation andsuits the graphic format, with one variable on each axis.
4. Technology is fixed. There are no technological breakthroughs to improvemethods of production.
Since the curve on a PPC represents the border—or frontier—between what it ispossible to produce and what it is not possible to produce, this model is sometimescalled a production possibilities frontier. It is a useful tool for businesses and evengovernments, but it works just as well with individual, small-scale economic deci-sions. For example, suppose you are preparing food for a soup kitchen and have theingredients to make 12 loaves of whole wheat bread or 100 bran muffins or somecombination of the two. A PPC can help you decide what to make.
Analyzing ProductionPossibilities
An economicmodel is a simplifiedrepresentation ofeconomic forces.
The productionpossibilities curve(PPC) is a graph used byeconomists to show theimpact of scarcity on aneconomy.
QUICK REFERENCE
Analyzing Production Possibilities
PPC shows impact ofscarcity
0
2
4
6
8
10
12
10 20 30 5040 60 70 80 90 100
Loav
es o
f b
read
Bran muffins
FIGURE 1.3 PRODUCTION POSSIBILITIESTABLE: BREAD VS. MUFFINS
FIGURE 1.4 PRODUCTION POSSIBILITIESCURVE: BREAD VS. MUFFINS
19The Economic Way of Thinking
Production Possibilities Curve
The production possibilities table in Figure 1.3below shows five production possibilities forloaves of bread and bran muffins. These pro-duction possibilities run from the two extremesof all bread or all muffins through several com-binations of the two products. The data in thetable also can be plotted on a graph, as in Fig-ure 1.4. The line joining the plotted points is theproduction possibilities curve. Each point onthe curve represents the maximum number ofloaves of bread that can be produced relative tothe number of bran muffins that are produced.
Further, the PPC shows the opportunity costof each choice in a visual way. Trace the curvefrom left to right with your finger. Notice that asyou move along the curve you make fewer loavesof bread and more muffins. The opportunitycost of making more muffins is the bread thatcannot be made.
APPLICATION Interpreting Graphs
A. Look at the production possibilities curve in Figure 1.4. What is the opportunity cost ofincreasing bread production from four loaves to seven loaves?
Production Possibilities A production possibilities curve canshow all the possible combinations for producing muffins and bread.
ANALYZE GRAPHS1. If you decided to make ten loaves of bread, how
many bran muffins could you make?
2. What is the opportunity cost of making the tenloaves of bread?
a Here you are using allthe ingredients to makeonly bread.
b This point shows a com-bination of 7 loaves ofbread and 63 muffins.The opportunity cost ofmaking the 7 loaves is37 muffins (100 – 63).
c At this point, you aremaking all muffins andno bread.
Use an interactive productionpossibilities curve at ClassZone.com
b
Loaves of Bread Bran Muffins
12 0
10 35
7 63
4 84
0 100
b
a
cc
a
0
50
100
150
200
250
300
50 100 150 200 250 300 350
Butter (in millions of pounds)
Gu
ns
(in
mill
ion
s)
FIGURE 1.5 PPC: GUNS VS. BUTTER
20 Chapter 1
What We Learn from PPCs
KEY CONCEPTS
No economy actually operates according to the simplified assumptions underlyingthe PPC. However, economists use the simplified model because it spotlights con-cepts that work in the real world of scarce resources.
One important concept revealed in a PPC is efficiency, the condition in which eco-nomic resources are being used to produce the maximum amount of goods and services.Another is underutilization, the condition in which economic resources are not beingused to their full potential. As a result, fewer goods and services are being produced thanthe economy is capable of making. Both of these conditions are easy to see in the PPC.
EXAMPLE Efficiency and Underutilization
Figure 1.5 shows the classic production possibilities model of guns vs. butter. In thismodel, “guns” is shorthand for military spending and “butter” represents consumerproducts. Every point along this PPC shows a different combination of military andconsumer production. Regardless of the combination, each point represents effi-ciency, the most that can be produced with the available resources.
Any point inside the curve represents underutilization, or the inefficient use of avail-able resources. Look again at Figure 1.5 and notice that point 3 indicates that all resourcesare not fully employed. The PPC shows that the economy is capable of producing either47 million more guns (point 1 on the curve) or 30 million more pounds of butter (point
Efficiency involvesproducing the maximumamount of goods andservices possible.
Underutilization meansproducing fewer goods andservices than possible.
QUICK REFERENCE
ANALYZE GRAPHS1. What is the opportunity cost of moving
butter production from 1 to 2?
2. At 3, factors of production are notbeing used efficiently. Identify asituation where this might occur.
a Any point along thecurve—1, 2, or 5—repre-sents efficiency.
b Point 3 inside the curverepresents underutiliza-tion. Some or all of thefactors are not beingused efficiently.
c Point 4, outside the curve,represents a productionimpossibility. Regardless ofhow the available factorsof production are used,this level of productioncannot be reached.
b
a c4
5
1
3 2
Use an interactive productionpossibilities curve at ClassZone.com
2 on the curve). Any point outside the curve is impossible to meet because resources arefixed. To produce the number of guns indicated at point 4, fewer pounds of butter wouldhave to be made (point 1 on the curve). Similarly, to produce the amount of butter indi-cated at point 4, fewer guns would have to be made (point 2 on the curve).
The shape of the PPC shows a third important economic concept. This is thelaw of increasing opportunity costs, which states that as production switches fromone product to another, increasingly more resources are needed to increase theproduction of the second product, which causes opportunity costs to rise.
EXAMPLE Increasing Opportunity Costs
Return again to Figure 1.5. A nation makes 250 million pounds of butter (point 1on the curve), but wants to make 280 million pounds (point 2 on the curve). Theopportunity cost of making the extra 30 million pounds of butter is 37 million guns.That works out to a cost of about 1.2 guns for every pound of butter. If the nationincreases its output of butter to 312 million pounds (point 5 on the curve), the op-portunity cost of the change would be 63 millions guns, nearly 2 guns for everypound of butter. This increase in the opportunity cost—each additional unit costsmore to make than the last—explains why the curve is bow-shaped.
The reason for the increasing costs is fairly straightforward. Making butter in-volves different resources than making guns. Converting from gun production tobutter production is not a simple procedure. New machinery must be produced, newfactories must be built, and workers must be retrained. The cost of all these actionswill be fewer and fewer guns.
APPLICATION Writing about Economics
B. Write a brief paragraph explaining the concepts a PPC shows graphically.
The law of increasingopportunity costsstates that as productionswitches from one productto another, increasingamounts of resources areneeded to increase theproduction of the secondproduct.
QUICK REFERENCE
Opportunity Cost Inthe guns vs. butterequation, if more resourcesare used to make militaryproducts, such as stealthbombers, there are fewerresources available for otherthings, such as butter andother consumer goods. Theopportunity cost of makingmore military products isthe other products thatcannot be made.
0
50
100
150
200
250
300
50 100 150 200 250 300 350
Butter (in millions of pounds)
Gu
ns
(in
mill
ion
s)
FIGURE 1.6 SHIFT IN THE PPC
PPC1
PPC2
22 Chapter 1
Changing Production Possibilities
The PPC illustrates a country’s present production possibilities as if all resourcesare fixed. However, a country’s supply of resources is likely to change over time.When additional resources become available, new production possibilities beyondthe original frontier become attainable, and the PPC moves outward.
EXAMPLE A Shift in the PPC
In the late 1700s, the United States occupied a relatively narrow strip of land alongthe Atlantic Coast. Yet in less than a hundred years, it had expanded to the PacificOcean. This additional land provided the United States with an abundance of natu-ral resources. Similarly, successive waves of immigration have added huge numbersof workers to the labor pool. Also, new technology has made the use of land, labor,and capital more efficient.
The addition of new resources or the more efficient use of resources alreadyavailable meant that the United States could produce more goods and services. Thisis shown on the PPC as a shift of the curve outward, or to the right, as Figure 1.6illustrates. Economists refer to this increase in the economy’s total output as eco-nomic growth. You’ll learn more about this concept in Chapter 12.
ANALYZE GRAPHS1. If the curve PPC2 represents current
production possibilities, what doespoint 1 represent?
2. What might cause the PPC to shiftinward?
More resources or increasedproductivity shifts the PPCoutward, or to the right,from PPC1 to PPC2. Thismeans that the economy canproduce more of both gunsand butter and point 4, whichwas a production impossibilityin Figure 1.5 on page 20, nowis located on the curve.
14
APPLICATION Applying Economic Concepts
C. Identify three developments that would cause the PPC to move outward.
Use an interactive productionpossibilities curve at ClassZone.com
ClassZone.com
23The Economic Way of Thinking
2. On what assumptions is the PPC based? Explain how these conditionsdo not correspond to the real world.
3. What economic data does a PPC bring together?
4. Why do opportunity costs increase as you make more and morebutter and fewer guns?
5. Based on what we learn from PPCs, what does an economy need tobe able to produce more of both products on the graph?
6. Using Your Notes Write a one-paragraph summary of this section.Refer to your completed summarychart for the ideas to use in yoursummary.
Use the Graphic Organizer atInteractive Review @ ClassZone.com
1. Explain how each of these terms is illustrated by the productionpossibilities curve.
a. underutilization b. efficiency
Creating a PPCThe following information reflectsthe production possibilities of aneconomy that makes only corn andtelevision sets. Use the data to createa production possibilities curve.
Label Points on a PPC Use theletters to locate the following pointson your PPC:
A The point at which the economymakes all TVs and no corn
B A point representing efficiencyC A point representing
underutilizationD A point representing an impossible
level of production
Challenge Use information fromyour PPC to explain the law ofincreasing opportunity costs.
Bushels of Corn(in thousands)
Television Sets(in thousands)
10 0
9 1
7 2
4 3
0 4
ECONOMICS IN PR ACTICE
SECTION 3 AssessmentREVIEWING KEY CONC EP TS
7. Applying Economic Concepts Explain why, in an economy thatproduces only fish and computers and is working at efficiency,the 500th computer made will cost more in terms of fish than the450th computer made.
8. Applying Economic Concepts Suppose the owners of a car-manufacturing company are thinking of entering the motorcycleproduction business. How would a PPC model help them make adecision?
9. Analyzing Cause and Effect If new technology was introducedbut there were not enough skilled workers to use it, where wouldthe nation’s production be plotted on the PPC—inside or outsidethe curve? Explain your answer.
10. Challenge During a war, a country suffers massive devastationof its industry. How would the country’s PPC change from beforethe war to after the war? Sketch a PPC to illustrate your answer.
C RIT IC AL THINKING
Analyzing Production Possibilities
PPC shows impact ofscarcity
Use @ClassZone.comto complete this activity.
4SECT ION
24 Chapter 1
As you read Section 4, completea chart to see similarities anddifferences between key concepts.Use the Graphic Organizer atInteractive Review @ ClassZone.com
In Section 4, you will
• demonstrate how and whyeconomists use economicmodels
• understand how and whyeconomists use statistics,charts, tables, and graphs
An old joke notes that economics is everything we already know expressed in alanguage we don’t understand. While many economists might disagree with thesecond part of this joke, they probably would have little argument with the firstpart. Economics is something that everybody engages in every day, and in that wayeveryone has knowledge of it. Individuals, business owners, and government officialsmake economic decisions all the time. Economists study these decisions and lookfor logical ways to explain why some nations are rich while others are poor, or whysome consumers want one kind of product while others want another.
Since economists can’t interview every person in every nation about economicchoices, they rely on statistics—numerical data or information—to see patterns ofbehavior. To help organize and interpret the data they collect, they develop economicmodels. As you recall from Section 3, an economic model is a simplified representa-tion of complex economic forces. The language of economists—these statistics andmodels—may sometimes be a little hard to understand. However, it is a more efficientway of explaining economic relationships and interactions than everyday language.
Using Economic Models
In science class, you may have seen a model of a lunar eclipse, which shows how,with the sun behind it, the earth casts a shadow on the moon. The model assumescertain laws of planetary orbit and simplifies the relationships among the objects inthe solar system. However, these assumptions and simplifications make the processof the eclipse quite clear.
Statistics are informa-tion in numerical form.
QUICK REFERENCE
The Economist’s ToolboxOBJECT IVES KEY TERMS TAKING NOTES
Concepts Similarities Differences
Charts & Tables vs.Graphs
Micro vs. Macro
Positive vs.Normative
The Economic Way of Thinking
FIGURE 1.7 DEVELOPMENT ASSISTANCE
Find an update on foreignaid at ClassZone.com
25
Economic models work in the same way. They are based on assumptions andare simplified because they focus on a limited number of variables. Economistscan express their models in words, graphs, or equations. Models help economistsexplain why things are as they are. In some cases, models can help economists topredict future economic activity. You’ve already learned how economists constructand use one important economic model—the production possibilities curve—inSection 3. You’ll learn about another, thecircular flow model, in Chapter 2.
Using Charts and Tables
Economists study statistics in a particularway, looking for trends, connections, andother interesting relationships. They haveseveral tools to help them with this task.Among the most common tools are chartsand tables, in which data are arranged anddisplayed in rows and columns. (See Figure 1.7 above.) By showing numbers in rela-tion to other numbers, charts and tables can reveal patterns in the data.
Suppose, for example, you were curious about how much money various devel-oped countries give to help developing countries. In Figure 1.7, if you looked at oneset of numbers, you would see that Luxembourg contributed $236 million, whileCanada gave more than ten times that, offering nearly $2.6 billion. Your immediateinterpretation of these data might be that Canada gives far more in foreign aid thanLuxembourg does. But looking at other sets of numbers might suggest a differentinterpretation. Luxembourg may have contributed far less than Canada in actualdollar amounts. However, the foreign aid Luxembourg gave represented close to 1percent of the value of all the goods and services the nation produced. Canada’scontribution, in contrast, was about 0.3 percent of its total economy. After studyingthese numbers, you might conclude that in relative terms Luxembourg gives morethan Canada in foreign aid.
Using Graphs
When economists are interested in identifying trends in statistics, they often usegraphs, or visual representations of numerical relationships. The most common typeis the line graph. Line graphs are particularly useful for showing changes over time.
Statistics Duringa debate in the U.S.Senate on the future ofSocial Security, SenatorCharles Grassley of Iowaillustrates a point usingstatistics in graph form.
Country Aid (in millions ofU.S. Dollars)
Percentage ofTotal Economy
Luxembourg 236 0.83
Canada 2,599 0.27
Source: Organization for Economic Co-operation and Development, 2004 Figures
TYPES OF GRAPHS
FIGURE 1.9 U.S. COMPUTER ANDINTERNET ACCESS
Computers Internet Access
0
10
20
30
40
50
6 0
70
20031998
Source: National Telecommunications and Information Administration
Perc
enta
ge
of
ho
use
ho
lds
Year
FIGURE 1.8 PCS PER 100 PEOPLE INDEVELOPING COUNTRIES
Nu
mb
er o
f PC
s p
er 1
00 p
eop
le
0.0
0.5
1.0
1.5
2.0
2.5
3.0
1995 1997 1996 1999 1998 2001 2000
Source: United Nations
FIGURE 1.10 INTERNET USERSBY REGION
1%5%
70%21%
Developing Countries: Africa
Developed Countries
Developing Countries: Asia and Oceania
Developing Countries: Americas
Developing Countries: Central and Eastern Europe
Source: United Nations, 2001 figures
Year
3%
26 Chapter 1
All line graphs use at least two sets of numbers, or variables: one plotted along thehorizontal axis, running from left to right, the other plotted along the vertical axis, run-ning from bottom to top. On the line graph in Figure 1.8 above, the range of time from1995 to 2001 is shown on the horizontal axis. The number of PCs (personal computers)per 100 people in developing countries is shown on the vertical axis.
The number of PCs for each year is plotted on the graph and then these pointsare joined to form a line. The line may slope upward, showing an upward trend, ordownward, showing a downward trend. The line may be straight, keeping the sameslope throughout, or it may be curved, having a varied slope. (In later chapters you’llsee that where graphs are used to illustrate economic concepts, lines are referred toas curves whether they are straight or curved.) How would you describe the trendshown in Figure 1.8?
A bar graph is especially useful for comparisons. The bar graph in Figure 1.9 aboveshows information on the percentage of households in the United States that have accessto computers and the Internet. The bars vividly illustrate that access to informationtechnology increased dramatically in the United States between 1998 and 2003.
A pie graph, often called a pie chart or circle graph, is especially good for repre-senting numbers in relation to a whole. Take a look at the pie graph in Figure 1.10above. The whole circle represents all the Internet users in the world. The slices of thepie, which represent regions of the world, are drawn in proportion to the percentageof the whole they constitute.
APPLICATION Interpreting Graphs
A. Look at the pie graph in Figure 1.10 above. Write a generalization based oninformation in the graph.
Throughout this book, youwill be asked to interpretand analyze informationin graphs. If you needhelp with these tasks, see“Interpreting Graphs.”
SkillbuilderHandbook, page R29
NEED HELP?
ANALYZE GRAPHS
Graphs show statistics in a visual form. Line graphs (Figure 1.8) areparticularly useful for showing changes over time. Bar graphs (Figure 1.9)make it easy to compare numbers or sets of numbers. Pie, or circle, graphs(Figure 1.10) show relationships among the parts of a whole.
Use a variety of interactive graphsat ClassZone.com
27The Economic Way of Thinking
Microeconomics and Macroeconomics
KEY CONCEPTS
For scientists, everything in the earth, air, and water—and beyond—is a sourceof data to be observed and studied. Yet the data often make little sense until theyare seen through the lens of a microscope or telescope. Economic information, aswith scientific data, takes on meaning when it is viewed through the most usefullens. Two of the lenses through which economists observe economic behavior aremicroeconomics and macroeconomics. Microeconomics is the study of the behaviorof individual players in an economy, such as individuals, families, and businesses.Macroeconomics is the study of the behavior of the economy as a whole and involvestopics such as inflation, unemployment, aggregate demand, and aggregate supply.
Microeconomics
As the prefix micro-, meaning small, would suggest, microeconomics examines spe-cific, individual elements in an economy. The elements include prices, costs, profits,competition, and the behavior of consumers and producers. Microeconomics canhelp you understand how the sandwich shop owner arrived at the price of the lunchyou bought today, why the neighborhood has several sandwich shops offering thesame kinds of food, and why some of these shops flourish while others fail. Micro-economics also can offer explanations for why students decide to work only on theweekends and not on school nights, why some families buy a used car rather thana new car, and why the mom-and-pop grocery store in your neighborhood closedafter the superstore opened nearby.
Within the field of microeconomics there are areasof specialized concentration. Business organization,labor markets, agricultural economics, and the eco-nomics of environmental issues are among the topicsthat microeconomists might study. You will study theissues of microeconomics in more depth starting inChapter 4.
Macroeconomics
Macroeconomics, as its prefix macro-, meaning large,would suggest, examines the economic “big picture.” Inother words, macroeconomics is the study of the econ-omy as a whole. While the limited spending power ofan unemployed person would be in the realm of micro-economics, the effect of widespread unemployment onthe whole nation would be a macroeconomic issue. Ina similar way, the rising price of coffee would interest amicroeconomist, but a general rise in prices, a sign thatthe whole economy is experiencing inflation, would bea matter for a macroeconomist.
Microeconomics isthe study of individuals,families, and businesses inan economy.
Macroeconomics is thestudy of the economy asa whole and is concernedwith large-scale economicactivity.
QUICK REFERENCE
Microeconomics vs. Macroeconomics Changes in coffeeprices might interest a microeconomist. A macroeconomist mightstudy general changes in prices.
28 Chapter 1
While microeconomics considers the individual consumer, macroeconomicsstudies the consumer sector, also called the household sector. A sector is a combinationof all the individual units into one larger whole. Macroeconomics also examines thebusiness sector, and the public, or government, sector—that part of the economy thatprovides public goods and services.
Macroeconomists bring a national or global perspective to their work. Theystudy the monetary system, the ups and downs of business cycles, and the impact ofnational tax policies on the economy. In addition, they look at such global issues asinternational trade and its effect on rich and poor nations. You will study macroeco-nomics in depth beginning in Chapter 10.
APPLICATION Categorizing Economic Information
B. Which does each of the news headlines relate to—microeconomics or macroeconomics?
1. National Unemployment Figures Rise 4. Cab Drivers on Strike!
The division between microeconomics and macroeconomics is not a fixed one. Some topics fall underboth areas of study. For example, a microeconomist might be interested in employment levels inthe hotel industry, while a macroeconomist looks at employment levels in the economy as a whole.Identify another topic area that might be of interest to both microeconomists and macroeconomists.
MicroeconomicsThe study of the individual consumer
Units of Study
• Consumer markets• Business markets• Labor markets
Topics of Interest
• Markets, prices, costs, profits,competition, government regulation
• Consumer behavior• Business behavior
MacroeconomicsThe study of the whole economy
Units of Study
• Economic growth• Economic stability• International trade
Topics of Interest
• Money, banking, finance• Government taxing and spending policies• Employment and unemployment• Inflation
Positive Economics andNormative Economics
KEY CONCEPTS
Economics also can be viewed through another pair of lenses. One of those lensesis positive economics, a way of describing and explaining economics as it is, not asit should be. Positive economics involves verifiable facts, not value judgments. Theother is normative economics, a way of describing and explaining what economicbehavior ought to be, not what it actually is. Normative economics does involvevalue judgments because it seeks to make recommendations for actions.
Positive Economics
Positive economics uses the scientific method to observe data, hypothesize, test,refine, and continue testing. Statements made within positive economics can be testedagainst real-world data and either proved (or at least strongly supported) or disproved(or at least strongly questioned). Suppose, for example, yourstate is debating the pros and cons of a lottery to raise money foreducation. In the framework of positive economics, researcherswould study data from states with lotteries to see if educationalspending increased after the lotteries were begun.
Normative Economics
Normative economics, in contrast, is based on value judg-ments. It goes beyond the facts to ask if actions are good.Since the values of people differ, so do the recommendationsbased on normative economics.
Consider the issue of using lottery money to fund edu-cation. Two economists might agree that the data show thatstate-run lotteries result in more money for schools, and thatmany lottery tickets are purchased by people who are poor.Their recommendations, however, might differ because theyhave different values. One economist might support a lot-tery because it increases funding for schools. The other mightoppose a lottery because it places a burden on the poor.
APPLICATION Applying Economic Concepts
C. Are the following statements examples of positiveeconomics or normative economics?
1. Because of scarcity, everyone must make choices.
2. Americans buy too many cars and do not usemass transit enough.
Positive economicsstudies economic behavioras it is.
Normative economicsinvolves judgments ofwhat economic behaviorought to be.
QUICK REFERENCE
Normative Economics Why is this statementabout the North American Free Trade Agreement(NAFTA) an example of normative economics?
29
Learn more aboutAdam Smith atClassZone.com
30 Chapter 1
Adam Smith:Founder of Modern Economics
Some 250 years ago, economics as an academic discipline did not even exist.Any discussion of economic issues usually took place in the fields of politics andphilosophy. In 1776, however, Adam Smith completely changed this.
Seeing the Invisible
No other economist has had as much influence as Adam Smith, yet he would nothave even considered himself an economist. Smith was born in Kirkcaldy, Scotland,in 1723 and studied, and later taught, literature, logic, and moral philosophy. In 1764he traveled to France and met many European Enlightenment writers and thinkers.His discussions with them encouraged him to look at the world anew. The resultwas his groundbreaking work, An Inquiry into the Nature and Causes of the Wealth ofNations, which he published in 1776.
In The Wealth of Nations, Smith challenged the idea that mercantilism—a sys-tem by which the government of the homeland controlled trade with its colonies—was economically sound. Instead, he argued, a nation would bewealthier if it engaged in free trade. It wasin this market where goods could beexchanged freely that Adam Smithsaw a new economic relationship.
He reasoned that people behavein ways that satisfy their economicself-interest. A tailor will makeclothes as long as people will buythem at a price that satisfies him.If he makes more clothes than cus-tomers wish to buy, he will cut backand make fewer until he finds thebalance again. In this way, accordingto Smith, an “invisible hand” guidesthe marketplace. In such a free market, both thebuyer and the seller benefit from each transac-tion. Smith’s idea of the “invisible hand,” as well asmany other principles he explained in The Wealthof Nations, became the foundation of modern eco-nomic theory.
APPLICATION Analyzing Effects
D. What impact do you think individual self-interest has on the economy as a whole?Illustrate your answer with examples.
Founder of EconomicsThe Wealth of Nations isconsidered the foundingwork of the subject ofeconomics—even thoughSmith never used the wordeconomics in the book.
Adam Smith
Scottish politicaleconomist and moralphilosopher
Born: June, 1723
Died: July 17, 1790
Accomplishment:Laying the foundation formodern economics
Other Major Work:The Theory of MoralSentiments (1759)
Famous Quotation:“It is not from thebenevolence of thebutcher, the brewer, orthe baker, that we canexpect our dinner, butfrom their regard to theirown interest.”
Influenced:Alexander HamiltonThomas MalthusKarl MarxDefenders of capitalismCritics of capitalism
ECONOMICS PACESET TER
FAST FACTS
ClassZone.com
Ford Motor Company assembly line, 1913
31The Economic Way of Thinking
SECTION 4 Assessment
2. Why do economists often choose to present statistics in charts,tables, or graphs?
3. Create a simple model to explain how you decide how much timeto study and how much time to unwind each evening. You may usewords, charts or graphs, or equations.
4. Think of an example of a macroeconomic issue that affects anindividual person, family, or business and explain its effect.
5. Explain the value of statistics and other data to positive economicsand to normative economics.
6. Using Your Notes In whatways was Adam Smith amicroeconomist? In what waysa macroeconomist? Refer toyour completed comparison andcontrast chart.
Use the Graphic Organizer at Interactive Review @ ClassZone.com
1. Explain the differences between the terms in each of these pairs:
7. Making Inferences How do you think politicians might usenormative economics statements?
8. Applying Economic Concepts In which category does eachitem below belong—microeconomics or macroeconomics? Why?
a. Studying statistics to see how well the economy is doing atcreating jobs or increasing exports;
b. Studying statistics on gasoline sales and hotel bookings toexplore the impact of higher gas prices on vacation plans.
9. Distinguishing Fact from Opinion Consider the example ofthe state lottery to raise money for education. How might it bepossible for two economists to see the same information andarrive at different opinions about what to do?
10. Challenge When you go out shopping, do you often worry thatthere will be a shortage of something you really want? If so, explainwhy you think there might be a shortage. If not, explain why thereseems to be enough of everything you would want to buy.
C RIT IC AL THINKING
Using GraphsGraphs are among the mostimportant tools used by economists.
Create Graphs Use the followinginformation about Model T Fords(shown above) to create two line orbar graphs.
Average price per car1909 — $9041911 — $8111913 — $6381915 — $626
Number of cars sold1909 — 12,1761911 — 40,4001913 — 179,1991915 — 355,249
Source: Model T Ford Club of America
Challenge As Henry Ford loweredthe price of the Model Ts, hepotentially reduced his profit—theamount of money he made—onthe sale of each car. Why was that agood economic choice?
b. macroeconomicsmicroeconomics
c. positive economicsnormative economics
a. statisticseconomic model
ECONOMICS IN PR ACTICEREVIEWING KEY CONC EP TS
Concepts Similarities Differences
Charts & Tables vs.Graphs
Micro vs. Macro
Positive vs. Normative
Use @ ClassZone.comto complete this activity.
Find an update on this CaseStudy at ClassZone.com
Chapter 132
Case Study
The Real Cost ofExpanding O’Hare AirportBackground Chicago’s O’Hare airport is one of the busiest airports in theUnited States. It is a major hub for both domestic and international airlines, andits smooth running is essential if the many airlines that fly in and out of O’Hareare to remain on schedule. However, delays at O’Hare are commonplace, and thissometimes disrupts air travel throughout the United States and abroad.
Two main factors are responsible for delays at O’Hare: turbulent Midwesternweather and the layout of O’Hare’s runways. Because all but one of the runways areinterconnected, bad weather results in the shutting down of most of the runwaysystem. A modernization plan to improve efficiency at O’Hare was adopted in2005. This plan generated considerable, and often heated, discussion and debate.
What’s the issue? What are the real costs involved in airport expansion? Studythese sources to determine the costs tied to the expansion of O’Hare airport.
Chicago O’Hare AirportExpansionThe modernization plan is estimated to cost $6.6 billion(in 2001 dollars), which will probably be more like $8billion by completion. . . .
Supporters of the expansion plan say delays could becut by 79% and that 195,000 jobs and $18 billion wouldbe put into the local economy. In 2004 the airport playedhost to 69.5 million arriving, departing and connectingpassengers and had total aircraft operations at nearly929,000, an average of one landing or takeoff every 56seconds. . . .
The airport has 178 gates on eight connectedconcourses and one freestanding terminal. Therealignment [of the runways] and modernization programcould make a great deal of difference to the efficiencyof the airport. Overall, delays are expected to drop by79%. The future airfield will be able to accommodateapproximately 1.6 million aircraft operations and 76million [passengers] per year.
Source: Airport-technology.com/projects/chicago
Thinking Economically What factors led to the development of the plan toexpand O’Hare? What are the projected costs and benefits?
A. OnlineReport
This report de-scribes the an-ticipated benefitsof the O’HareModernizationPlan to redesignthe runway systemand expand theairport.
33The Economic Way of Thinking
THINKING ECONOMICALLY Synthesizing
1. Explain the real cost of expanding O’Hare airport. Use information presented in the documents tosupport your answer.
2. Who are the most likely winners and losers as a result of the O’Hare expansion? Explain your answer.
3. How might supporters of expansion use a production possibilities model to strengthen their case?
B. PoliticalCartoon
CartoonistGrizelda drew thiscartoon aboutpeople protestingnoise pollution atan airport. Thinking
EconomicallyWhich opportu-nity cost does thiscartoon address?Explain your answer.
C. OrganizationWebsite
The Allianceof ResidentsConcerningO’Hare (AReCo)addresses prob-lems related to theaviation industry.AReCo’s web-site presents thegroup’s findingsand views regard-ing the expansionof O’Hare.
Area Residents Challenge Wisdomof O’Hare ExpansionAReCo cites health hazards, seeks alternatives to enlarging O’Hare.
The [aviation] industry and airport expansionists consistently try to minimize the impacts ofairports and aircraft. One example of the harm that has been . . . understated by the federalgovernment . . . [is the] underreporting [of] the amounts of deadly pollution coming fromairports/aircraft.
For example, combined aircraft-related amounts of benzene [a known cause of cancerin humans] totaled 20 tons at Logan, Bradley, and Manchester airports in 1999! . . . Megaairports, such as Chicago’s O’Hare, operate more aircraft annually than all of the threeabove-mentioned airports combined, thus emitting even more harmful and even deadlypollution in heavily urban-populated areas. . . .
In the meantime, there are intelligent steps that Chicago (and others) can take that willreally modernize the metropolitan air transportation system and retain Chicago’s title of“our nation’s transportation hub.” Such steps include placing a much stronger emphasis on[more than one type of] transportation, such as medium and high-speed rail, that would linkO’Hare airport to other airports (becoming a “virtual hub”) and building a new airport in aless populated peripheral area.
Source: Areco.org
Thinking Economically What alternatives does AReCo cite to O’Hare’s expansion?
Source: www.CartoonStock.com
FIGURE 1.12 EDUCATION AND EARNINGS
Wee
kly
earn
ings
(in
dolla
rs
adju
sted
for i
nfla
tion)
Male college graduates Male high school graduates, no college
0
200
400
600
800
1,000
1,200
20041979
Source: U.S Bureau of Labor Statistics
Year
Complete the following activity either on yourown paper or online at ClassZone.com
34 Chapter 1
CHAPTER 1 AssessmentREVIEWING KEY CONC EP TS
Choose the key concept that best completesthe sentence. Not all key concepts will be used.
consumereconomic modeleconomicsefficiencyfactors of productionincentivemacroeconomicsmicroeconomicsopportunity cost
1 is the fundamental economic problem. It arisesbecause human 2 are limitless, while resourcesare limited. It affects what a 3 buys and whata 4 makes. It affects what is produced, how it isproduced, and who gets what is produced. It affectshow the four 5 are put to use.
Since people cannot have everything theywant, they have to make choices. Every choice,however, involves a 6 , something you have togive up to get what you want. When making aneconomic decision, you need to consider the 7 ,the value of the thing you gave up.
Economists often use an 8 , a simplifiedrepresentation of reality, to clarify concepts.Economists use such tools in 9 , the study of theeconomic behavior of individual persons, families,and businesses, and in 10 , the study of theeconomy as a whole.
One useful model, the 11 , shows themaximum amount of goods that an economycan produce. It also shows 12 , when not allresources are put to full use.
Scarcity: The Basic Economic Problem (pp. 4–11)
1. In what ways does scarcity affect both consumersand producers?
2. What are the four factors of production and howdo they relate to scarcity?
3. What does the phrase “there’s no such thing as afree lunch” mean in economic terms?
4. Why is it important to consider marginal benefitsand costs when you do a cost-benefit analysis?
Analyzing Production Possibilities (pp. 18–23)
5. What are three things a PPC shows?
6. What factors could lead to economic growth?
The Economist’s Toolbox (pp. 24–33)
7. What are some tools that economists use to drawmeaning from large amounts of data?
8. What are the differences between microeconomicsand macroeconomics?
APPLYING ECONOMIC CONC EP TS
Look at the bar graph below showing the relationshipbetween educational level and weekly wages.
9. Describe the relationship between education andearnings for males in 1979.
10. Explain why the earnings gap between collegeand high school graduates might have changedbetween 1979 and 2004.
• Online Summary• Quizzes• Vocabulary Flip Cards
• Graphic Organizers• Review and Study Notes
Review this chapter using interactiveactivities at ClassZone.com
The Economic Way of Thinking 35
S I M U L AT I O NC RIT IC AL THINKING
11. Creating Graphs Use the following informationto create a bar graph showing the weekly wagesfor females with a high school education and thosewith a college education in 1979 and 2004.
1979 High school graduates, no college, $424College graduates, $605
2004 High school graduates, no college, $488College graduates, $860
Source: U.S. Bureau of Labor Statistics
Use @ ClassZone.comto complete this activity.
12. Interpreting Graphs Compare the graph youcreated with the one on page 34. Identify threedifferences between the changes over time forwomen and for men.
13. Evaluating Economic Decisions You plan to opena restaurant that specializes in meals cooked withorganic products. You realize that location is veryimportant for this kind of business. You have twooptions: you can rent an expensive site downtownor you can buy an inexpensive building in a quietneighborhood. What are the benefits and theopportunity cost for each option?
14. Conducting Cost-Benefit Analysis You areconsidering taking a part-time job after school at alocal veterinary surgery. Create a decision-makinggrid to analyze your potential choices. Includealternative jobs you might take and the costs andbenefits of each. Similarly, list activities other thanworking that you might pursue after school. Indicatewhich alternative you would choose and explainyour choice.
15. Challenge You own a small factory that makeswidgets and you want to increase production, soyou hire new workers. Each new worker increasesproductivity, but each also must be paid. When willyou stop hiring new workers?
Start a BusinessStep 1 Team up with a partner or small group ofclassmates.
Step 2 With your partner or group, decide on abusiness you want to start. This could be anythingthat has a realistic chance of succeeding: computertechnician, T-shirt printer, caramel-corn producer, dogwalker, or anything you think may fulfill a want.
Step 3 On a chart like the one below, list the factors ofproduction you will need to use to start and run yourbusiness.
Step 4 Develop a business plan—a way that you canuse the factors of production so efficiently that you willbe able to make money. Describe your business plan ina paragraph.
Step 5 Present your plan to the rest of the class. Whenall pairs or groups have made their presentations, hold aclass vote to select the best plan.


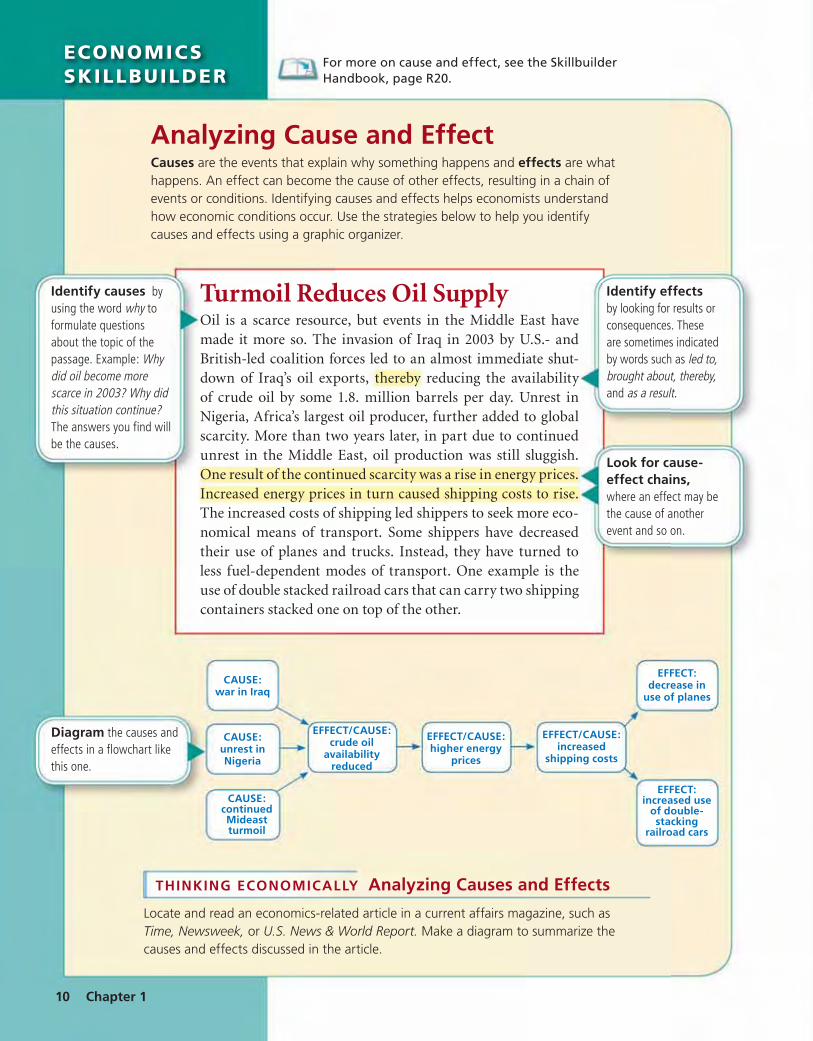


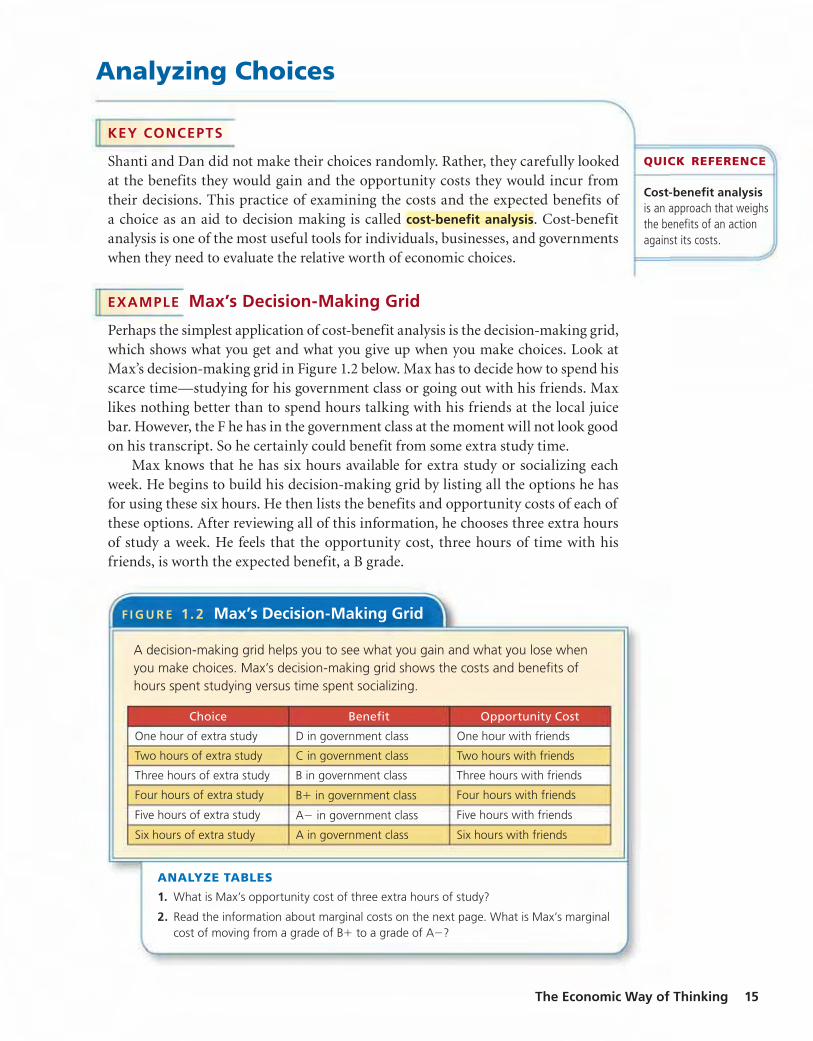
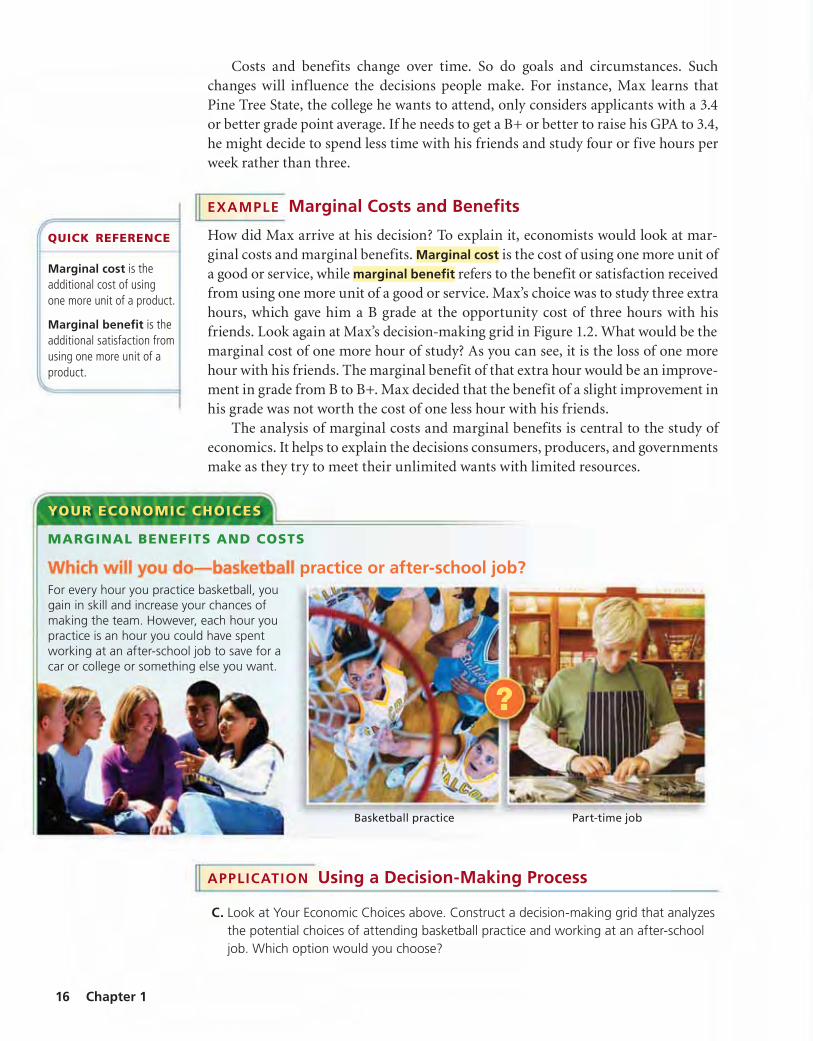


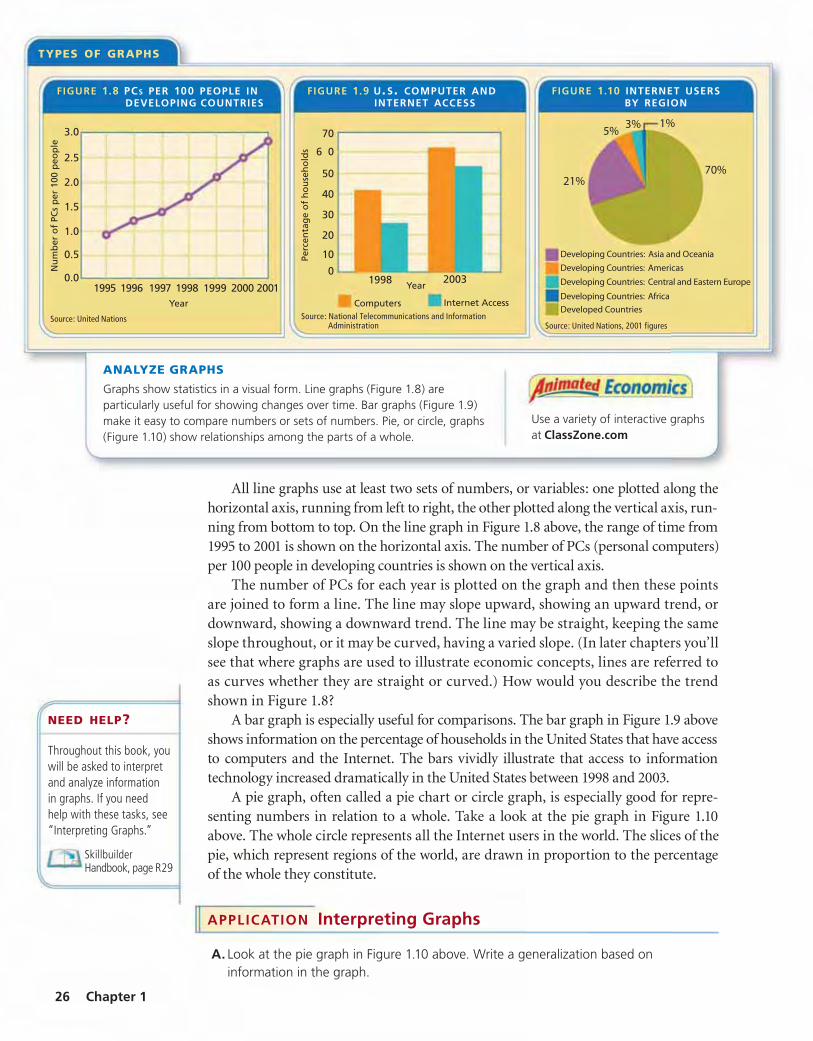


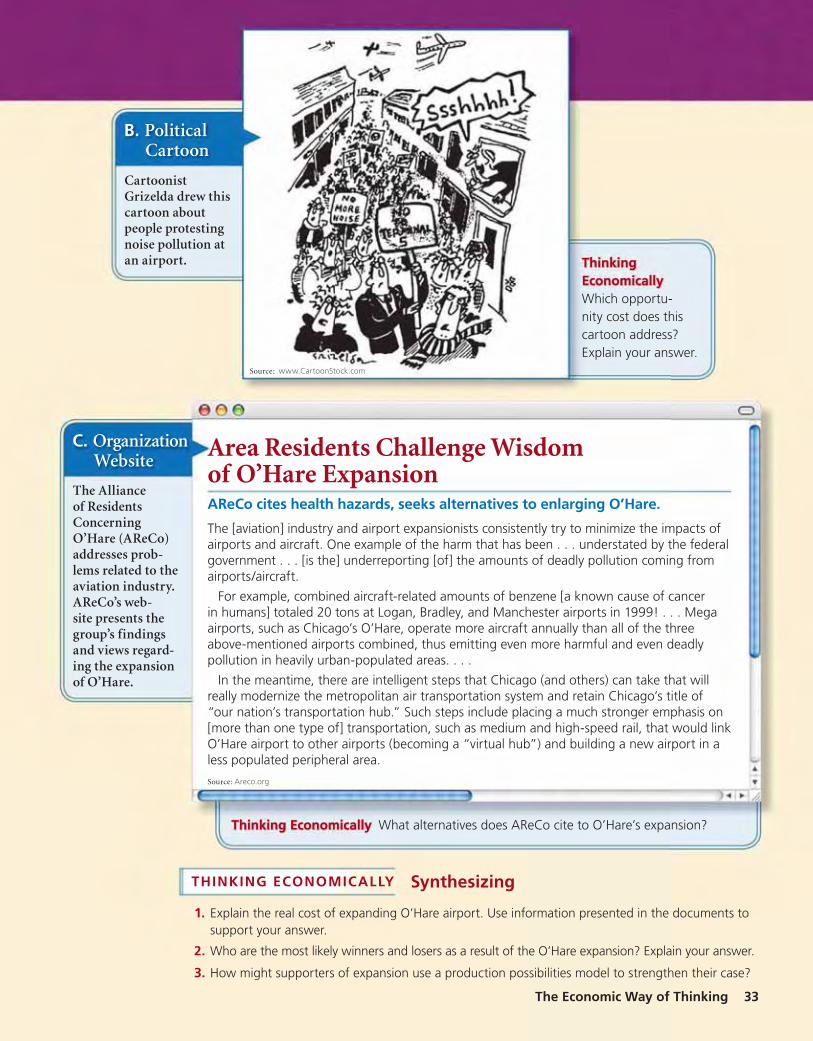


![Why economics? p 17 Task IV check Paragraphs 1 – 8 Pg 2: economic, economics, economics Pg 3: scarce Attn: [ skeәs ] Pg 4: economy, economic, economize,](https://static.documents.pub/doc/80x56/56649d975503460f94a80350/why-economics-p-17-task-iv-check-paragraphs-1-8-pg-2-economic-economics.jpg)


