UNCORRECTED PROOF Chapter 3 SNP Databases Christopher Phillips Abstract Researchers interested in obtaining detailed information on SNPs now work in a golden age of online database availability: never has so much data and such a wealth of information been freely accessible for such a substantial proportion of the 18 million single nucleotide polymorphism (SNP) loci currently characterized in the human genome. This chapter describes the major SNP databases available for human genetics studies. Tools and strategies are outlined that can help researchers properly formulate a database query to be able to access the most appropriate information needed for their research aims, including medical or population genetics analysis – an approach that is getting increased attention given the expanding scale of online SNP data. Key words: Single nucleotide polymorphism, database, search, query, National Center for Biotechnology Information, dbSNP Entrez, HapMap. 1. Introduction In silico research as a part of the preparation for an experimental genetics study is now an essential preamble to the choice of geno- mic regions to analyze and markers to use, the design of genotyp- ing approaches, and the listing of appropriate samples to characterize. This chapter provides a simple guide to the structure and use of the major online SNP databases, adapted to Sections 2 and 3, by linking each database to a particular research planning task: finding sets of single nucleotide polymorphisms (SNPs) that share common characteristics (NCBI Entrez); obtaining detailed information on a SNP locus and collating other genetically rele- vant data (dbSNP); exploring SNPs in coding regions (SNPper and PupaSuite); performing simple scrutiny of linkage SPB-145152 3 June 13, 2009 Time: 10:28 Proof 1 1 2 3 4 5 6 7 8 9 10 11 12 13 14 15 16 17 18 19 20 21 22 23 24 25 26 27 28 29 30 31 32 33 34 35 36 37 38 39 40 41 42 43 44 45 46 47 48 A.A. Komar (ed.), Single Nucleotide Polymorphisms, Methods in Molecular Biology 578, DOI 10.1007/978-1-60327-411-1_3, ª Humana Press, a part of Springer Science+Business Media, LLC 2009
Transcript
UNCORRECTE
DPROOF
Chapter 3
SNP Databases
Christopher Phillips
Abstract
Researchers interested in obtaining detailed information on SNPs now work in a golden age of onlinedatabase availability: never has so much data and such a wealth of information been freely accessible forsuch a substantial proportion of the 18 million single nucleotide polymorphism (SNP) loci currentlycharacterized in the human genome. This chapter describes the major SNP databases available for humangenetics studies. Tools and strategies are outlined that can help researchers properly formulate a databasequery to be able to access the most appropriate information needed for their research aims, includingmedical or population genetics analysis – an approach that is getting increased attention given theexpanding scale of online SNP data.
Key words: Single nucleotide polymorphism, database, search, query, National Center forBiotechnology Information, dbSNP Entrez, HapMap.
1. Introduction
In silico research as a part of the preparation for an experimentalgenetics study is now an essential preamble to the choice of geno-mic regions to analyze and markers to use, the design of genotyp-ing approaches, and the listing of appropriate samples tocharacterize. This chapter provides a simple guide to the structureand use of the major online SNP databases, adapted to Sections 2and 3, by linking each database to a particular research planningtask: finding sets of single nucleotide polymorphisms (SNPs) thatshare common characteristics (NCBI Entrez); obtaining detailedinformation on a SNP locus and collating other genetically rele-vant data (dbSNP); exploring SNPs in coding regions (SNPperand PupaSuite); performing simple scrutiny of linkage
SPB-145152 3 June 13, 2009 Time: 10:28 Proof 1
1
2
3
4
5
6
7
8
9
10
11
12
13
14
15
16
17
18
19
20
21
22
23
24
25
26
27
28
29
30
31
32
33
34
35
36
37
38
39
40
41
42
43
44
45
46
47
48
A.A. Komar (ed.), Single Nucleotide Polymorphisms, Methods in Molecular Biology 578,DOI 10.1007/978-1-60327-411-1_3, ª Humana Press, a part of Springer Science+Business Media, LLC 2009
UNCORRECTE
DPROOF
disequilibrium (LD) block structure and choosing SNPmarkers totag chromosome regions (HapMap); and assessing populationgenetics parameters from online SNP data (Haplotter andSPSmart).
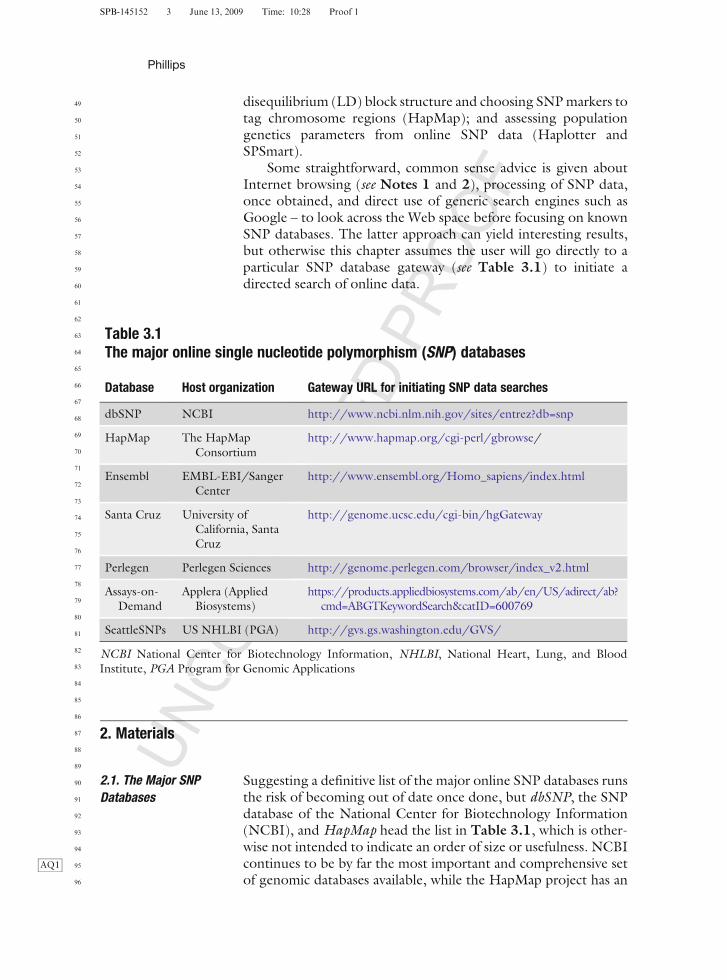
Some straightforward, common sense advice is given aboutInternet browsing (see Notes 1 and 2), processing of SNP data,once obtained, and direct use of generic search engines such asGoogle – to look across the Web space before focusing on knownSNP databases. The latter approach can yield interesting results,but otherwise this chapter assumes the user will go directly to aparticular SNP database gateway (see Table 3.1) to initiate adirected search of online data.
2. Materials
2.1. The Major SNPDatabases
Suggesting a definitive list of the major online SNP databases runsthe risk of becoming out of date once done, but dbSNP, the SNPdatabase of the National Center for Biotechnology Information(NCBI), and HapMap head the list in Table 3.1, which is other-wise not intended to indicate an order of size or usefulness. NCBIcontinues toAQ1 be by far the most important and comprehensive setof genomic databases available, while the HapMap project has an
SPB-145152 3 June 13, 2009 Time: 10:28 Proof 1
Table 3.1The major online single nucleotide polymorphism (SNP) databases
Database Host organization Gateway URL for initiating SNP data searches
SeattleSNPs US NHLBI (PGA) http://gvs.gs.washington.edu/GVS/
NCBI National Center for Biotechnology Information, NHLBI, National Heart, Lung, and BloodInstitute, PGA Program for Genomic Applications
Phillips
49
50
51
52
53
54
55
56
57
58
59
60
61
62
63
64
65
66
67
68
69
70
71
72
73
74
75
76
77
78
79
80
81
82
83
84
85
86
87
88
89
90
91
92
93
94
95
96
UNCORRECTE
DPROOF
ever-closer relationship with dbSNP in collating human SNP data.To summarize a complex and far-reaching project, HapMap wasintended to concentrate global resources on the characterizationof the variant part of the genome as a natural extension of thework of the original Human Genome Mapping Project in estab-lishing the invariant sequence common to everyone and held inNCBI (1, 2). An important part of the initial work of HapMap wasto check the efficiency of dbSNP, i.e., how well did the dbSNPcatalogue represent the true extent of SNP variability in humans?This was achieved by resequencing ten ENCODE regions(detailed in Table 3.2 of (1) and at http://www.hapmap.org/downloads/encode1.html.en) and extrapolating the SNP variabil-ity found to the genome as a whole. Two findings emerged fromthis comparison: firstly the false-negative rate of dbSNP (i.e., howoften SNPs were present but not detected) although very low wassignificant for rare SNPs – loci with allele frequencies around 1%(0.01) or less; secondly the overriding majority of common varia-tion SNPs had been captured by dbSNP or if absent had proxies inthe same region in tight correlation and listed by dbSNP. It is
SPB-145152 3 June 13, 2009 Time: 10:28 Proof 1
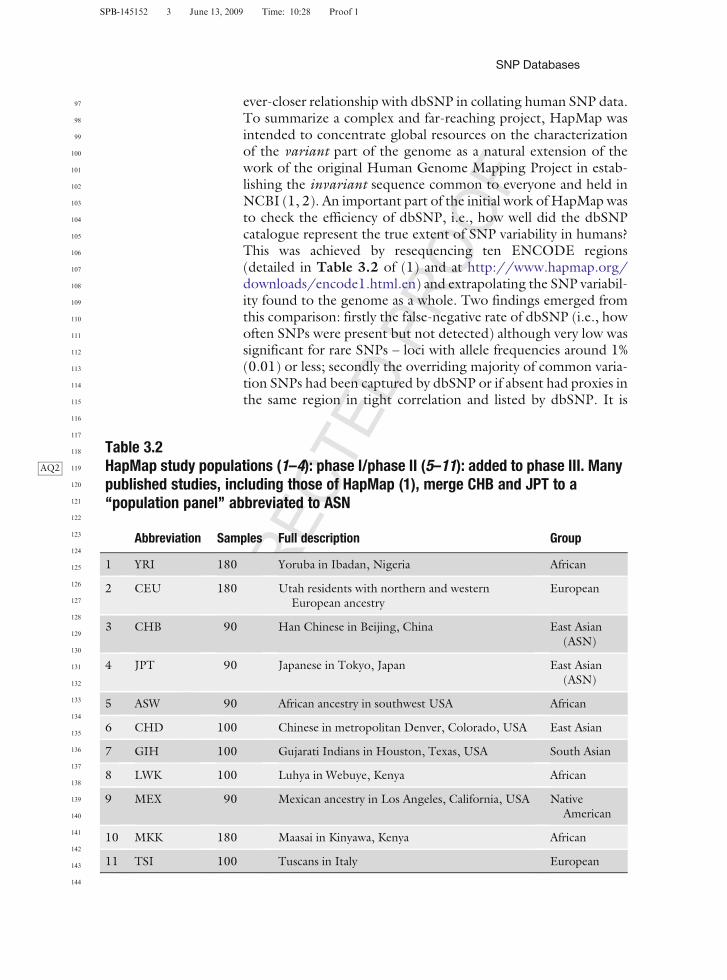
Table 3.2HapMap study populations (1–4): phase I/phase II (5–11): added to phase IIIAQ2 . Manypublished studies, including those of HapMap (1), merge CHB and JPT to a‘‘population panel’’ abbreviated to ASN
Abbreviation Samples Full description Group
1 YRI 180 Yoruba in Ibadan, Nigeria African
2 CEU 180 Utah residents with northern and westernEuropean ancestry
European
3 CHB 90 Han Chinese in Beijing, China East Asian(ASN)
4 JPT 90 Japanese in Tokyo, Japan East Asian(ASN)
5 ASW 90 African ancestry in southwest USA African
6 CHD 100 Chinese in metropolitan Denver, Colorado, USA East Asian
7 GIH 100 Gujarati Indians in Houston, Texas, USA South Asian
8 LWK 100 Luhya in Webuye, Kenya African
9 MEX 90 Mexican ancestry in Los Angeles, California, USA NativeAmerican
10 MKK 180 Maasai in Kinyawa, Kenya African
11 TSI 100 Tuscans in Italy European
SNP Databases
97
98
99
100
101
102
103
104
105
106
107
108
109
110
111
112
113
114
115
116
117
118
119
120
121
122
123
124
125
126
127
128
129
130
131
132
133
134
135
136
137
138
139
140
141
142
143
144
UNCORRECTE
DPROOF
interesting that estimates of false-positive rates in dbSNP (i.e.,incorrectly listing a nucleotide position as a SNP) were not detailedby HapMap, indicating that these were negligible and thereforedbSNP had developed very efficient systems for confirming thatSNPs were real (seeNote 3). In summary, dbSNP has proved to beboth a comprehensive and a reliable catalogue of human SNPvariability with an efficient system to cross-reference multiplesubmissions of the same SNPs from centers outside NCBI (seeNote 4). Since 2003, HapMap has been the major contributorof SNP data to dbSNP. The other databases listed in Table 3.1both parallel and feed data into dbSNP, so they either provide analternative system of browsing and searching the core humangenome SNP data (Ensemble and Santa Cruz), or list the SNPsgenerated by their own independent genotyping initiatives withstand-alone browser systems dedicated to the data they have gen-erated (Perlegen, Assays-on-Demand, and Seattle SNPs).1. dbSNP. The strength of NCBI lies in the breadth of genomic
databases held under the single umbrella. This means thatqueries to any of theNCBI databases can tap into the relation-ships that exist between the subject of interest and each ofsome twenty or more major databases within NCBI. Sogenetics research involving SNPs is easily set in the contextof supporting information that details published studies ofthe SNP, context sequence of the SNP, gene structure andfunction (if this is where the SNP is sited), and how the SNPvariation is expressed as a phenotype. These data are handledin NCBI by PubMed, GenBank, Gene, and Online MendelianInheritance in Man (OMIM) databases, respectively (seeNote 5). In addition, NCBI benefits from a unified approachto constructing database queries, so once the user is familiarwith the way to query one NCBI database, the same rules willapply to all other queries made. When accessing the mostextensive NCBI data, comprising SNP, gene, protein, pub-lications, phenotype, and sequence, one can execute dataqueries directly from a menu of choices in a global systemtermed ‘‘Entrez’’ (outlined in detail in Section 3.1). The SNPEntrez system EntrezSNP has a homepage menu listing theprincipal SNP criteria (http://www.ncbi.nlm.nih.gov/sites/entrez?db=snp) that help to define a search. This is the mainstarting point of EntrezSNP and this SNP-focused menudiffers from those of other Entrez databases such as Entrez-Gene and EntrezProtein. Therefore, dbSNP can be accessedin three ways: by using EntrezSNP; by following hyperlinksembedded in other NCBI databases, and by direct access toSNP summary pages, termed ‘‘Cluster Reports’’ – forming thecore data page for each locus in dbSNP. A Cluster Report canbe thought of as the SNP ‘‘homepage’’ listing a full set of thekey parameters in a standardized format.
SPB-145152 3 June 13, 2009 Time: 10:28 Proof 1
Phillips
145
146
147
148
149
150
151
152
153
154
155
156
157
158
159
160
161
162
163
164
165
166
167
168
169
170
171
172
173
174
175
176
177
178
179
180
181
182
183
184
185
186
187
188
189
190
191
192
UNCORRECTE
DPROOF
Reference to a SNP within NCBI, within all other SNPdatabases, and now, almost universally, in the scientific litera-ture is made using a unique identifier: the rs-number, consist-ing of a number prefixed with ‘‘rs.’’ As an open database,dbSNP receives submissions from genotyping centers andcollates the data into a merged reference set (see Note 4).Since different centers routinely report identical SNPs todbSNP, the submissions are clustered into reference SNPs(termed ‘‘refSNPs’’) based on genome-wide comparisons ofthe context sequence submitted. For these reasons the dis-tinction between reference SNPs and submitted SNPs is madeby rs and ss, respectively: prefixing a unique SNP identifica-tion number with rs, while creating a number for each sub-mission prefixed with ss. All rs-numbers are displayedthroughout NCBI as hyperlinks returning the ClusterReport.
2. SNP-related databases in NCBI: PubMed, GenBank, Gene,and OMIM.
PubMed is the NCBI bibliographic database that provides thestarting point for researchers to assess the current publishedstate of the art in their chosen area of study. Data comprise tenmillion published articles from about 5,000 peer-review jour-nals. PubMed is by default predominantly text-oriented so itworks by matching text recognized in the query to the text inthe data records, including key words in the article body textitself. Therefore, to work efficiently the system needs to care-fully regulate vocabulary, which is done by a separate databaseof words used to index PubMed known asMeSH (i.e., medicalsubheadings) – searchable itself using the search menu at thetop left of each NCBI homepage. It can be an importantcheck to clarify the vocabulary relating to a trait or disease ofinterest before performing PubMed searches by subject.Searches using rs-numbers can be an efficient way to findstudies related to a research aim, but note that the habitpersists in many publications of identifying SNPs in genesby the amino acid substitution they create (e.g., shorthandsuch as MC1R V60L), so these will not be returned fromqueries (see Note 6).GenBank is the nucleotide sequence database of NCBI.
This simple description belies the scale of the informationheld – a collection of sequences comprising 60 gigabases ofdata from more than 130,000 species updated daily. Despitethe complexity of GenBank, most users interested in SNPanalysis will simply require a specific context sequence seg-ment of about 120–200 nucleotides to design a genotypingassay for the SNPs of interest. As explained later the
SPB-145152 3 June 13, 2009 Time: 10:28 Proof 1
SNP Databases
193
194
195
196
197
198
199
200
201
202
203
204
205
206
207
208
209
210
211
212
213
214
215
216
217
218
219
220
221
222
223
224
225
226
227
228
229
230
231
232
233
234
235
236
237
238
239
240
UNCORRECTE
DPROOF
application of RepeatMasker and a neighbor SNP scan of–100 bases of context sequence makes it more advantageousto collect it directly from the SNP Cluster Report.Gene is the gene catalogue of NCBI and like dbSNP pre-
sents a single summary page format of relevant informationfor coding regions, including function summaries, transcrip-tion structure, genome maps, bibliography, protein data,sequences, and related links to supporting data. NCBI usesthe near-standard gene identifiers that take the form of theletter/number combination standardized by the HumanGenome Organization (HUGO) (http://www.gene.ucl.ac.uk/nomenclature/) or throughoutNCBI by a GeneID num-ber (see Note 7). Working with data that include a largeproportion of text-based information can be difficult, so toview the context of a SNP or list of SNPs sited in genes it maybe preferable to use a purely graphical display of SNP posi-tions aligned with intronic, exonic, and 50/30-flanking regionsequences such as that given by SNPper (see Section 3.3.1).Taking text-based data even further towards an article format,the OMIM database has summary pages written as articlesdescribing a phenotype, trait, or disorder with a known orsuspected genetic basis. As such, both Gene and OMIM arebest consulted along with PubMed during the initial stages ofa study design to gain an overview of the current understand-ing of a disease process. Luckily, OMIM is highly readableand can be described as an online textbook expanded andupdated as knowledge of a trait or condition is consolidated.Searches of OMIM just provide the descriptive text and a listof articles without the benefit of the search items highlightedwithin the text; publications must then be read to gather thelinks to the area of interest. Similarly, rs-numbers are notregularly listed in the OMIM article body text.
3. HapMap. The original stated aim of the HapMap Project – todetermine the haplotype structure of the human genome – hasexpanded to encompass the characterization of all commonhuman sequence variation. The inclusion of copy numbervariation and the broadening of ENCODE resequencingefforts to capture rare variation will extend this even further,but HapMap remains dominated by common SNPs and theirhaplotypes: the correlated arrangement of loci in segmentsdefined by highly variable recombination rates. HapMap datahave been structured into study phases I–III with differentranges of SNPs, SNP characteristics, and study populations.It is not always easy to find how each phase was defined but, inshort, phase I encompassed about one million SNPs in fourpopulations to give one common SNP per 5,000 bases, phaseII consolidated SNP coverage with a further 2.5 million
SPB-145152 3 June 13, 2009 Time: 10:28 Proof 1
Phillips
241
242
243
244
245
246
247
248
249
250
251
252
253
254
255
256
257
258
259
260
261
262
263
264
265
266
267
268
269
270
271
272
273
274
275
276
277
278
279
280
281
282
283
284
285
286
287
288
UNCORRECTE
DPROOF
markers, and phase III has added another seven study popu-lations. Current study population details are outlined inTable 3.2 and at the time of writing phase III data havebecome publicly available.The HapMap Web site provides a wide range of data, but
of principal interest will be the genome browser, the SNPsummary pages, and the HapMap data mart. HapMap hastaken the view that the vast majority of users will start with agraphical overview of a chromosome segment and work out-wards from there, so HapMap presents perhaps the bestgraphical genome browser for SNP variability currently avail-able. Although the default map details (tracks) are relativelysparse, this provides clarity, while numerous other tracks canbe added and kept as the user’s default arrangement forfuture browsing. The chromosome coordinates and SNPpositions stay as fixed tracks throughout. This representationusefully complements dbSNP since any SNP not character-ized by HapMap has a hyperlink rs-number in position togain the Cluster Report. SNPs characterized by HapMap arelinked to their own summary pages, which are briefer incontent, so again linking out to dbSNP can be the bestapproach here too. The HapMap graphical browser reallybecomes informative when used to study the haplotype struc-ture around the sites of interest (see Section 3.4) – originallymainly coding regions, but increasingly including intergenicregions identified by genome-wide association studies. Themethods of graphical representation of haplotype structurecan be a challenge to the first-time visitor to HapMap and it isrecommended that users familiarize themselves withapproaches used by HapMap and in key papers to displayLD and that they understand the characteristics of the prin-cipal SNP association metrics of r2 and D 0 (3, 4).
4. Ensembl, Santa Cruz, Perlegen, and Assays-on-Demand.Ensembl and Santa Cruz genome databases largely providealternatives to NCBI to access most of the same SNP andgenome data. Ensemble specializes in the analysis of gen-ome features and sequence to best identify and annotategenes and has a large range of species under study. Thisprovides the most informative approach for users inter-ested in comparative genomic approaches: where com-monality of nucleotide or protein sequence can beidentified by comparing different species. Ensembl hashad a pivotal role in the complex task of gene identifica-tion and characterization, pioneering automated gene anno-tation techniques. Hosted in Ensembl, the VertebrateGenome Annotation (VEGA) database provides a range ofgenome browsers (5). The main aim of VEGA is in providing
SPB-145152 3 June 13, 2009 Time: 10:28 Proof 1
SNP Databases
289
290
291
292
293
294
295
296
297
298
299
300
301
302
303
304
305
306
307
308
309
310
311
312
313
314
315
316
317
318
319
320
321
322
323
324
325
326
327
328
329
330
331
332
333
334
335
336
UNCORRECTE
DPROOF
the high-quality manual annotation of vertebrate genomesequence. Lastly, Ensembl provides close integration withthe high-quality protein sequence database of Swiss-Prot/Uni-Prot (http://www.ebi.ac.uk/swissprot/AQ3 ). This comprisesmanually annotated protein sequences with content that isfully linked with the Ensembl gene annotation pipeline.Santa Cruz has several features that can provide easier waysthan NCBI to obtain information for SNP analysis – forexample, the simple process of collecting extended contextsequence for a SNP is more straightforward in Santa Cruzthan from within dbSNP (see Note 7). Therefore, on occa-sions, working with two Web pages with different genomedata browsers (essentially accessing the same underlying infor-mation) can be the optimum approach. The guide to SantaCruz queries is atAQ4 Perlegen and Applied Biosystems’s Assays-on-Demand are private databases of SNP variability informa-tion that has been submitted to dbSNP and is publicly avail-able, but can also be accessed from each company’s Web sitewith dedicated filtered search pages. Filters parallel the queryprocess of Entrez by offering a choice of criteria that reducethe data set returned to a small, more manageable group ofitems meeting the criteria. Both databases elected to studyUS European, US African-American, and US Chinese popu-lation panels that to a large extent mirror those of HapMap’sCEU, YRI, and CHB, so data obtained can be combinedfrom different sources to allow meaningful comparisons ofpopulation variability or less often directly between differentsamples but originating from the same population group(although comparing YRI Africans with African-Americanshighlights the about 20–30% European admixture in thelatter). The easiest way to compare SNP data from similarpopulations in different databases is to use SPSmart (see Sec-tion 3.5.2). Note that Perlegen uses an internal SNP identi-fier with the format ‘‘PS+8 digit no.’’ (e.g., PS04631975)but accepts rs-number queries, while SPSmart provides a listof these numbers in its returned data.Assays-on-Demand SNP data are in large part based on the
Celera SNP database generated during the private genomeannotation performed by Celera after the human sequencehad been completed in parallel to the completion of thepublic Human Genome Mapping Project in 2000. Celeragenome data were available on a subscription basis (as CeleraDiscovery System, orCDS) between 2002 and 2006, but nowall Celera’s SNP data have been incorporated into dbSNP andcan be individually filtered in a search in Entrez with theinclusive term ‘‘AND Celera’’ or the exclusive term ‘‘NOT
SPB-145152 3 June 13, 2009 Time: 10:28 Proof 1
Phillips
337
338
339
340
341
342
343
344
345
346
347
348
349
350
351
352
353
354
355
356
357
358
359
360
361
362
363
364
365
366
367
368
369
370
371
372
373
374
375
376
377
378
379
380
381
382
383
384
UNCORRECTE
DPROOF
Celera’’ (see Section 3.3.1). Accessing Celera SNP data is alsopossible through Assays-on-Demand; users in the latter casecan utilize a stand-alone tool called ‘‘SNPbrowser’’ compris-ing five million SNPs from public and CDS sources. Thisallows access to some of the original CDS SNP and geneannotation but is of most use as an alternative to HapMapfor the definition of haplotype structure in a particular chro-mosome segment (see Section 2.2.2). Particularly in thepopulation genetics field, Assays-on-Demand allows a simplesystem to review a large data set of SNP allele frequencyvariability from three major population groups and so hasprovided a core search step for many studies seeking to isolateand develop ancestry informative marker SNPs (5).
5. SeattleSNPs. The SeattleSNPs initiative is funded as part ofthe US National Heart, Lung, and Blood Institute (NHLBI)Program for Genomic Applications (PGA) – the latter abbre-viation is used by dbSNP to reference SeattleSNPs SNPsubmissions. The project has undertaken the resequencingof more than 300 genes identified as primarily importantin the inflammatory response, but also including cardiovas-cular disease and the immunity (a full list of completed genesis at http://pga.gs.washington.edu/finished_genes.html).Although it is important to stress that the gene list mentionedabove is not prescriptive – users are encouraged to nominatecandidates for consideration. Therefore, SeattleSNPs pro-vides a key opportunity to capture and characterize low-fre-quency SNPs fromwhole sequence data that would otherwiseescape detection or be subject to acquisition bias (seeNote 9).As sequencing technology has recently undergone one of theperiodic quantum leaps in throughput, the chance to properlydiscover and catalogue new low-frequency SNPs by resequen-cing sufficiently large sample groups or individuals with aparticular disorder will form the next major phase of SNPdatabasing. The extended ENCODE studies and the Seat-tleSNPs initiative stand at the vanguard of this work, with the1,000 Genomes Project poised at the time of publication totake resequencing to the next level of resolution: that of fullindividual genomes. The evident drawback of SeattleSNPscomes from a focus on targeting a subset of genes or thepathways they occupy with the bias this might represent inattempting to understand the disease process. This is mainlydue to the need to direct resources to the best areas fordetailed SNP genotyping, and the fact that SeattleSNPs isactively engaged in association studies allows it to combinethe knowledge this generates with new targets for resequen-cing in the genome. The SNP data from resequencing is fed
SPB-145152 3 June 13, 2009 Time: 10:28 Proof 1
SNP Databases
385
386
387
388
389
390
391
392
393
394
395
396
397
398
399
400
401
402
403
404
405
406
407
408
409
410
411
412
413
414
415
416
417
418
419
420
421
422
423
424
425
426
427
428
429
430
431
432
UNCORRECTE
DPROOF
into a database known as the Genome Variation Server (GVS)and users are encouraged to access the tutorials that explainoptimum use of SeattleSNPs and GVS at http://www.openhelix.com/downloads/seattlesnps/seattlesnps_home.shtml.
2.2. A Selection ofTools To Aid Analysisof SNP Data
The following tools are available to use as Web-based searchsystems or stand-alone programs that can help to make directedsearches of the databases outlined previously.
1. NCBI tools: dbSNP-announce, MyNCBI, MapViewer, andGenome Workbench.Although not strictly online tools, dbSNP-announce (http://www.ncbi.nlm.nih.gov/About/news/announce_submit.html) andMyNCBI (http://www.ncbi.nlm.nih. gov/entrez/login.fcgi) are important subscription-based adjuncts to anyuse of dbSNP. Subscribing to dbSNP-announce providesautomatic reports to the user’s e-mail address of dbSNPupdates. As well as reporting the release of each newbuild, announcing newly added features, and outliningcorrections or discovered problems with past or presentbuilds, there is an archive for referencing possible pro-blems with, or qualifications to, previously obtainedsearch dataAQ5 . MyNCBI, requires a single subscription stepto provide a search workspace for the user that provides aclipboard permitting combined searches from storedresults obtained at different times (see Section 3.1.7).MapViewer integrates the bulk of the NCBI databases into
a customizable genome map of aligned components termed‘‘map elements.’’ The SNP data map element, termed ‘‘Varia-tion,’’ can be included with any other genome feature in acustommap. A simple, clean icon set against each SNPmarkerpositioned on the map showing a chromosome segment pro-vides a clear summary description of the locus. Map browsingoffers an intuitive way to review large numbers of SNPs in onesession. Exploring a chromosome segment as amap is the bestway to scrutinize the position and characteristics of nearbygenome features of importance such as neighbor SNPs,genes, and their transcripts. Furthermore, the features aroundeach SNP can be scrutinized easily through a series of hyper-links embedded in many of the key map elements such asGenes.NCBI Genome Workbench (http://www.ncbi.nlm.nih.-
gov/projects/gbench/) is a stand-alone program thatworks locally, i.e., independently of individual online accessto NCBI. Once installed, it can access and display genomicdata fromNCBI and combine this with the user’s own data ina series of graphical representations. The program is availablefor download and installation in any operating system formatAQ6 ,
SPB-145152 3 June 13, 2009 Time: 10:28 Proof 1
Phillips
433
434
435
436
437
438
439
440
441
442
443
444
445
446
447
448
449
450
451
452
453
454
455
456
457
458
459
460
461
462
463
464
465
466
467
468
469
470
471
472
473
474
475
476
477
478
479
480
UNCORRECTE
DPROOF
and offers considerable flexibility in how the user choosesto align and compare genomic data. This extends to arange of alignment views, phylogenetic tree views, andtabular views of data. It can also align user’s data tothose of public databases, and retrieve BLAST results. Afull guide is beyond the scope of this chapter, so users areencouraged to explore this tool and the five tutorials(http://www.ncbi.nlm.nih.gov/projects/gbench/tutorial.html) for themselves.
2. Checking SNP assay primer designs: BLAST and Santa CruzIn Silico PCR.BLAST is a tool for assessing/calculating sequence similaritybetween a query sequence and the target sequence(s) avail-able in the NCBI GenBank nucleotide databases. Users inter-ested in developing SNP assay designs will query NucleotideBLAST in two ways: (1) finding the location of a submittedsequence that includes the SNP, as the query ‘‘does the sub-mitted sequence exist in a GenBank database?’’, and (2)checking for coincidental similarity in a sequence, normallya PCR primer, the query being ‘‘what is the degree of speci-ficity of the submitted sequence?’’ These sequence compar-isons can be made by choosing the standard BLAST (termed‘‘blastn’’) and Search for short and near exact matches options,respectively. As a simple and quick alternative to BLAST, theSanta Cruz In Silico PCR tool (http://genome.ucsc.edu/cgi-bin/hgPcr?command=start) offers a straightforward sys-tem that indicates the expected PCR product sequence fromprimer designs submitted by the user from comparisons to thecurrent human reference nucleotide sequence. This tool ishighly recommended since it provides a simple check beforecommitting to primer purchases.
3. Exploring haplotype block structure maps: Haploview andSNPBrowserTM.Haploview (http://www.broad.mit.edu/mpg/haploview/) isan essential adjunct to HapMap browsing comprising a Javaapplet tool that permits the analysis and visualizationof haplotype block patterns in HapMap data, choosingtagSNPs (7, 8), and estimating haplotype frequencies (seeSection 3.4).The Applied Biosystems SNPBrowserTM tool (http://
marketing.appliedbiosystems.com/mk/get/snpb_landing)provides a stand-alone database of five million Celera SNPsthat is downloaded to the user’s PC and can therefore beaccessed offline or in parallel to online searches. The SNPdata are presented as a chromosome segment map showinghaplotype block distributions defined by Celera’s own pair-wise analysis of 160,000 SNPs (termed ‘‘backbone validated
SPB-145152 3 June 13, 2009 Time: 10:28 Proof 1
SNP Databases
481
482
483
484
485
486
487
488
489
490
491
492
493
494
495
496
497
498
499
500
501
502
503
504
505
506
507
508
509
510
511
512
513
514
515
516
517
518
519
520
521
522
523
524
525
526
527
528
UNCORRECTE
DPROOF
SNPs’’), so it provides an alternative toHapMap in the annota-tion of human haplotype blocks, although it can display bothHapMap and Celera haplotype maps. Additionally, SNPBrow-serTM is easily configured to tailor haplotype block annotationdisplayed, SNP type, population studied, and size of the regionshown. SNPBrowserTM works along the same lines as Assays-on-Demand in providing a shopping list of SNPs based onuser’s criteria that can then be ordered as commercial single-plex (Applied Biosystems TaqManTM) or multiplex (AppliedBiosystems SNPlexTM) SNP genotyping assays.
4. Mapping SNPs and mutations in genes: SNPper.
SNPper provides a tool for the extraction and re-presentationof SNP dataAQ7 from public databases focused on coding regions,offering the clearest system for scrutinizing SNP positions inand around genes (9). Once the user has provided the geneidentifier, SNPper will list exonic, intronic, and 50/30-regions,plus embedded SNP positions within these, either as a a plainnucleotide sequence or as triplet code groups with theiramino acid codes. Although the same output can be achievedwith GenBank and Santa Cruz nucleotide browsers, SNPperis a much quicker and simpler system for listing SNPs in agene of interest with a clean and intuitive graphical summaryof the gene. This particularly suits the cataloguing of muta-tion sites in coding regions since these are usually defined bythe amino acid changes they produce and SNPper allows theiridentification in relation to the SNP landscape that surroundsthem, providing a straightforward way to develop genotypingassays.
5. Exploring the effect of SNPs on gene action: PupaSuite,Polyphen, and ESEfinder.PupaSuite (‘‘Pupa’’ stands for putative phenotype alterations)encompasses two tools – PupaSNP and SNPeffect – that aidthe identification of SNPs effecting the processing of genes(10, 11), namely, sites of intron/exon boundaries or exonicsplicing enhancers (ESEs), predicted transcription factorbinding sites, and amino acid sequence changes. PupaSuiteworks with the Ensembl gene annotation and SNP data-base and can process an uploaded SNP list, but the usercan also provide individually identified SNP sites with theaim of exploring their effect on gene action. The utility ofPupaSuite is the ability to explore the effect of SNPs ontranscriptional activity and splicing as well as proteinsequence – an increasingly important step when analyzingcoding regions.PolyPhen (http://genetics.bwh.harvard.edu/pph/data/
index.html) is a tool that usefully predicts the possible impactof an amino acid sequence change on the properties of a
SPB-145152 3 June 13, 2009 Time: 10:28 Proof 1
Phillips
529
530
531
532
533
534
535
536
537
538
539
540
541
542
543
544
545
546
547
548
549
550
551
552
553
554
555
556
557
558
559
560
561
562
563
564
565
566
567
568
569
570
571
572
573
574
575
576
UNCORRECTE
DPROOF
protein (12). Although it will not accept nucleotide inputdirectly as it holds a nonsynonymous SNP database compris-ing about 50,000 SNPs from dbSNP, PolyPhen can checkwhether a SNP is nonsynonymous or not, using the site toolSNP2Prot. Effects on proteins are tentatively defined asunknown, benign, possibly damaging, and probably dama-ging. Users can input rs-numbers directly for comparisonagainst the PolyPhen data, but they are advised to go directlyto PupaSuite for novel coding SNPs discovered in their study.As with SNPper, this tool is particularly applicable to thecharacterization of mutations that are, by definition, SNPsat very low frequency.Of the three tools that help define SNP effects, the most
specialized is ESEfinder (http://exon.cshl.edu/ESE/), atool dedicated to identifying precursor RNA splice sitechanges from SNPs sited at exonic splicing enhancers (ESEs)(13). As such, SNPs at the ESE positions of proteins thatroutinely undergo alternative splicing can profoundly affectthe final protein structure. ESEfinder makes use of databasesof different ESE sequence motifs to help identify putativeSNPs influencing splice patterns.
6. Using SNP haplotypes to detect signatures of selection: Hap-lotter and SWEEPTM.Compared with the tools available for studying gene andgenome structure described above, population geneticstools are latecomers to SNP database analysis. Data of gen-ome-wide patterns of polymorphic marker variation provide apowerful tool for studying the history of migration, bottle-necks/expansions, and adaptation in human populations. Forthose interested in analyzing such events, a major advantagein using SNP data is the distribution of SNPs at much higherdensities compared with microsatellite or insertion–deletionvariation and in the advanced characterization of SNP-basedhaplotypes. Therefore, SNPs are obvious candidate markersfor the analysis of patterns of haplotype structure that canindicate signatures of past natural selection. Positive selectionwill amplify the frequency of a particular haplotype surround-ing a favorable, novel gene variant because the haplotypeaccompanying the variant on the same chromosome strandalso rises rapidly in frequency throughout the population.Before recombination disrupts this association, much higherSNP homozygosity is seen, as identical haplotypes are morelikely to be found on each chromosome. Therefore, homo-zygosity is raised in the immediate vicinity of the selected genevariant and diminishes with distance, as recombinationincreasingly breaks up associations. This is the basis of theextended haplotype homozygosity (EHH) test that aims to
SPB-145152 3 June 13, 2009 Time: 10:28 Proof 1
SNP Databases
577
578
579
580
581
582
583
584
585
586
587
588
589
590
591
592
593
594
595
596
597
598
599
600
601
602
603
604
605
606
607
608
609
610
611
612
613
614
615
616
617
618
619
620
621
622
623
624
UNCORRECTE
DPROOF
detect signatures of recent selection by analyzing irregularlylong haplotype homozygosity patterns (14). Two tools areavailable for EHH analysis: Haplotter uses HapMap data andis accessed online, while SWEEP is a stand-alone program thatcan use data from any source that has been phased (i.e., allelecombinations assigned to one of two strands).
Haplotter (http://hg-wen.uchicago.edu/selection/hap-lotter.htm) measures a value iHS (15) that expresses thecontrast between haplotypes with changed frequencies andthe surrounding genome landscape, so it can reveal frequencyrises in ancestral alleles (positive contrasts as the alleleincreases in frequency) as well as in variant alleles (negativecontrasts). Haplotter can work from gene identifiers or asingle SNP landmark (slower and varied in coverage). Theprogram returns plots of iHS, plus standard selection signa-ture or population diversity measuresH,D, and Fst, followedby a table of adjacent genes, colored light blue when showingsignificant evidence of selection. The major advantage ofHaplotter is it allows an unbiased approach to finding regionswith indications of recent selection, so in use it is likely toreveal interesting new candidates for more detailed study.This can enable studies to focus on the phenotypes such lociexhibit as a way to explore differences in susceptibility todisease between populations. An advantage of using HapMapdata is that the study populations will be extended to allowexamination of more widely distributed patterns of localselection.The stand-alone program SWEEPTM (http://www.
broad.mit.edu/mpg/sweep/) acts like Haplotter to measurethe rate of decay of homozygosity with distance from putativeregions subject to selection (14). Although it requires timeand care to become familiar with use of the program, thegraphical output, particularly diagrams termed ‘‘bifurcationplots,’’ provides very good representations of results summar-izing extended homozygosity versus genomic distance to thecore haplotypes.SPSmart (http://spsmart.cesga.es/) is a tool that performs
the simple task of re-presenting SNPAQ8 allele frequency datafrom multiple sources as pie charts identical to those of theHapMap browser. So SPSmart allows the user to review SNPvariability across a wider range of populations than is feasiblefrom single databases accessed one by one. This appears tooffer little extra value if, for example, the study populations ofHapMap phase II and Perlegen are considered, with only acomparison of YRI Africans and African-Americans of poten-tial interest. However, SPSmart also processes data from theStanford and Michigan University initiatives that have
SPB-145152 3 June 13, 2009 Time: 10:28 Proof 1
Phillips
625
626
627
628
629
630
631
632
633
634
635
636
637
638
639
640
641
642
643
644
645
646
647
648
649
650
651
652
653
654
655
656
657
658
659
660
661
662
663
664
665
666
667
668
669
670
671
672
UNCORRECTE
DPROOF
genotyped some 650,000 SNPs in the CEPHhuman genomediversity panel (HGDP) comprising over 1,000 samples from51 global populations. Incorporation of HapMap phase IIIpopulations has also boosted the scope of global variabilitythat can be accessed with SPSmart.
3. Methods
3.1. Finding Sets ofSNPs That ShareParticularCharacteristics: NCBIEntrez and BooleanRules of DatabaseSearching
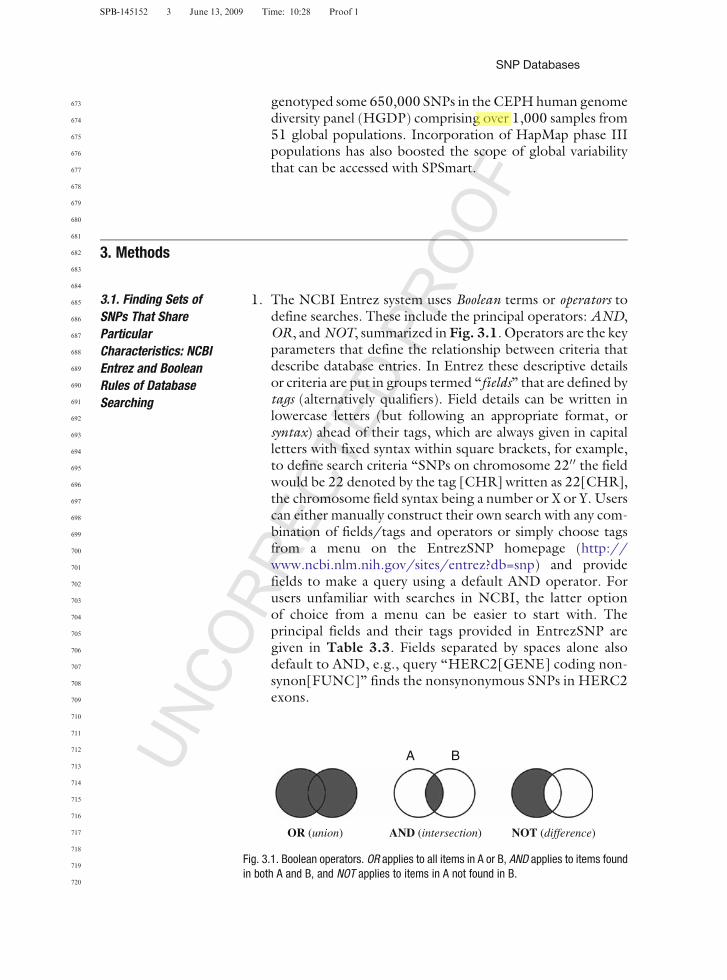
1. The NCBI Entrez system uses Boolean terms or operators todefine searches. These include the principal operators: AND,OR, andNOT, summarized inFig. 3.1. Operators are the keyparameters that define the relationship between criteria thatdescribe database entries. In Entrez these descriptive detailsor criteria are put in groups termed ‘‘fields’’ that are defined bytags (alternatively qualifiers). Field details can be written inlowercase letters (but following an appropriate format, orsyntax) ahead of their tags, which are always given in capitalletters with fixed syntax within square brackets, for example,to define search criteria ‘‘SNPs on chromosome 2200 the fieldwould be 22 denoted by the tag [CHR] written as 22[CHR],the chromosome field syntax being a number or X or Y. Userscan either manually construct their own search with any com-bination of fields/tags and operators or simply choose tagsfrom a menu on the EntrezSNP homepage (http://www.ncbi.nlm.nih.gov/sites/entrez?db=snp) and providefields to make a query using a default AND operator. Forusers unfamiliar with searches in NCBI, the latter optionof choice from a menu can be easier to start with. Theprincipal fields and their tags provided in EntrezSNP aregiven in Table 3.3. Fields separated by spaces alone alsodefault to AND, e.g., query ‘‘HERC2[GENE] coding non-synon[FUNC]’’ finds the nonsynonymous SNPs in HERC2exons.
SPB-145152 3 June 13, 2009 Time: 10:28 Proof 1
OR (union)
A B
AND (intersection) NOT (difference)
Fig. 3.1. Boolean operators. OR applies to all items in A or B, AND applies to items foundin both A and B, and NOT applies to items in A not found in B.
SNP Databases
673
674
675
676
677
678
679
680
681
682
683
684
685
686
687
688
689
690
691
692
693
694
695
696
697
698
699
700
701
702
703
704
705
706
707
708
709
710
711
712
713
714
715
716
717
718
719
720
UNCORRECTE
DPROOF
2. As a worked example, a search could be written longhand:‘‘find unique SNPs in dbSNP on human chromosome 22 thatare AC substitutions and show heterozygosity of more than45%.’’ To perform a manual EntrezSNP search, place thefollowing search description in the search box: 1[MPWT]AND human[ORGN] AND 22[CHR] AND M[ALLELE]AND 45:50[HET]. Note the field/tag items follow the sameorder as the longhand query, but this is not essential. TheIUPAC allele codes applicable to the [ALLELE] field/tagare listed in Table 3.4. To perform the same search usingthe Entrez menu system, go to the limits menu – http://www.ncbi.nlm.nih.gov/sites/entrez?db=snp&TabCmd=Limits – and choose tick boxes in (respectively) Map Weight,Organism, Chromosome, Variation Allele, and Heterozygosity.
3. Note that the heterozygosity tag in the above example searchuses ranging: a range of values to define the field, described bya colon (:) in the middle of range limits. The menu-based
SPB-145152 3 June 13, 2009 Time: 10:28 Proof 1
Table 3.3Key EntrezSNP fields and their tags
Description Tag Search field used Example query
Observedalleles
[ALLELE] IUPAC allele code(see Table 3.4)
R[ALLELE] find SNPs with A/Gsubstitutions
Chromosome [CHR] Number/X, Y 21[CHR] OR 22[CHR] find SNPs onchromosomes 21 & 22
Base position [BPOS] Ranged number &AND & [CHR]
18000:28000[BPOS] AND Y[CHR]–findSNPs in 10 kb segment of Y chromosome
Heterozygosity [HET] Ranged number 30:50[HET] find SNPs with heterozygosityvalue in range 30–50%
Function Class [FUNC] Locus region,intron, etc. (8 intotal)
Coding nonsynon[FUNC]
Build [CBID] Number 125[CBID] search build 125
Gene location [GENE] Gene symbol DARC[GENE] search for SNPs in Duffyblood group, chemokine receptor
Genotypingmethod
[METHOD] Description as listedat URL below
Hybridize[METHOD] search for SNPsfound by chip hybridization
NOT (2[HIT] OR 3[HIT]) exclude SNPsmapping twice or more in genome
SNP single nucleotide polymorphism.
Phillips
721
722
723
724
725
726
727
728
729
730
731
732
733
734
735
736
737
738
739
740
741
742
743
744
745
746
747
748
749
750
751
752
753
754
755
756
757
758
759
760
761
762
763
764
765
766
767
768
UNCORRECTE
DPROOF
system only allows heterozygosity ranges of 10%, so fine-tuned searches such as 49–50% heterozygosity require man-ual construction. Two other modifiers of operator functionexist for manual searches: parentheses and the wild-card aster-isk (*). Parentheses group search terms into logical sets toobtain items that further operations can search. To a largeextent, the logic follows that used in a normal sentence, forexample, in a PubMed search ‘‘find articles on the effects ofheat and humidity on multiple sclerosis’’ is (heat OR humid-ity) ANDmultiple sclerosis, while ‘‘find articles on the effectsof heat as well as the effects of humidity on multiple sclerosis’’is heat OR (humidity ANDmultiple sclerosis). The wild-cardasterisk in place ofmissing text allows a partial entry to be usedas a query term, e.g., using BRC*[GENE] will find bothBRCA1 and BRCA2 genes.
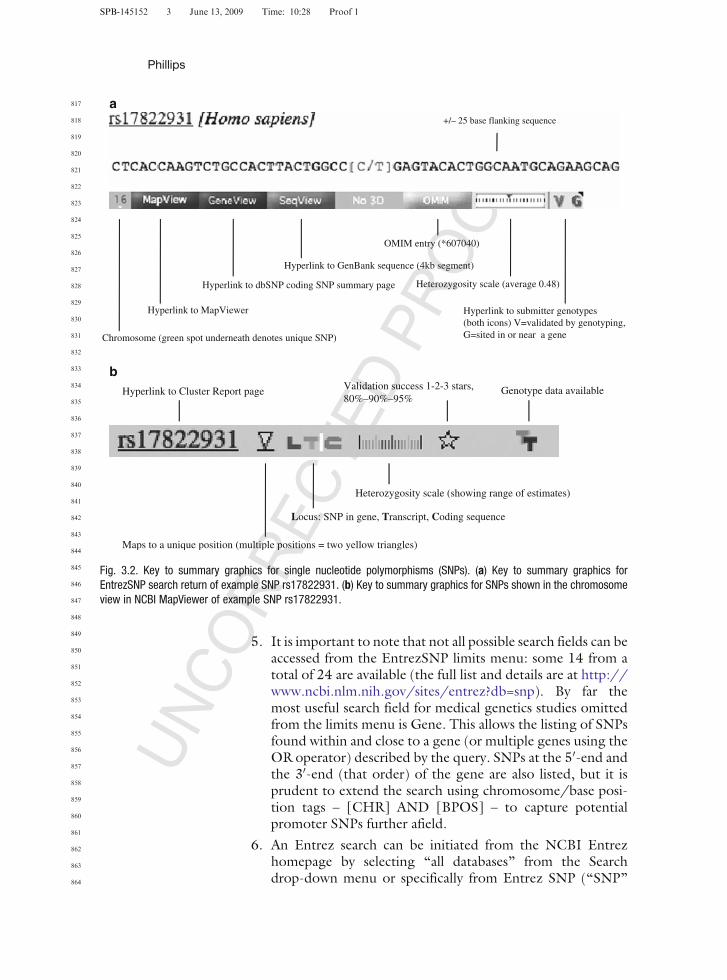
4. Each SNP in the EntrezSNP list that is returned from a querydefaults to a summary graphic with components that describethe key parameters of the SNP, outlined in Fig. 3.2a. For theabove example, query EntrezSNP lists 911 SNPs in order ofchromosome position. If multiple chromosomes are listed,these are in order: Y, X, 22, 21, etc. A useful feature is theability to change the default listing order amongst six options,including SNP ID (ascending rs-number) and heterozygos-ity. When assessing the role of particular SNPs in a diseaseprocess or by association with a candidate region, a particu-larly useful feature is the ‘‘Cited in PubMed’’ tab. Click the‘‘Links/Pubmed (SNPCited)’’ hyperlinks in this list to obtaineach publication abstract.
SPB-145152 3 June 13, 2009 Time: 10:28 Proof 1
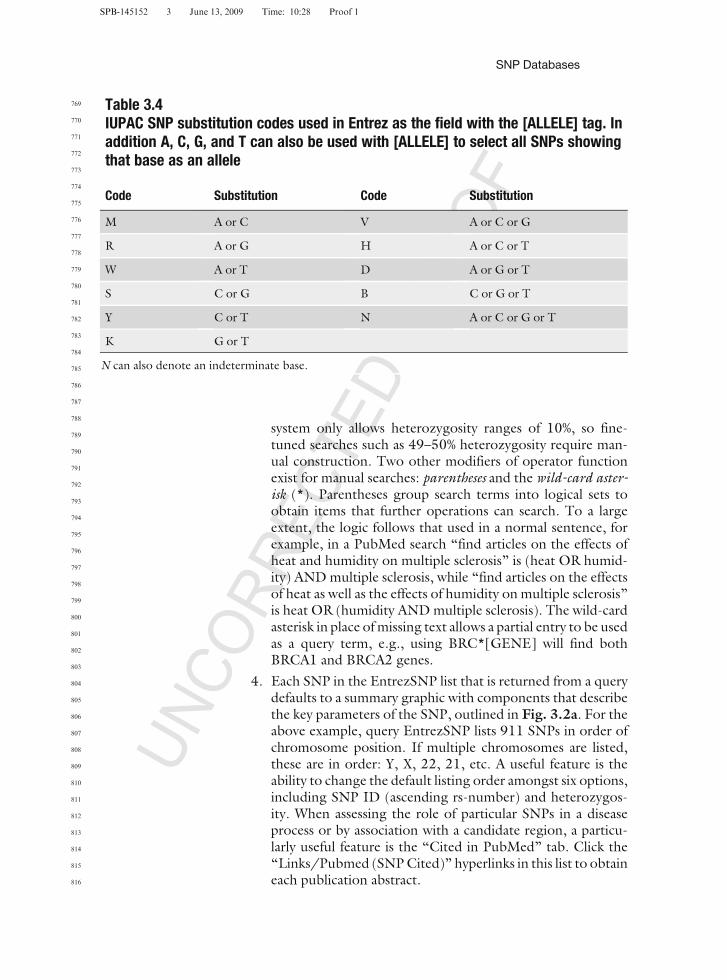
Table 3.4IUPAC SNP substitution codes used in Entrez as the field with the [ALLELE] tag. Inaddition A, C, G, and T can also be used with [ALLELE] to select all SNPs showingthat base as an allele
Code Substitution Code Substitution
M A or C V A or C or G
R A or G H A or C or T
W A or T D A or G or T
S C or G B C or G or T
Y C or T N A or C or G or T
K G or T
N can also denote an indeterminate base.
SNP Databases
769
770
771
772
773
774
775
776
777
778
779
780
781
782
783
784
785
786
787
788
789
790
791
792
793
794
795
796
797
798
799
800
801
802
803
804
805
806
807
808
809
810
811
812
813
814
815
816
UNCORRECTE
DPROOF
5. It is important to note that not all possible search fields can beaccessed from the EntrezSNP limits menu: some 14 from atotal of 24 are available (the full list and details are at http://www.ncbi.nlm.nih.gov/sites/entrez?db=snp). By far themost useful search field for medical genetics studies omittedfrom the limits menu is Gene. This allows the listing of SNPsfound within and close to a gene (or multiple genes using theOR operator) described by the query. SNPs at the 50-end andthe 30-end (that order) of the gene are also listed, but it isprudent to extend the search using chromosome/base posi-tion tags – [CHR] AND [BPOS] – to capture potentialpromoter SNPs further afield.
6. An Entrez search can be initiated from the NCBI Entrezhomepage by selecting ‘‘all databases’’ from the Searchdrop-down menu or specifically from Entrez SNP (‘‘SNP’’
Hyperlink to submitter genotypes(both icons) V=validated by genotyping,G=sited in or near a gene
Hyperlink to Cluster Report page
Maps to a unique position (multiple positions = two yellow triangles)
Locus: SNP in gene, Transcript, Coding sequence
Heterozygosity scale (showing range of estimates)
Validation success 1-2-3 stars,80%–90%–95%
Genotype data available
Fig. 3.2. Key to summary graphics for single nucleotide polymorphisms (SNPs). (a) Key to summary graphics forEntrezSNP search return of example SNP rs17822931. (b) Key to summary graphics for SNPs shown in the chromosomeview in NCBI MapViewer of example SNP rs17822931.
Phillips
817
818
819
820
821
822
823
824
825
826
827
828
829
830
831
832
833
834
835
836
837
838
839
840
841
842
843
844
845
846
847
848
849
850
851
852
853
854
855
856
857
858
859
860
861
862
863
864
UNCORRECTE
DPROOF
from the same menu). While searches from the EntrezSNPhomepage return just a list of SNPsmeeting the criteria, usingthe all databases option creates an NCBI-wide search withhyperlinked numbers of entries from 35 different databasesthat can be explored individually: making a good startingpoint in the early stages of a genetic study. The cross-databasereturns page groups six text-based databases, 26 genomicdatabases, and three catalogues (books, journals, and MeSHvocabulary) into three separate boxes. A cross-database searchcan be made using specific or general terms to obtain, respec-tively, a focused query of the broadest possible coveragewithin NCBI or a more open ended survey. For instance,‘‘rs2293855’’ as a query returns a single PubMed referenceto a possible role of this SNP in obesity, however with noreference to the gene MTMR9, where it resides, while ‘‘obe-sity’’ as a query lists no specific SNPs, but more than 111,000publications and 681 genes, including MTMR9.
7. EntrezSNP gives the most efficient system for progressivesearches as the lists generated can be stored in a clipboardand then sent to MyNCBI (avoiding an 8 h inactivity deletestep for the clipboard), exported as a text file, combined withnew searches, or re-searched itself. This uses the clipboard andhistory tabs at the top of the EntrezSNP page. The clipboardis a workspace for holding up to 500 items, while history liststhe database search activity as numbers prefixed by a hash (#).Making Entrez searches at different times by exporting toMyNCBI allows the user to monitor the number of returnsobtained with different search term combinations. Previoussearches can be combined as hash fields with operators (e.g.,#1 AND #2 gives items common to both searches). It is alsopossible to use hash fields together with normal fields, helpingto build a stepwise record of the search process as it is mod-ified in incremental stages.
8. To automatically reduce SNP numbers returned by a search,certain fields are best used as filters with fixed values includingthe organism and map weight. Therefore use of the huma-n[ORGN] field/tag ensures only human SNPs are listed and1[MPWT] ensures all SNPs are unique (i.e., single mapweight). The SNP validation tag also provides a system tofilter out SNPs detected by sequence comparisons alone,using by frequency[VALIDATION]..
3.2. Obtaining DetailedInformation on a SNP:dbSNP Cluster Reports
1. The Cluster Report page of dbSNP provides most, if not all,the information needed to assess the characteristics of a SNPand design a genotyping assay if required. Each page is brokendown into seven sections with largely self-explanatory
SPB-145152 3 June 13, 2009 Time: 10:28 Proof 1
SNP Databases
865
866
867
868
869
870
871
872
873
874
875
876
877
878
879
880
881
882
883
884
885
886
887
888
889
890
891
892
893
894
895
896
897
898
899
900
901
902
903
904
905
906
907
908
909
910
911
912
UNCORRECTE
DPROOF
SPB-145152 3 June 13, 2009 Time: 10:28 Proof 1
UNCORRECTE
DPROOF
headings: Submitter records; Fasta Sequence; GeneView;Integrated Maps; NCBI Resource Links; Population Diver-sity; and Validation Summary. This section of the chapteroutlines the steps required to (1) obtain sufficient contextsequence to design a genotyping assay, (2) scrutinize the mapposition of the SNP with accompanying genomic features,and (3) begin analysis of the population variation shown bythe SNP.
2. The Fasta section is named after the fast-all sequence similar-ity program used by dbSNP to detect identical SNP submis-sions given in the Submitter section (see Note 4). Fasta liststhe flanking sequence surrounding the SNP position – thequantity of nucleotides listed is variable in extent but alwaysarranged as groups of ten bases, six groups per line, with theSNP positioned on a separate line as an IUPAC code base.The single Fasta header line contains summary locus detailsexplained in the ‘‘Legend’’ hyperlink in the title above. Reli-ance on dbSNP Fasta sequence alone for primer designs cancause problems (see Note 10); however, one clear advantageof dbSNP Fasta is the inclusion of information from the initialsubmitter and from RepeatMasker analysis (see Note 11)which predicts the likely genomic uniqueness of the SNPcontext sequence. This can help avoid certain sequence seg-ments that may occur in multiple genomic locations andtherefore reduce the specificity of any genotyping assaydesigns.
3. An essential additional aid to the primer design process is theneighbor SNP detection tool found in the Integrated Mapssection. Clicking on the ‘‘View’’ hyperlink under the Neigh-bor SNP heading of each assembly (for ref_assembly: i.e., thereference sequence is recommended) gives all SNPs within –100 bp of the reported SNP, including at 0 bp, the targetsubstitution itself. This permits easy location and masking ofvariable sites that can interfere with the predictable binding ofprimers designed for the assay.
4. GeneView gives a graphical overview of the SNP if it is locatedin a gene, giving a position mark using nine color codes forone of 16 predicted functions (hyperlink guide: color legend).The cSNP radio button directs one to the coding SNP listingpage for each gene (see Note 6).
5. The Integrated Maps section provides a ‘‘snapshot’’ genomeview of the SNP position as a red mark-point by clicking thechromosome number hyperlink. This whole genome view canbe used to map a series of SNPs by using the OR operatorbetween each rs-number in the query string in the search box.Including ‘‘NOT Celera’’ eliminates the double mark-pointsand position listing (see Note 7). From this overall map any
Phillips
913
914
915
916
917
918
919
920
921
922
923
924
925
926
927
928
929
930
931
932
933
934
935
936
937
938
939
940
941
942
943
944
945
946
947
948
949
950
951
952
953
954
955
956
957
958
959
960
UNCORRECTE
DPROOF
chromosome can be viewed in detail in NCBI MapViewer,centered on the SNP position by clicking the number hyper-link of each chromosome showing a mark-point. Once inMapViewerAQ9 , configure the view by clicking ‘‘maps andoptions’’ to show the ‘‘Variation’’ map as the master toensure a summary icon set accompanies each SNP position(outlined in Fig. 3.2b). Any number of other tracks (mapcomponents) can be selected as part of the genome land-scape around the SNP, although the single most useful ofthese is Gene.
6. The Population Diversity section summarizes SNP allelefrequency distributions in different populations using gold(reference allele) and blue (alternative allele) bars. Clickingon ‘‘Genotype Detail’’ provides the Genotype and AlleleFrequency Report (still in beta status at the time of publica-tion). It is possible to obtain the individual SNP genotypessubmitted from each contributing laboratory – data that canbe particularly useful when using standard DNA samples,such as Coriell panels (http://ccr.coriell.org/), as geno-typing controls in an assay. The easiest way to achieve thisdirectly fromHapMap, the major source of SNP populationvariability data in dbSNP, is to go to the individual SNPinformation page in HapMap (http://www.hapmap.org/cgi-perl/snp_details? name=rsnumber) and click the‘‘retrieve genotypes’’ hyperlinks. Genotypes are alwayslisted in the same sample-ID order and so can be down-loaded directly to Excel and correctly ordered as rows perpopulation per SNP using the text to columns option (seeNote 1).
3.3. Exploring SNPs inCoding Regions:SNPper and PupaSuite
1. SNPper requires a subscription before the user can explorea gene of interest which can be found using ‘‘Gene Finder’’by inputting standard identifiers (see Note 8). Once thegene has been obtained, click on the ‘‘Annotated’’sequence hyperlink to obtain the nucleotide listing markedas follows: green, 50/30; black lowercase, exonic noncod-ing; black uppercase, coding; gray, intronic; blue under-lined, SNPs. A useful approach for the reliable detection ofmutations or scrutiny of coding SNPs is to click ‘‘Viewamino acid sequence’’ to obtain the coding nucleotides astriplet codes above their accompanying amino acids. Tolocate a novel mutation from the standard ‘‘wild-typeamino acid/codon/variant amino acid’’ format as normallyreported in the literature (e.g., V60L in MC1R) it isnecessary to carefully count the relevant nucleotide andcodon numbers from the leftmost reference numbers (pen-cil annotations of a printout are recommended).
SPB-145152 3 June 13, 2009 Time: 10:28 Proof 1
SNP Databases
961
962
963
964
965
966
967
968
969
970
971
972
973
974
975
976
977
978
979
980
981
982
983
984
985
986
987
988
989
990
991
992
993
994
995
996
997
998
999
1000
1001
1002
1003
1004
1005
1006
1007
1008
UNCORRECTE
DPROOF
2. PupaSuite can accept a list of genes using Ensembl or GeneIDidentifiers or can review a defined chromosome segment tosearch for SNPs and suggest an effect. PupaSuite is of parti-cular interest if novel or uncharacterized SNPs are beingstudied as there is the opportunity to apply the same predic-tive tools to these loci. To explore the above three options,upload the relevant data to ‘‘Upload/paste file of genes,’’‘‘Search a region,’’ and ‘‘Have you got new SNPs?’’, respec-tively. There is an option to define gene flanking regions asnumbers of nucleotides upstream of the translation start siteto find SNPs that may affect transcription factor binding sites.Therefore, PupaSuite is a particularly useful tool for the iden-tification of SNP sites associated with changes to intron/exonboundaries or transcription factor binding. Lastly, additionalfunctional annotations are provided to help assess the impactof the uploaded SNPs, including gene ontology, homologydata, and OMIM references.
3.4. Simple Reviewingof SNP Haplotype BlockStructure: HapMap
1. Users new to SNP analysis may hesitate before undertakingthe process of analyzing human haplotype block structure inregions of interest. The accurate mapping of haplotypeblocks, interpretation of D’ and r2 values, selecting tagSNPs to track blocks (3, 4, 7, 8), and assessment of gen-ome-wide patterns of association are all specialist tasks need-ing care and experience (16). However, all current geneticanalysis approaches require an understanding of the likelypatterns of association between a set of SNPs and correlatinggenes or regions of interest; therefore, using HaploViewwithin the HapMap database browser can provide a simpleoverview to start this process. Once HaploView has beeninstalled on the user’s own PC as a Java applet, it is possibleto work directly on data from HapMap or Perlegen, but it iseasier to start by configuring and viewing LD maps in theHapMap genome browser.
2. Add a gene (or region) of interest to the ‘‘Landmark orRegion’’ search box and tick the three ‘‘Analysis’’tracks: Phased Haplotype Display, LD Plot, and tagSNP Picker. Clearer graphics can be obtained by initi-ally selecting one population at a time by selecting eachof ‘‘Annotate LD Plot/Phased Haplotype Display’’AQ10 andclicking ‘‘Configure. . .,’’ then choosing a single popula-tion radio button.
3. The phased haplotype display presents the alternative haplo-type blocks as blue and yellow segments matching the chro-mosome lengths occupied. The ease with which the user caninterpret these depends on the number and length of thehaplotypes in the region displayed. As an example, a very
SPB-145152 3 June 13, 2009 Time: 10:28 Proof 1
Phillips
1009
1010
1011
1012
1013
1014
1015
1016
1017
1018
1019
1020
1021
1022
1023
1024
1025
1026
1027
1028
1029
1030
1031
1032
1033
1034
1035
1036
1037
1038
1039
1040
1041
1042
1043
1044
1045
1046
1047
1048
1049
1050
1051
1052
1053
1054
1055
1056
UNCORRECTE
DPROOF
simple pattern is shown by ATM: a large but highly conservedgene (strong selective constraints apply to ATM, OMIM:607585). The phased haplotype plot clearly shows that twohaplotypes account for almost two equal halves of the CEUsample. No fewer than 27 of the 31 blocks define this divisionand the pattern is underlined by a series of identical equal-segment CEU pie charts for the genotyped SNPs in ATM.Note that at blocks 7 (left to right) and 13 a third and fourthcommon haplotype can be discerned and the third haplotypeis characterized by different SNP alleles at blocks 17, 23, 25,29, and 30. Finally, a singleton (literally a single CEU sample)and aminor-frequency haplotype can be seen in blocks 25 and29, respectively. The pattern shown by ATM is, in fact, rela-tively common in the human genome and is termed ‘‘yin–yang haplotypes’’ (17).
4. The LD plots represent the extent of LD between SNPs in theregion queried shown as inverted pyramid graphics. Thedefault color scale, also in widespread use in the literature,shows maximum LD as dark red blocks and minimum LD aslight gray blocks. Two example genes, CAPG and DTNBP1,illustrate how these plots can summarize both simple andcomplex predicted LD patterns: showing, respectively, a sin-gle, simple pyramid and multiple overlapping pyramids withheterogeneous LD values within each pyramid (checker-boards of red and gray blocks). While this partly reflectsgene size and therefore SNP density (note the sevenfolddifference between each gene), LD plots can provide a sum-mary overview of recombination and SNP association pat-terns in the region.
5. The Tag SNP display, once configured, updates automaticallybetween genes and many users may wish to rely just on thissystem to collect tag SNPs to combine with other core loci(nonsynonymous coding SNPs and translation/transcription-modifying SNPs identified by PupaSuite) to construct simpledirected association studies. Although this process has largelybeen replaced by a standard two-stage approach of whole-gen-ome scans then follow-up directed SNP genotyping, HapMapbrowsing can give a simple system for assessing the transport-ability, i.e., the applicability of a tag in multiple populations (8),power, and positioning of the tag SNPs that now form the corebattery of markers in whole-genome analyses.
3.5. AssessingPopulation GeneticsParameters fromOnline SNP Data:Haplotter and SPSmart
1. Haplotter provides a useful way to begin exploring thepopulation genetics parameters of iHS (outlined in Sec-tion 2.2.5), H, D, and Fst, in a genomic region. Queriesare initiated by chromosome region, gene, or SNP and thiswill return four graphics which summarize the above-
SPB-145152 3 June 13, 2009 Time: 10:28 Proof 1
SNP Databases
1057
1058
1059
1060
1061
1062
1063
1064
1065
1066
1067
1068
1069
1070
1071
1072
1073
1074
1075
1076
1077
1078
1079
1080
1081
1082
1083
1084
1085
1086
1087
1088
1089
1090
1091
1092
1093
1094
1095
1096
1097
1098
1099
1100
1101
1102
1103
1104
UNCORRECTE
DPROOF
mentioned parameters in the same order, with plots foreach of the three HapMap panels (i.e., CHB and JPTpopulations are combined as panel ASN). The Fst graphicplots the three population comparisons to give a usefuloverview of genomic divergence – in particular the outliersplotted as single points can highlight those SNPs thatshow very strong interpopulation diversity. A table isgiven of iHS values around the region of interest withlevels diagnostic of EHH highlighted in blue. An often-quoted example that users can investigate for themselves isthe gene LCT (gene-ID 3938), this shows a very broadpeak of elevated iHS in the CEU population extendingwell beyond the LCT chromosome region, underlined byhigh CEU-YRI and CEU-ASN Fst values and blue-labelediHS levels in the accompanying table. Both the originalstudy of selection patterns in LCT (18) and the Haplotterpaper (1) ably explain these patterns.
2. In a fashion identical to Haplotter, SPSmart reviews aregion, gene, or SNP list with the primary aim of summariz-ing the population variability found in multiple SNP data-bases as pie charts and key population metrics: observed H(heterozygosity), expected H, Fs, Fst, and divergence (In).Usefully SPSmart also pulls from dbSNP chromosome andposition, validation status, reference and ancestral allele, andthe minor allele frequency, providing alongside the popula-tion metrics a succinct one-line summary of each SNP.To explore the population variability of a set of SNPs,choose the SNP databases from HapMap phase II, HapMapphase III, Perlegen, and Stanford/Michigan CEPH-HGDP(4, 4+7, 3, and 51 populations, respectively) and provide thers-numbers or locations. Clicking ‘‘metasearch’’ permitsselection of a population or any combination from each ofthe five databases (but note the overlap between HapMapphase II and HapMap phase III) prior to uploading theSNPs of interest. For example, to review European fre-quency variability for the SNP rs12075, click each of thedatabases, tick the populations of interest, (e.g., CEU, TSI,European American, Italy-Sardinian, France Basque), addthe rs12075 query to the ‘‘Search by SNPs’’ box, then(after choosing optional filters) click ‘‘search.’’ Pie chartsand population metrics (and their downloadable data) arereturned as separate tabs, while missing data are clearlylabeled. The evident Basque divergence for rs12075 demon-strates the simplicity but informative value of HapMap stylepie charts as an aid to reviewing SNP variation across multi-ple population-based databases..
SPB-145152 3 June 13, 2009 Time: 10:28 Proof 1
Phillips
1105
1106
1107
1108
1109
1110
1111
1112
1113
1114
1115
1116
1117
1118
1119
1120
1121
1122
1123
1124
1125
1126
1127
1128
1129
1130
1131
1132
1133
1134
1135
1136
1137
1138
1139
1140
1141
1142
1143
1144
1145
1146
1147
1148
1149
1150
1151
1152
UNCORRECTE
DPROOF
4. Notes
1. Several approaches to database searching using a PC can help theuser considerably when manipulating the data obtained from aquery. Using tabbed Web page holders in the Web browser ofchoice(InternetExplorer;Firefox;Safari)allowssimpleswitchingbetween pages. While much SNP data is numerical, all informa-tion can be uploaded to a simple individual database in Excel,which now also offers sophisticated text-handling capacity, foroffline processing. Although it is rarely recommended by specia-lists, Excel can offer a simple stand-alone database system byadapting cells to use functions such as LOOKUP, COUNTIF,or those specifically geared to database searches prefixed with‘‘D,’’ such as DGET. Excel compensates for a lack of power byproviding a simple and easily mastered set-up of small-scale per-sonal databases suiting many SNP studies. The ‘‘Text to Col-umns’’ tool in the Excel ‘‘Data’’menu is a straightforwardway todirectly process plain text files downloaded from theWeb, whilepreserving the structure of data items separated by spaces, semi-colons, or other delimiters. Simple text editors themselves arehighlyefficient systems forholdingandsearchingdata.Forexam-ple, it is possible to find a single SNP amongst a list of 650,000 inreal time using the ‘‘Find’’ function available in all text editors.
2. Google can be used directly to search for specific items such asrs-numbers or mitochondrial substitution sites – the latterbeing a particularly fruitful approach to finding medical orpopulation studies reporting diagnostic mitochondrial haplo-types (19). For example, entering the search string ‘‘humanmtDNA G6261A’’ into Google provides a list of papersreporting this mutation and a supposed role as a cancer riskfactor. Care should be taken to ensure full use of the adjacencyfunction of Google searches (known as the Boolean operatorNEAR), which is not part of most genome database searchengines. Therefore, to avoid very long lists of returns, it isadvisable to include terms such as human mtDNA alongsidethe standard Cambridge Reference Sequence descriptions. Asa compliment to PubMed queries, Google Scholar (http://scholar.google.com/advanced_scholar_search) should alsobe part of every researcher’s online SNP query bookmarks.
3. HapMap experienced minor problems when collating projectdata generated in different genotyping centers for the sameSNP sites, for example, SNP rs1355497 was amongst 37SNPs reported as showing fixed-difference allele frequencies(1) but has since been shown to be an invariant, mono-morphic SNP (also see Note 9).
SPB-145152 3 June 13, 2009 Time: 10:28 Proof 1
SNP Databases
1153
1154
1155
1156
1157
1158
1159
1160
1161
1162
1163
1164
1165
1166
1167
1168
1169
1170
1171
1172
1173
1174
1175
1176
1177
1178
1179
1180
1181
1182
1183
1184
1185
1186
1187
1188
1189
1190
1191
1192
1193
1194
1195
1196
1197
1198
1199
1200
UNCORRECTE
DPROOF
4. Since a SNP is characterized by the context sequence each sideof the nucleotide substitution site, it should be possible touniquely define a SNP by referencing organism, chromo-some, and base-pair position.However, a small but significantproportion of SNPs are nonunique, so the context sequenceand its likelihood of repetition in multiple locations becomecritical in identifying whether a SNP is unique or not. Thesubmission criteria of dbSNP are very effective at detectingnonunique SNPs, with a process that uses the FASTA pro-gram to check a minimum 100 bp flanking sequence to assessif the SNP can be positioned uniquely in the genome and canbe matched with other submissions of the same SNP. Theproportion of nonunique SNPs remains very small in dbSNPat about 5% and is much more common in certain regions,e.g., pericentromeric areas of each chromosome.
5. Very useful and readable guides to the routine use of theNCBI sites are detailed in a PDF handbook that can bedownloaded chapter by chapter (http://www.ncbi.nlm.nih.gov/books/bv.fcgi?rid=handbook.part.1). Chapters particu-larly relevant to SNP research include Chapters 2 (PubMed),5 (dbSNP), 7 (OMIM), 15 (Entrez), 16 (BLAST), and 20(Map Viewer). Download them by clicking the PDF icon oneach chapter summary page.
6. SNP sites are still routinely described by the amino acid sub-stitution they create rather than an rs-number, particularly ifthey are mutations or rare enough to escape detection bydbSNP. The easiest way to obtain the rs-number (if it exists)is to record the gene identification number from NCBIGene (e.g., query ‘‘MC1R AND human’’ gives GeneID4157) then go to the coding SNP part of dbSNP using thefollowing URL finishing with the ID number to obtainthe listing of known coding substitutions and their affectedamino acid residues: http://www.ncbi.nlm.nih.gov/SNP/snp_ref.cgi?locusId= number. For example, in gene MC1R,R151C is amongst the most commonly described codingSNPs, and was revealed to be rs1805007 using the proceduredescribed above.
7. Human genes are consistently identified across different data-bases by a gene symbol (sometimes termed the ‘‘gene name’’)comprising a series of uppercase letters and numbers (http://www.genenames.org/), provided by HUGO. A gene ID con-sists of a number alone and refers to the number codes givento each gene by NCBI Gene. These can be used both withinNCBI as the main point of reference for a gene (e.g., whenreviewing coding SNPs) and in certain other databases. Auseful gene ID converter tool is provided at http://idconverter.bioinfo.cnio.es/.
SPB-145152 3 June 13, 2009 Time: 10:28 Proof 1
Phillips
1201
1202
1203
1204
1205
1206
1207
1208
1209
1210
1211
1212
1213
1214
1215
1216
1217
1218
1219
1220
1221
1222
1223
1224
1225
1226
1227
1228
1229
1230
1231
1232
1233
1234
1235
1236
1237
1238
1239
1240
1241
1242
1243
1244
1245
1246
1247
1248
UNCORRECTE
DPROOF
8. Use of the single map weight filter in EntrezSNP does notlead to the exclusion of all the SNPs in dbSNP with differentCelera locations; however, the list of returns is headed bySNPs that carry the warning ‘‘Mapped unambiguously onnon-reference assembly only.’’ Note, however, that when oneuses the NCBIMapViewer (see Section 3.2.5) both referencesequence and Celera locations are marked on the genome-wide chromosome map. Therefore, it is advisable to includethe term NOT Celera at the end of a multiple SNP list inMapViewer queries.
9. Resequencing is the only method of SNP characterizationthat avoids acquisition bias. This is the phenomenon wherethe characteristics of the SNP itself affect the chances of itsdetection by genotyping methods. Examples of SNP featuresthat mean the loci are either not detected or incorrectlygenotyped by large-scale projects such as HapMap includetriallelic SNPs (the medically important CRP promoterrs3091244 being a notable example), SNPs with very lowfrequency minor alleles (also missed by resequencing if insuf-ficient samples are typed), and SNPs with very dense arrays ofclosely neighboring SNPs such as those of the hypervariablemajor histocompatibility complex. Acquisition bias can alsodescribe the process of selecting SNPs from databases usingcriteria which bias the SNP lists produced from a query.
10. Often the Fasta section lists less than 100 bp of contextsequence each side of a SNP (e.g., rs1805009) – oftenowing to the fact that a submitting laboratory only providedshort segments. The easiest way to obtain – 100 bp of contextsequence for assay primer design purposes is to use the SantaCruz genome assembly. Add the SNP rs-number to theURL http://genome.ucsc.edu/cgi-bin/hgTracks?position=rsnumber (several dbSNP builds available), click the highlightedSNP in the map, click ‘‘view DNA for this feature,’’ then opt for100bases upstream/downstream.The SNPbase is the referenceallele and is not marked so it is best to use 100+0 and 0 +100 intwo separate sequence dumps. Another potential problem in theCluster Report Fasta section is the occasional (and apparently adhoc) listing of neighbor SNPs as IUPAC codes (see Table 3.4).For example, rs1805006 includes no fewer than six other SNPsin – 100 bp of sequence, given as K, R, R, Y, R, R (in that order),that may cause problems once the sequence is inserted intoprimer design software. Processing the SNP context sequencedirectly from Santa Cruz avoids this problem.
11. Fasta section nucleotides are presented in two ways: in upper-case/lowercase letetrs and in black/green. Uppercase lettersdenote a normal, unique, genomic sequence, while lowercaseletters are used for a sequence identified by RepeatMasker
SPB-145152 3 June 13, 2009 Time: 10:28 Proof 1
SNP Databases
1249
1250
1251
1252
1253
1254
1255
1256
1257
1258
1259
1260
1261
1262
1263
1264
1265
1266
1267
1268
1269
1270
1271
1272
1273
1274
1275
1276
1277
1278
1279
1280
1281
1282
1283
1284
1285
1286
1287
1288
1289
1290
1291
1292
1293
1294
1295
1296
UNCORRECTE
DPROOF
(http://repeatmasker.genome.washington.edu/cgi.bin/RepeatMasker) as a low-complexity or repetitive elementsequence. Green denotes a sequence identified by the sub-mitter during the SNP assay process (a single green SNP basesignifying identification by sequence comparison), whileblack denotes a flanking sequence used by NCBI from thenucleotide databases as part of the SNP submission checks.
Acknowledgements
The author would like to thank Maviky Lareu, Antonio Salas, andAngel Carracedo,University of Santiago deCompostela, for usefuldiscussions in the preparation of this chapter. The work was in partsupported by funding from Xunta de Galicia: PGIDTIT06P-XIB228195PR and the Spanish MEC: BIO2006-06178.
References
1. The International HapMap Consortium.(2005) A haplotype map of the human gen-ome. Nature 437, 1299–1320.
2. The International HapMap Consortium.(2007) A second generation human haplo-type map of over 3.1 million SNPs. Nature449, 851–861.
3. Gabriel, S. B., Schaffner, S. F., Nguyen, H.,Moore, J. M., Roy, J., Blumenstiel, B. et al.(2002) The structure of haplotype blocks inthe human genome. Science 296,2225–2229.
4. Wall, J. D. and Pritchard, J. K. (2003) Hap-lotype blocks and linkage disequilibrium inthe human genome. Nat. Rev. Genet 4,587–597.
5. Ashurst, J. L., Chen, C. K., Gilbert, J. G.,Jekosch K., Keenan S.,Meidl P. et al. (2005)The Vertebrate Genome Annotation (Vega)database.Nucleic Acids Res. 33, D459–465.
6. YangAQ11 , N., Li, H., Criswell, L. A., Gregersen,P. K., Alarcon-Riquelme, M. E., Kittles, R.et al. (2005) Examination of ancestry and eth-nic affiliation using highly informative diallelicDNAmarkers.Hum.Genet.118, 382–392.
7. de Bakker, P. I., Yelensky, R., Pe’er, I., Gab-riel, S. B., Daly, M. J. and Altshuler, D.(2005) Efficiency and power in genetic asso-ciation studies.Nat. Genet. 37, 1217–1223.
8. de Bakker, P. I. W., Noel, N. P., Burtt, N. P.,Graham, R. R., Guiducci, C., Yelensky, R.,Drake, J.A. et al. (2006) Transferability of tag
SNPs in genetic association studies inmultiplepopulations.Nat. Genet. 38, 1298–1303.
9. Riva, A. and Kohane, I. S. (2002) SNPper:retrieval and analysis of human SNPs. Bioin-formatics 18, 1681–1685.
10. Conde, L., Vaquerizas, J. M., Santoyo, J.,Shahrour, F., Ruiz-Llorente, S., Robledo,M. et al. (2004) PupaSNP Finder: a webtool for finding SNPs with putative effectat transcriptional level. Nucleic Acids Res.32, W242–248.
11. CondeL.,Vaquerizas J.M.,DopazoH.,ArbizaL., Reumers J., Rousseau F. et al. (2006) Pupa-Suite: finding functional single nucleotidepoly-morphisms for large-scale genotypingpurposes.Nucleic Acids Res. 34, W621–625.
12. Ramensky, V., Bork, P., and Sunyaev, S.(2002)Human non-synonymous SNPs: serverand survey.Nucleic Acids Res 30, 3894–3900.
13. Cartegni, L., Wang, J., Zhu, Z., Zhang, M.Q., and Krainer, A. R. (2003) ESEfinder: Aweb resource to identify exonic splicing enhan-cers.Nucleic Acids Res. 31, 3568–3571.
14. Voight, B. F., Kudaravalli, S., Wen, X. andPritchard, J. K. (2006) A map of recentpositive selection in the human genome.PLoS Biol 4, 446–458.
15. Sabeti, P. C., Reich, D. E., Higgins, J. M.,Levine, H. Z. P., Richter, D. J., Schaffner, S.F. et al. (2002) Detecting recent positiveselection in the human genome from haplo-type structure. Nature 419, 832–837.
SPB-145152 3 June 13, 2009 Time: 10:28 Proof 1
Phillips
1297
1298
1299
1300
1301
1302
1303
1304
1305
1306
1307
1308
1309
1310
1311
1312
1313
1314
1315
1316
1317
1318
1319
1320
1321
1322
1323
1324
1325
1326
1327
1328
1329
1330
1331
1332
1333
1334
1335
1336
1337
1338
1339
1340
1341
1342
1343
1344
UNCORRECTE
DPROOF
16. Haiman, C. A. and Stram, D. O. (2008)Utilizing HapMap and tagging SNPs.Meth-ods Mol. Med. 141, 37–54.
17. Zhang, J., Rowe, W.L., Clark, A.G. andBuetow, K.H. (2003) Genomewide distri-bution of high-frequency, completely mis-matching SNP haplotype pairs observed tobe common across human populations.Am.J. Hum. Genet. 73, 1073–1081.
18. Bersaglieri, T., Sabeti, P. C., Patterson, N.,Vanderploeg, T., Schaffner, S.F., Drake J.A.et al. (2004) Genetic signatures of strongrecent positive selection at the lactase gene.Am. J. Hum. Genet. 74, 1111–1120.
19. Bandelt, H. J., Salas, A. and Bravi, C. M.(2006) What is a ’novel’ mtDNAmutation–and does ’novelty’ really matter? J. Hum.Genet. 51, 1073–1082.