28
Chapter 11: Investment Analysis and Taxation of Income Properties McGraw-Hill/Irwin Copyright © 2011 by the McGraw-Hill Companies, Inc. All rights reserved.
| Date post: | 27-Dec-2015 |
| Category: |
Documents |
| Upload: | charla-boone |
| View: | 212 times |
| Download: | 0 times |

Chapter 11:Investment Analysis and Taxation
of Income Properties
McGraw-Hill/Irwin Copyright © 2011 by the McGraw-Hill Companies, Inc. All rights reserved.

11-2
Investment AnalysisInvestment Analysis
Equity Investment Motivations for Investing in Income
Properties– Rate of Return– Price Appreciation– Diversification– Tax Benefits
11-3
Market CharacteristicsMarket Characteristics
Real Estate Cycle– Large Market in number and size of properties– Competitive– Fragmented Ownership– Overdevelopment Potential– The cycle differs for different property types.
11-4
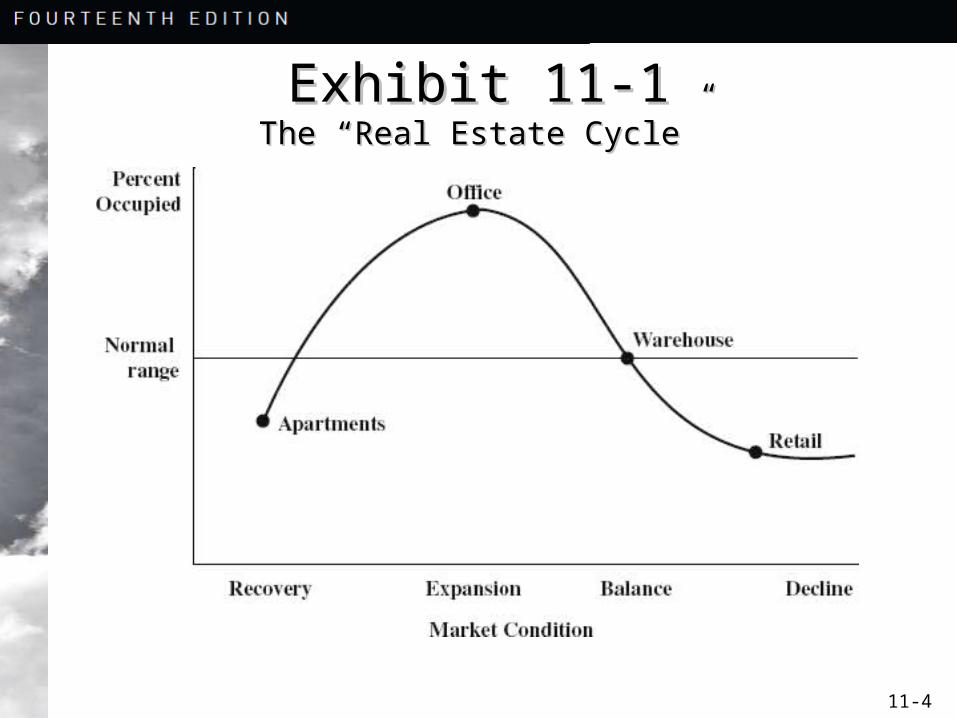
Exhibit 11-1Exhibit 11-1The “Real Estate Cycle”The “Real Estate Cycle”

11-5
Investment StrategiesInvestment Strategies
Investing in Core Properties Investing in Core Properties with a “Value
Add” Strategy Property Sector Investing Contrarian Investing Market Timing Growth Investing Value Investing

11-6
Investment StrategiesInvestment Strategies
Strategy as to Size of Property Strategy as to Tenants Arbitrage Investing Turnaround/Special Situations Opportunistic Investing Investing in “Trophy” or “Blue Chip”
Properties Development
11-7
Market AnalysisMarket Analysis
Evaluation of supply and demand for a type of property
Absorption Supply of Space Market Rents Forecasting Supply, Demand, Market
Rents, and Occupancy

11-8
Investment AnalysisInvestment Analysis
Internal Rate of Return (IRR)– The discount rate at which the net present
value of the cash flows is equal to 0. – If IRR >= r; accept Project– If IRR < r; reject Project– Where r is the discount rate, or more
colloquially, the “hurdle rate”

11-9
Investment AnalysisInvestment Analysis
Net Present Value– A way to solve for the initial price that an investor may
pay given a specified discount rate. – Discounted value of the cash flows. – The discount rate is the rate of return that an investor
will require in order to make this investment. – If we include the initial equity investment in this
calculation, we can solve for the difference and see how much more or less the investor may pay and still receive a rate that is equivalent to their discount rate.
11-10
Debt FinancingDebt Financing
Equity Dividend = NOI - DS– NOI = Net Operating Income – DS = Debt Service
The equity dividend is also referred to as the before-tax cash flow from operations (BTCF0)

11-11
Debt FinancingDebt Financing
Equity Dividend Rate =
Equity Dividend/Initial Equity Investment– Sometimes referred to as “unleveraged cash on cash”
rate.
Debt Coverage Ratio (DCR) = NOI/DS– The DCR is a vital ratio for lenders.– If the DCR is less than 1, the borrower will not be able
to service the debt. – Generally, lenders want a DCR greater than 1 so the
borrower has a cushion and can repay.

11-12
Debt FinancingDebt Financing
Example 11-1: – $1,000,000 Property; – 95% allocated to building and 5% to land– 70% LTV; 7% Interest Rate, 30 Years– $700,000 debt; $300,000 equity– Monthly Payment = $4657.11– DS = 12 x $4657.11 = $55,885
– NOI1 = $85,000

11-13
Before-Tax Cash FlowBefore-Tax Cash Flow
Equity Dividend = NOI-DS– $85,000 - $55,885 = $29,115 – This is also the BTCFo for this year.
Equity Dividend Rate = EQDIV/Equity– $29,115/$300,000 = 9.71%
Debt Coverage Ratio = – $85,000/$55,885 = 1.52
These ratios all pertain to the first year of operations.
11-14
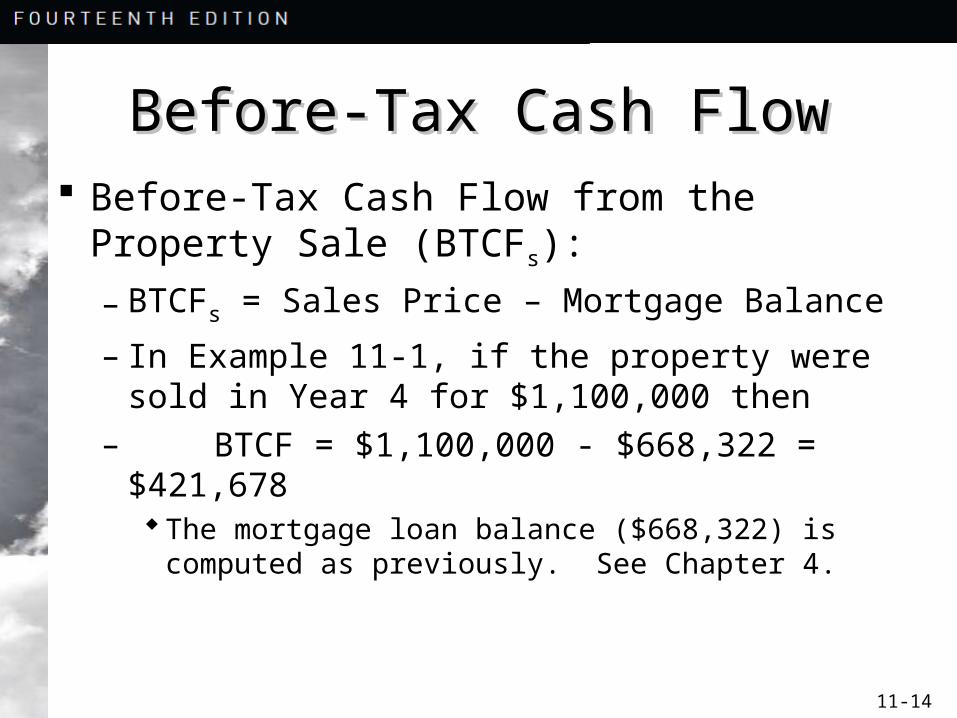
Before-Tax Cash FlowBefore-Tax Cash Flow Before-Tax Cash Flow from the Property
Sale (BTCFs):
– BTCFs = Sales Price – Mortgage Balance
– In Example 11-1, if the property were sold in Year 4 for $1,100,000 then
– BTCF = $1,100,000 - $668,322 = $421,678The mortgage loan balance ($668,322) is
computed as previously. See Chapter 4.

11-15
Four Classes of Real Property– Real Estate held as a “personal
residence”– Real Estate held for sale to others –
“dealer” property”– Real Estate held for use in a trade or
business – “trade or business property”– Real Estate held as an investment for the
production of income – “investment property”
TaxationTaxation

11-16
Active Income– Salaries, wages, bonuses, and
commissions
Portfolio Income– Interest, dividends, and capital gains
Passive Income– Rents from real estate, and royalties from
oil and gas rights
Types of Taxable IncomeTypes of Taxable Income
11-17
Passive Activity Loss Passive Activity Loss RestrictionsRestrictions
Passive losses cannot be used to reduce active or portfolio income
Passive losses may be used to reduce other passive income
Passive losses not used may be used in future years or at the same time of sale

11-18
Passive Activity Loss RestrictionsPassive Activity Loss Restrictions
1st Exception– Active participants may deduct up to $25,000 in
passive losses against other non-passive income, subject to limitations such as their adjusted gross income
2nd Exception– Broad exception for real estate professionals
from the Passive Activity Loss rules. – For many of you, if you enter the real estate
business, this will apply to you.

11-19
Depreciation BasisDepreciation Basis The original cost basis includes all costs
associated with acquiring the property and transferring the title
Land value cannot be depreciated The depreciable basis is the total value
that can be depreciated over the recovery period
Depreciable Basis = Cost Basis – Land Amount

11-20
DepreciationDepreciation Depreciation
– Depreciable Basis / Recovery Period
Recovery Period is different based on property type– Residential income producing property (27.5
Years)– Non-residential income producing property (39
Years)– Note that the recovery period is a product of the
tax code. It will vary based on the country that the real estate is located in.
11-21
After-Tax Cash FlowsAfter-Tax Cash Flows
Calculating the after-tax cash flow from operations
Step 1: Compute taxable income
Net Operating Income- Depreciation- Interest
Taxable Income
11-22
After-Tax Cash FlowsAfter-Tax Cash Flows
From Slide 11-10, depreciation is based on a building value of $950,000 over 27.5 years. – Depreciation = $950,000/27.5 = $34,545– Interest = $48,775 using the “amort” function
on the financial calculator.– The depreciation schedule will vary. It is not
always 27.5 years.
11-23
After-Tax Cash FlowsAfter-Tax Cash Flows
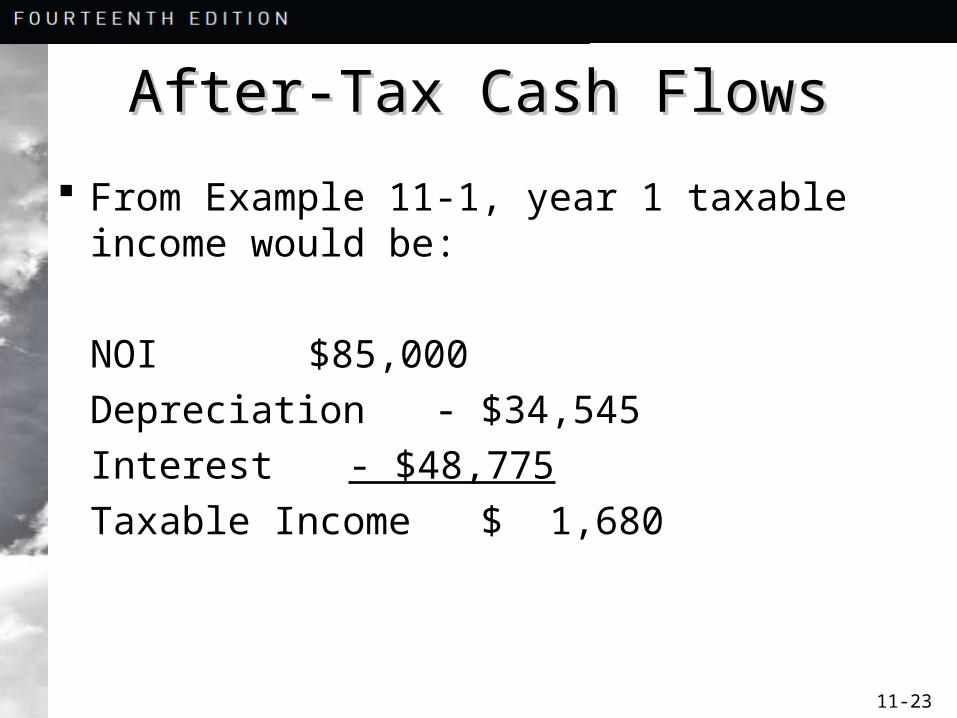
From Example 11-1, year 1 taxable income would be:
NOI $85,000
Depreciation - $34,545
Interest - $48,775
Taxable Income $ 1,680

11-24
After-Tax Cash FlowsAfter-Tax Cash Flows
Step 2: Compute Taxes
Taxes (at 28%) = 0.28 x 1,680 = $470 Step 3: Compute after-tax cash flow from
operations for year 1
ATCF1 = BTCF1 – Taxes
= 29,115 - 470
= $28,645
11-25
After-Tax Cash FlowsAfter-Tax Cash Flows
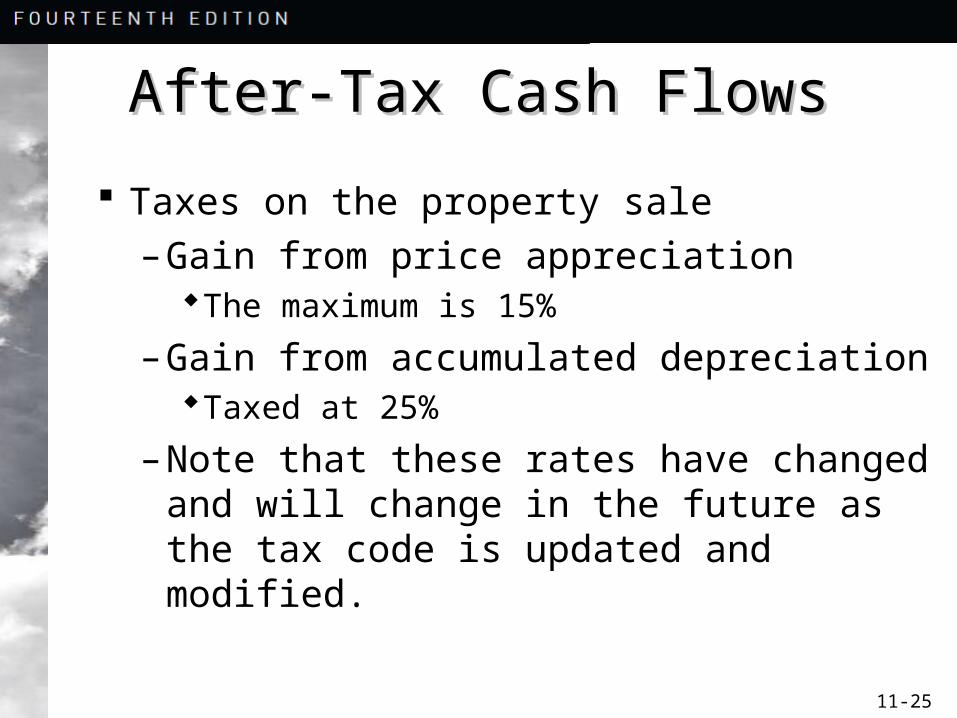
Taxes on the property sale
– Gain from price appreciationThe maximum is 15%
– Gain from accumulated depreciationTaxed at 25%
– Note that these rates have changed and will change in the future as the tax code is updated and modified.
11-26
After-Tax Cash FlowsAfter-Tax Cash Flows
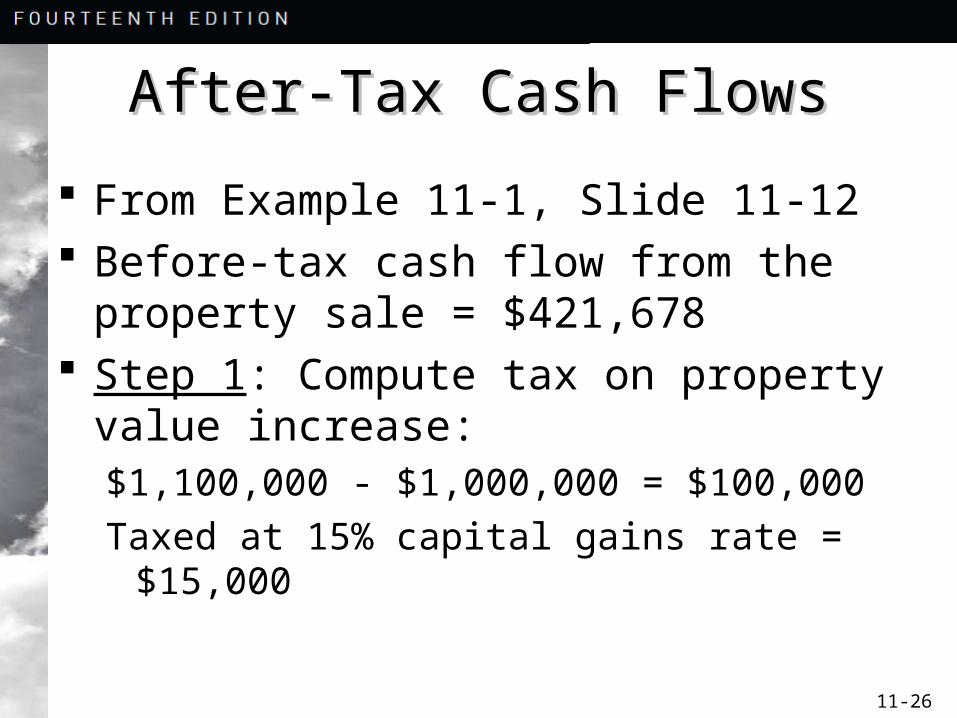
From Example 11-1, Slide 11-12 Before-tax cash flow from the property
sale = $421,678 Step 1: Compute tax on property value
increase:$1,100,000 - $1,000,000 = $100,000
Taxed at 15% capital gains rate = $15,000

11-27
After-Tax Cash FlowsAfter-Tax Cash Flows
Step 2: Compute tax on prior depreciation:
4 Years at $34,545 = $138,180
Taxed at 25% = $34,545
Step 3: Compute total taxes from sale:
$34,545 + $15,000 = $49,545

11-28
After-Tax Cash FlowsAfter-Tax Cash Flows
Step 4: Compute after-tax cash flow from the property sale
ATCFs = BTCFs – Taxes
ATCFs = $431,678 - $49,545 = $382,133
Analysis– Compute After-Tax Internal Rate of Return– Compute After-Tax Net Present Value


