55
Chapter Chapter 11 11 Surveying The Surveying The Stars Stars
| Date post: | 25-Dec-2015 |
| Category: |
Documents |
| Upload: | esmond-holland |
| View: | 275 times |
| Download: | 12 times |
Chapter 11Chapter 11
Surveying The StarsSurveying The Stars
Properties of StarsProperties of Stars Distance
Speed
Radius
Brightness (Intensity)
Temperature

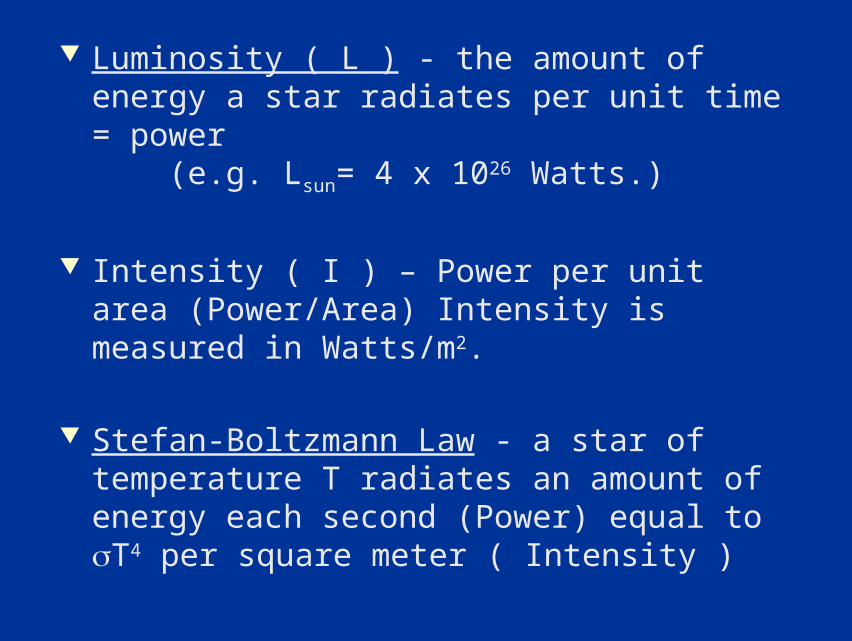
Luminosity ( L ) - the amount of energy a star radiates per unit time = power (e.g. Lsun= 4 x 1026 Watts.)
Intensity ( I ) – Power per unit area (Power/Area) Intensity is measured in Watts/m2.
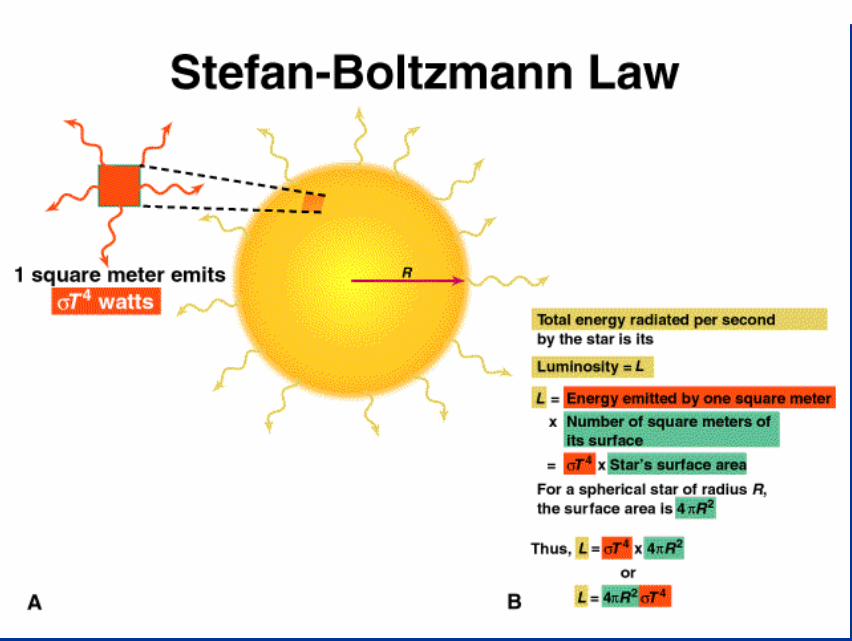
Stefan-Boltzmann Law - a star of temperature T radiates an amount of energy each second (Power) equal to T4 per square meter ( Intensity )
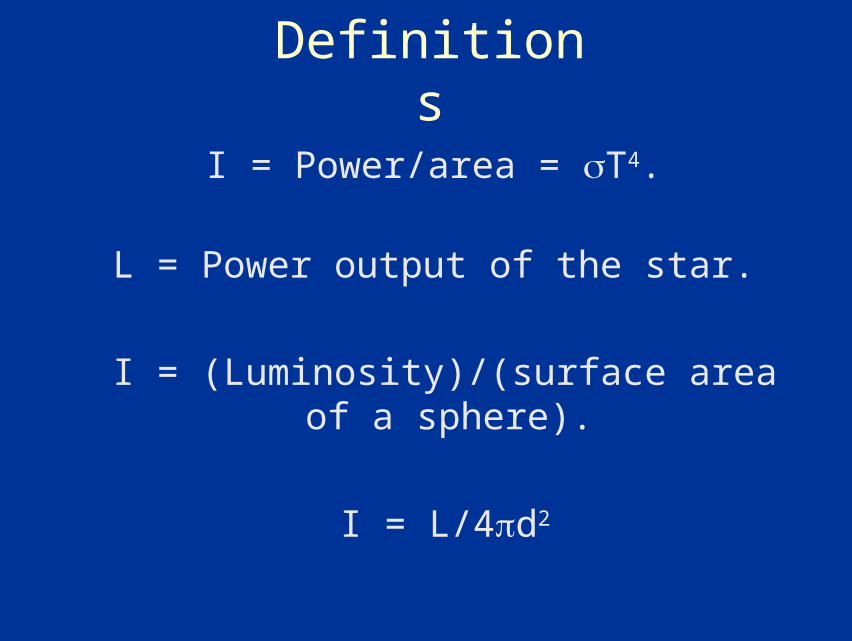
I = Power/area = T4.
L = Power output of the star.
I = (Luminosity)/(surface area of a sphere).
I = L/4d2
Definitions
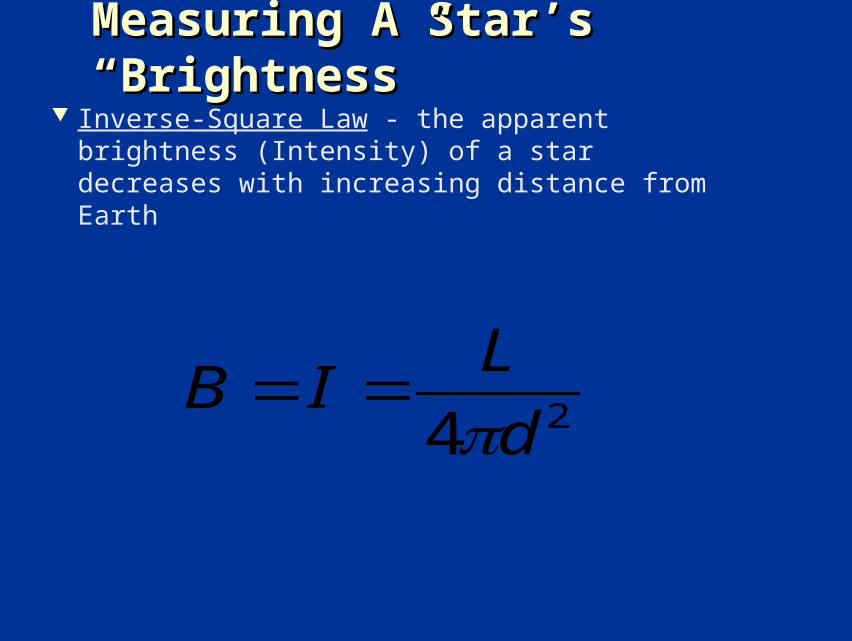
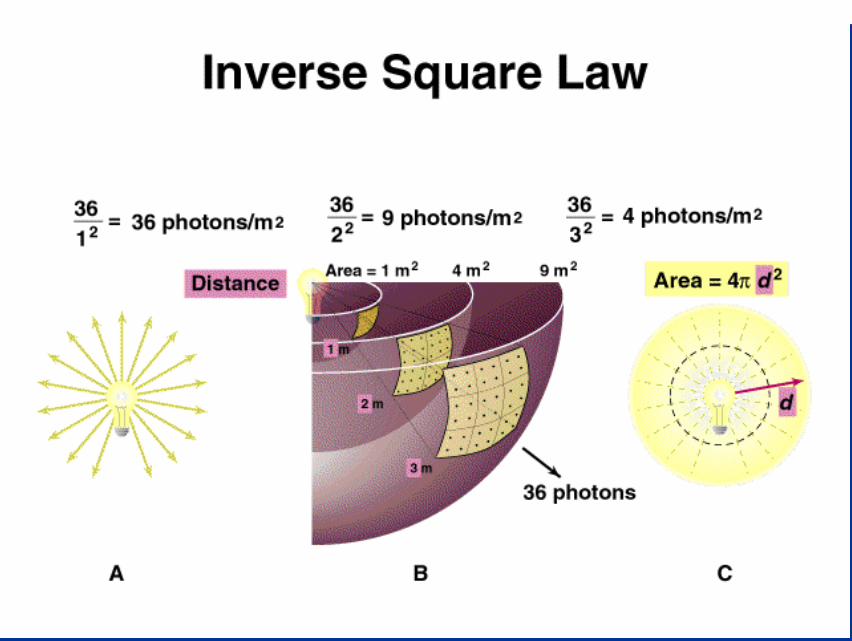
Measuring A Star’s “Brightness”Measuring A Star’s “Brightness” Inverse-Square Law - the apparent brightness
(Intensity) of a star decreases with increasing distance from Earth
24 d
LIB
424 TRL R
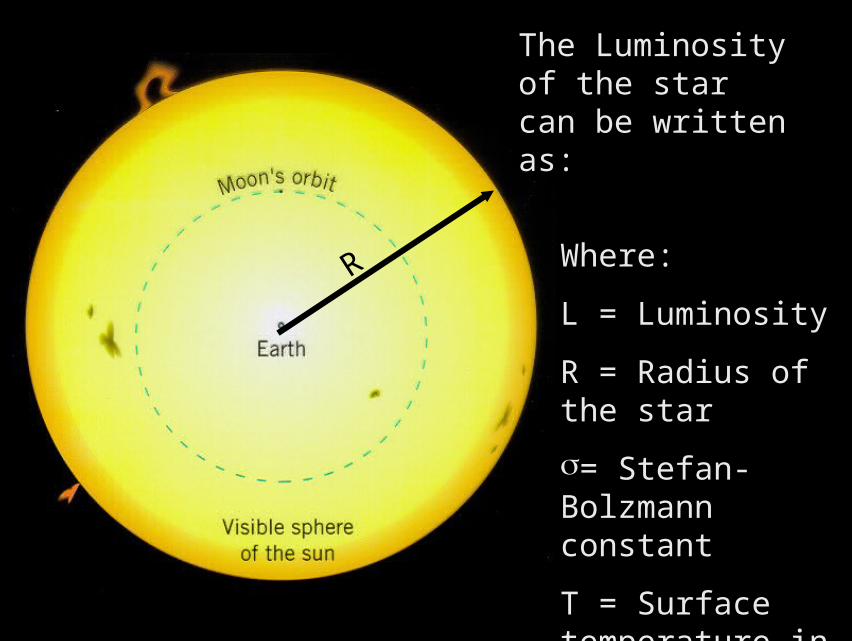
The Luminosity of the star can be written as:
Where:
L = Luminosity
R = Radius of the star
= Stefan-Bolzmann constant
T = Surface temperature in K
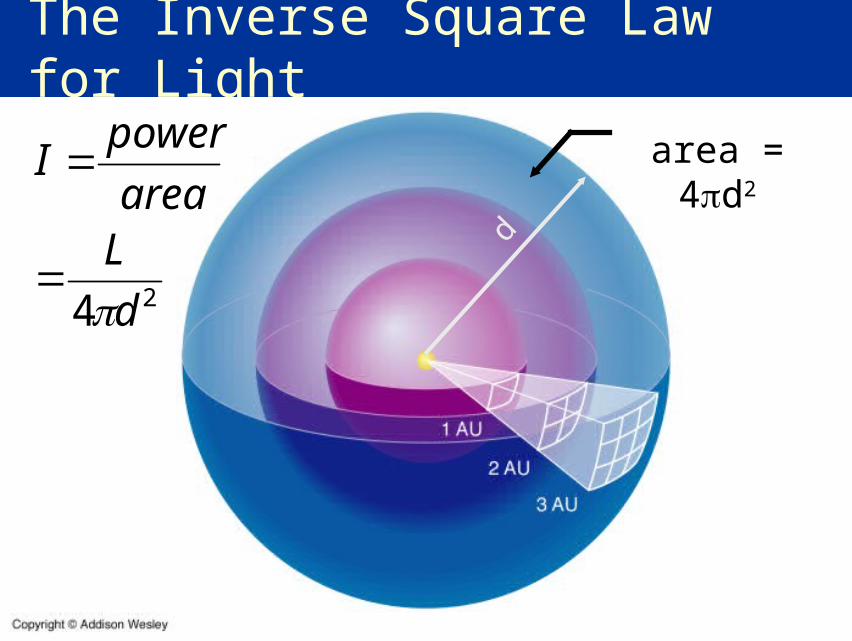
The Inverse Square Law for Light
24 d
Larea
powerI
d
area = 4d2
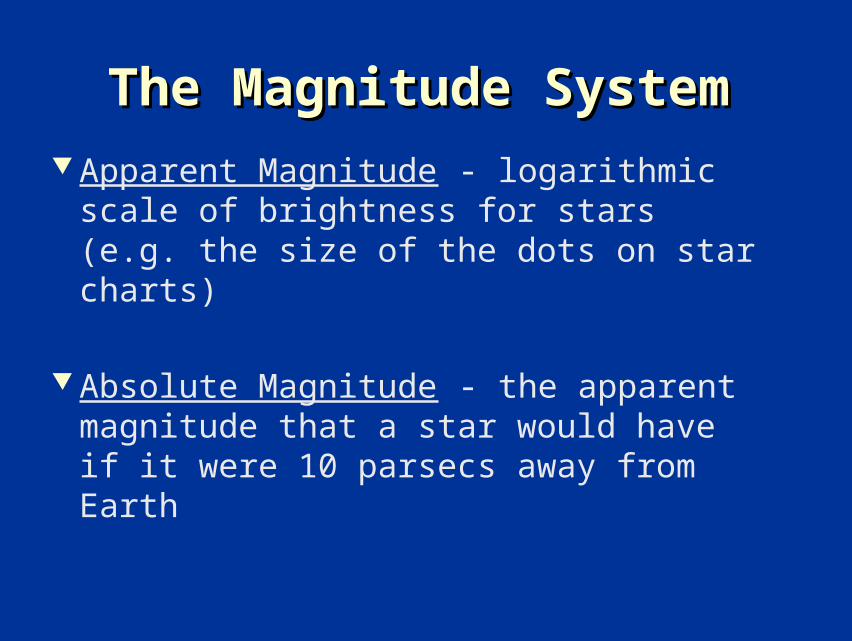
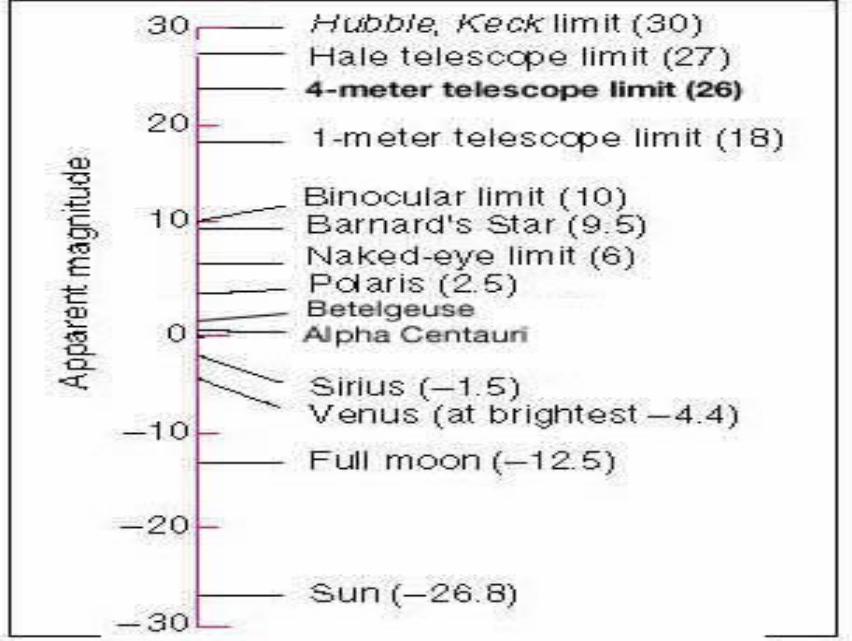
The Magnitude SystemThe Magnitude System
Apparent Magnitude - logarithmic scale of brightness for stars (e.g. the size of the dots on star charts)
Absolute Magnitude - the apparent magnitude that a star would have if it were 10 parsecs away from Earth
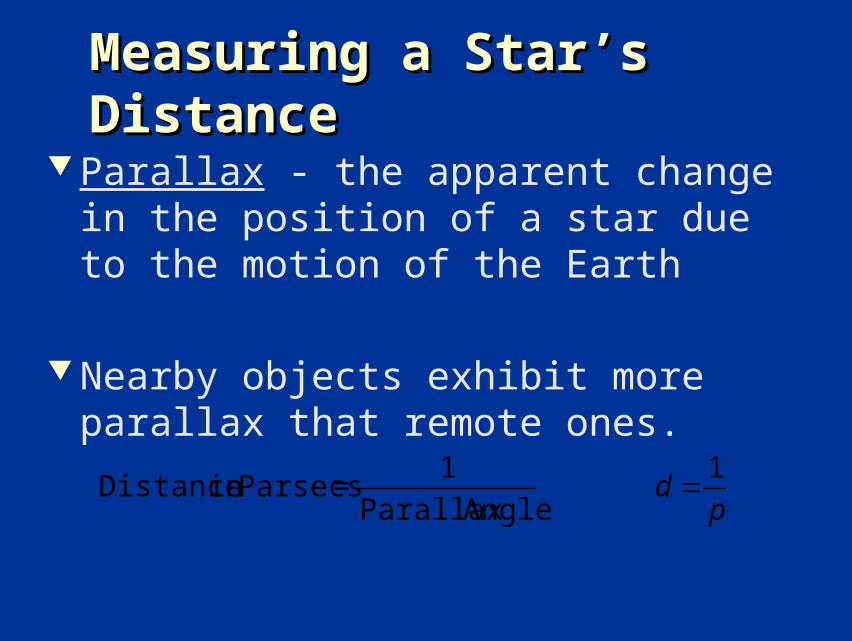
Measuring a Star’s DistanceMeasuring a Star’s Distance
Parallax - the apparent change in the position of a star due to the motion of the Earth
Nearby objects exhibit more parallax that remote ones.
pd
1
AngleParallax
1= Parsecsin Distance
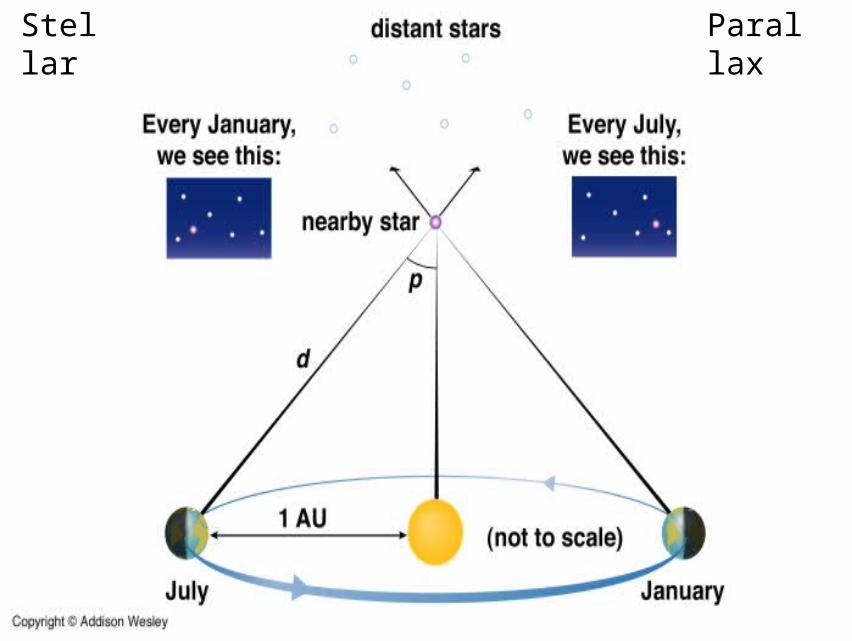
Stellar Parallax
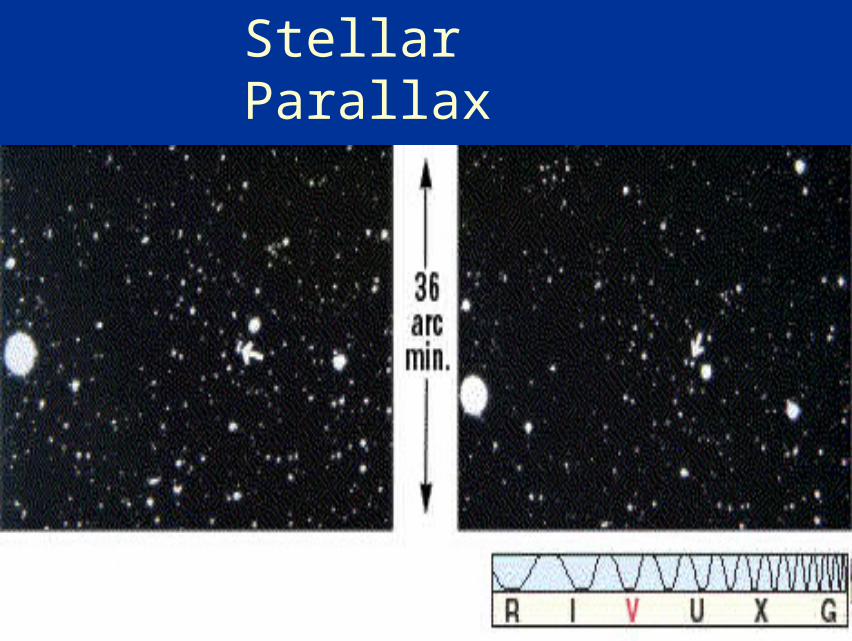
Stellar Parallax
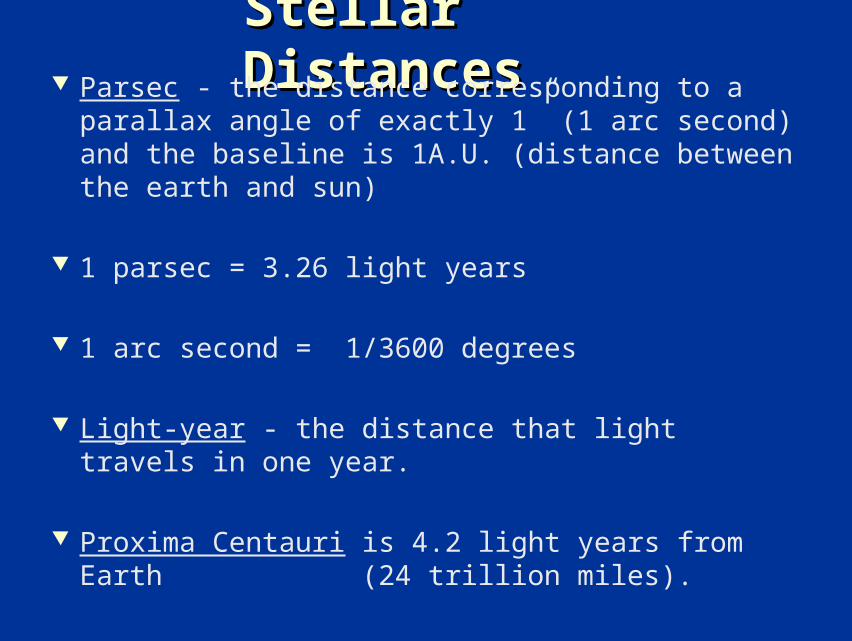
Stellar DistancesStellar Distances Parsec - the distance corresponding to a parallax angle
of exactly 1” (1 arc second) and the baseline is 1A.U. (distance between the earth and sun)
1 parsec = 3.26 light years
1 arc second = 1/3600 degrees
Light-year - the distance that light travels in one year.
Proxima Centauri is 4.2 light years from Earth (24 trillion miles).
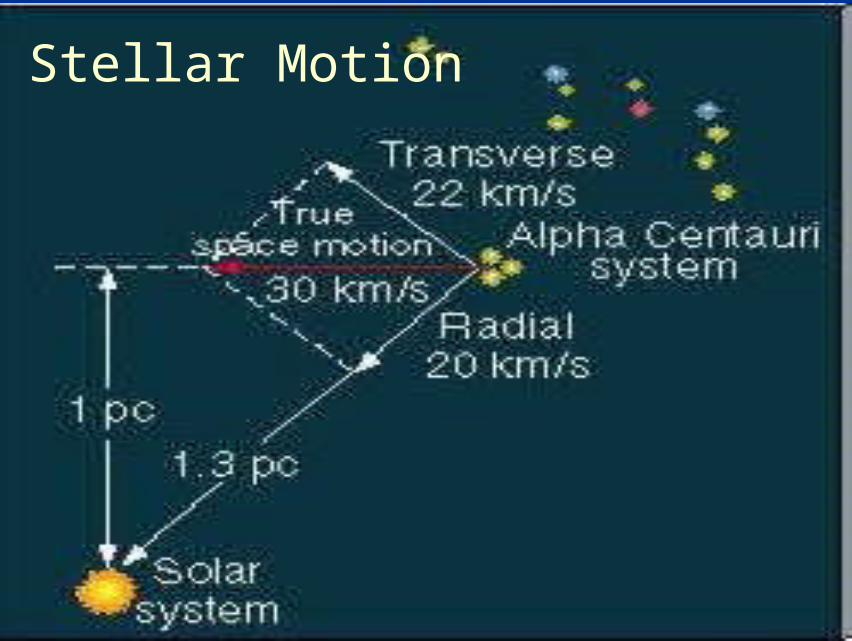
Stellar Motion
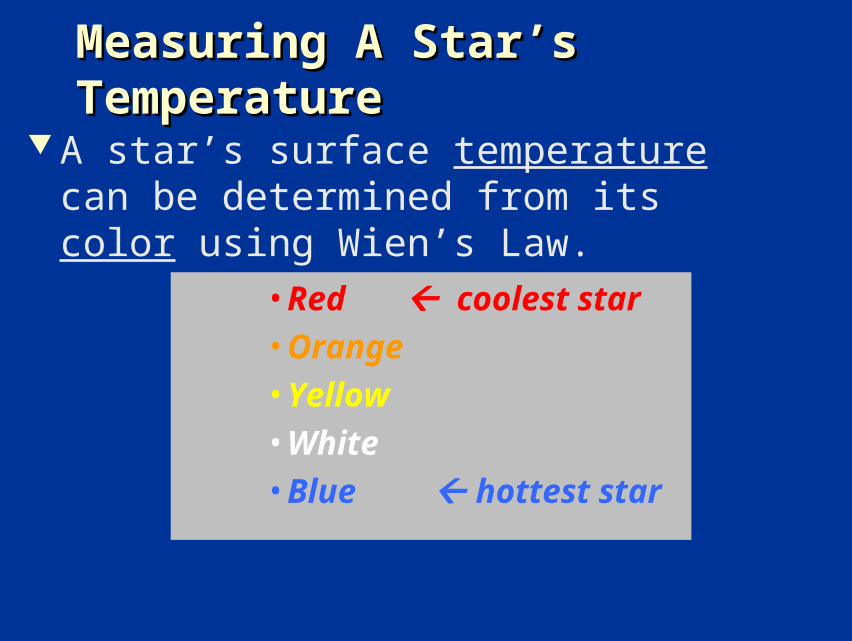
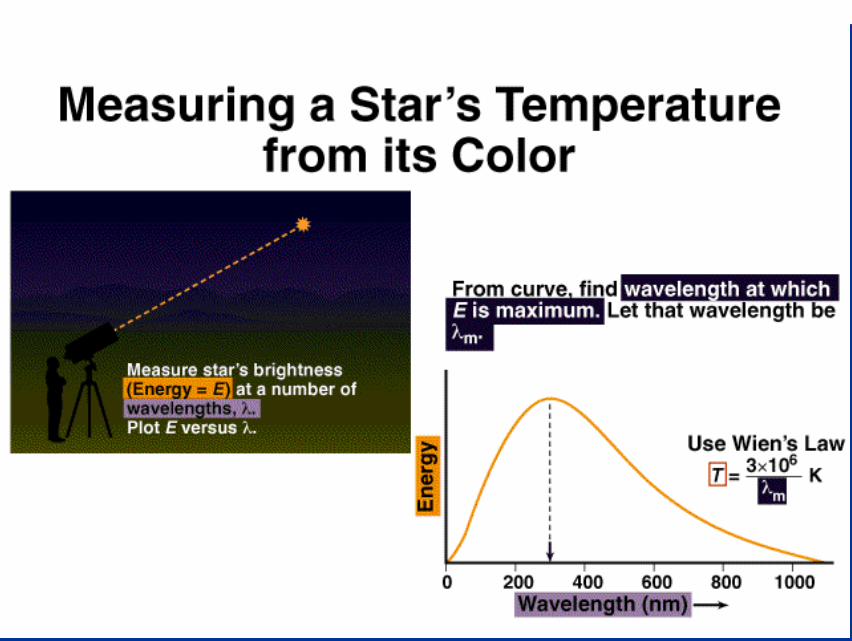
Measuring A Star’s TemperatureMeasuring A Star’s Temperature
A star’s surface temperature can be determined from its color using Wien’s Law.
• Red coolest star• Orange• Yellow• White• Blue hottest star
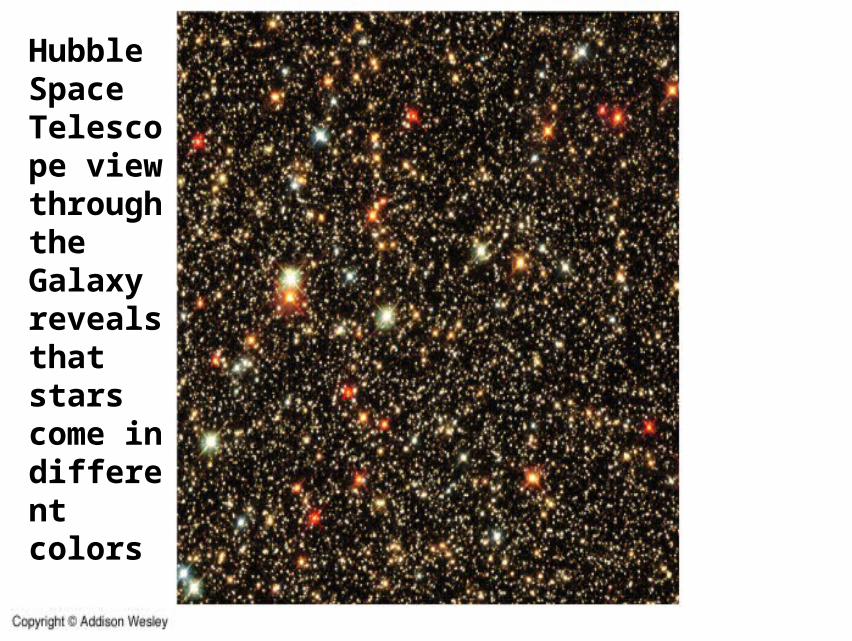
Hubble Space Telescope view through the Galaxy reveals that stars come in different colors
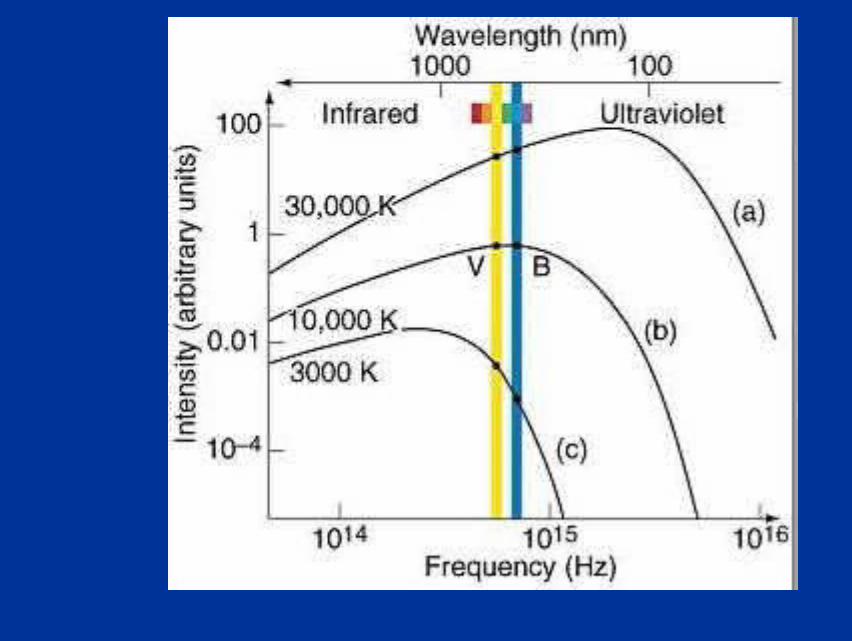
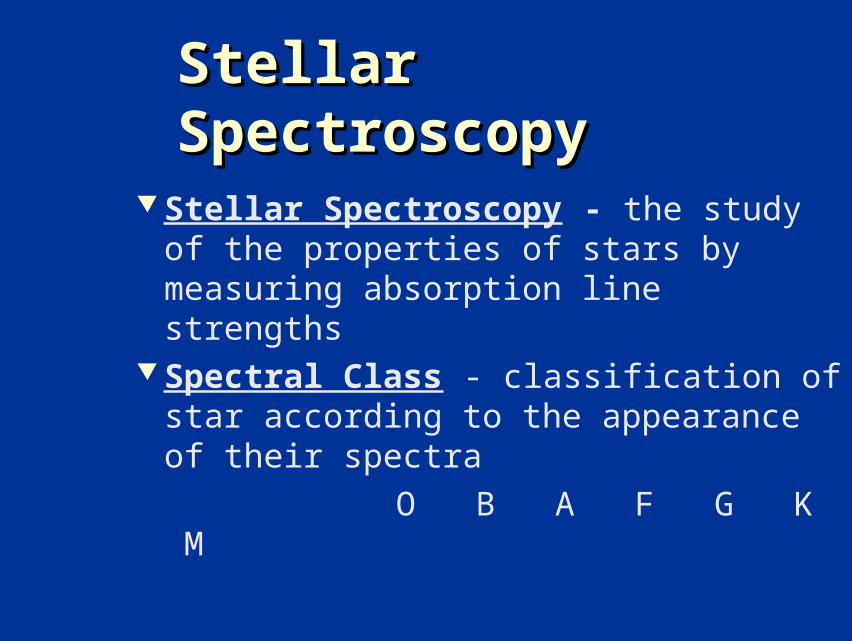
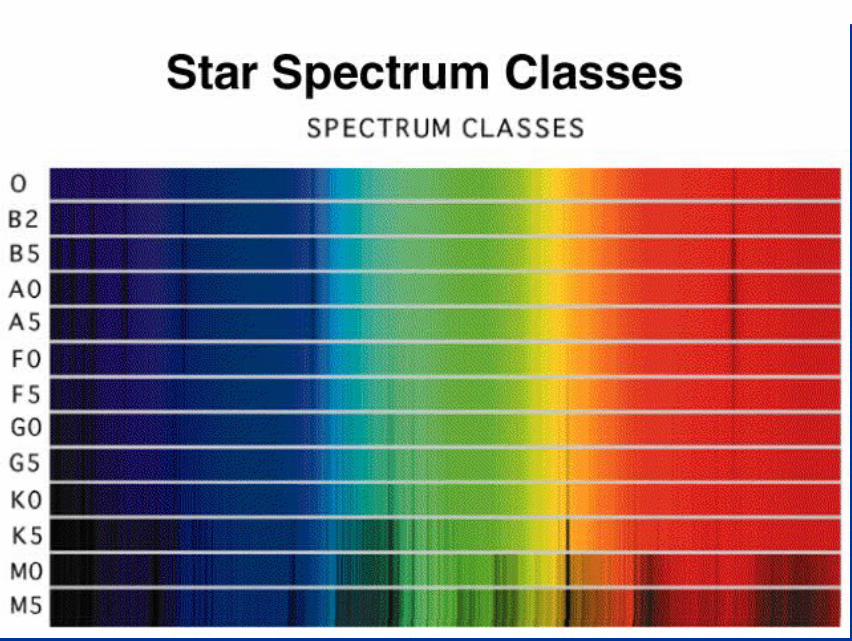
Stellar SpectroscopyStellar Spectroscopy
Stellar Spectroscopy - the study of the properties of stars by measuring absorption line strengths
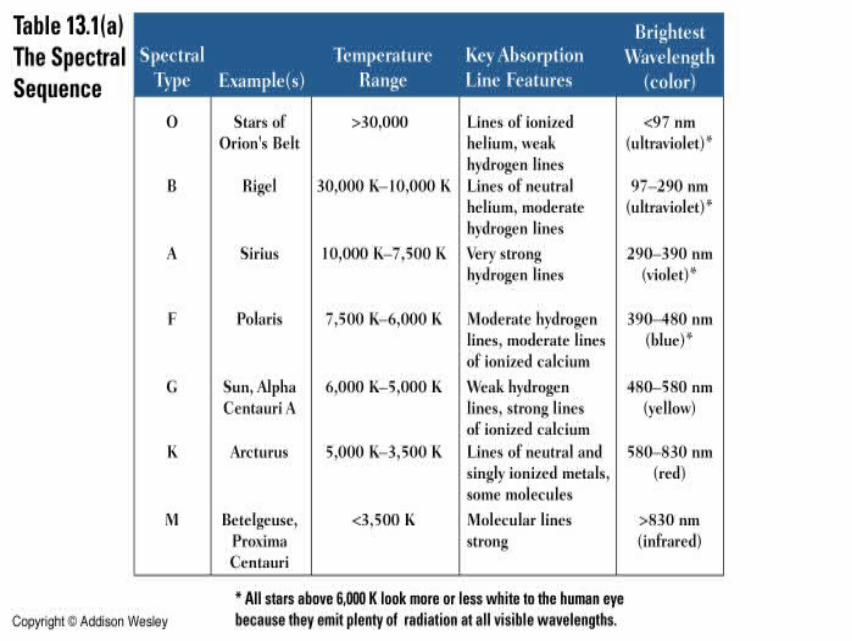
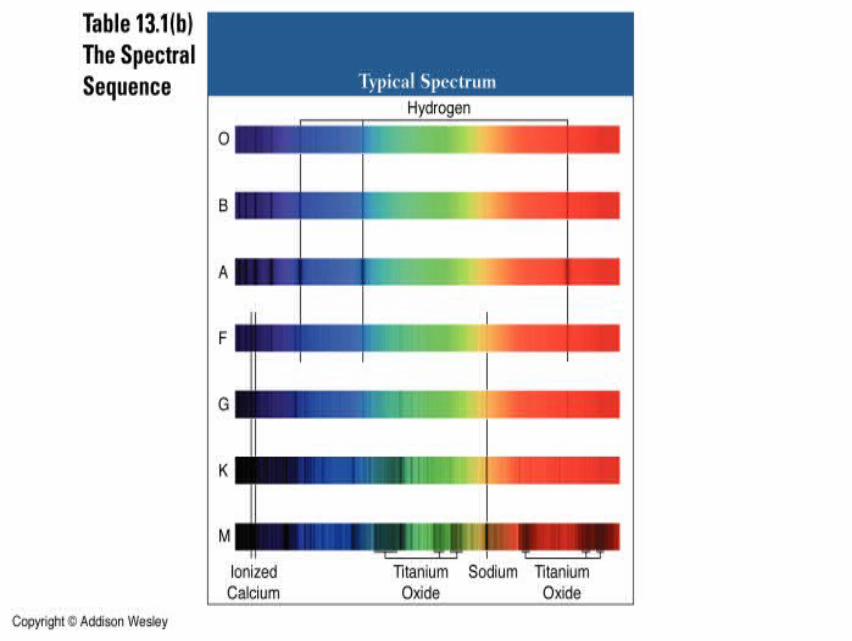
Spectral Class - classification of star according to the appearance of their spectra
O B A F G K M
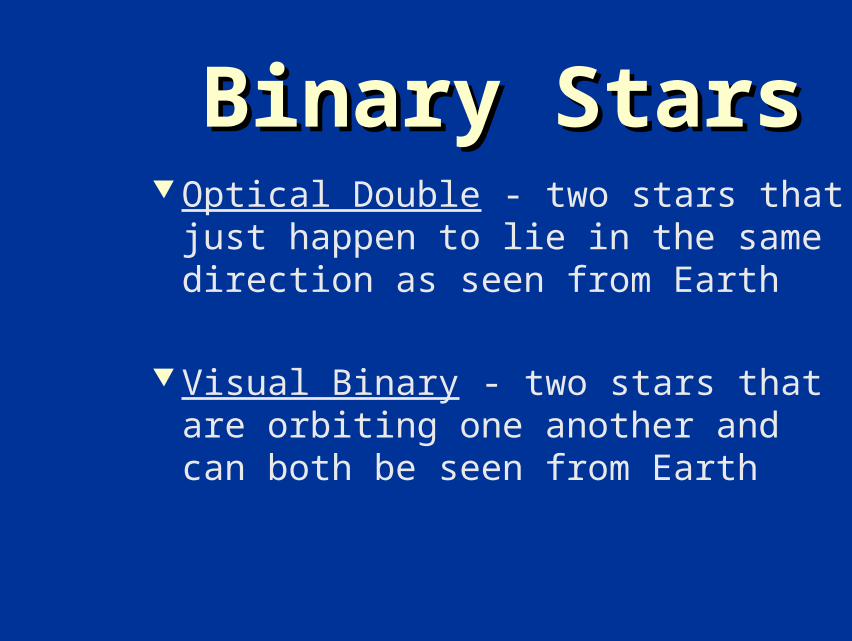
Binary StarsBinary Stars Optical Double - two stars that just happen
to lie in the same direction as seen from Earth
Visual Binary - two stars that are orbiting one another and can both be seen from Earth
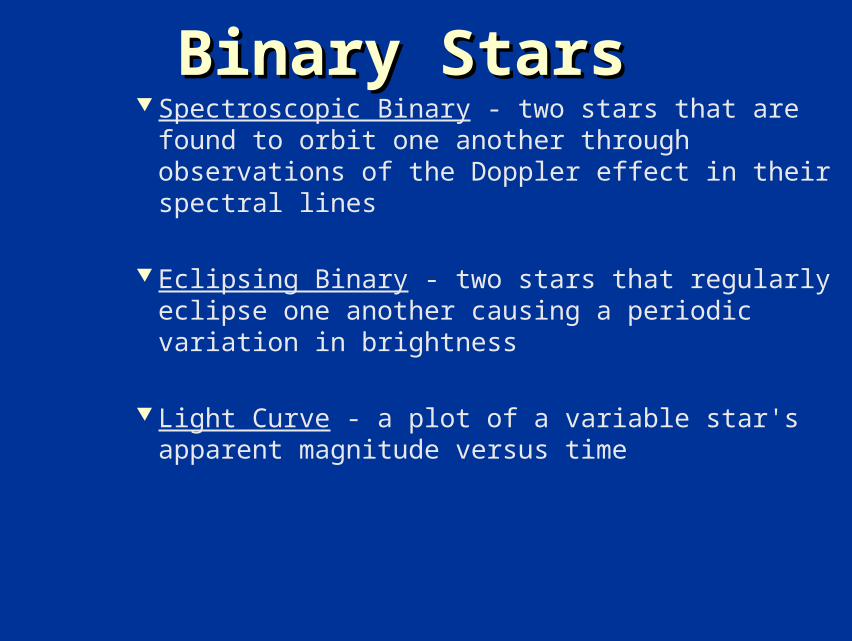
Binary StarsBinary Stars Spectroscopic Binary - two stars that are found to
orbit one another through observations of the Doppler effect in their spectral lines
Eclipsing Binary - two stars that regularly eclipse one another causing a periodic variation in brightness
Light Curve - a plot of a variable star's apparent magnitude versus time
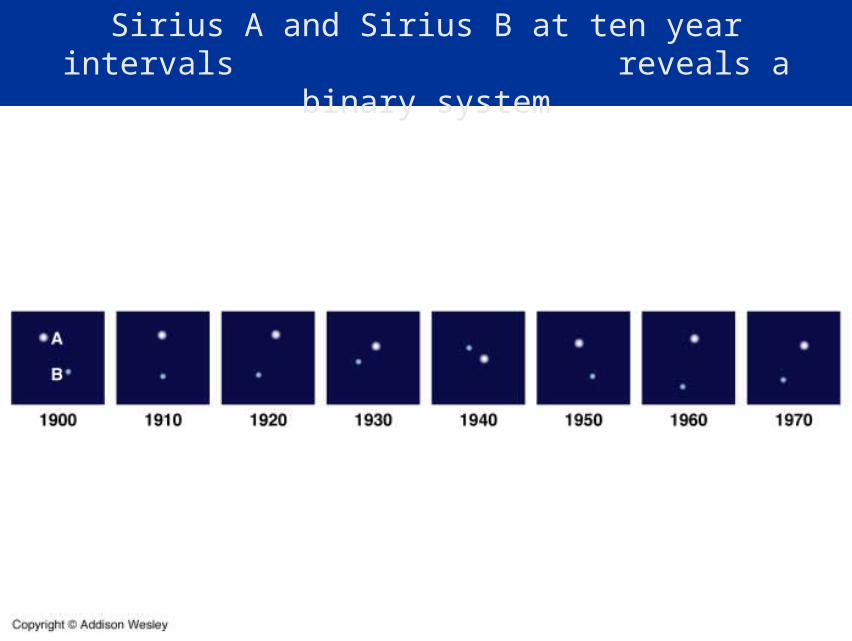
Sirius A and Sirius B at ten year intervals reveals a binary system
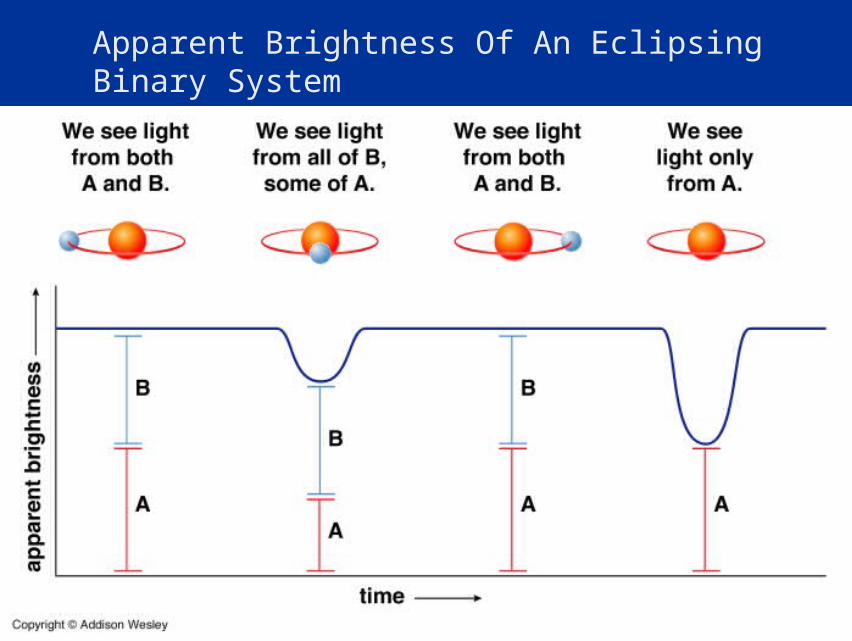
Apparent Brightness Of An Eclipsing Binary System
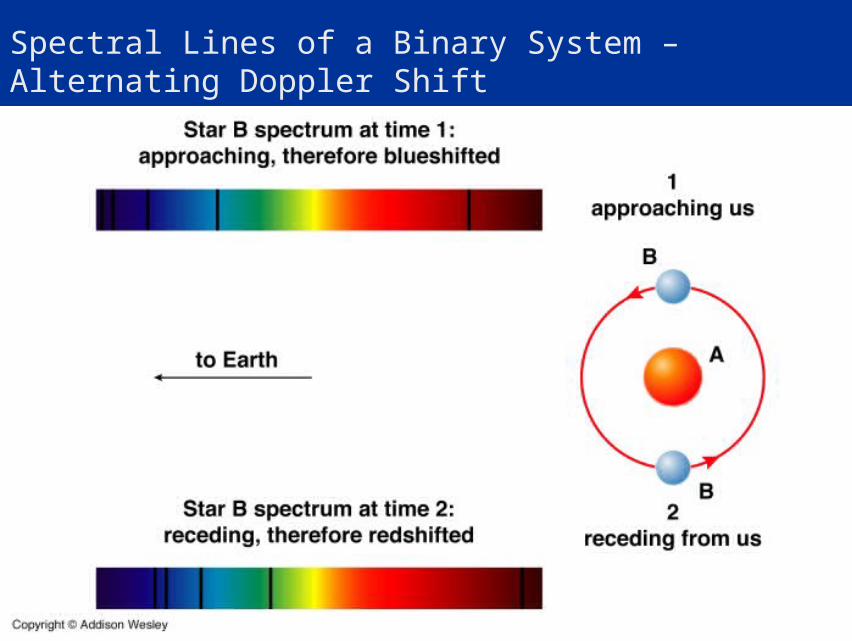
Spectral Lines of a Binary System – Alternating Doppler Shift

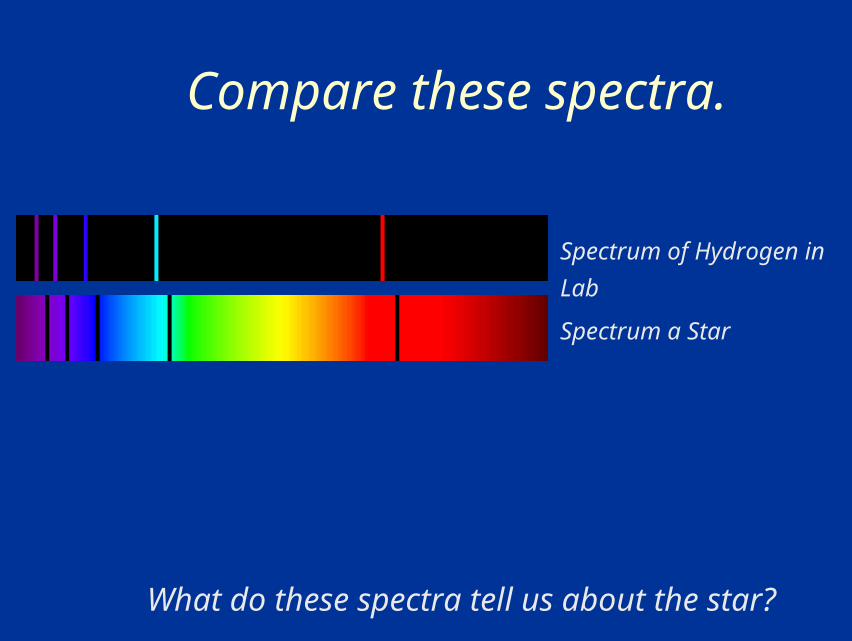
Compare these spectra.
Spectrum of Hydrogen in Lab
Spectrum a Star
What do these spectra tell us about the star?
Compare these spectra.
Spectrum of Hydrogen in Lab
Spectrum a Star
What do these spectra tell us about the star?

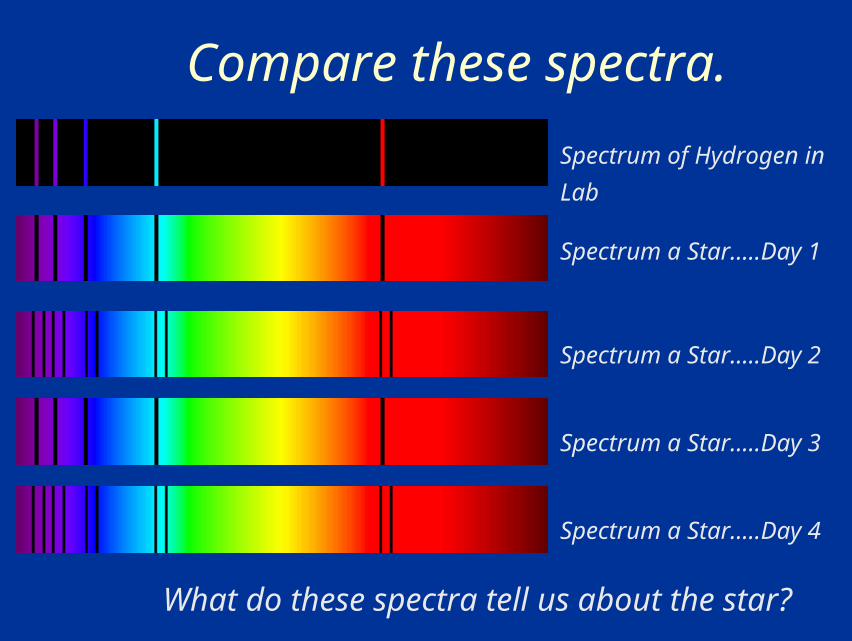
Compare these spectra.
Spectrum of Hydrogen in Lab
Spectrum a Star…..Day 1
What do these spectra tell us about the star?
Spectrum a Star…..Day 2
Spectrum a Star…..Day 3
Spectrum a Star…..Day 4
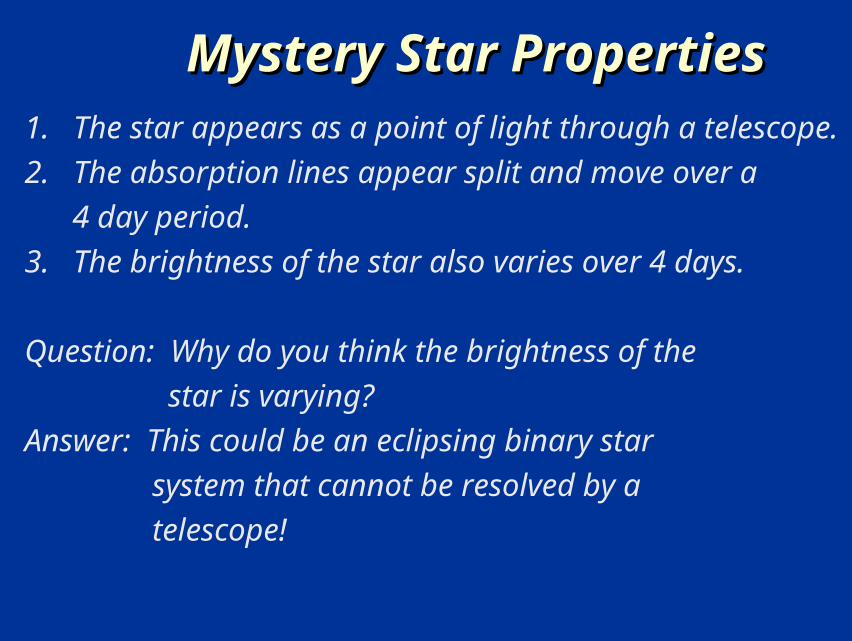
Mystery Star PropertiesMystery Star Properties1. The star appears as a point of light through a telescope.
2. The absorption lines appear split and move over a
4 day period.
3. The brightness of the star also varies over 4 days.
Question: Why do you think the brightness of the
star is varying?
Answer: This could be an eclipsing binary star
system that cannot be resolved by a
telescope!
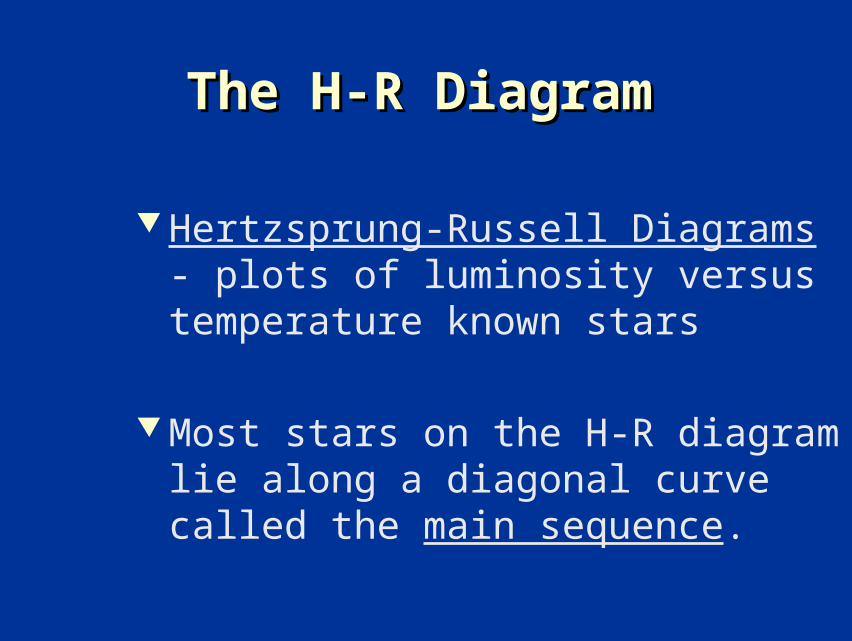
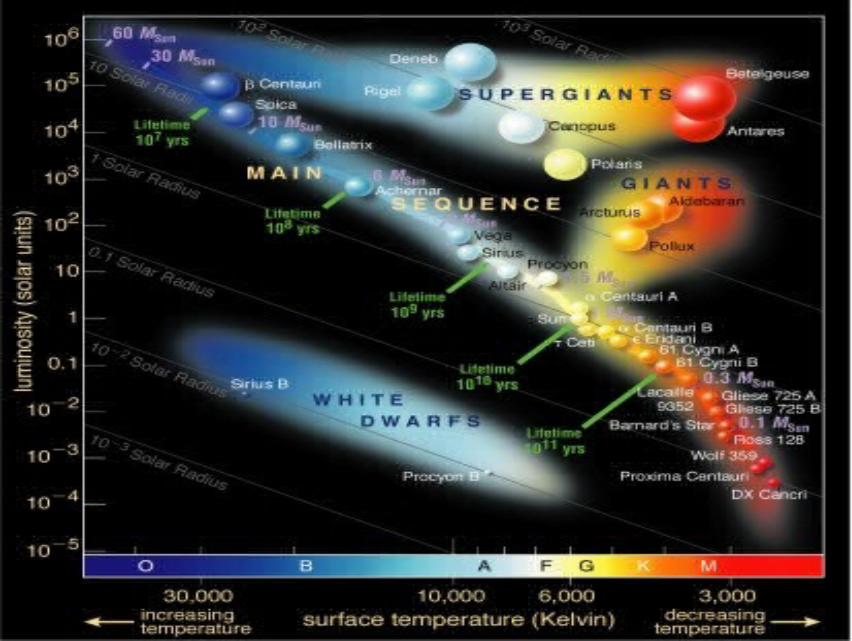
The H-R DiagramThe H-R Diagram
Hertzsprung-Russell Diagrams - plots of luminosity versus temperature known stars
Most stars on the H-R diagram lie along a diagonal curve called the main sequence.
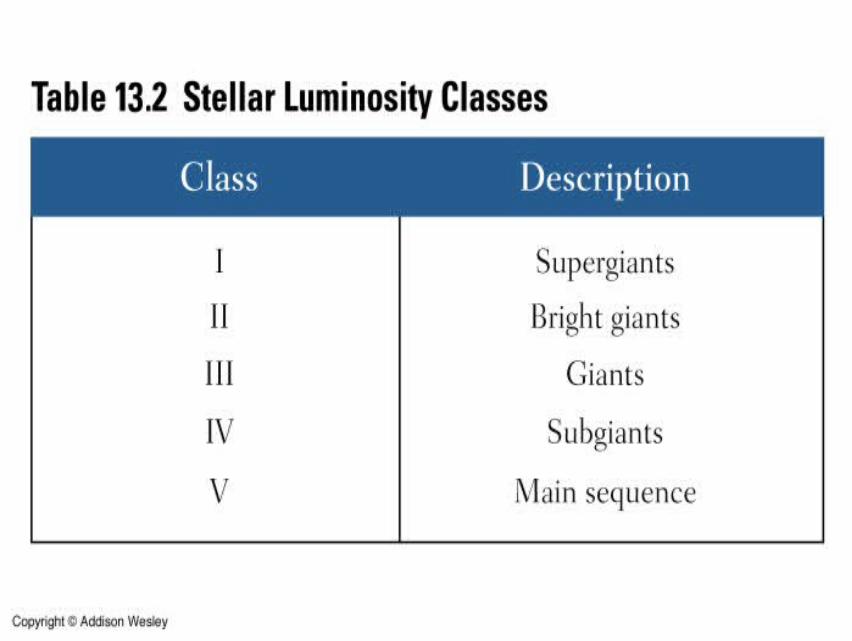
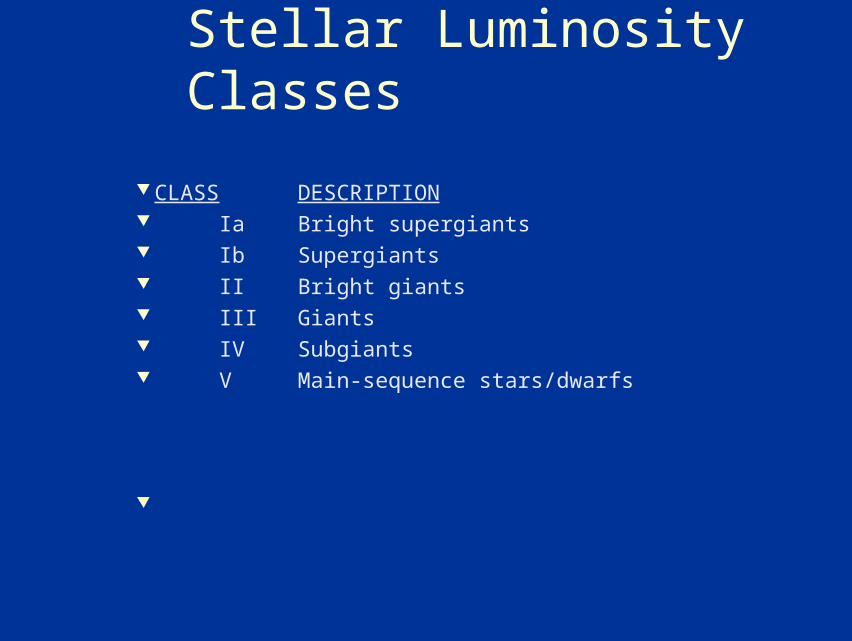
Stellar Luminosity Classes
CLASS DESCRIPTION Ia Bright supergiants IbSupergiants II Bright giants III Giants IV Subgiants V Main-sequence stars/dwarfs
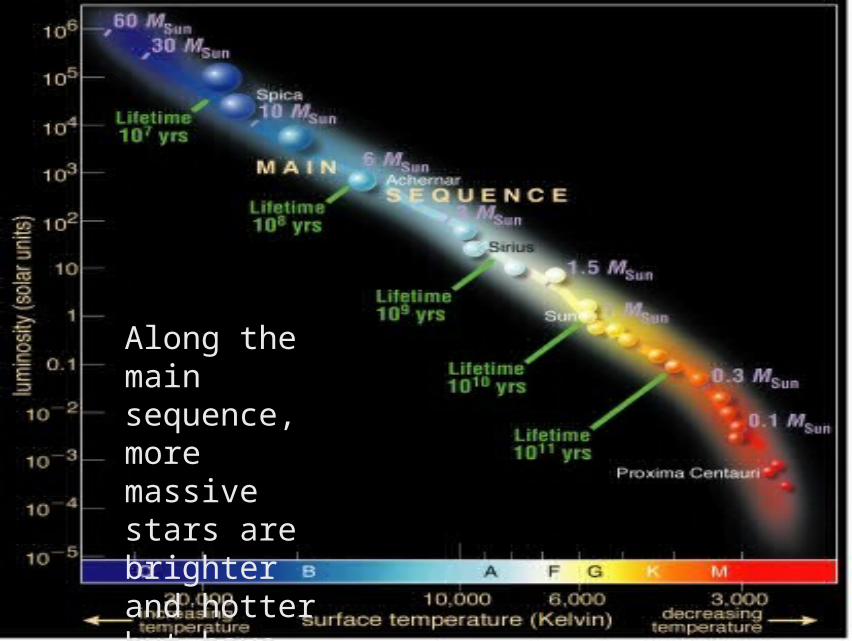
Along the main sequence, more massive stars are brighter and hotter but have shorter lifetimes
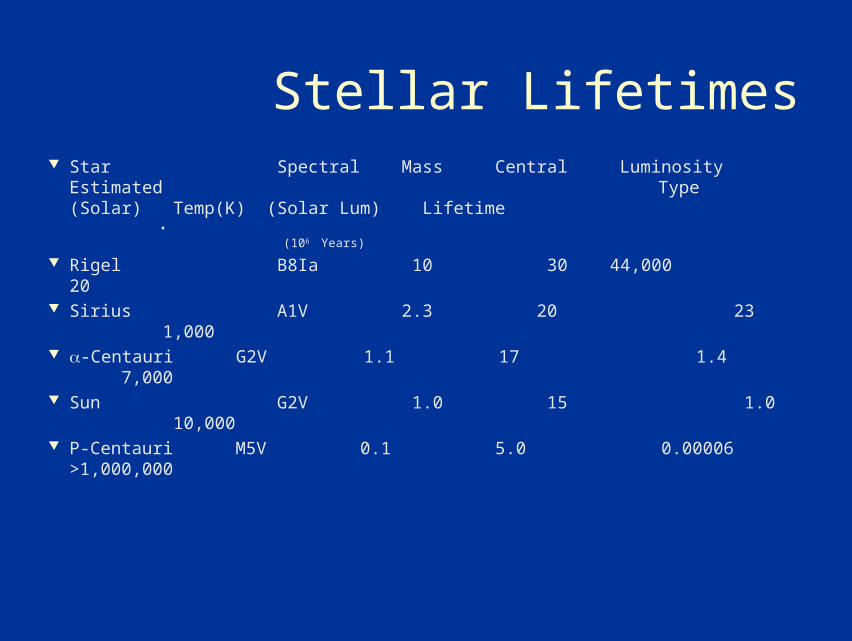
Stellar Lifetimes Star Spectral Mass Central Luminosity Estimated
Type (Solar) Temp(K) (Solar Lum) Lifetime
• (106 Years)
Rigel B8Ia 10 30 44,000 20 Sirius A1V 2.3 20 23 1,000 -Centauri G2V 1.1 17 1.4 7,000 Sun G2V 1.0 15 1.0 10,000 P-Centauri M5V 0.1 5.0 0.00006 >1,000,000
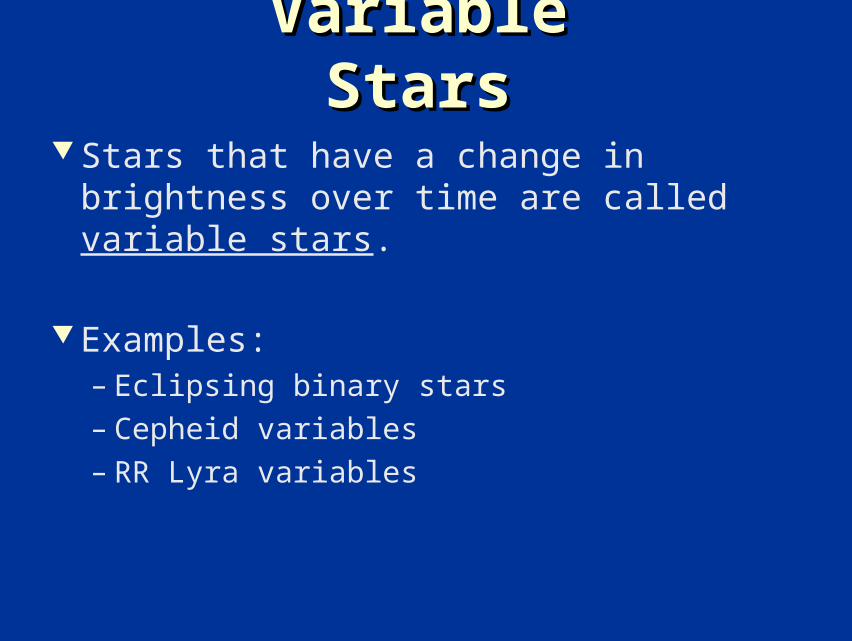
Variable StarsVariable Stars
Stars that have a change in brightness over time are called variable stars.
Examples:– Eclipsing binary stars– Cepheid variables– RR Lyra variables
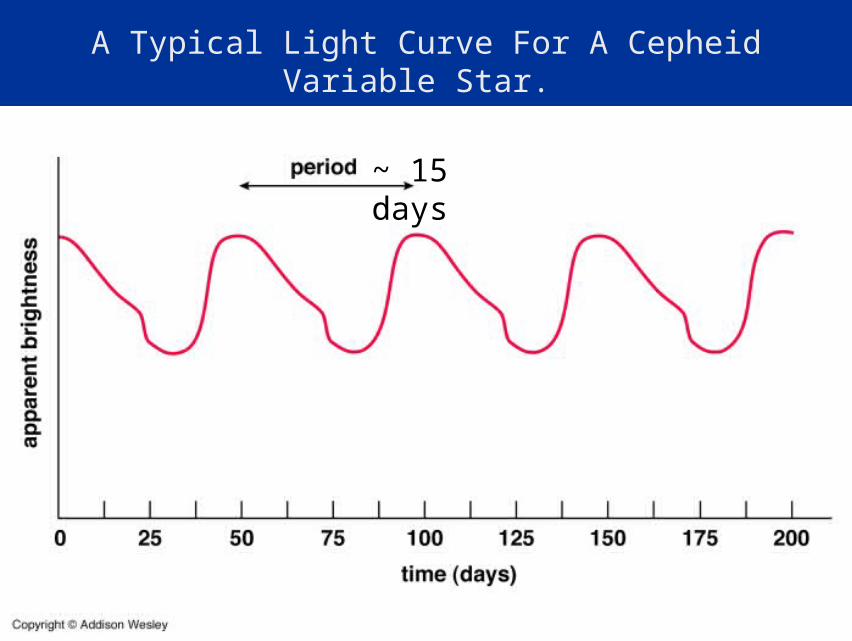
A Typical Light Curve For A Cepheid Variable Star.
~ 15 days
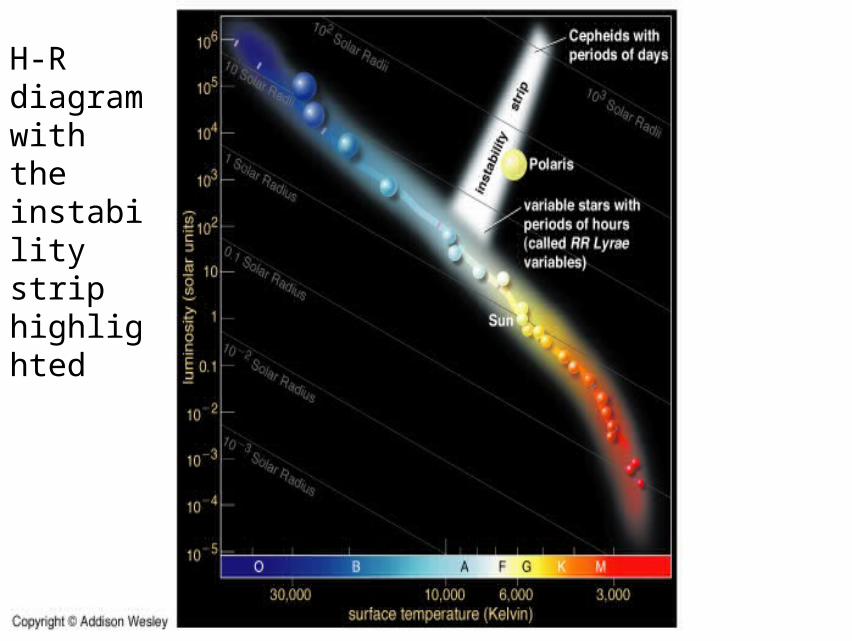
H-R diagram with the instability strip highlighted
Star Clusters
Open Clusters: Loosely bound collection of tens to hundreds of stars, a few parsecs across, generally found in the plane of the Milky Way.
Globular Clusters: Tightly bound, roughly spherical collection of hundreds of thousands , and sometimes millions, of stars spanning about 50 parsecs. Globular Clusters are distributed in the halos around the Milky Way and other galaxies.
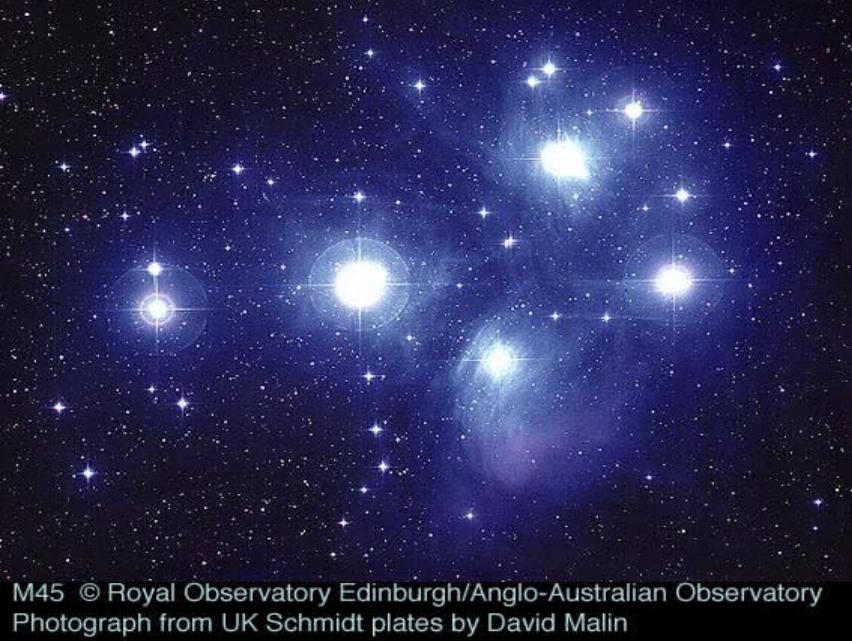
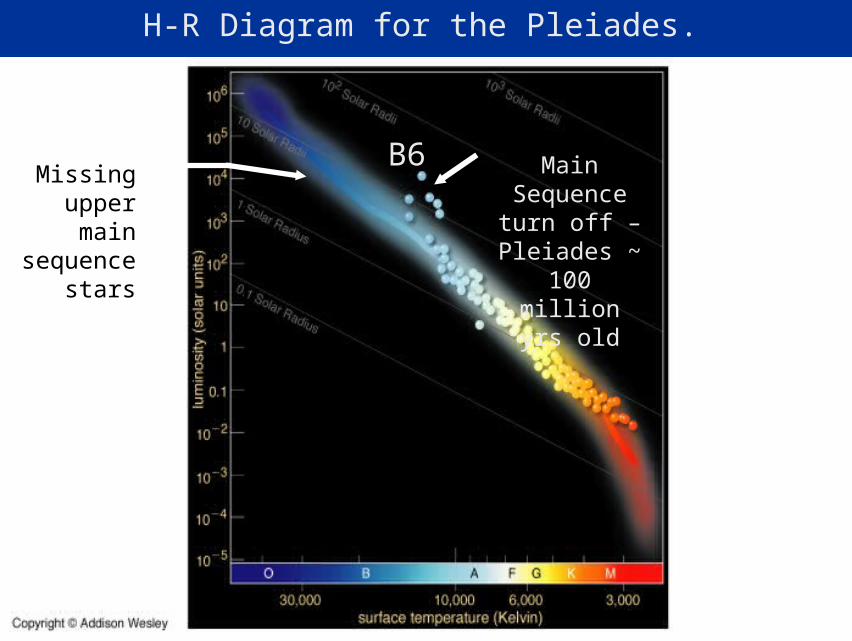
H-R Diagram for the Pleiades.
Missing upper main
sequence stars
Main Sequence turn off –
Pleiades ~ 100 million yrs old
B6
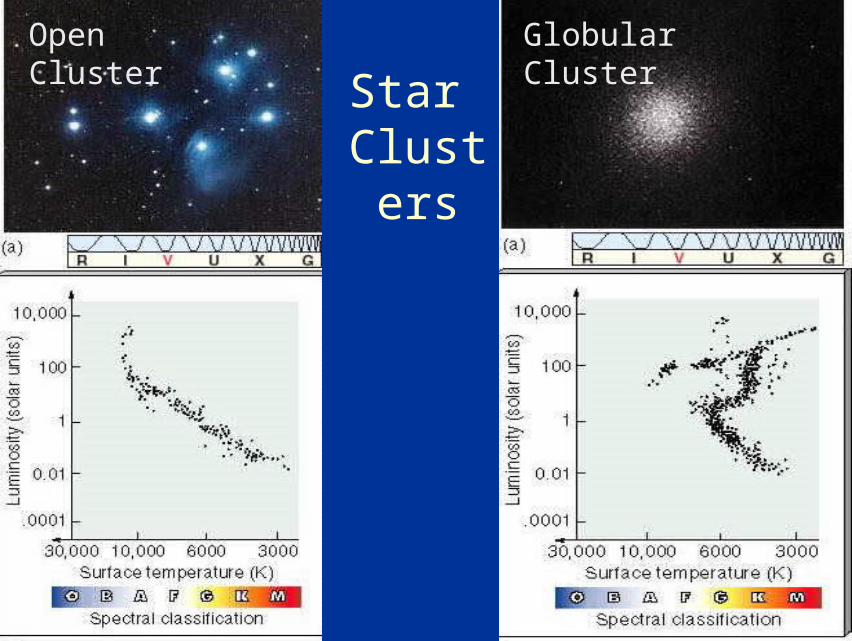
Star Clusters
Open Cluster Globular Cluster
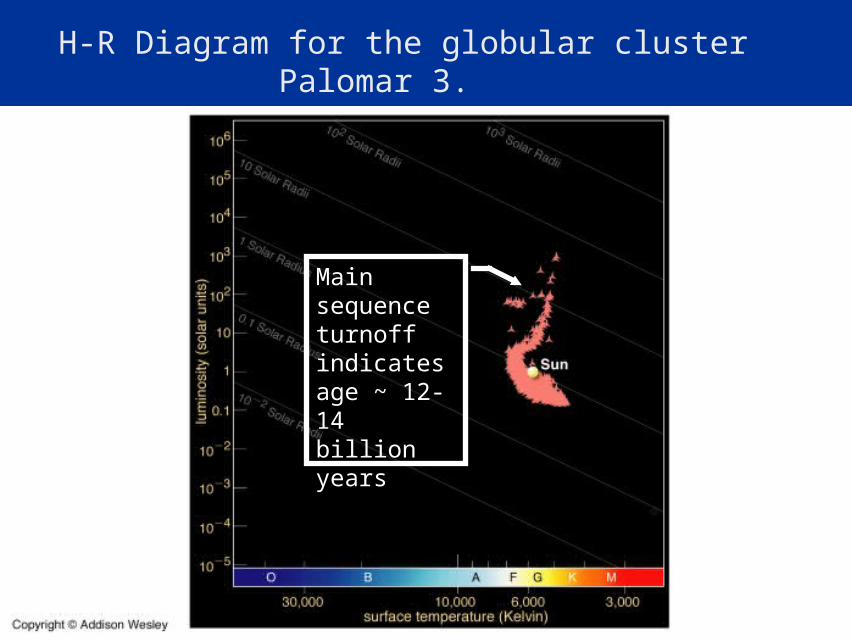
H-R Diagram for the globular cluster Palomar 3.
Main sequence turnoff indicates age ~ 12-14 billion years
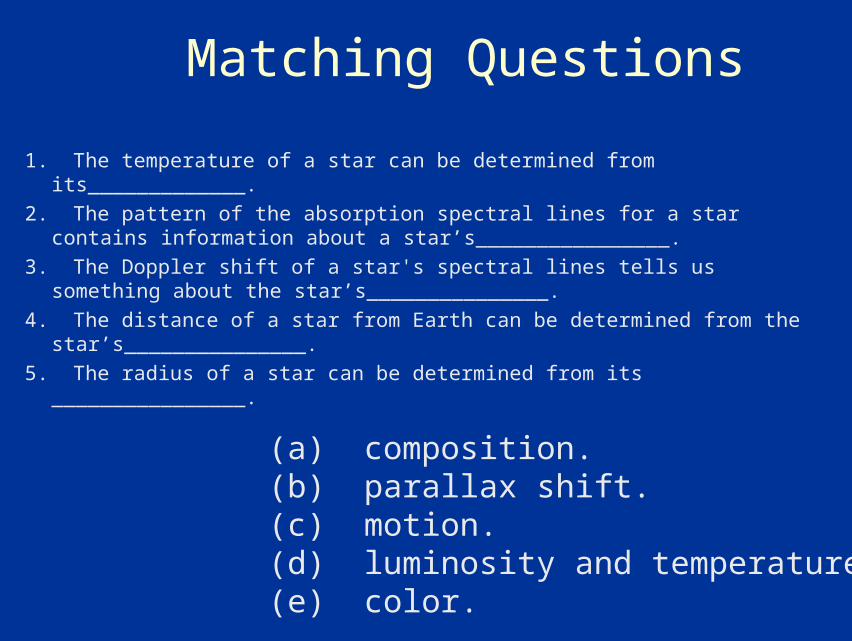
Matching Questions
1. The temperature of a star can be determined from its_____________.
2. The pattern of the absorption spectral lines for a star contains information about a star’s________________.
3. The Doppler shift of a star's spectral lines tells us something about the star’s_______________.
4. The distance of a star from Earth can be determined from the star’s_______________.
5. The radius of a star can be determined from its ________________.
(a) composition.(b) parallax shift.(c) motion.(d) luminosity and temperature.(e) color.
H-R Diagram Questions1. What property is measure along
the horizontal axis?
2. … along the vertical axis?
3. Where are the red giants?
4. … the white dwarfs?
5. … the hottest stars?
6. … the coolest stars?
7. … the largest stars?
8. … the smallest stars?
H-R Diagram Questions9. Where are O class stars?
10. … M class stars?
11. … G class stars?
12. Where is the Sun?
13. Where are the high-mass main-
sequence stars?
14. Where are the low-mass main-
sequence stars?
15. Where are the oldest stars?
16. Which stars along the main-sequence
live the longest?
End of Chapter 13
![[PPT]Chapter #1: Basics of Surveying - Faculty Personal ...faculty.kfupm.edu.sa/CE/kaluwfi/Surveying/CE260 CH 1.ppt · Web viewChapter #1: Basics of Surveying 1.1 Surveying Defined](https://static.documents.pub/doc/80x56/5abdf95a7f8b9aa3088c4dc9/pptchapter-1-basics-of-surveying-faculty-personal-ch-1pptweb-viewchapter.jpg)


