38
Chapter 12: Chapter 12: IR Spectroscopy and Mass IR Spectroscopy and Mass Spectrometry Spectrometry 1
| Date post: | 06-Sep-2018 |
| Category: |
Documents |
| Upload: | nguyentuong |
| View: | 217 times |
| Download: | 0 times |
Chapter 12: Chapter 12: IR Spectroscopy and Mass IR Spectroscopy and Mass
SpectrometrySpectrometrySpectrometrySpectrometry
1
� Introduction (12.1)� Spectroscopy: Techniques for analyzing
molecules based on absorption and emission of radiation. A characteristic of any spectroscopic technique is that it does not destroy the sample.
There are 4 major types of � There are 4 major types of spectroscopies:� Infrared� Mass Spectrometry (not a spectroscopic technique)� Nuclear Magnetic Resonance (NMR)� Ultraviolet Spectroscopy
2
Infrared SpectroscopyInfrared Spectroscopy ((12.312.3--12.12)12.12)
� This type of spectroscopy is used mostly to identify some key functional groups in the molecules.
� Infrared range between 10000-100 cm-1� Infrared range between 10000-100 cm-1
but we are interested in the range 4000-400 cm-1
3
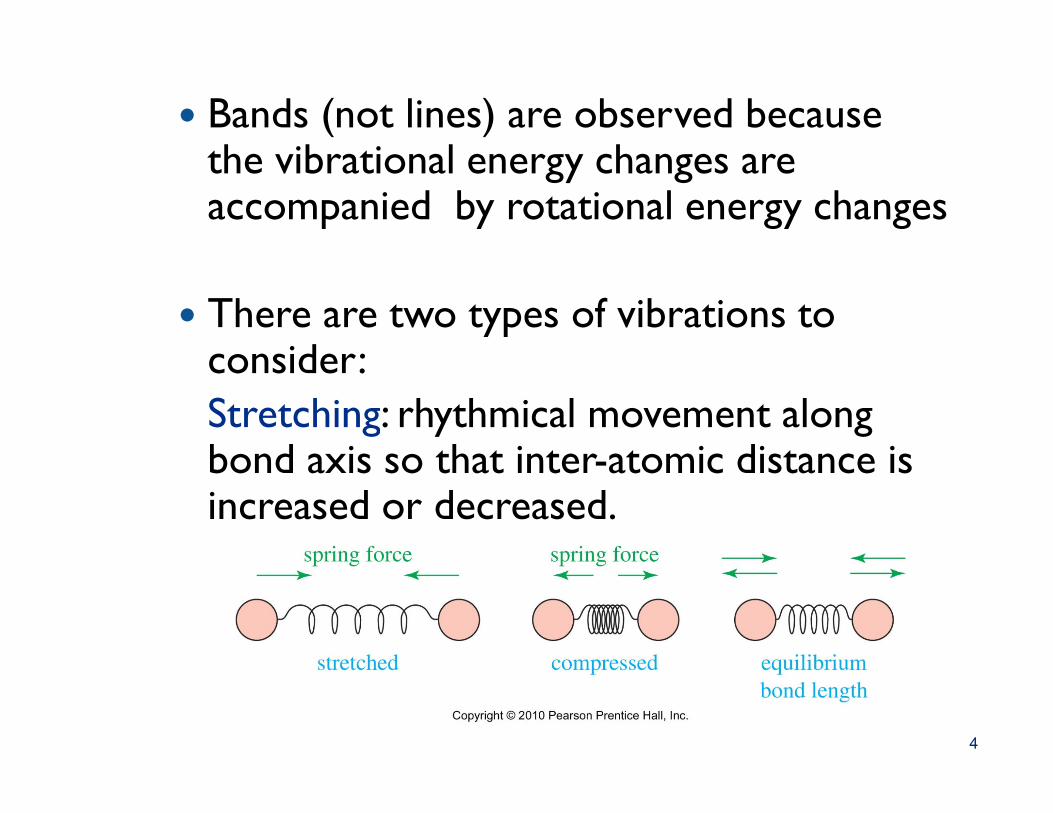
� Bands (not lines) are observed because the vibrational energy changes are accompanied by rotational energy changes
� There are two types of vibrations to consider: Stretching: rhythmical movement along Stretching: rhythmical movement along bond axis so that inter-atomic distance is increased or decreased.
4
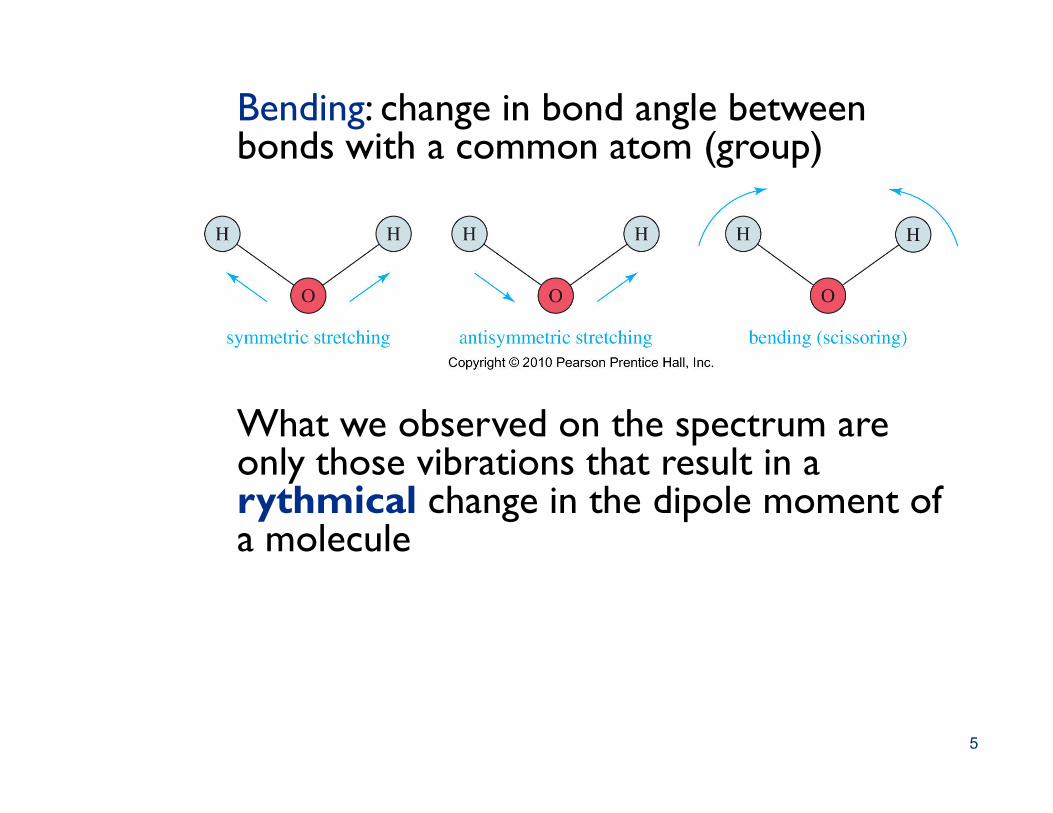
Bending: change in bond angle between bonds with a common atom (group)
What we observed on the spectrum are What we observed on the spectrum are only those vibrations that result in a rythmical change in the dipole moment of a molecule
5
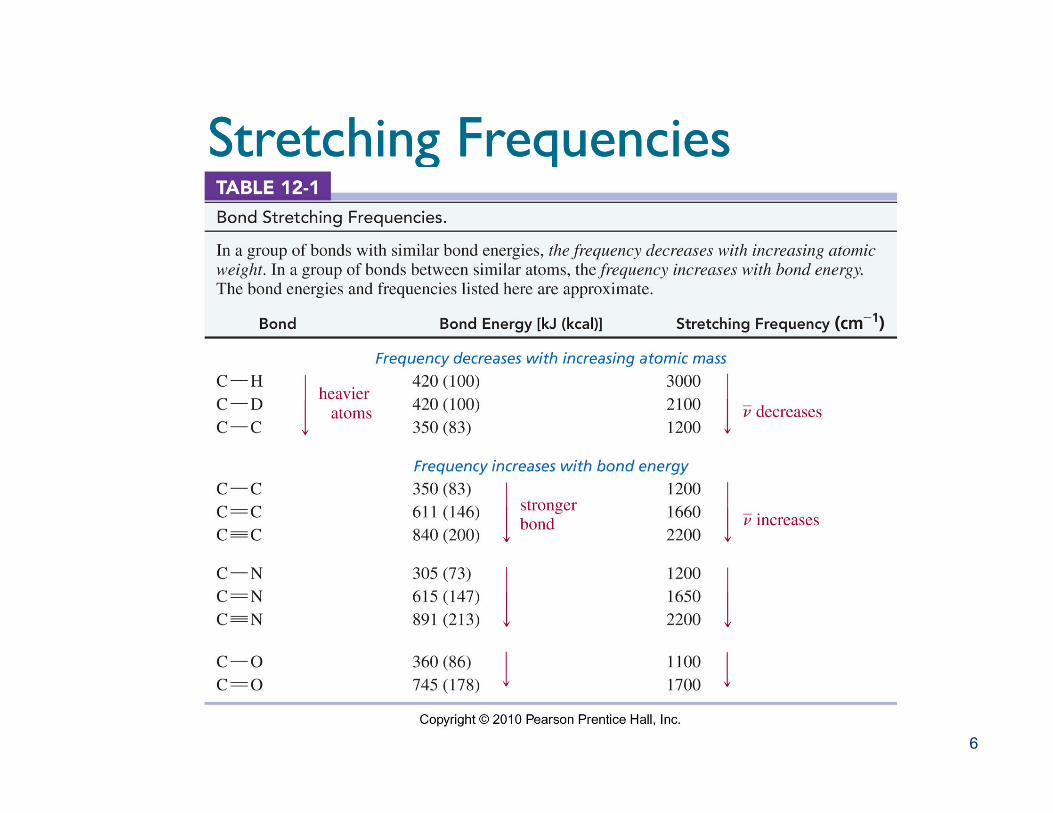
Stretching FrequenciesStretching Frequencies
6
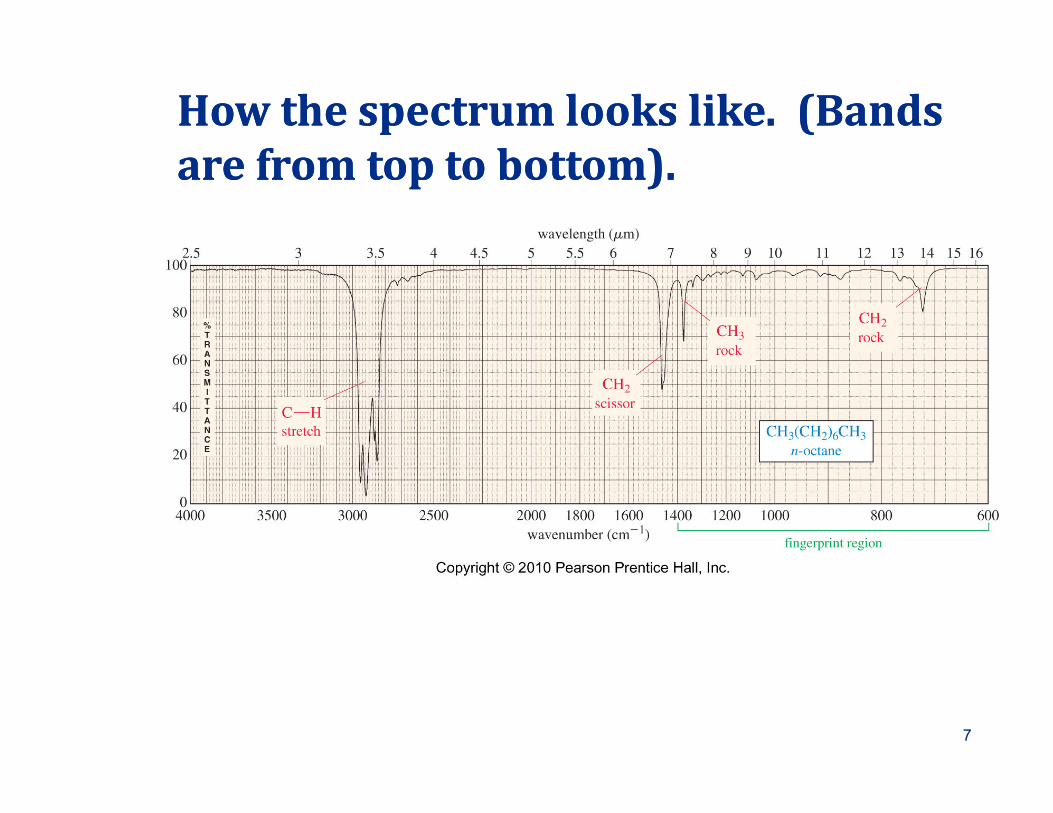
How the spectrum looks like. (Bands How the spectrum looks like. (Bands are from top to bottom).are from top to bottom).
7
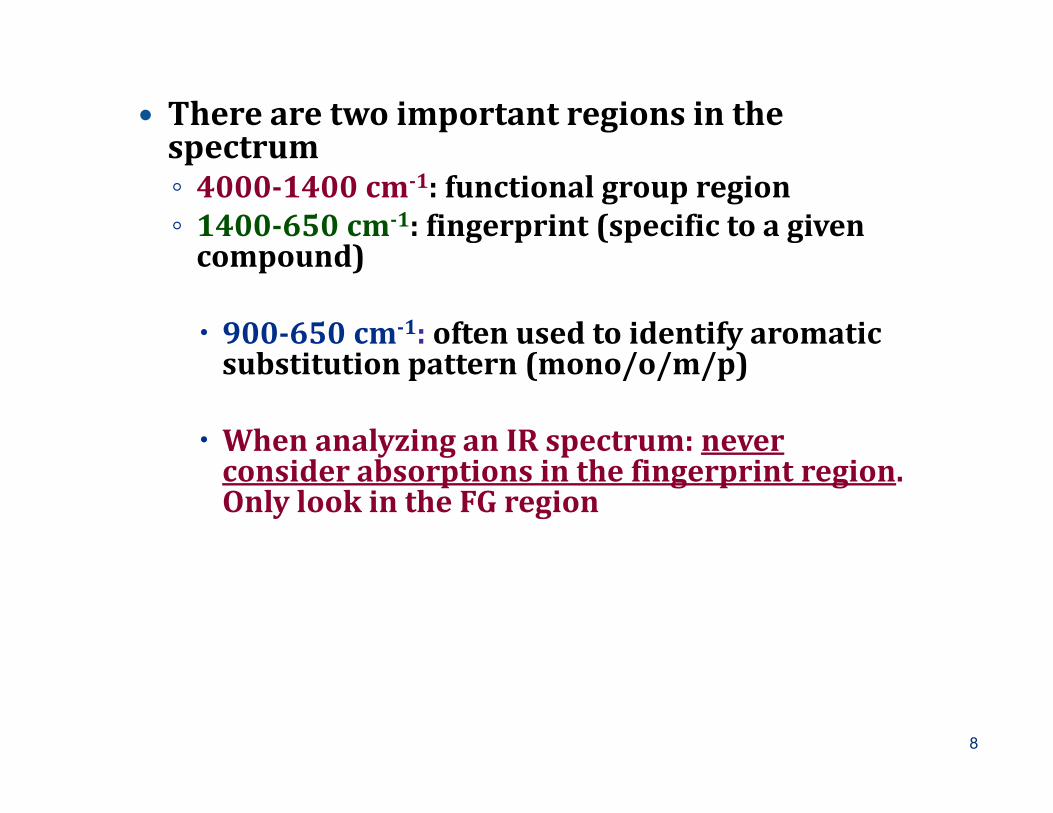
� There are two important regions in the spectrum◦ 4000-1400 cm-1: functional group region◦ 1400-650 cm-1: fingerprint (specific to a given
compound)
� 900-650 cm-1: often used to identify aromatic substitution pattern (mono/o/m/p)
� When analyzing an IR spectrum: never consider absorptions in the fingerprint region. Only look in the FG region
8
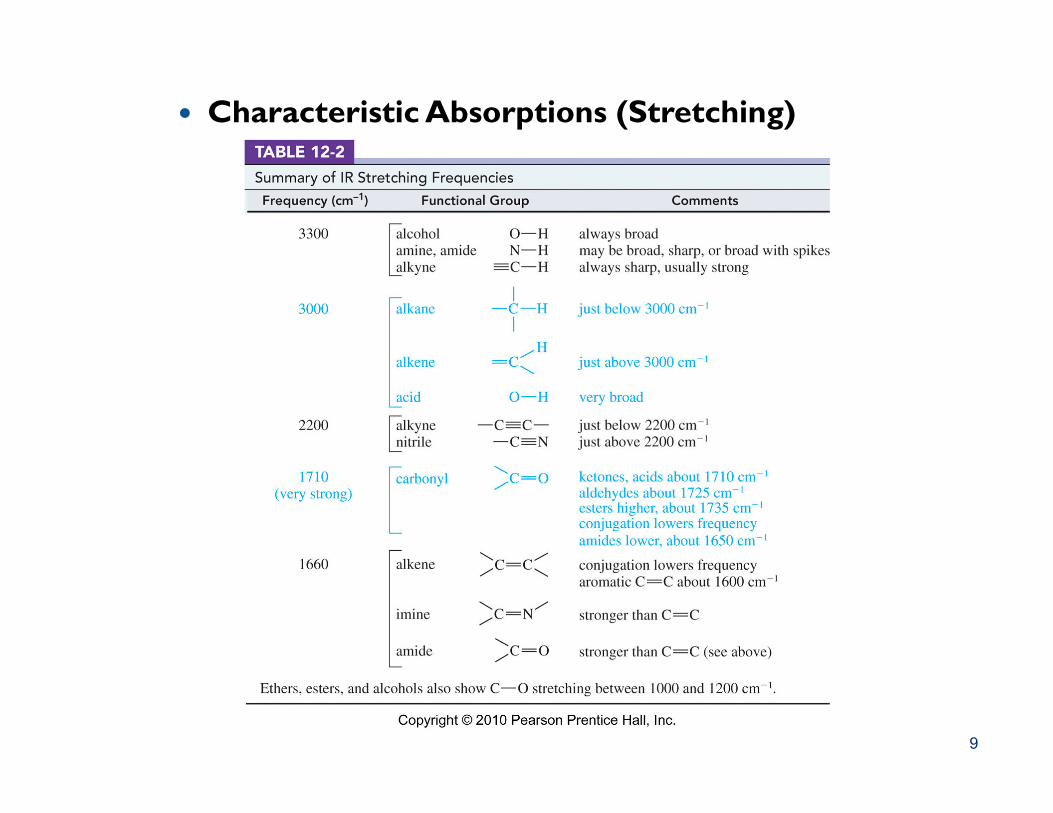
� Characteristic Absorptions (Stretching)
9
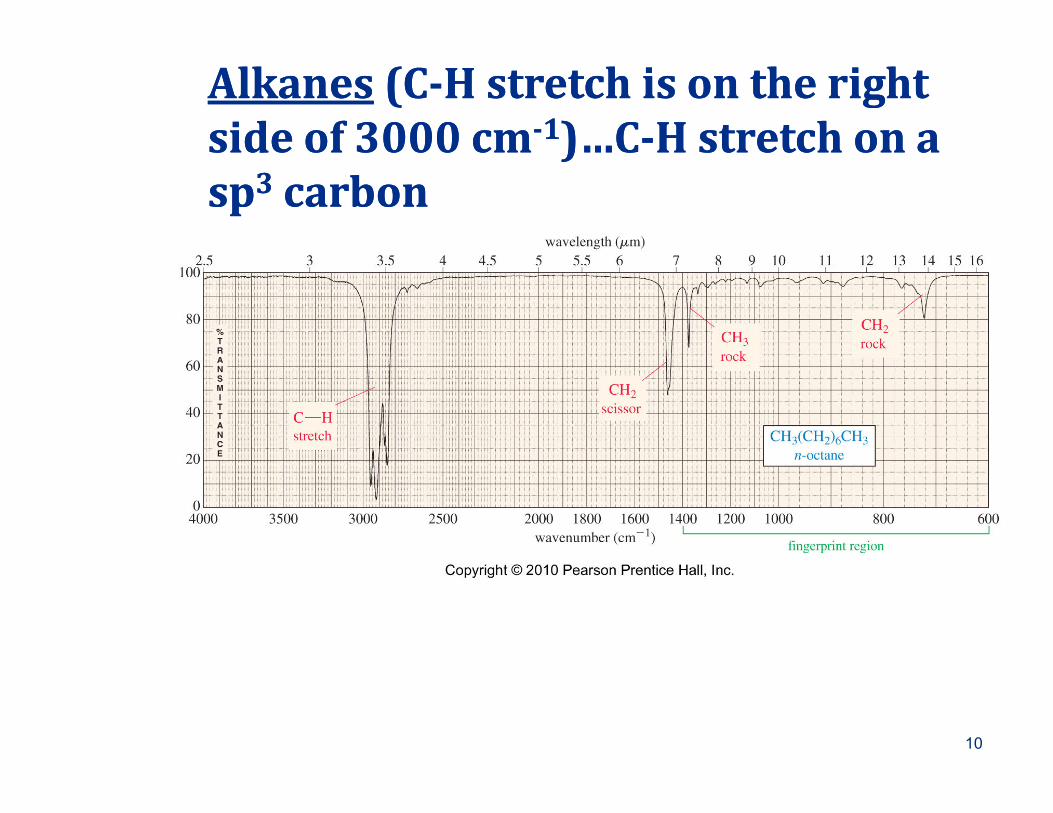
AlkanesAlkanes (C(C--H stretch is on the right H stretch is on the right side of 3000 cmside of 3000 cm--11)…C)…C--H stretch on a H stretch on a spsp33 carboncarbon
10
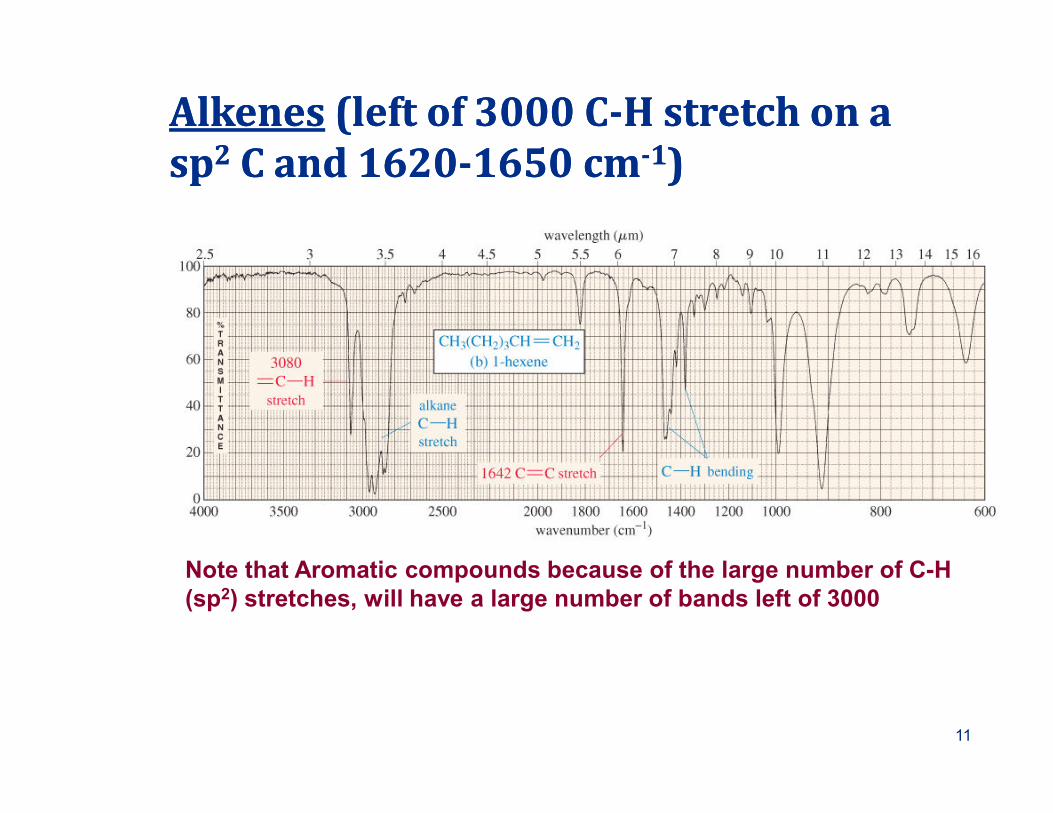
AlkenesAlkenes (left of 3000 (left of 3000 CC--H stretch on a H stretch on a spsp22 C and C and 16201620--1650 cm1650 cm--11))
Note that Aromatic compounds because of the large number of C-H (sp2) stretches, will have a large number of bands left of 3000
11
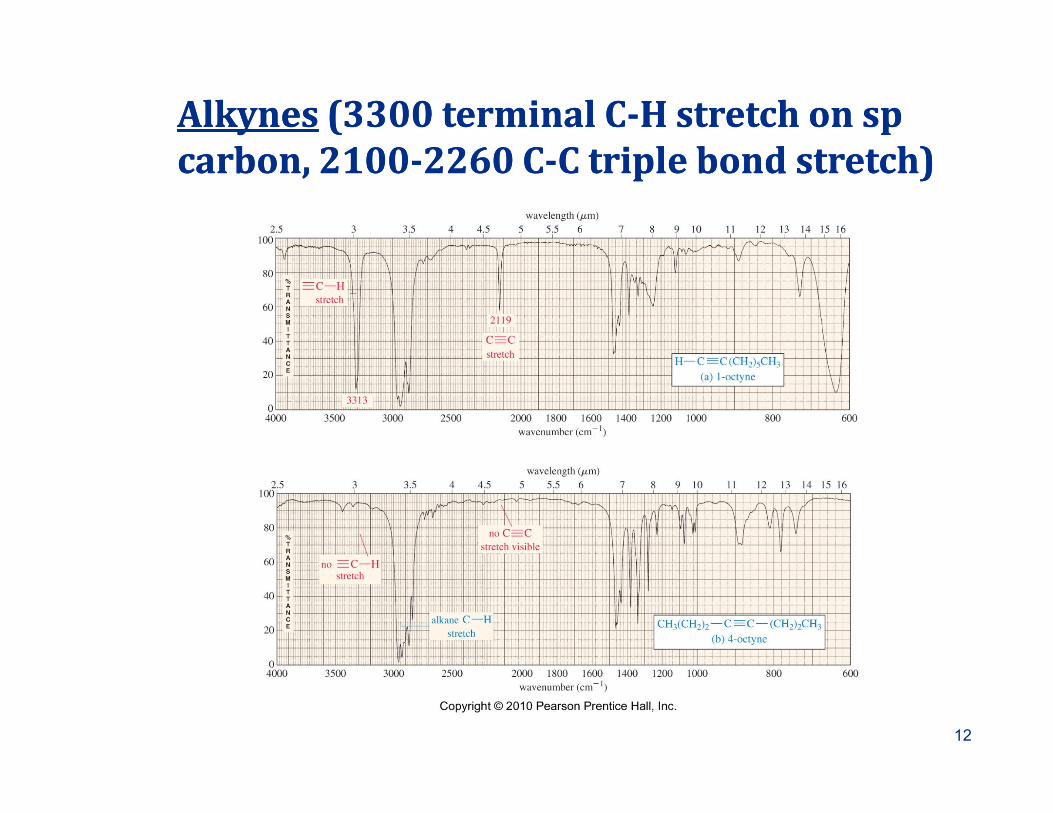
AlkynesAlkynes (3300 terminal (3300 terminal CC--H stretch on sp H stretch on sp carbon, carbon, 21002100--2260 2260 CC--C triple bond stretch)C triple bond stretch)
12
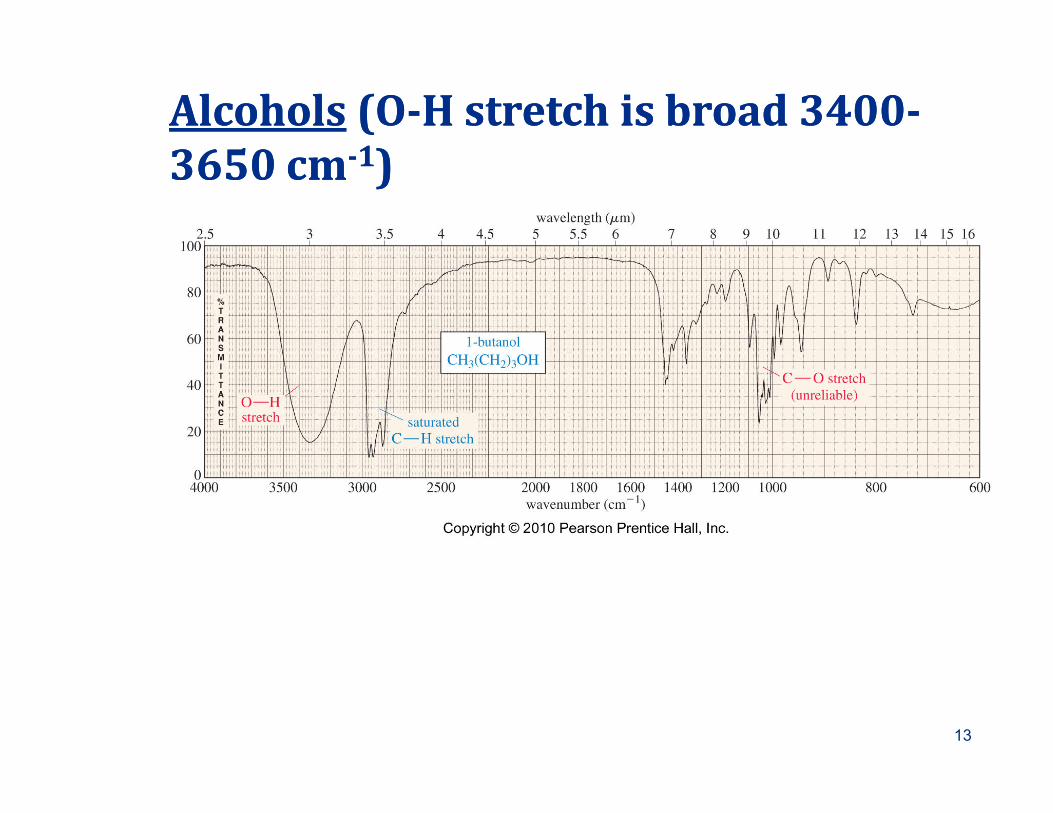
AlcoholsAlcohols (O(O--H stretch is broad H stretch is broad 34003400--3650 cm3650 cm--11))
13
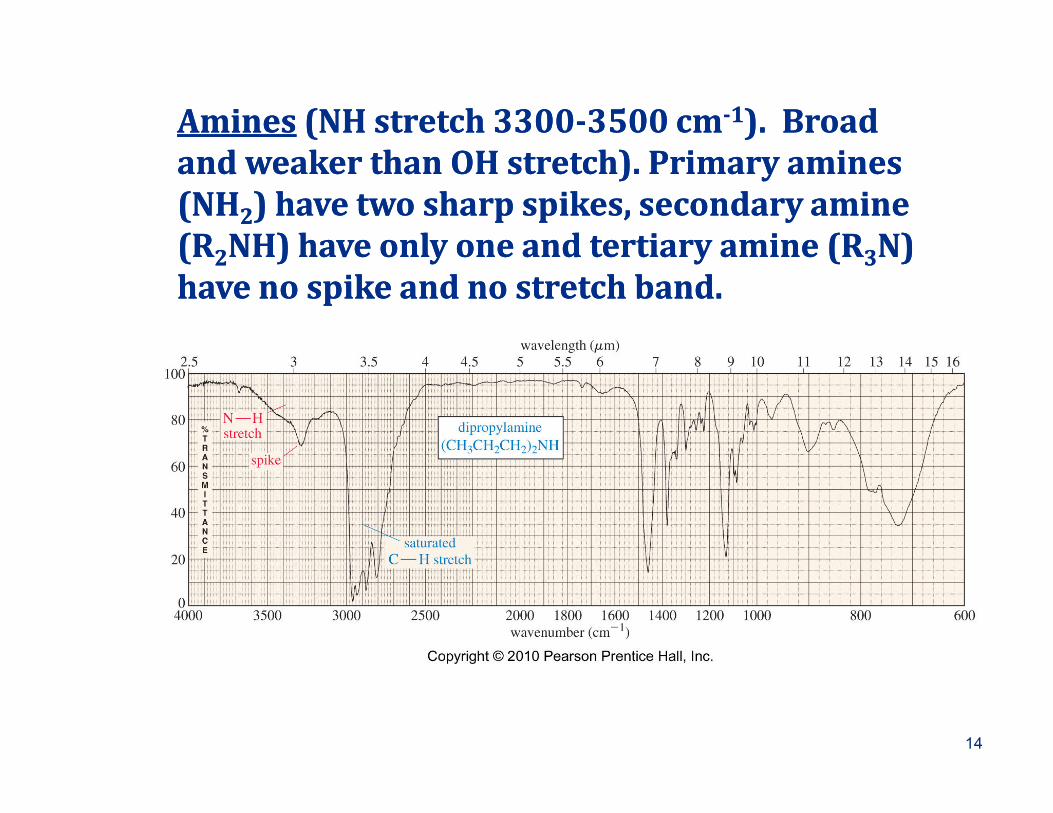
AminesAmines (NH (NH stretch 3300stretch 3300--3500 3500 cmcm--11). ). Broad Broad and weaker and weaker than than OH stretch). Primary amines OH stretch). Primary amines (NH(NH22) have two sharp spikes, secondary amine ) have two sharp spikes, secondary amine (R(R22NH) have only one and tertiary amine (RNH) have only one and tertiary amine (R33N) N) have no spike and no stretch band.have no spike and no stretch band.
14
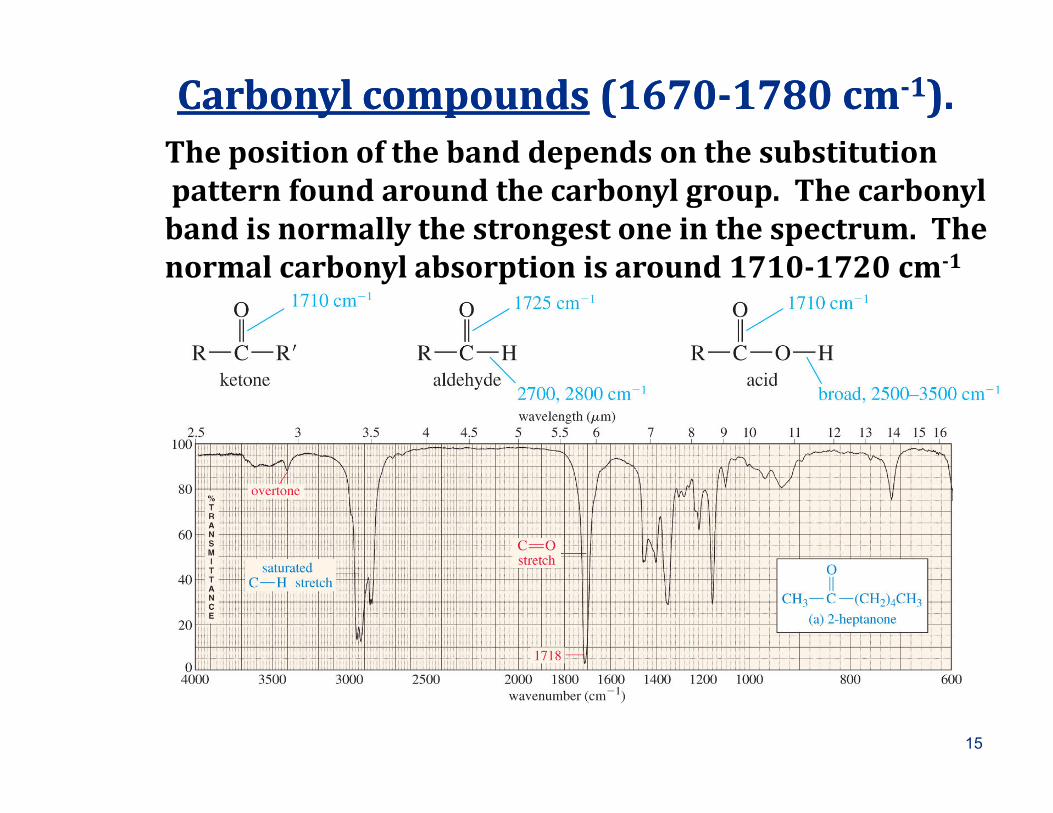
Carbonyl compoundsCarbonyl compounds (1670(1670--1780 cm1780 cm--11). ). The position of the band depends on the substitutionpattern found around the carbonyl group. The carbonylband is normally the strongest one in the spectrum. Thenormal carbonyl absorption is around 1710-1720 cm-1
15
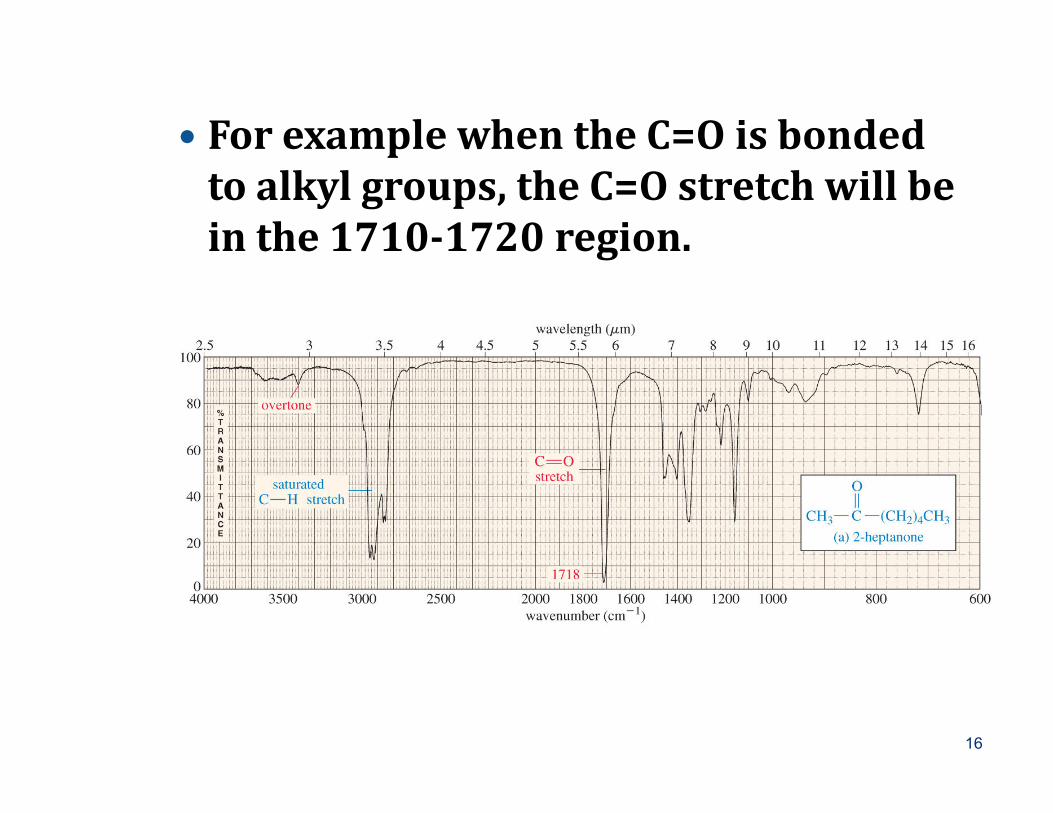
� For example when the C=O is bonded to alkyl groups, the C=O stretch will be in the 1710-1720 region.
16

� The same is true for aldehydes, but here you will also find two very strong C-H stretch in the 2720 and 2820 region.
17
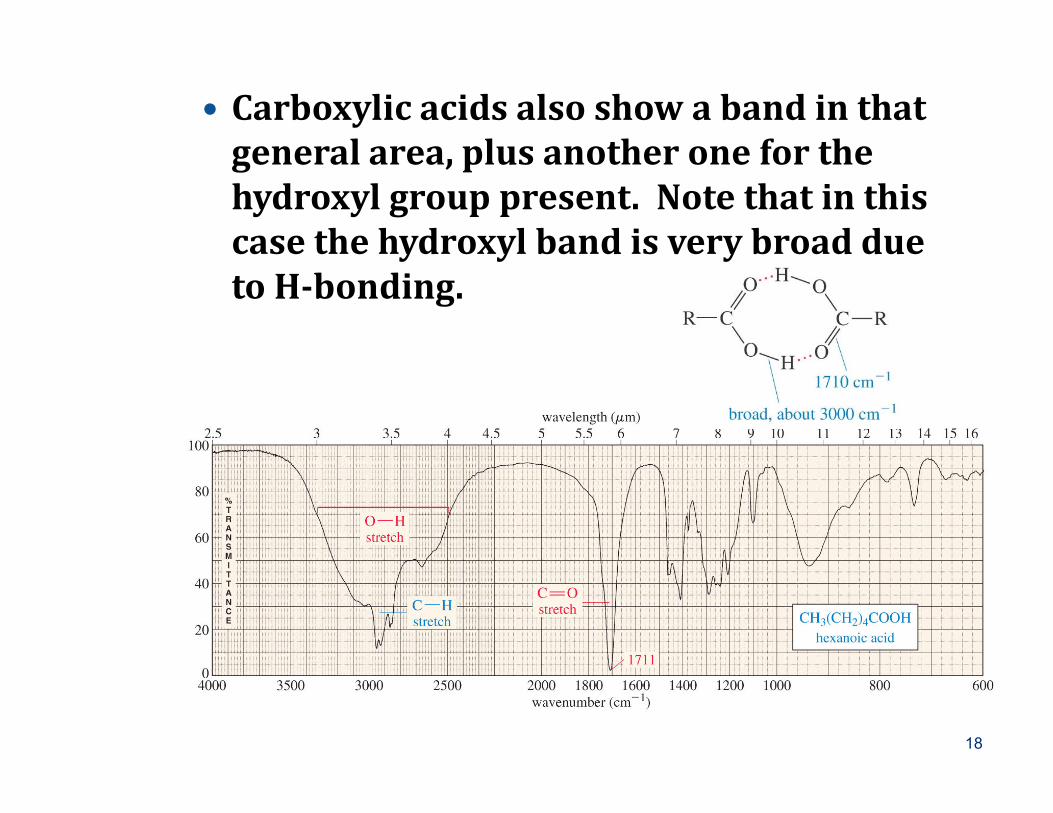
� Carboxylic acids also show a band in that general area, plus another one for the hydroxyl group present. Note that in this case the hydroxyl band is very broad due to H-bonding.
18
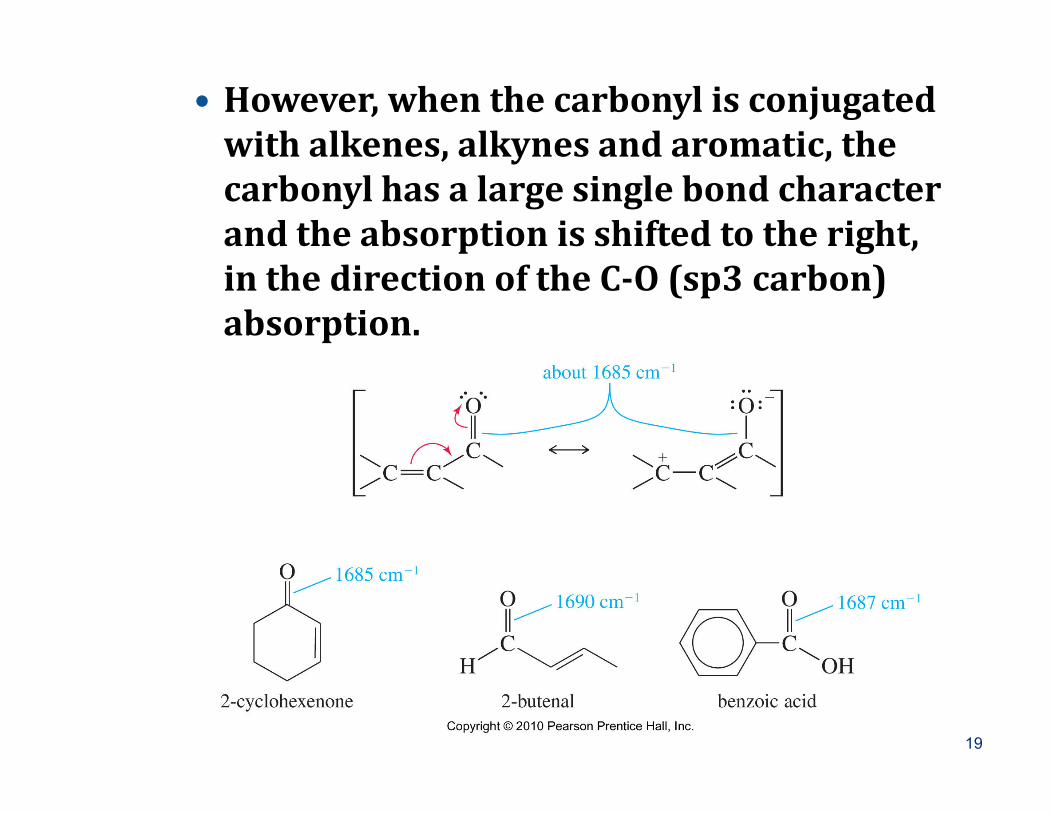
� However, when the carbonyl is conjugated with alkenes, alkynes and aromatic, the carbonyl has a large single bond character and the absorption is shifted to the right, in the direction of the C-O (sp3 carbon) absorption.
19
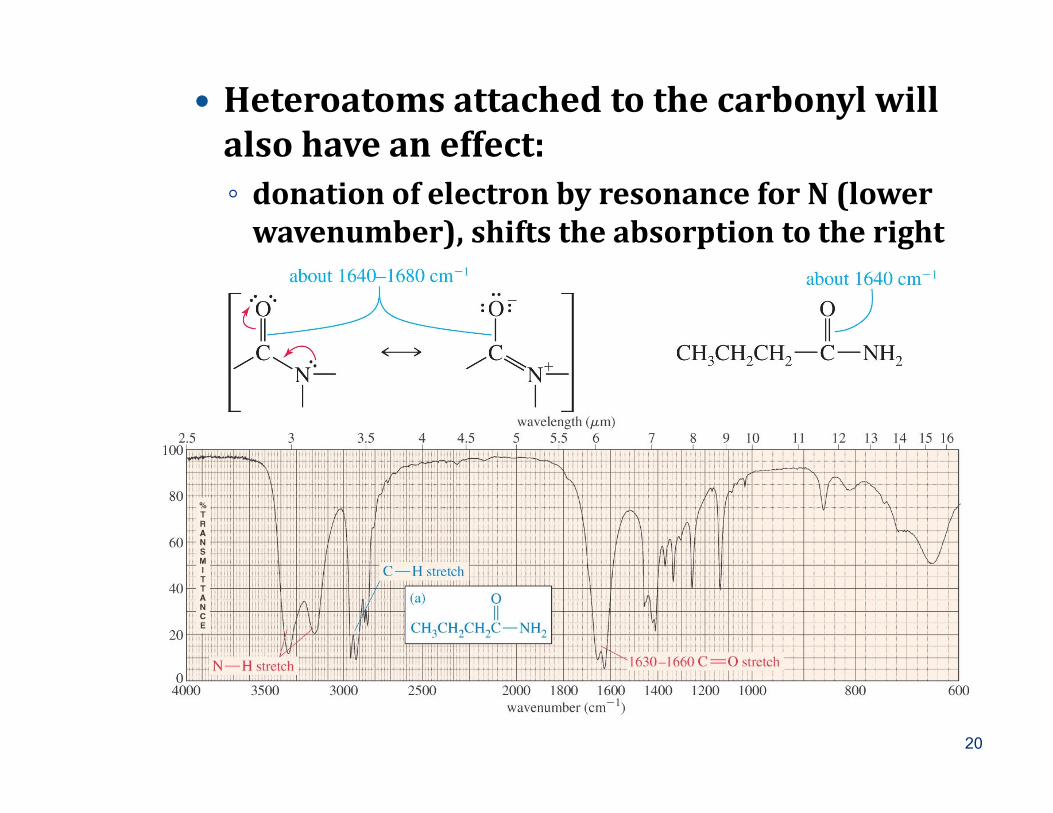
� Heteroatoms attached to the carbonyl will also have an effect:◦ donation of electron by resonance for N (lower
wavenumber), shifts the absorption to the right
20
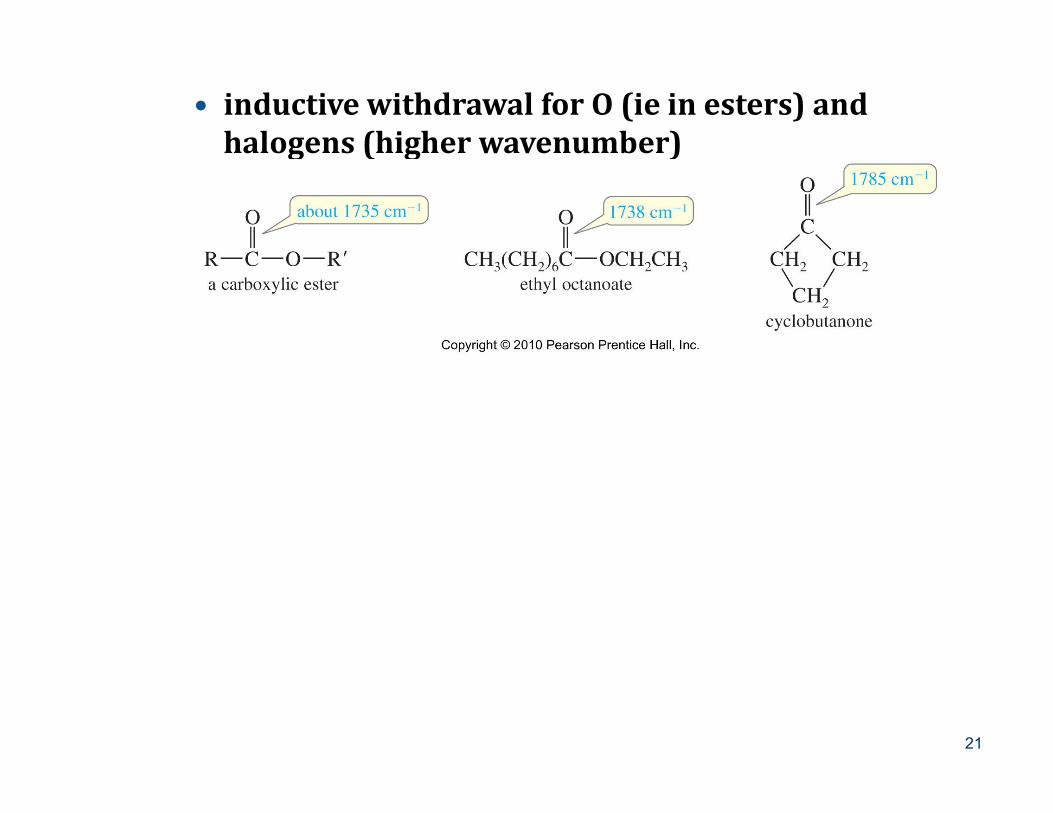
� inductive withdrawal for O (ie in esters) and halogens (higher wavenumber)
21
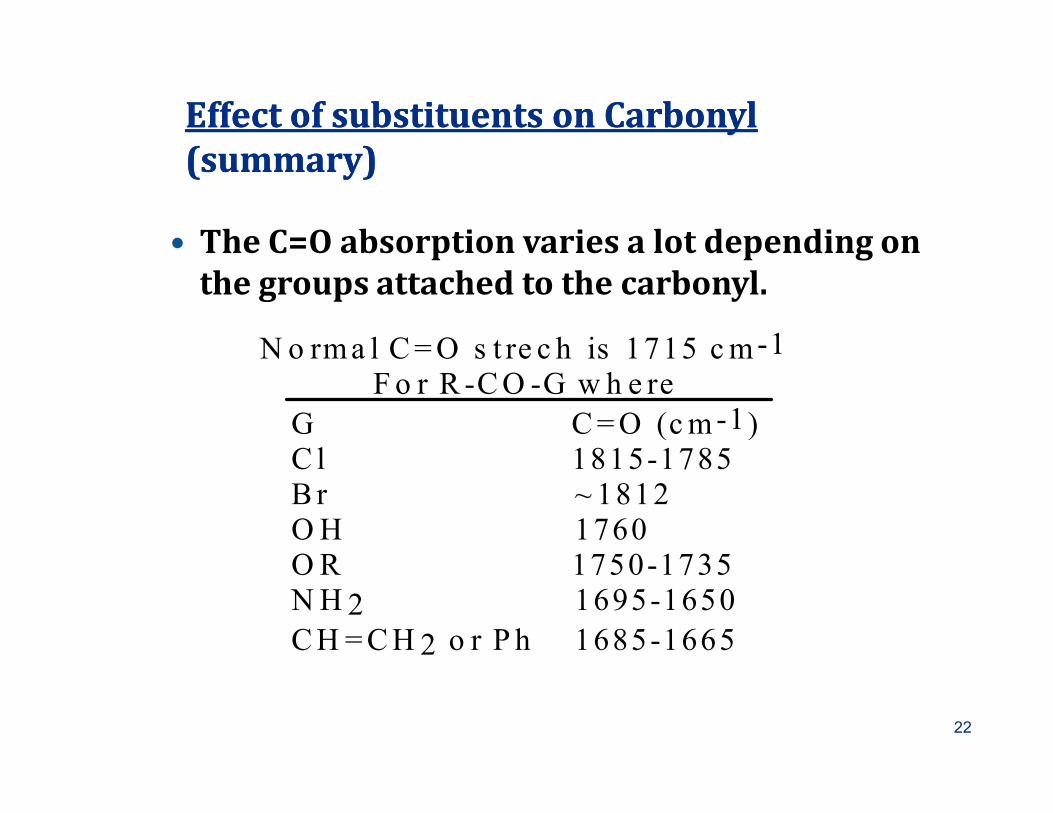
Effect of Effect of substituents on Carbonyl substituents on Carbonyl (summary)(summary)
� The C=O absorption varies a lot depending on the groups attached to the carbonyl.
N o rma l C=O s t re c h is 1715 cm-1Fo r R -CO -G w h e re
G C=O (cm-1)G C=O (cm-1)C l 1815-1785B r ~ 1812OH 1760OR 1750-1735NH 2 1695-1650CH =CH 2 o r P h 1685-1665
22
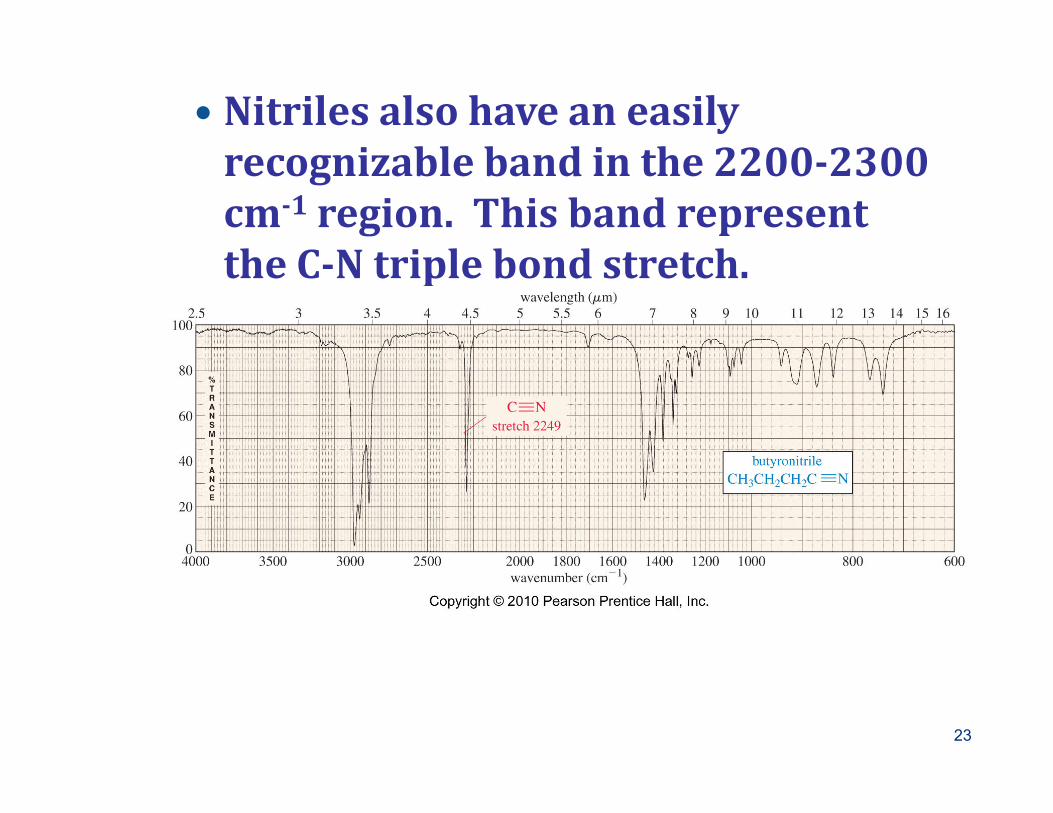
� Nitriles also have an easily recognizable band in the 2200-2300 cm-1 region. This band represent the C-N triple bond stretch.
23
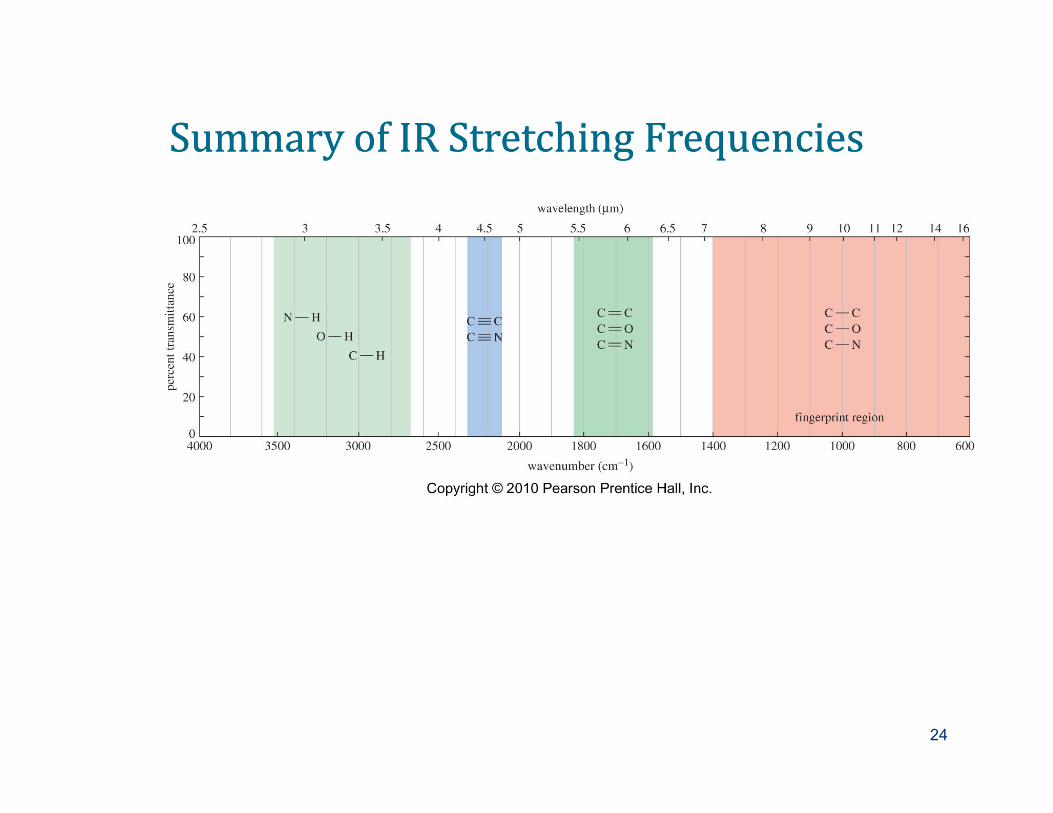
Summary of IR Stretching FrequenciesSummary of IR Stretching Frequencies
24
� Interpreting IR Spectra (12.12)
The most important factor to remember about IR spectra is that it is a tool to help determine key functional groups. As such, you should never look to the right of 1600cm-1 (fingerprint region) of an IR spectrum.
25
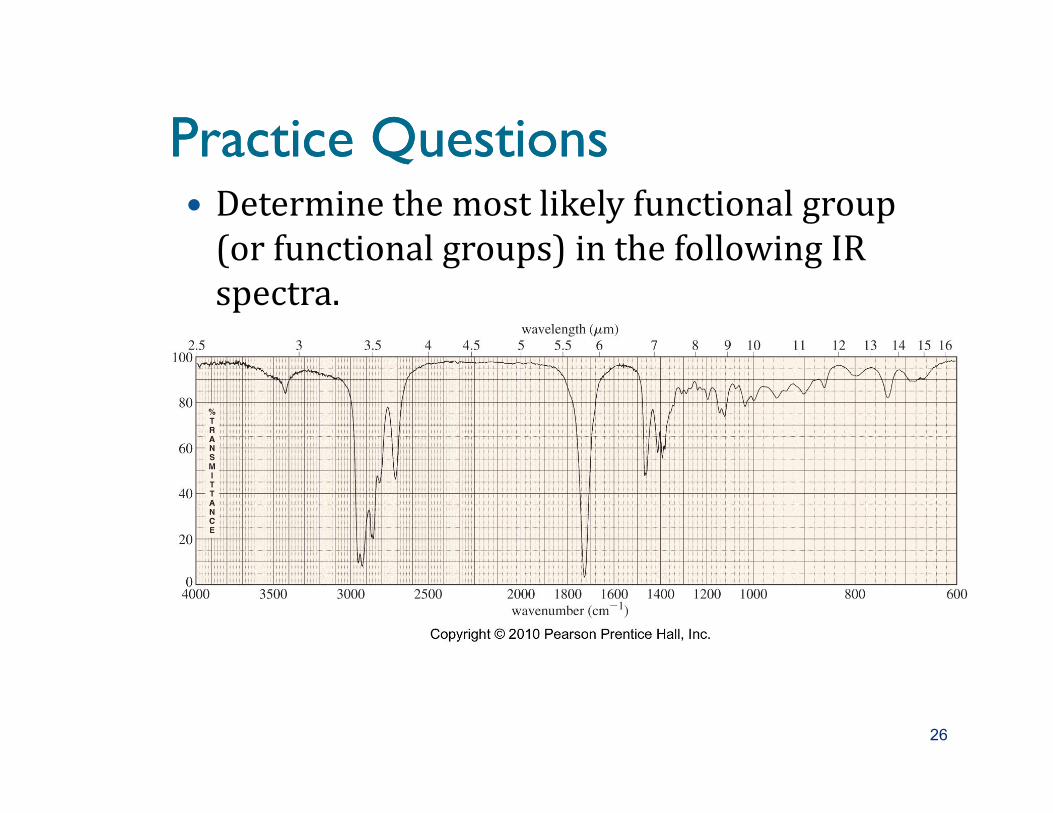
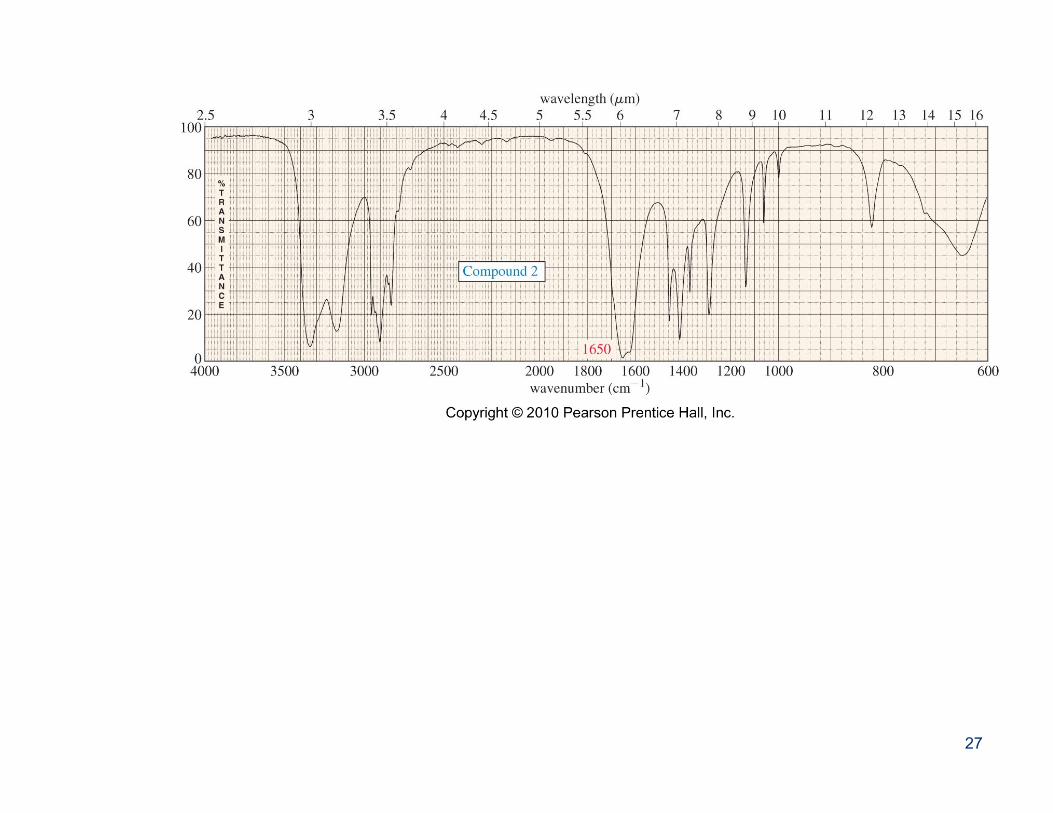
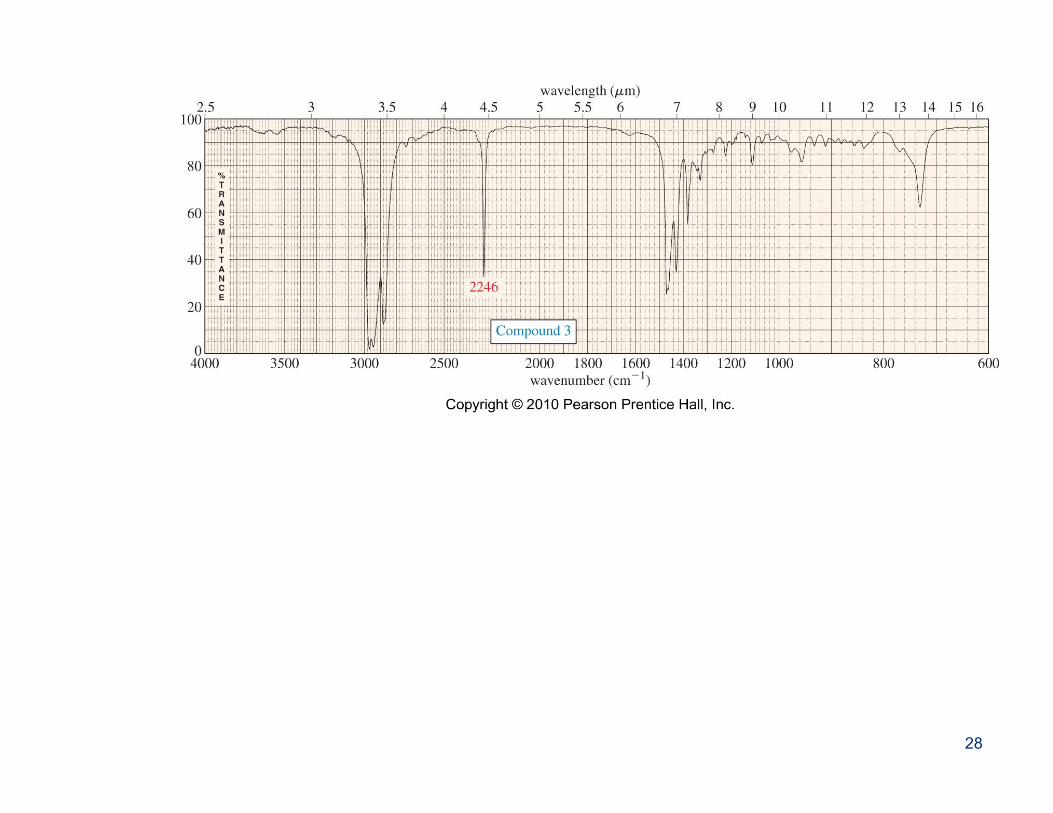
Practice QuestionsPractice Questions� Determine the most likely functional group
(or functional groups) in the following IR spectra.
26
27
28
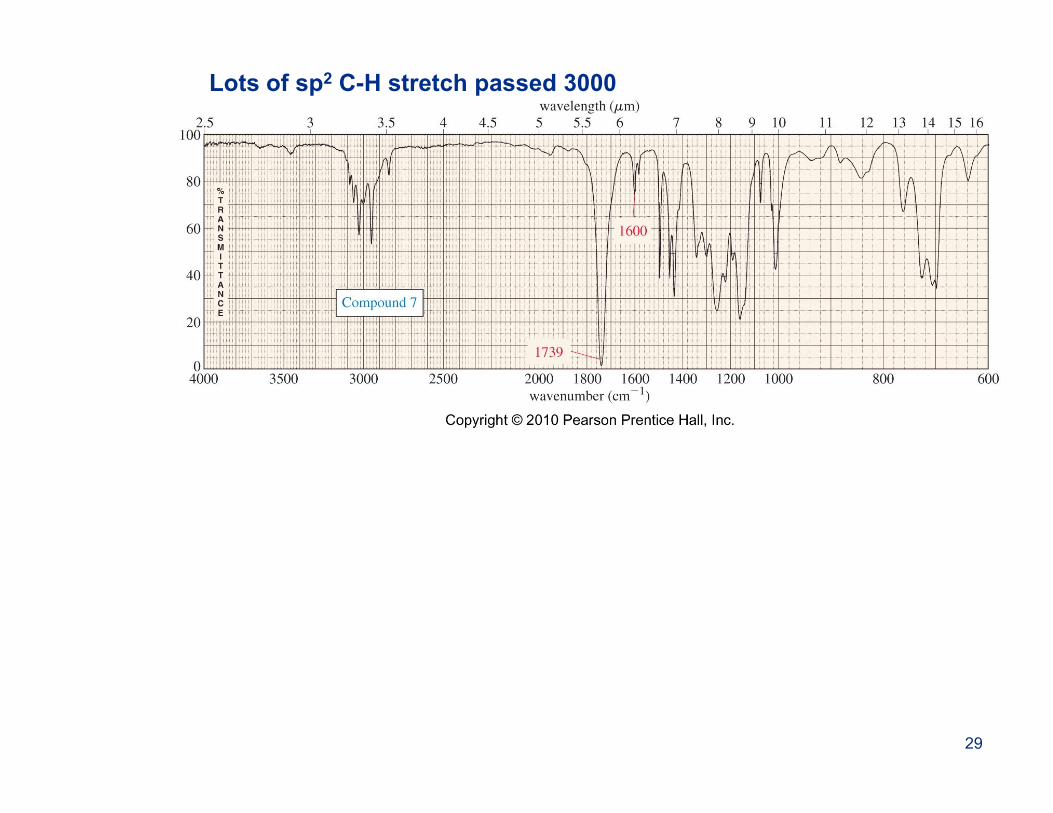
Lots of sp2 C-H stretch passed 3000
29
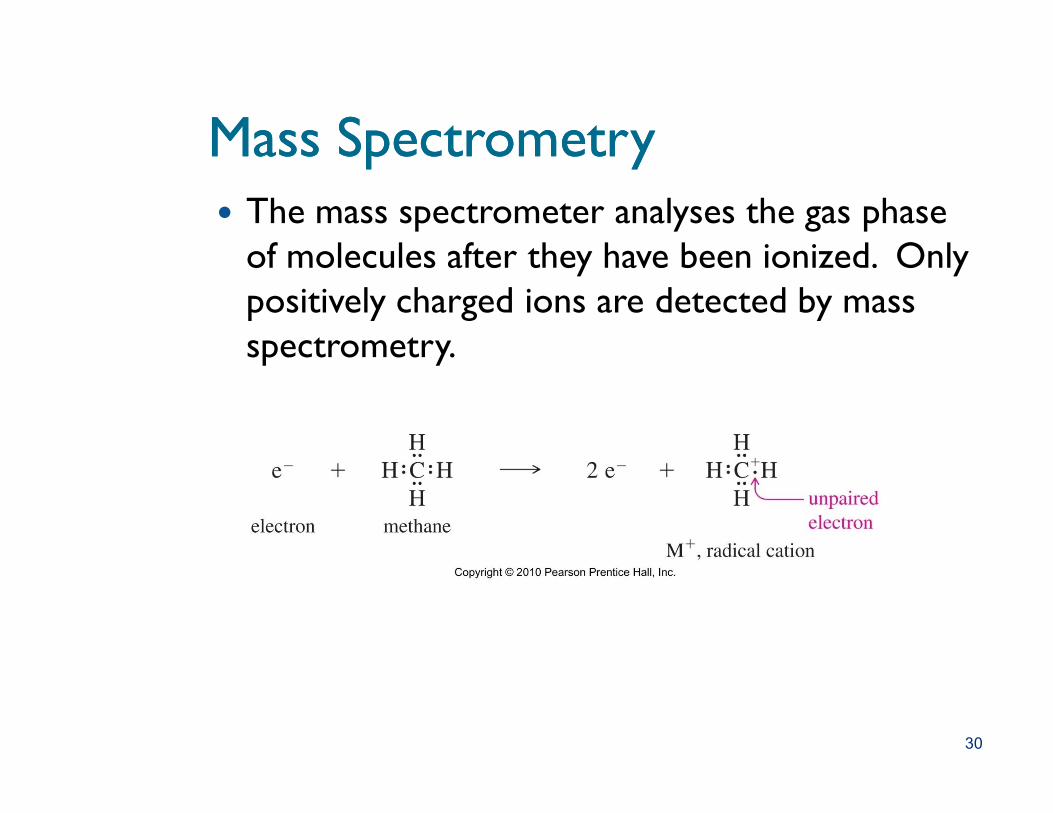
Mass Mass SpectrometrySpectrometry� The mass spectrometer analyses the gas phase of molecules after they have been ionized. Only positively charged ions are detected by mass spectrometry.
30
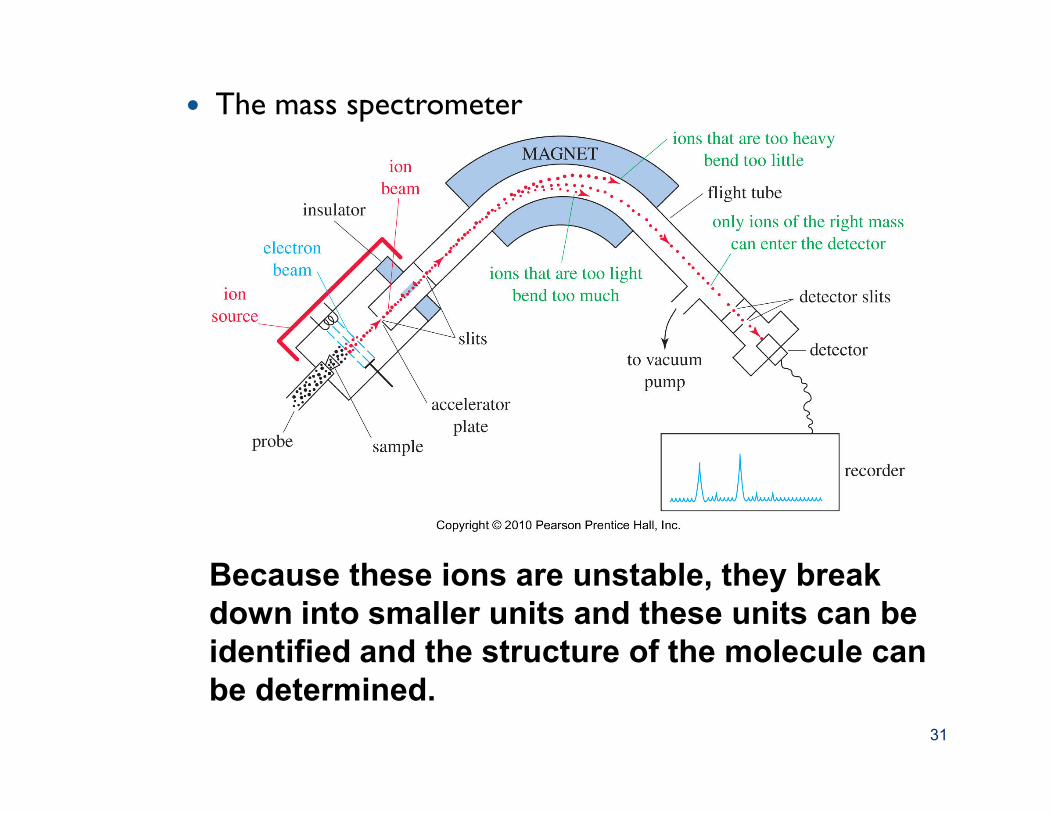
� The mass spectrometer
Because these ions are unstable, they break down into smaller units and these units can be identified and the structure of the molecule can be determined.
31
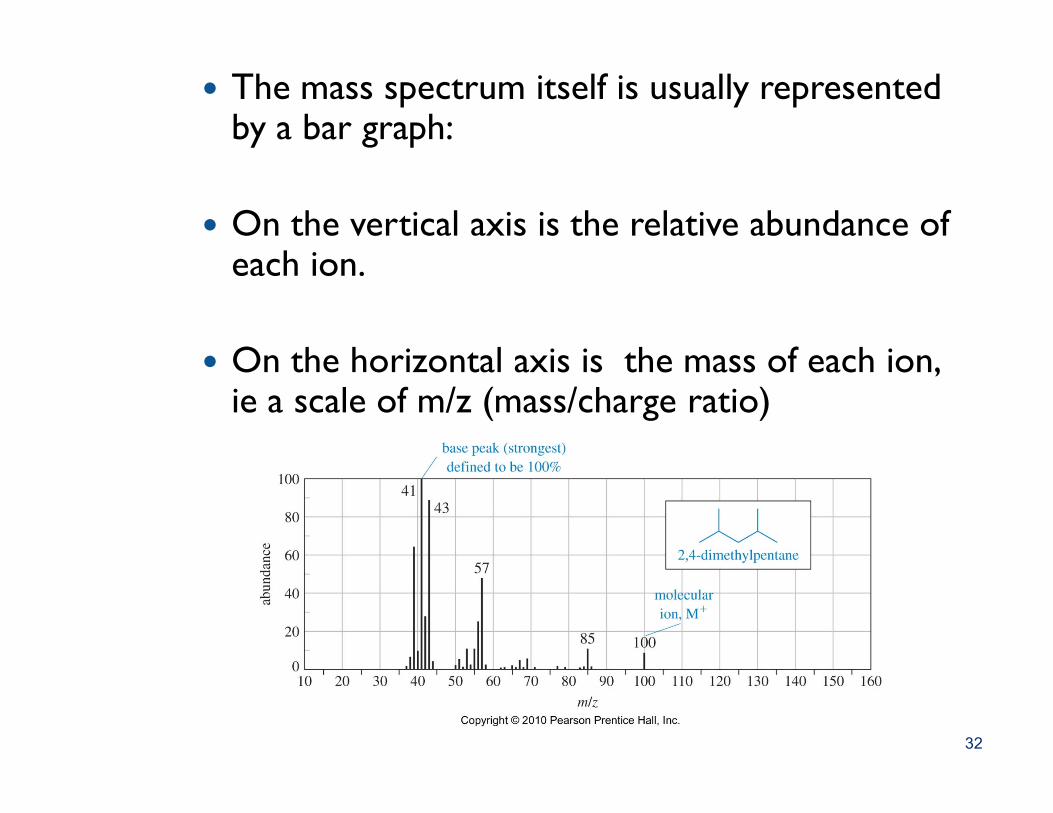
� The mass spectrum itself is usually represented by a bar graph:
� On the vertical axis is the relative abundance of each ion.
� On the horizontal axis is the mass of each ion, ie a scale of m/z (mass/charge ratio)ie a scale of m/z (mass/charge ratio)
32
� The tallest peak in the spectrum is assign an intensity of 100% and is called the:
base peak
� The peak further to the right in the spectrum often represents the parent ion(the ion from the original molecule before any fragmentation has occurred). before any fragmentation has occurred). Often referred to as Molecular ion or M+
33
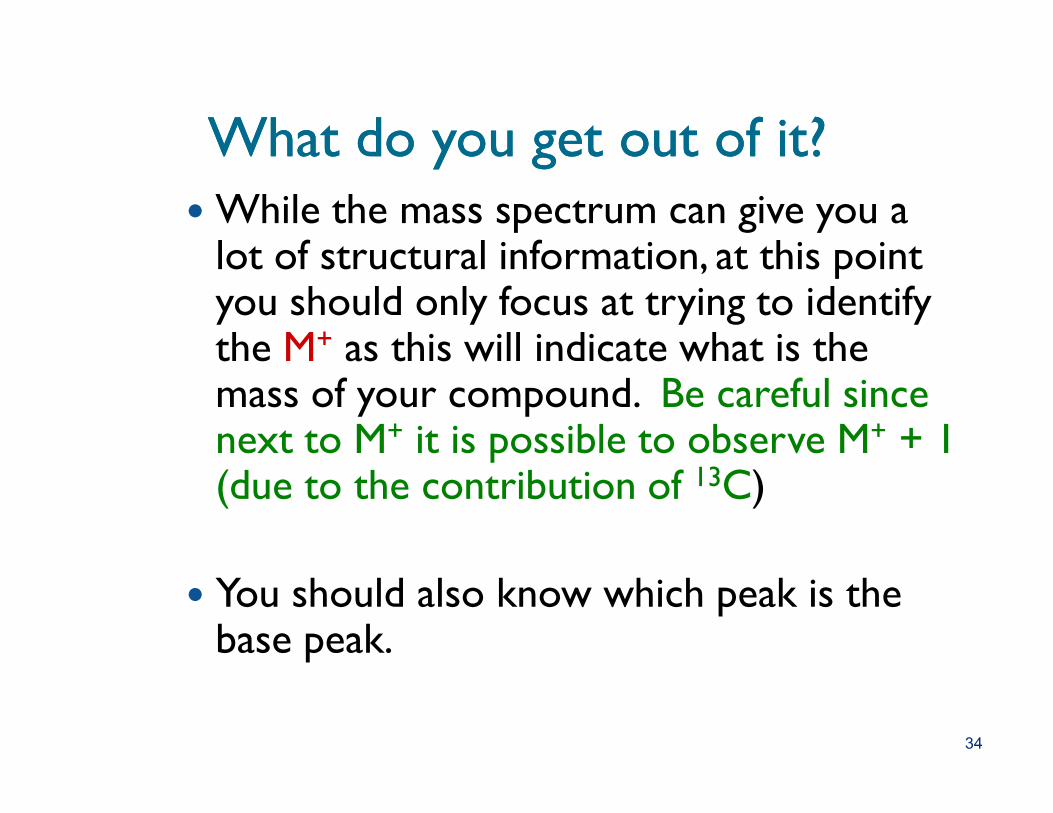
What do you get out of it?What do you get out of it?� While the mass spectrum can give you a lot of structural information, at this point you should only focus at trying to identify the M+ as this will indicate what is the mass of your compound. Be careful since mass of your compound. Be careful since next to M+ it is possible to observe M+ + 1 (due to the contribution of 13C)
� You should also know which peak is the base peak.
34
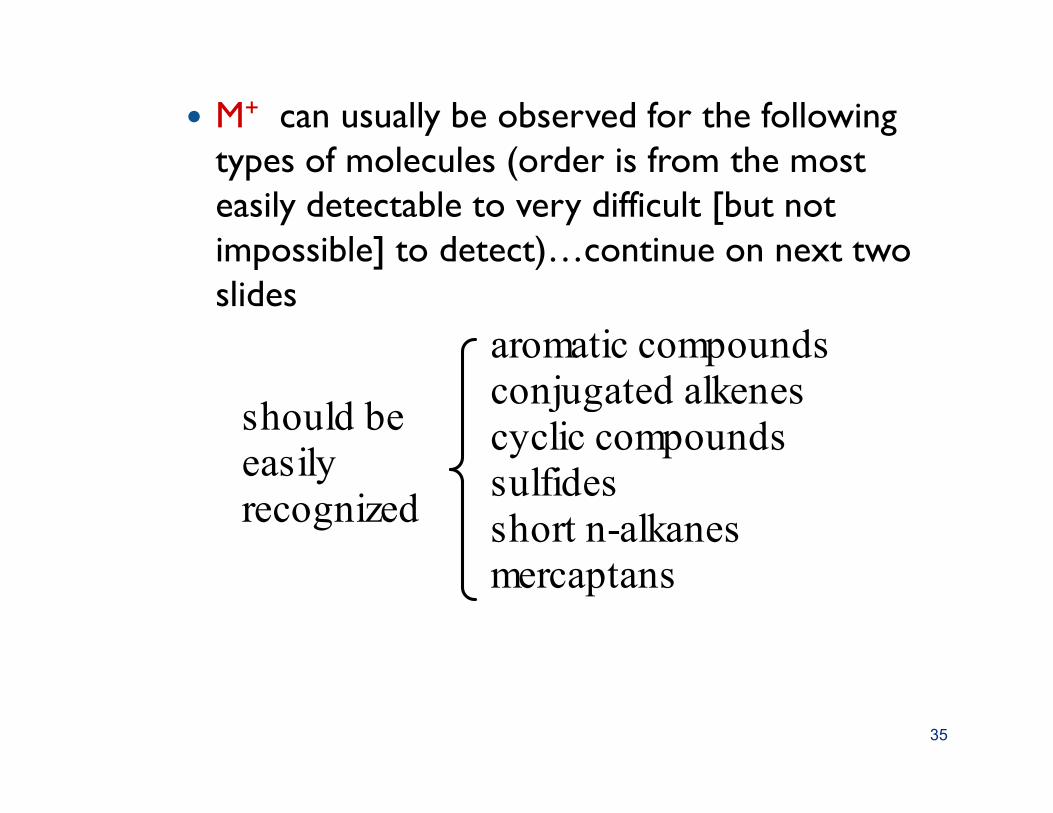
� M+ can usually be observed for the following types of molecules (order is from the most easily detectable to very difficult [but not impossible] to detect)…continue on next two slides
aromatic compoundsconjugated alkenes
should be conjugated alkenescyclic compoundssulfidesshort n-alkanesmercaptans
should be easily recognized
35
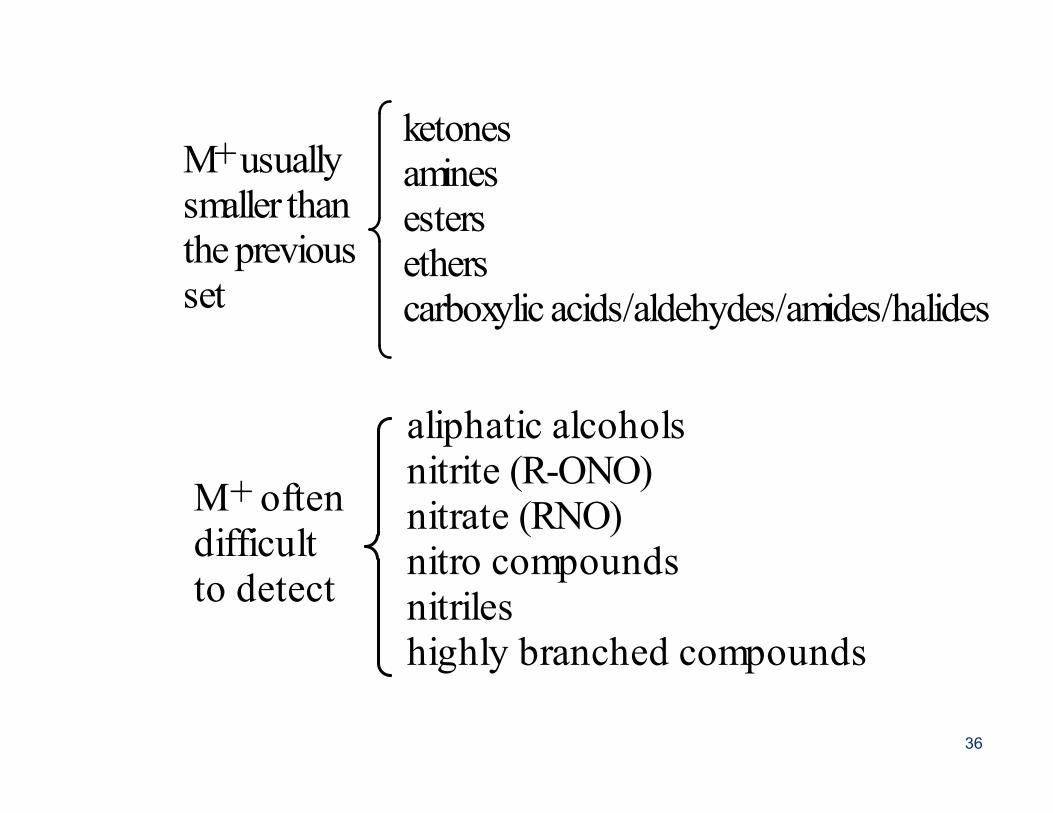
ketonesaminesestersetherscarboxylic acids/aldehydes/amides/halides
M+ usuallysmaller thanthe previousset
aliphatic alcohols
M+ oftendifficult to detect
aliphatic alcoholsnitrite (R-ONO)nitrate (RNO)nitro compoundsnitrileshighly branched compounds
36
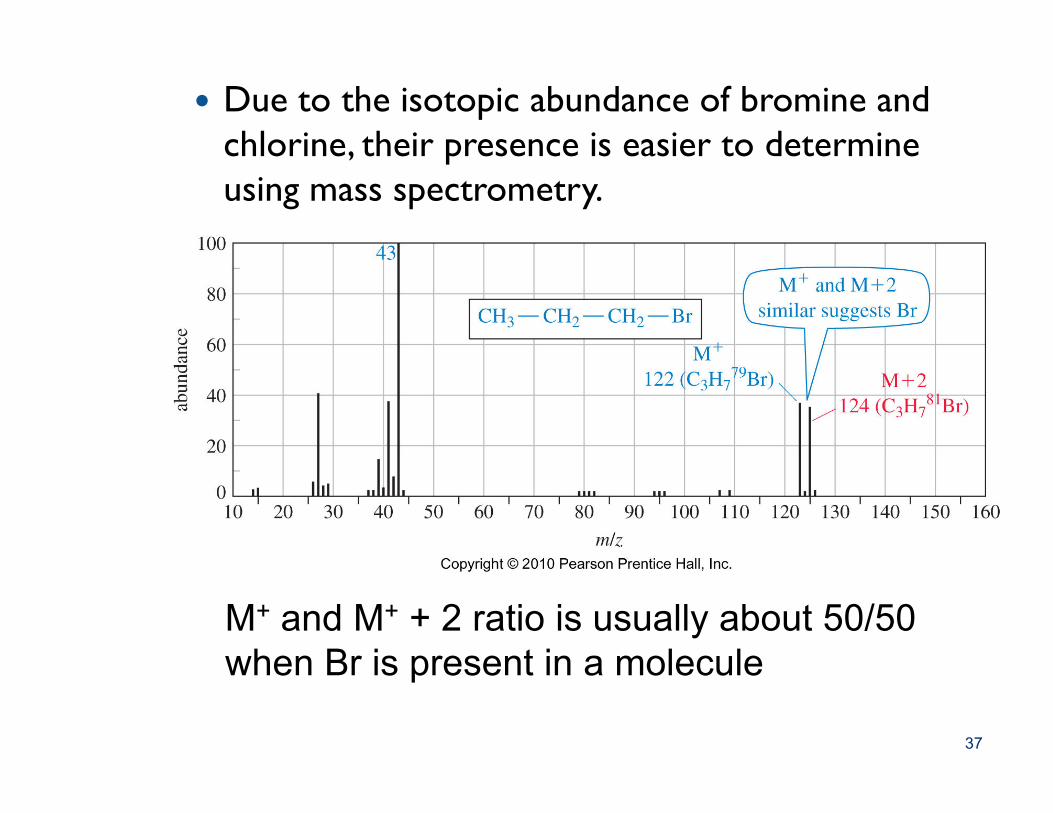
� Due to the isotopic abundance of bromine and chlorine, their presence is easier to determine using mass spectrometry.
M+ and M+ + 2 ratio is usually about 50/50 when Br is present in a molecule
37
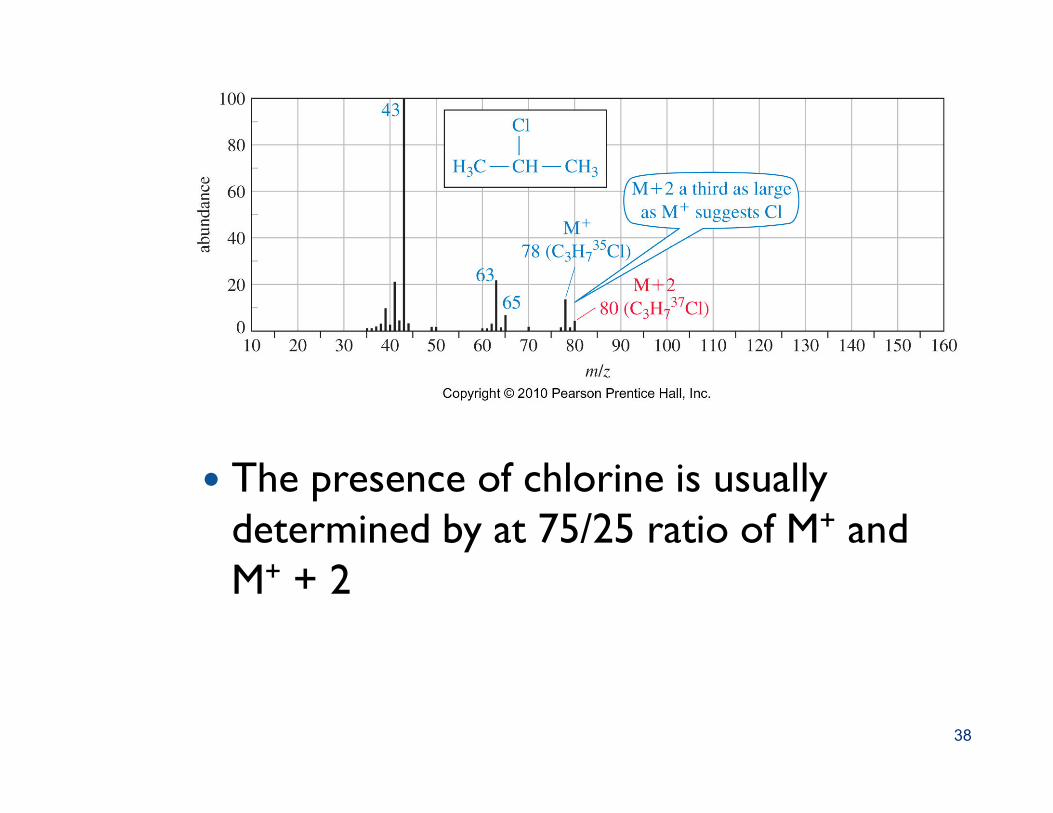
� The presence of chlorine is usually determined by at 75/25 ratio of M+ and M+ + 2
38


