37
Chapter 13: Introduction to Analysis of Variance 1
| Date post: | 28-Dec-2015 |
| Category: |
Documents |
| Upload: | tobias-marsh |
| View: | 231 times |
| Download: | 3 times |

Chapter 13: Introduction to Analysis of Variance
1
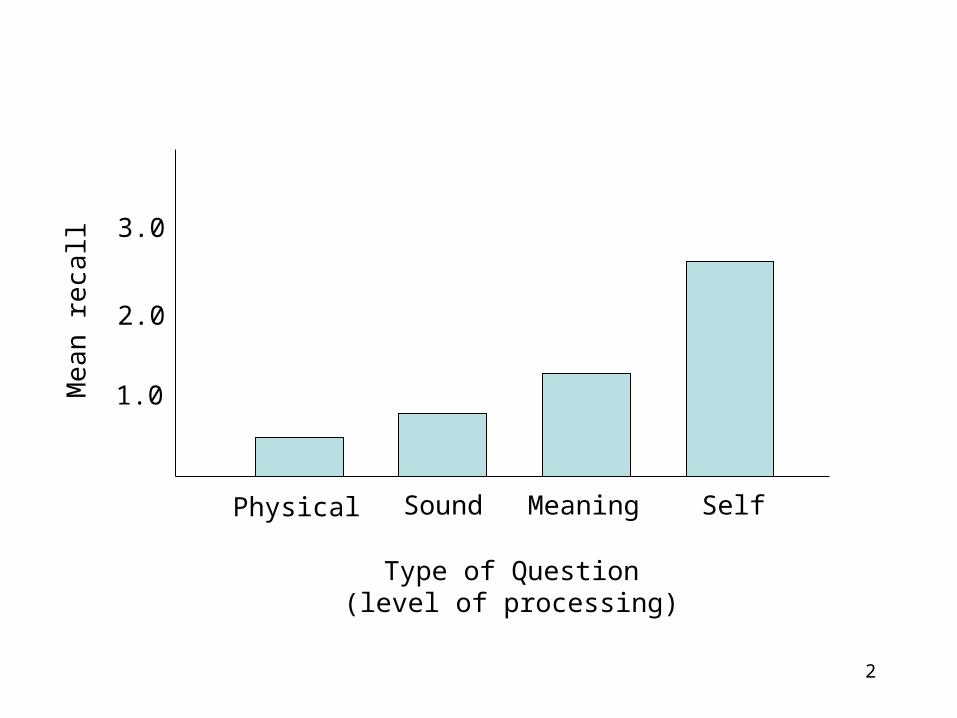
Physical Sound Meaning Self
Type of Question(level of processing)
1.0
2.0
3.0
Mea
n re
call
2
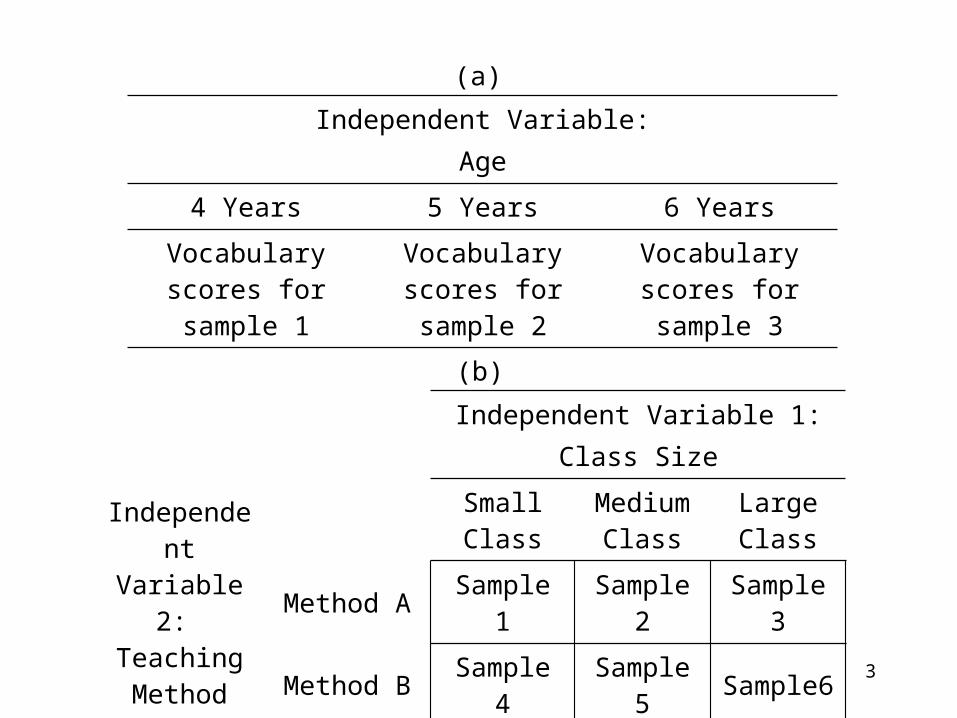
Independent Variable 1:Class Size
Independent Variable 2: Teaching Method
Small Class
Medium Class
Large Class
Method A Sample 1 Sample 2 Sample 3
Method B Sample 4 Sample 5 Sample6
Independent Variable:Age
4 Years 5 Years 6 Years
Vocabulary scores for sample 1
Vocabulary scores for sample 2
Vocabulary scores for sample 3
(a)
(b)
3
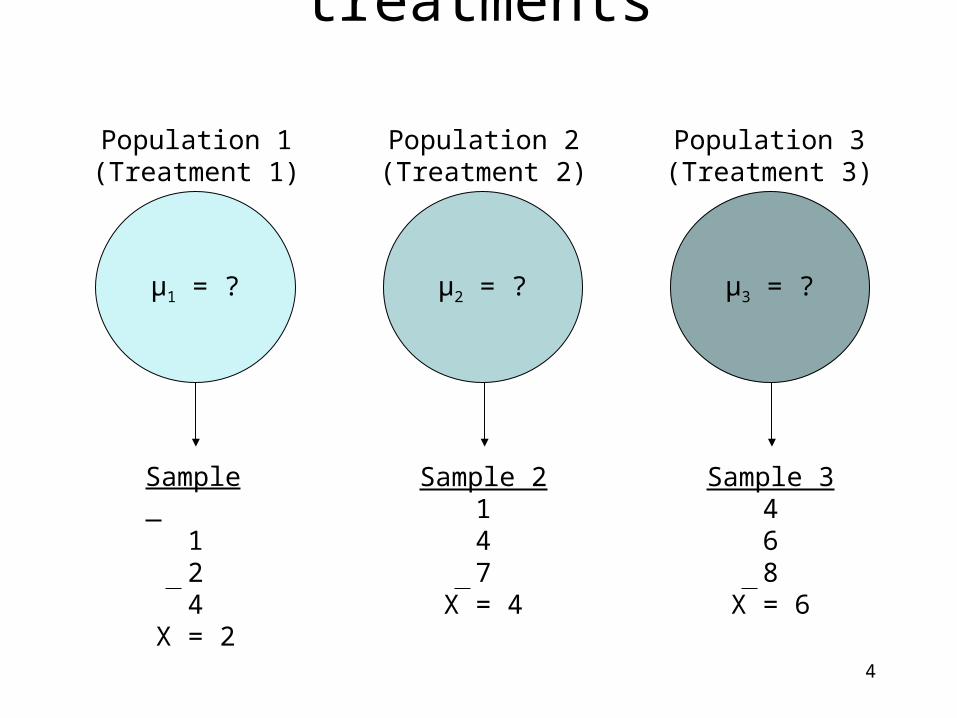
Sample 2147
X = 4
µ1 = ? µ2 = ? µ3 = ?
Population 1(Treatment 1)
Population 2(Treatment 2)
Population 3(Treatment 3)
Sample 124
X = 2
Sample 3468
X = 6
4
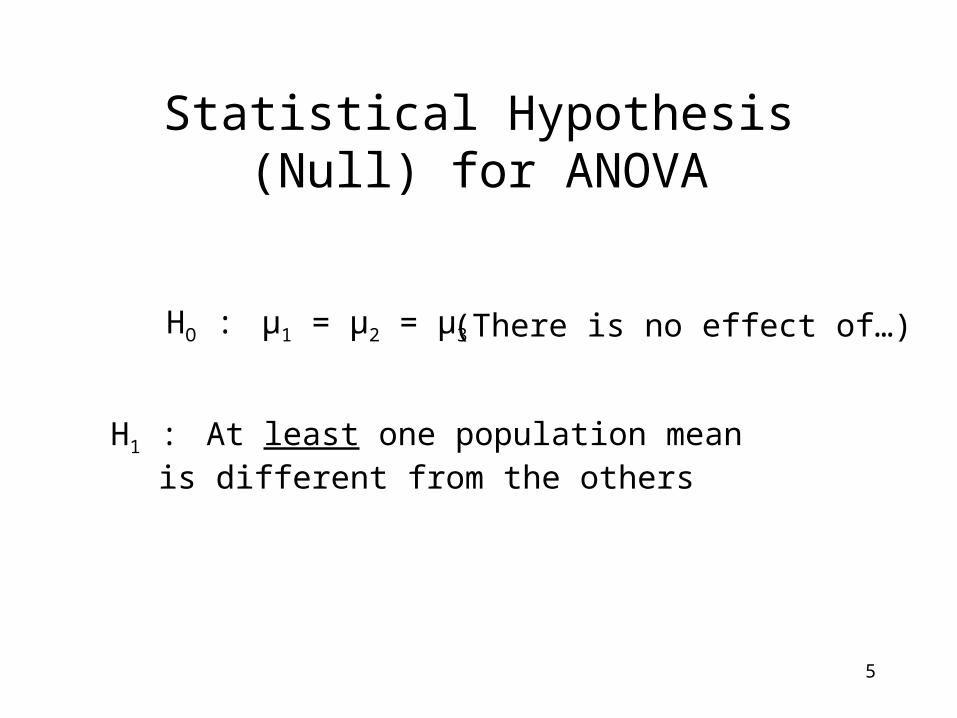
Statistical Hypothesis (Null) for ANOVA
HO : µ1 = µ2 = µ3
H1 : At least one population meanis different from the others
(There is no effect of…)
5
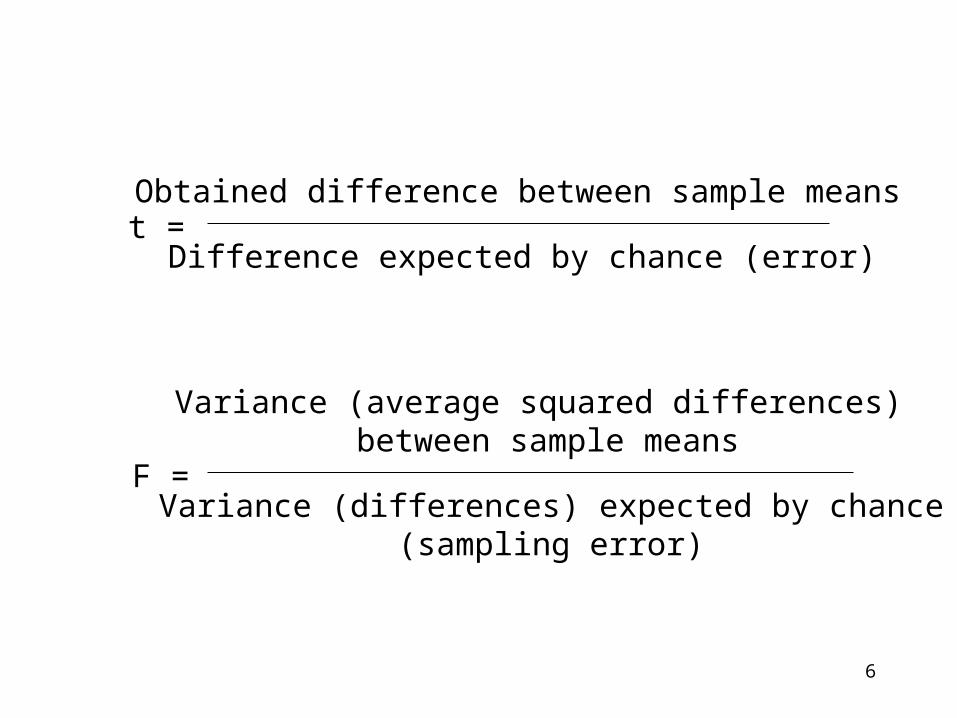
t =Obtained difference between sample means
Difference expected by chance (error)
F =
Variance (average squared differences) between sample means
Variance (differences) expected by chance(sampling error)
6

Treatment 150o
(Sample 1)
Treatment 270o
(Sample 2)
Treatment 390o
(Sample 3)
0 4 1
1 3 2
3 6 2
1 3 0
0 4 0
X = 1 X = 4 X = 1
7
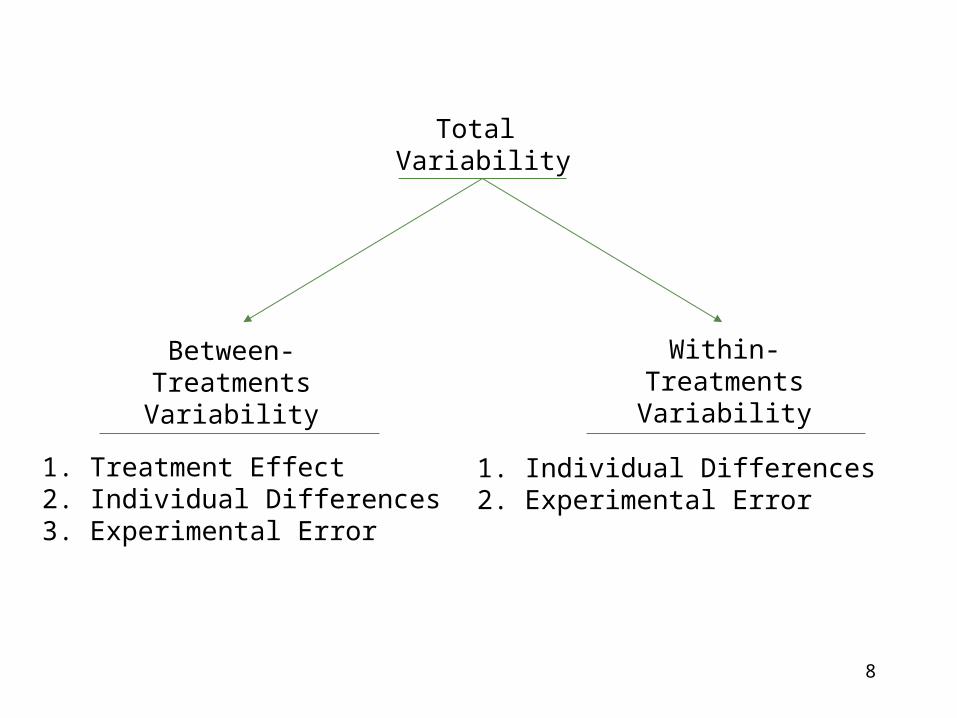
Total Variability
Between-TreatmentsVariability
Within-TreatmentsVariability
1. Treatment Effect2. Individual Differences3. Experimental Error
1. Individual Differences2. Experimental Error
8
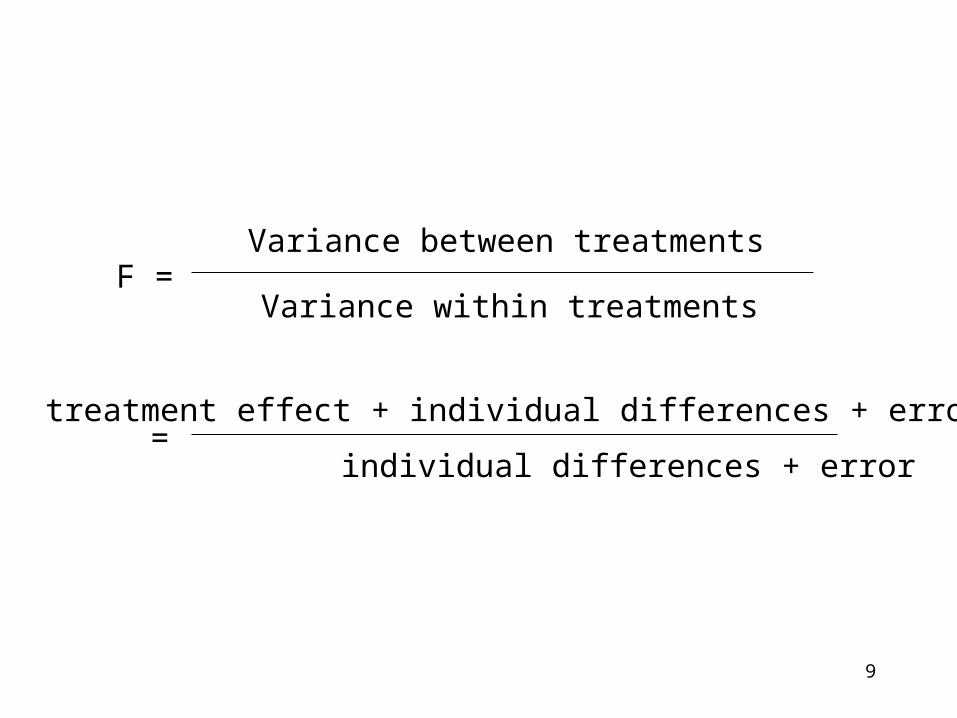
F =Variance between treatments
Variance within treatments
=treatment effect + individual differences + error
individual differences + error
9
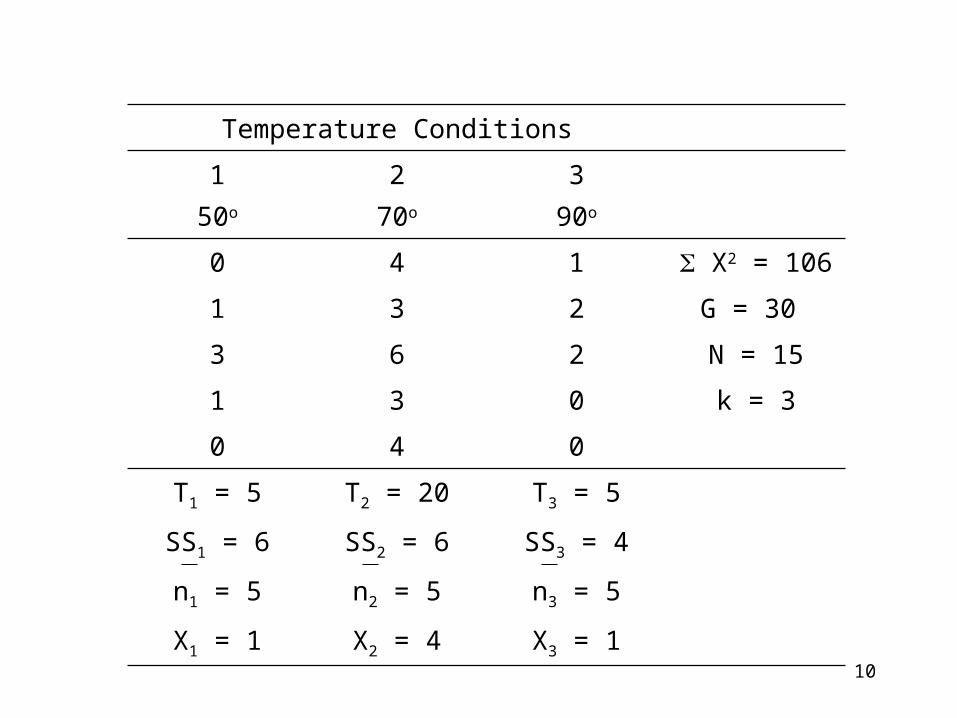
Temperature Conditions
150o
270o
390o
0 4 1 X2 = 106
1 3 2 G = 30
3 6 2 N = 15
1 3 0 k = 3
0 4 0
T1 = 5 T2 = 20 T3 = 5
SS1 = 6 SS2 = 6 SS3 = 4
n1 = 5 n2 = 5 n3 = 5
X1 = 1 X2 = 4 X3 = 1
10
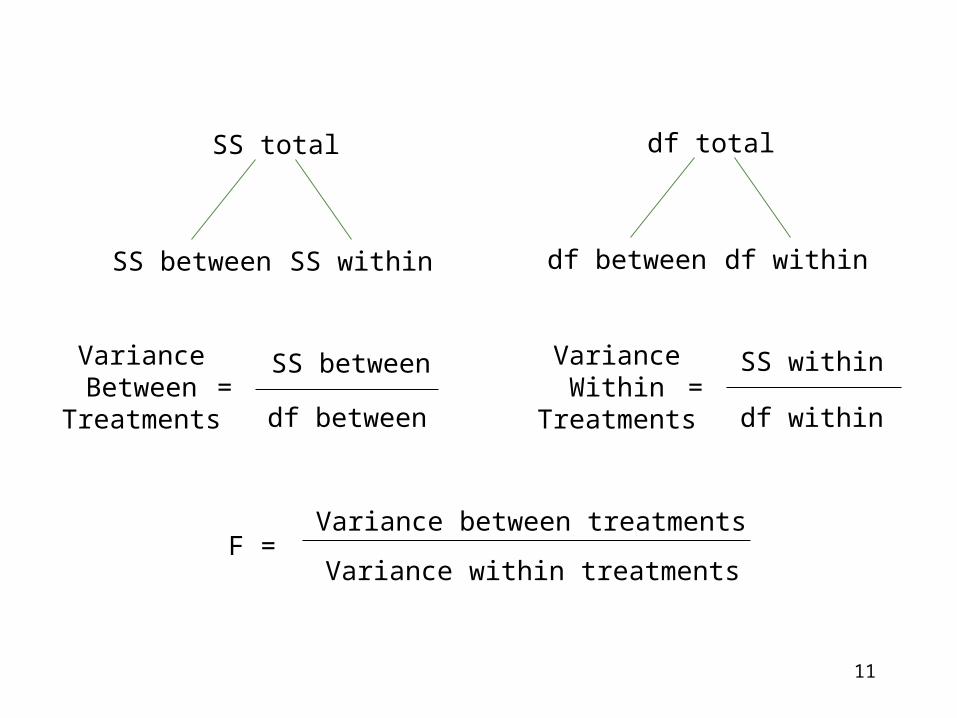
SS total
SS between SS within
df total
df between df within
VarianceBetween
Treatments=
SS between
df between
SS within
df within
VarianceWithin
Treatments=
F =Variance between treatments
Variance within treatments
11
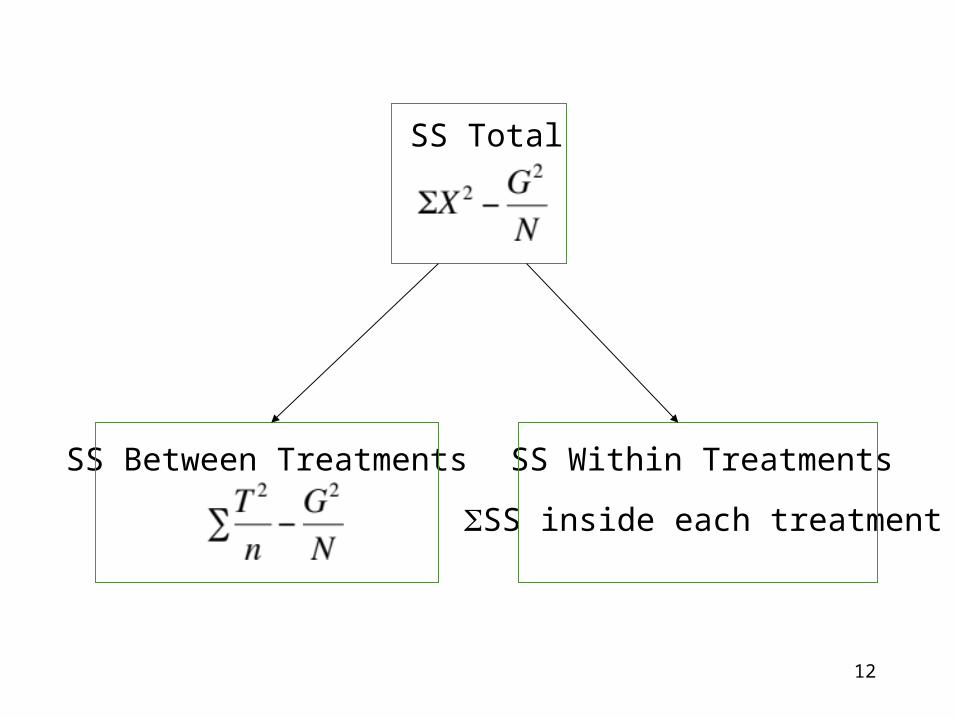
SS Total
SS Between Treatments SS Within Treatments
SS inside each treatment
12
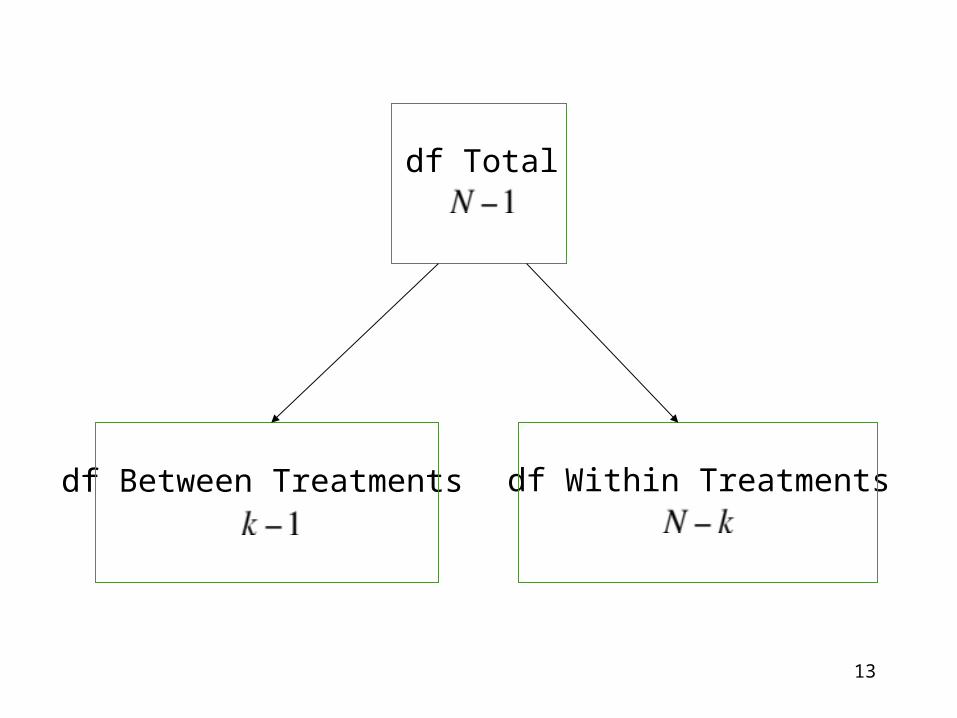
df Total
df Between Treatments df Within Treatments
13
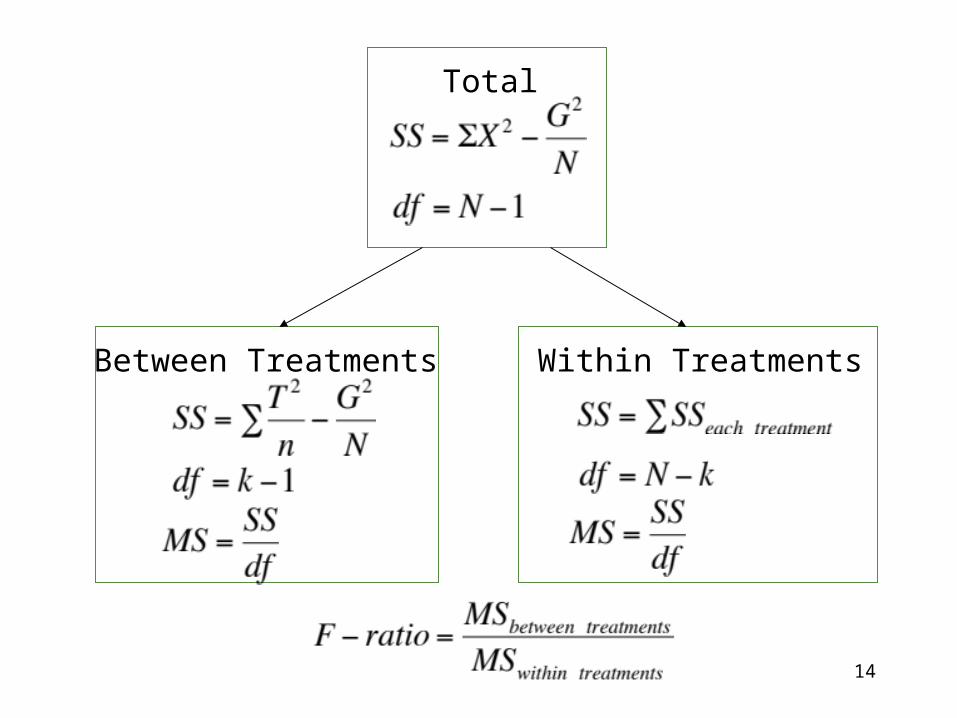
Total
Between Treatments Within Treatments
14
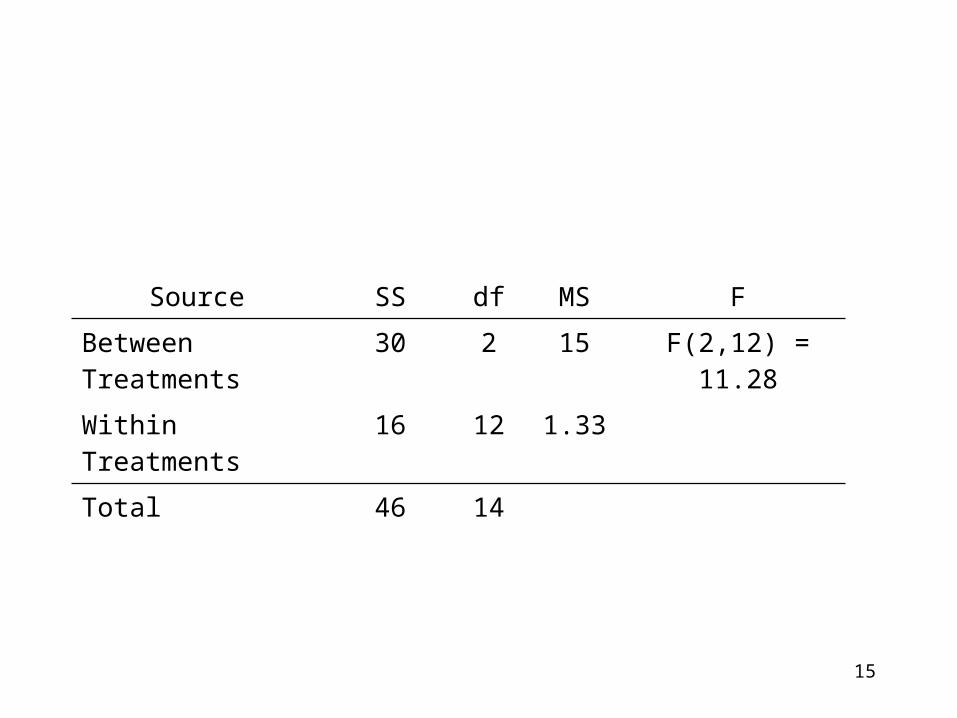
Source SS df MS F
Between Treatments 30 2 15 F(2,12) = 11.28
Within Treatments 16 12 1.33
Total 46 14
15
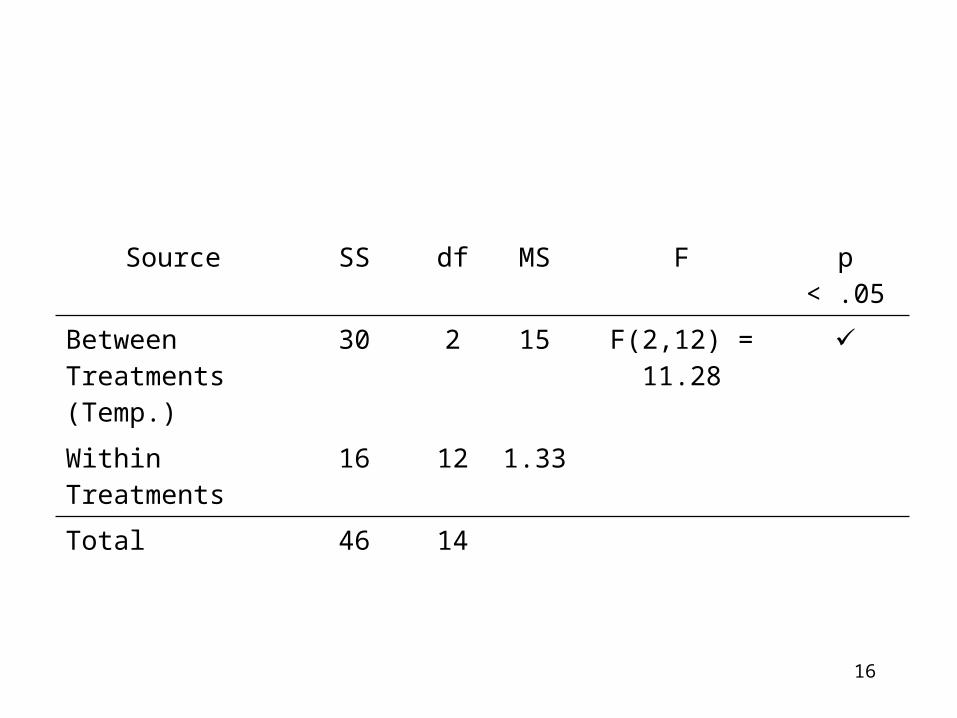
Source SS df MS F p < .05
Between Treatments (Temp.)
30 2 15 F(2,12) = 11.28 ✓
Within Treatments 16 12 1.33
Total 46 14
16

17
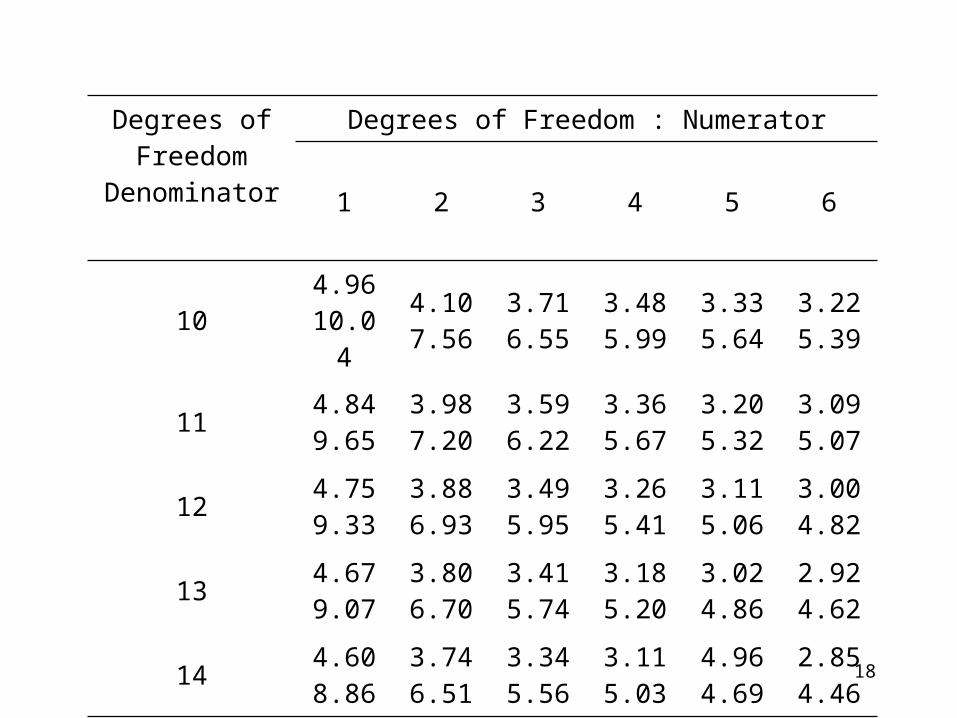
Degrees of Freedom
Denominator
Degrees of Freedom : Numerator
1 2 3 4 5 6
104.96
10.044.10 7.56
3.71 6.55
3.48 5.99
3.33 5.64
3.22 5.39
114.84 9.65
3.98 7.20
3.59 6.22
3.36 5.67
3.20 5.32
3.09 5.07
124.75 9.33
3.88 6.93
3.49 5.95
3.26 5.41
3.11 5.06
3.00 4.82
134.67 9.07
3.80 6.70
3.41 5.74
3.18 5.20
3.02 4.86
2.92 4.62
144.60 8.86
3.74 6.51
3.34 5.56
3.11 5.03
4.96 4.69
2.85 4.46
18

Degrees of Freedom
Denominator
Degrees of Freedom : Numerator
1 2 3 4 5 6
104.96
10.044.10 7.56
3.71 6.55
3.48 5.99
3.33 5.64
3.22 5.39
114.84 9.65
3.98 7.20
3.59 6.22
3.36 5.67
3.20 5.32
3.09 5.07
124.75 9.33
3.88 6.93
3.49 5.95
3.26 5.41
3.11 5.06
3.00 4.82
134.67 9.07
3.80 6.70
3.41 5.74
3.18 5.20
3.02 4.86
2.92 4.62
144.60 8.86
3.74 6.51
3.34 5.56
3.11 5.03
4.96 4.69
2.85 4.46
19
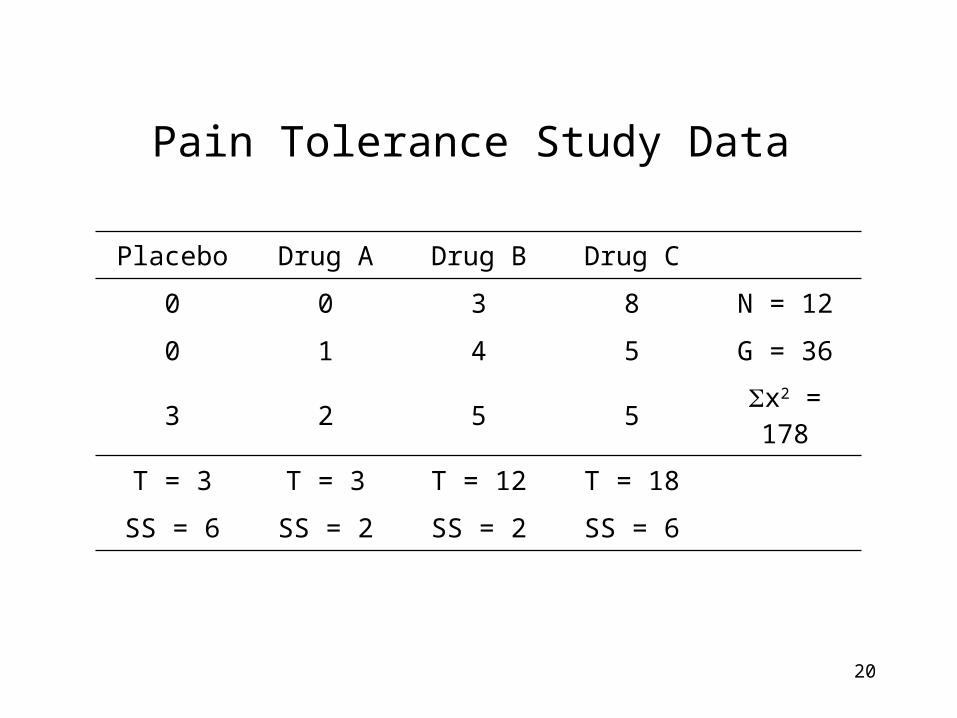
Pain Tolerance Study Data
Placebo Drug A Drug B Drug C
0 0 3 8 N = 12
0 1 4 5 G = 36
3 2 5 5 x2 = 178
T = 3 T = 3 T = 12 T = 18
SS = 6 SS = 2 SS = 2 SS = 6
20
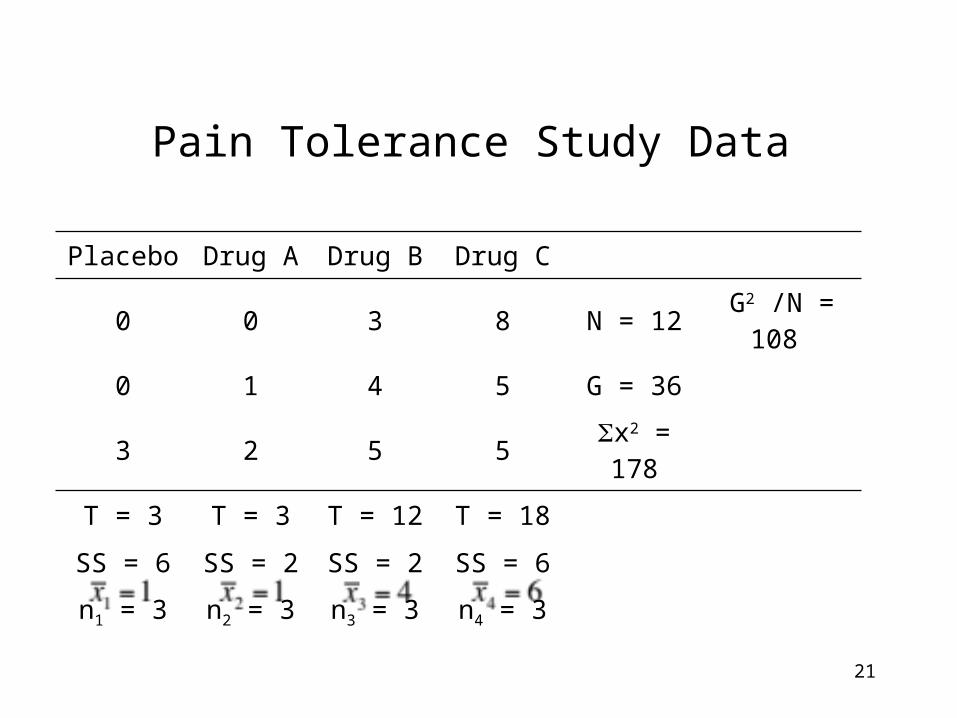
Pain Tolerance Study Data
Placebo Drug A Drug B Drug C
0 0 3 8 N = 12 G2 /N = 108
0 1 4 5 G = 36
3 2 5 5 x2 = 178
T = 3 T = 3 T = 12 T = 18
SS = 6 SS = 2 SS = 2 SS = 6
n1 = 3 n2 = 3 n3 = 3 n4 = 3
21

Placebo:
Drug A :
22

Drug B :
Drug C :
23

Source SS df MS F p < .05
Between Treatments
54 3 18 F(3,8) = 9.00 ✓
Within Treatments
16 8 2
Total 70 11
24

4.07
5%
25
Reporting the results for the Pain Tolerance Study
The average length of time participants were able to tolerate a painful stimulus for each of the different drug conditions are presented in Table 1. A single-factor analysis of variance confirmed an overall effect of drug type on pain tolerance, F(3,8) = 9.00, MSE = 2.00, p < .05.
26

Table 1. Average time (seconds) a painful stimulus was endured for different drug treatment conditions.
Treatment Condition
Placebo Drug A Drug B Drug C
M 1.0 1.0 4.0 6.0
SD 1.73 1.00 1.00 1.73
27
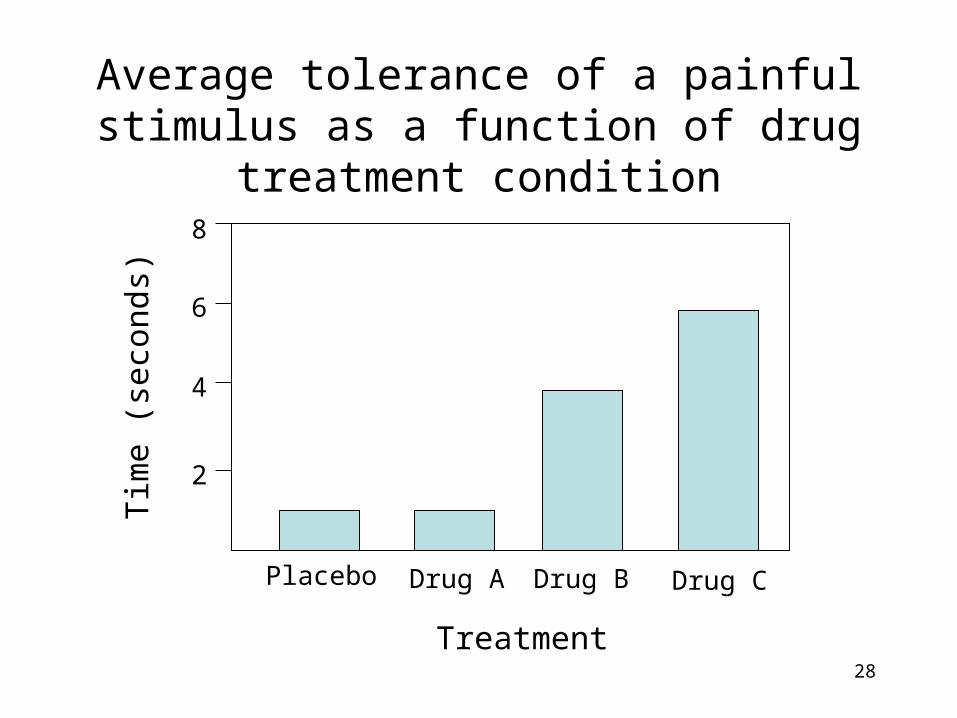
Average tolerance of a painful stimulus as a function of drug treatment condition
8
6
4
2
Placebo Drug A Drug B Drug C
Treatment
Tim
e (s
econ
ds)
28
Post Hoc Tests
After ANOVA when:
1. You reject Ho and…
2. There are 3 or more treatments (k > 3)
29
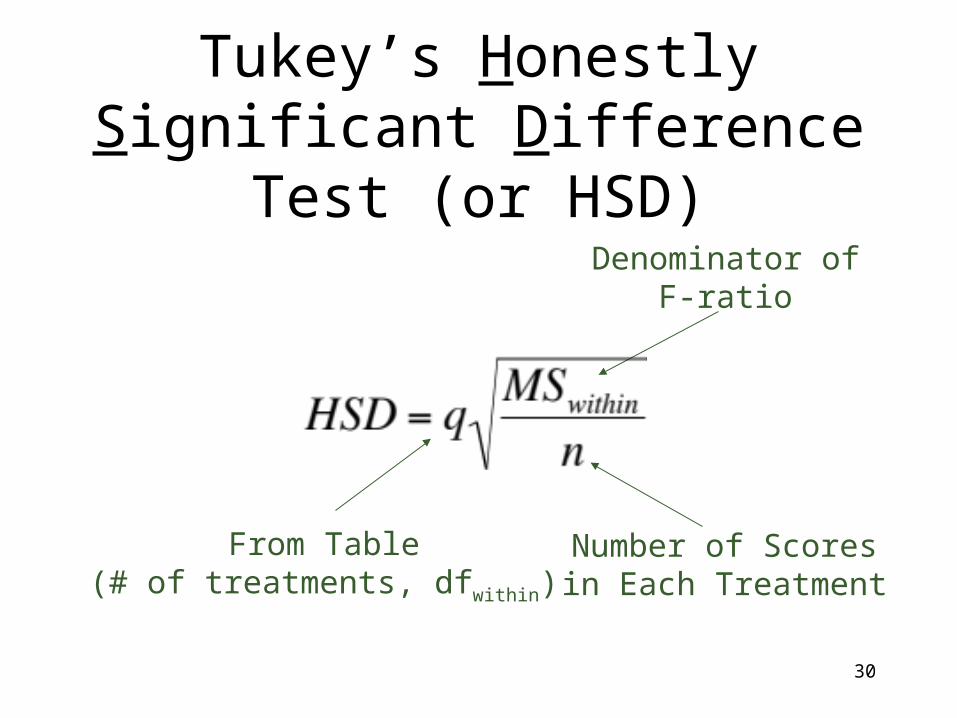
Tukey’s Honestly Significant Difference Test (or HSD)
From Table(# of treatments, dfwithin)
Number of Scoresin Each Treatment
Denominator ofF-ratio
30

Scheffe Test
1. Conservative - safest of all post hoc tests
2. Compute a new F-ratio for differences between any pair of means
3.
F =MSbetween (just for the pair of means tested)
MSwithin (from the overall ANOVA)
a) Use k from overall to compute dfbetween, therefore dfbetween = k - 1
b) Critical F same as for the overall test
31
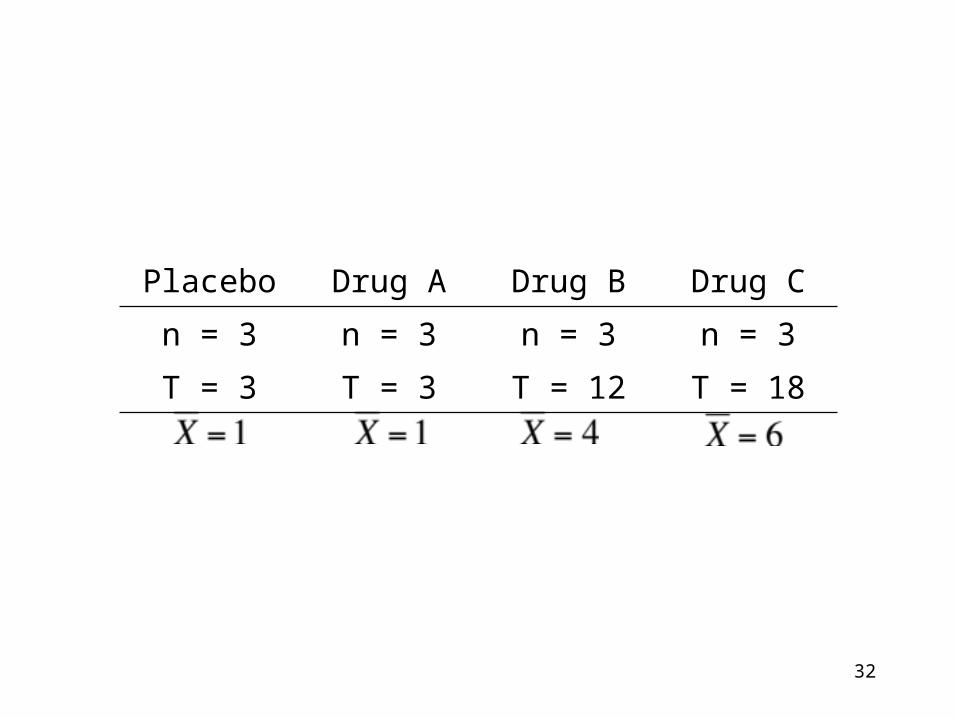
Placebo Drug A Drug B Drug C
n = 3 n = 3 n = 3 n = 3
T = 3 T = 3 T = 12 T = 18
32
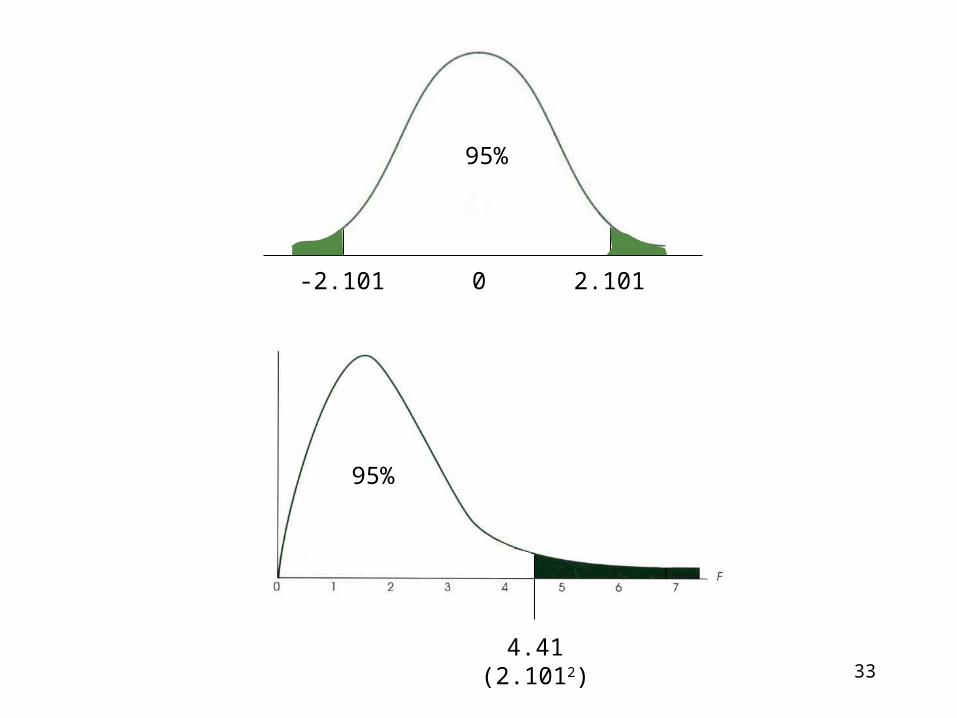
95%
4.41(2.1012)
95%
-2.101 0 2.101
33
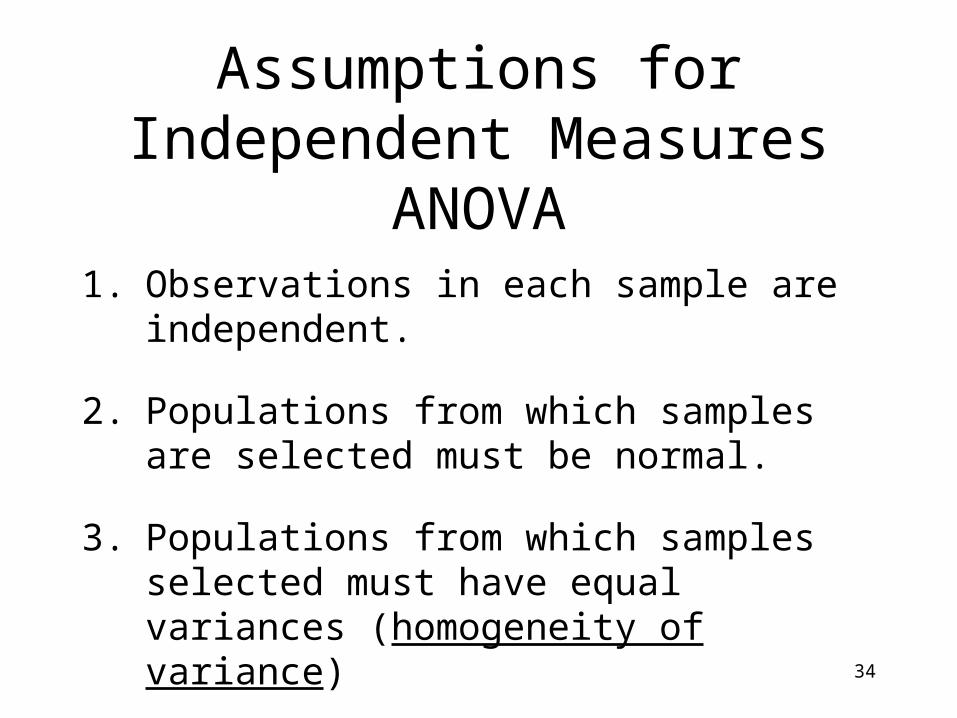
Assumptions for Independent Measures ANOVA
1. Observations in each sample are independent.
2. Populations from which samples are selected must be normal.
3. Populations from which samples selected must have equal variances (homogeneity of variance)
34
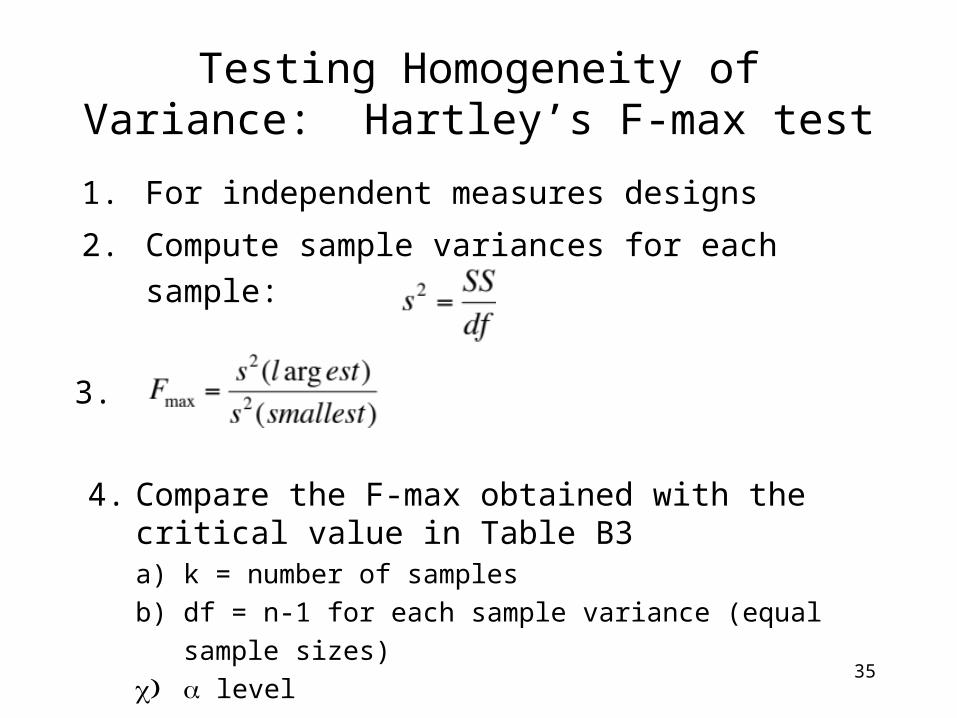
Testing Homogeneity of Variance: Hartley’s F-max test
1. For independent measures designs
2. Compute sample variances for each sample:
3.
4. Compare the F-max obtained with the critical value in Table B3a) k = number of samples
b) df = n-1 for each sample variance (equal sample sizes)
)c level35
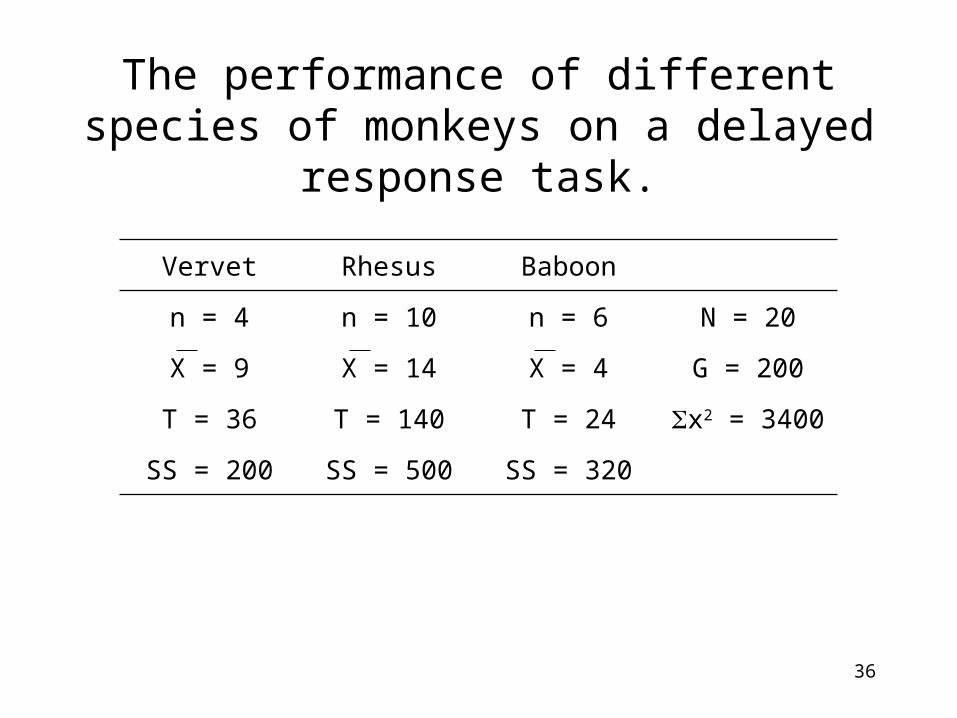
The performance of different species of monkeys on a delayed response task.
Vervet Rhesus Baboon
n = 4 n = 10 n = 6 N = 20
X = 9 X = 14 X = 4 G = 200
T = 36 T = 140 T = 24 x2 = 3400
SS = 200 SS = 500 SS = 320
36
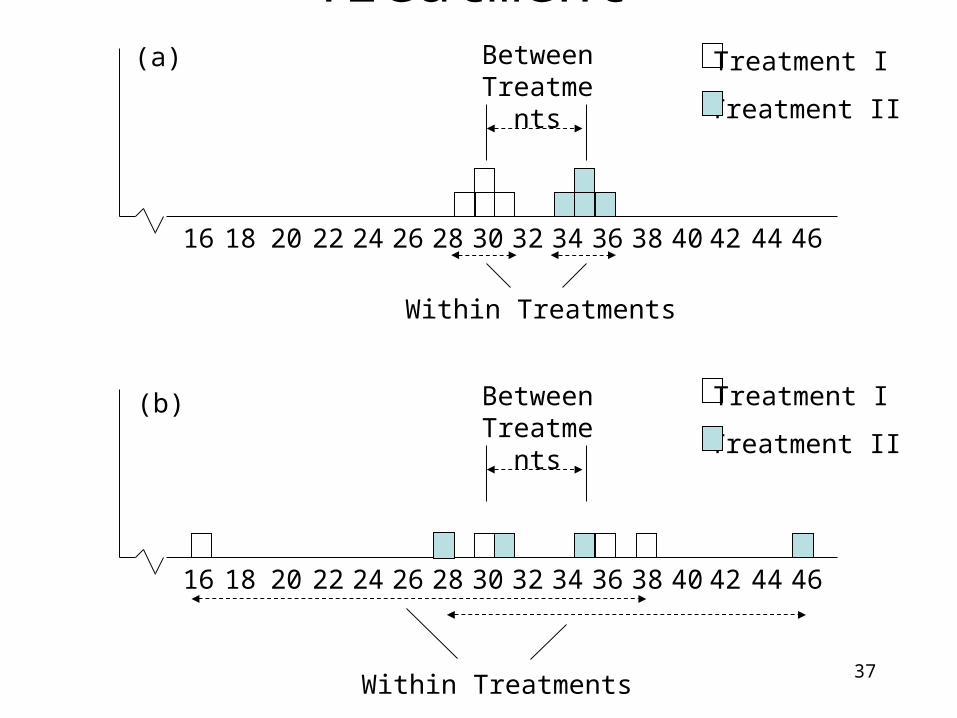
16 18 20 22 24 26 28 30 32 34 36 38 40 42 44 46
Between Treatments
Treatment I
Treatment II
16 18 20 22 24 26 28 30 32 34 36 38 40 42 44 46
Between Treatments
Treatment I
Treatment II
Within Treatments
Within Treatments
(a)
(b)
37


