27
Chapter 13 Urban Patterns
| Date post: | 22-Dec-2015 |
| Category: |
Documents |
| Upload: | rudolf-noel-cole |
| View: | 239 times |
| Download: | 5 times |
Chapter 13
Urban Patterns
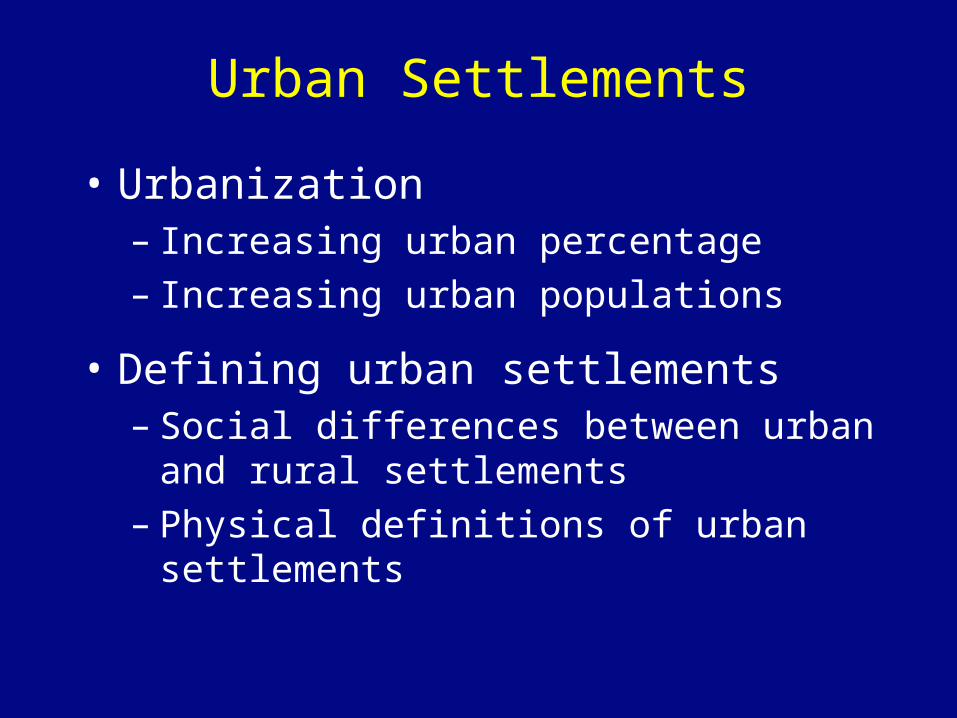
Urban Settlements
• Urbanization– Increasing urban percentage– Increasing urban populations
• Defining urban settlements– Social differences between urban and rural
settlements– Physical definitions of urban settlements
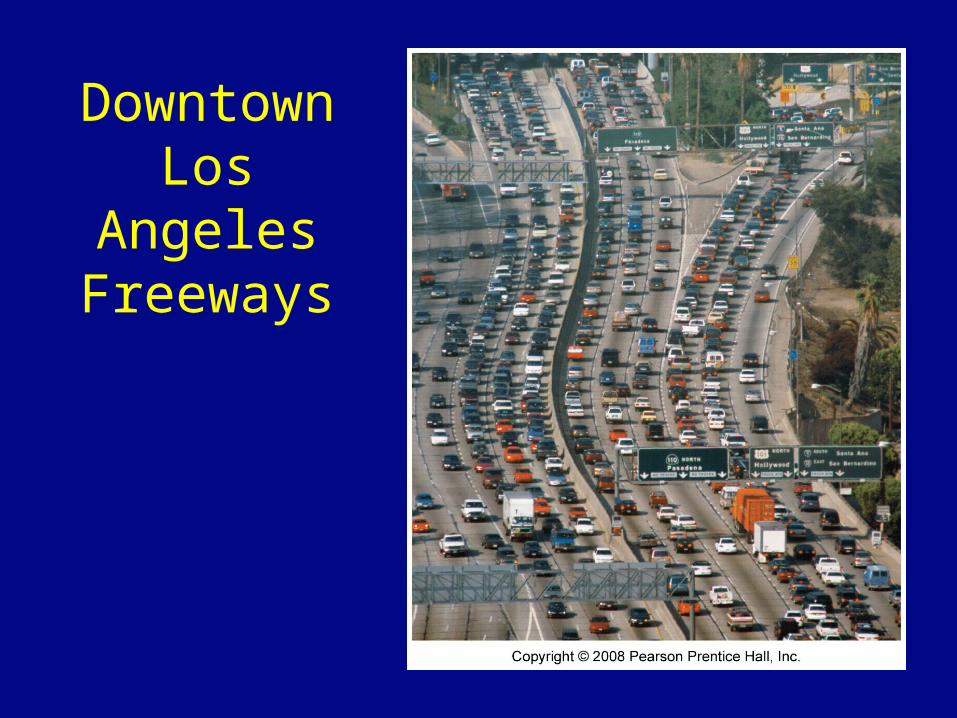
Downtown Los Angeles
Freeways

Percent Urban Population
Fig. 13-1: Percent of the population living in urban areas is usually higher in MDCs than in LDCs.

Large Cities
Fig. 13-2: Cities with 3 million or more people. Most of the largest cities are now in LDCs.
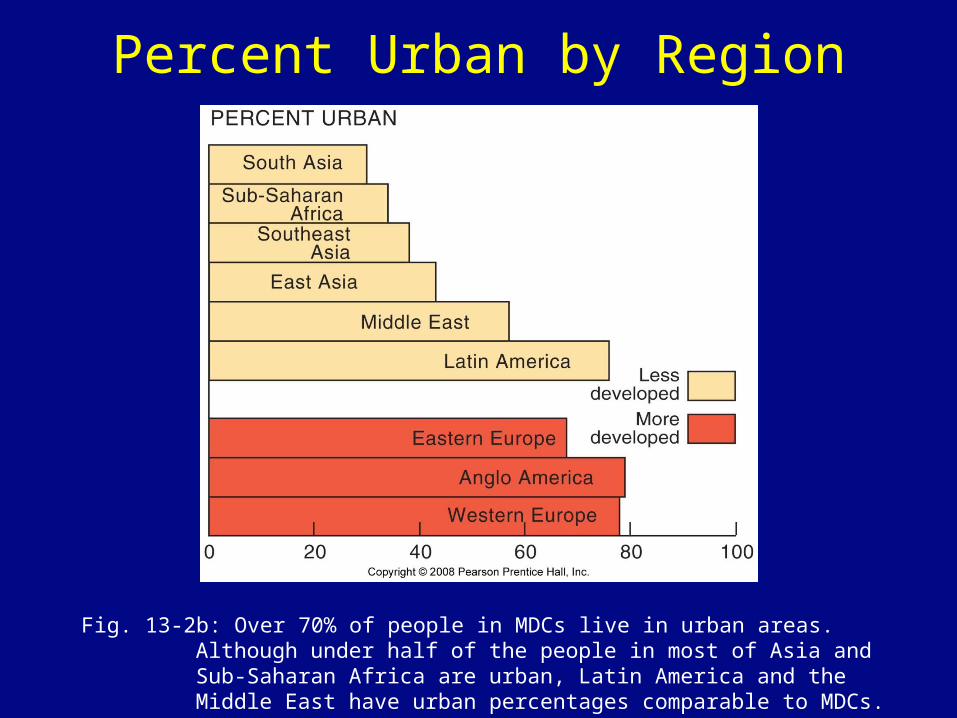
Percent Urban by Region
Fig. 13-2b: Over 70% of people in MDCs live in urban areas. Although under half of the people in most of Asia and Sub-Saharan Africa are urban, Latin America and the Middle East have urban percentages comparable to MDCs.
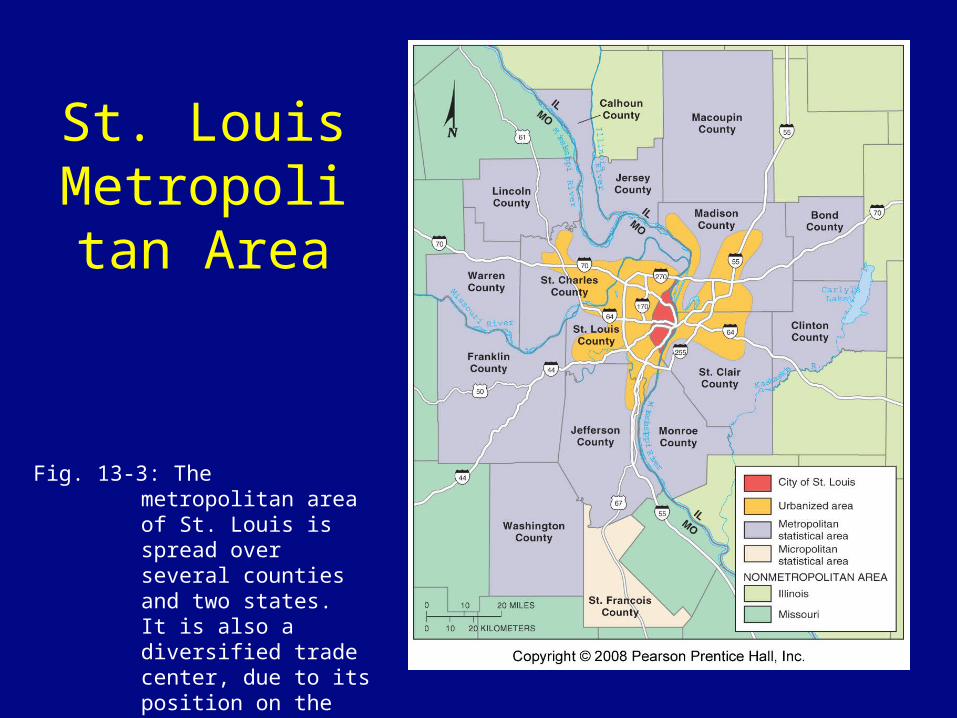
St. Louis Metropolitan
Area
Fig. 13-3: The metropolitan area of St. Louis is spread over several counties and two states. It is also a diversified trade center, due to its position on the Mississippi River.
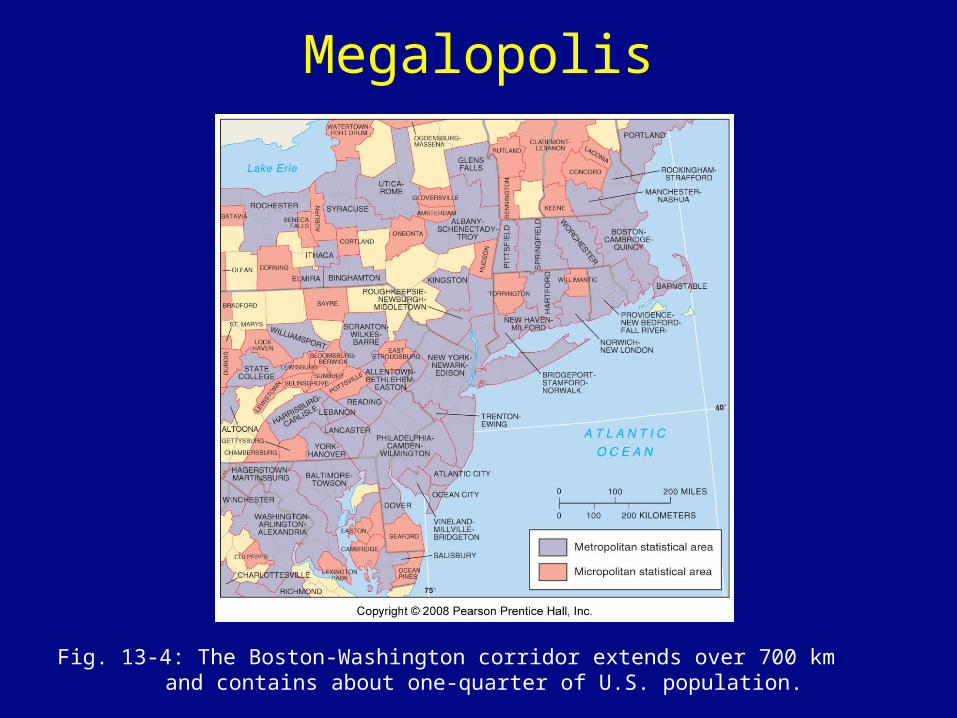
Megalopolis
Fig. 13-4: The Boston-Washington corridor extends over 700 km and contains about one-quarter of U.S. population.
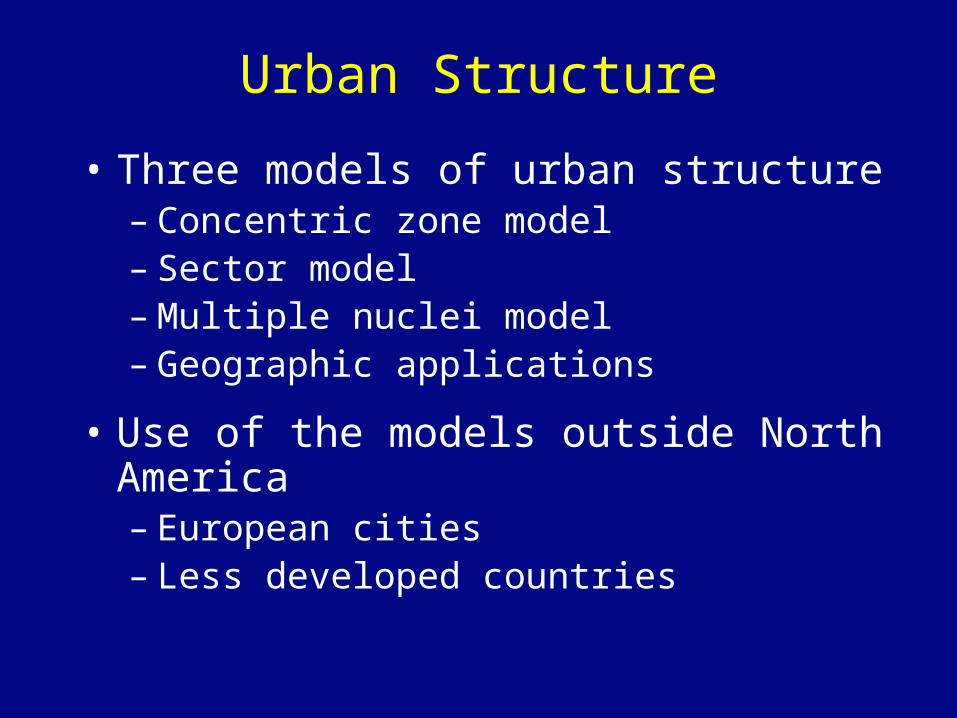
Urban Structure
• Three models of urban structure– Concentric zone model– Sector model– Multiple nuclei model– Geographic applications
• Use of the models outside North America– European cities– Less developed countries
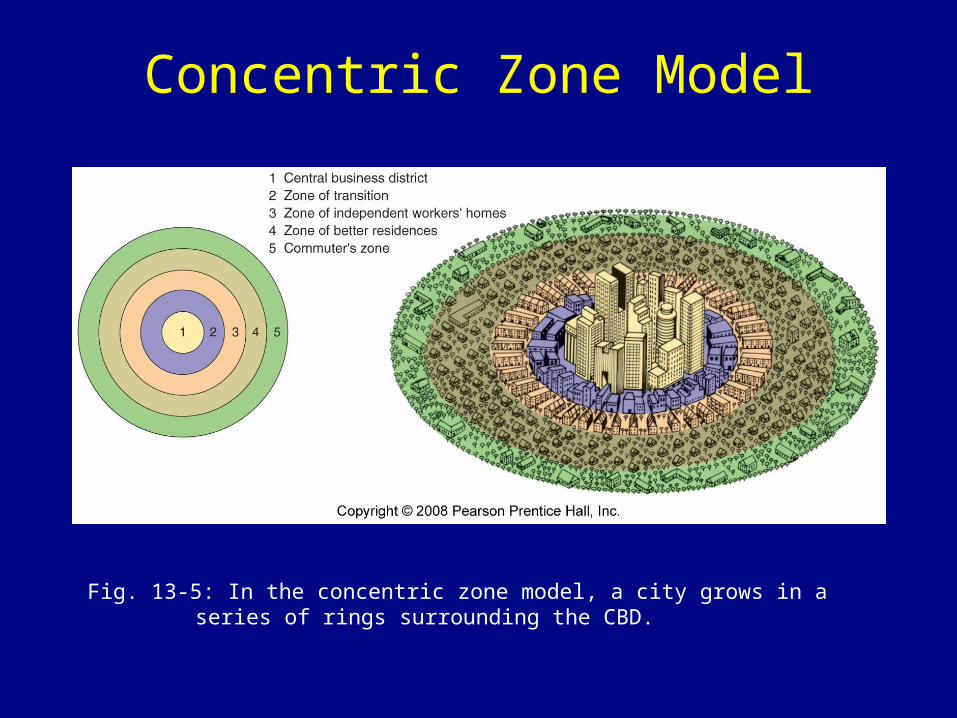
Concentric Zone Model
Fig. 13-5: In the concentric zone model, a city grows in a series of rings surrounding the CBD.
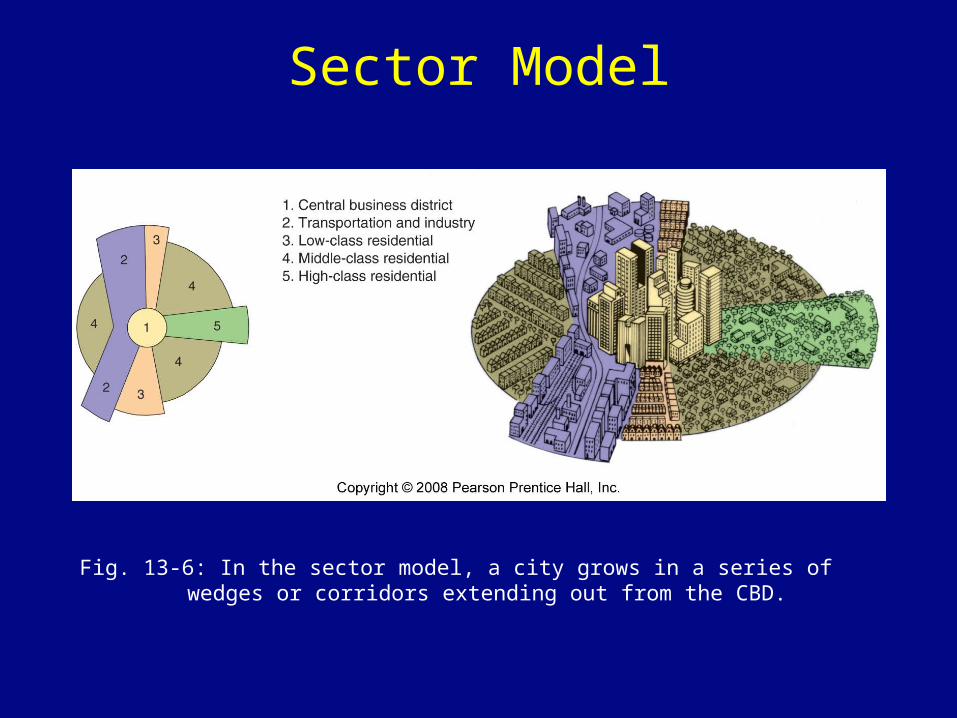
Sector Model
Fig. 13-6: In the sector model, a city grows in a series of wedges or corridors extending out from the CBD.
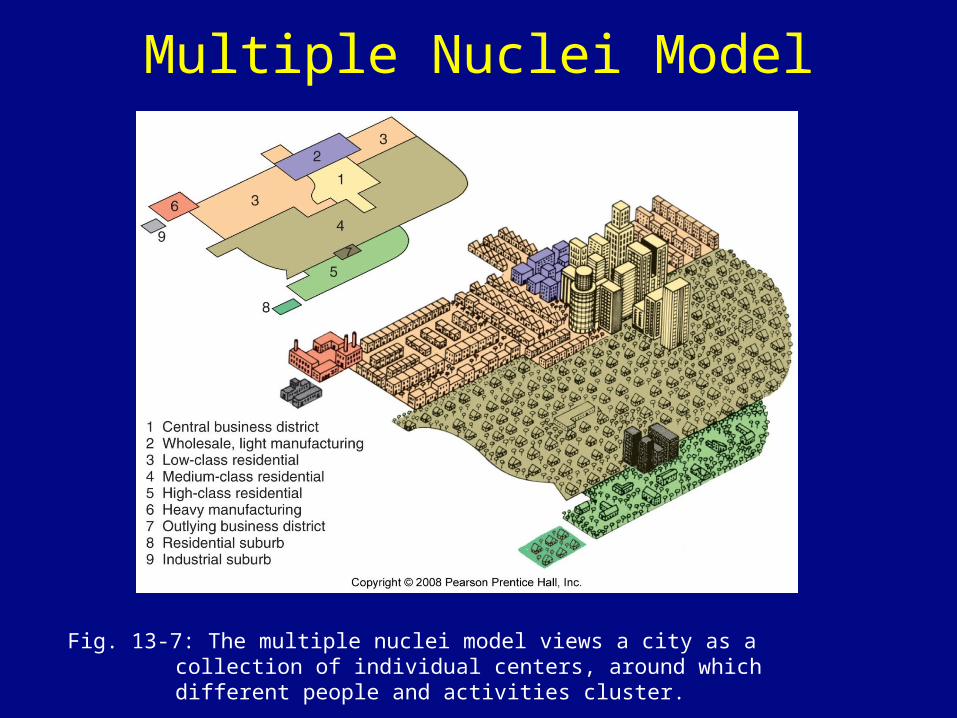
Multiple Nuclei Model
Fig. 13-7: The multiple nuclei model views a city as a collection of individual centers, around which different people and activities cluster.
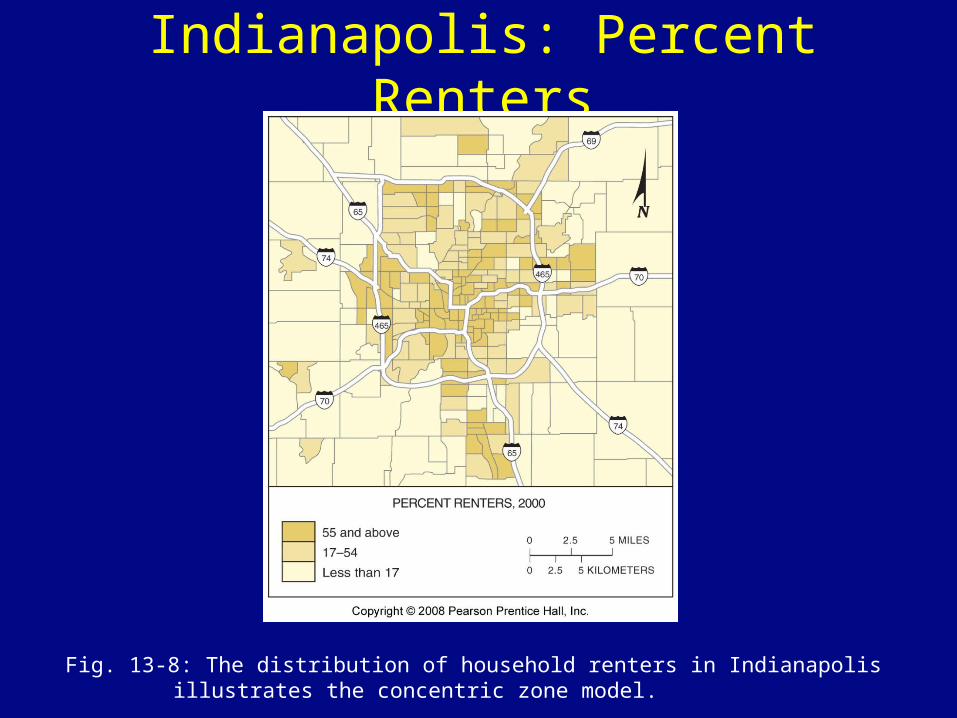
Indianapolis: Percent Renters
Fig. 13-8: The distribution of household renters in Indianapolis illustrates the concentric zone model.
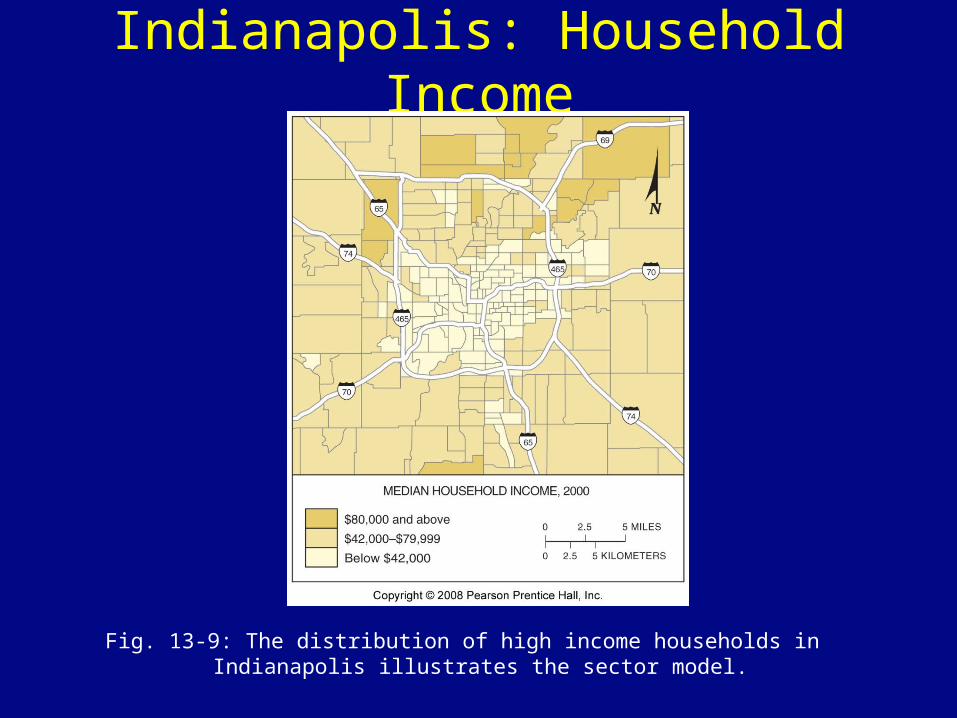
Indianapolis: Household Income
Fig. 13-9: The distribution of high income households in Indianapolis illustrates the sector model.
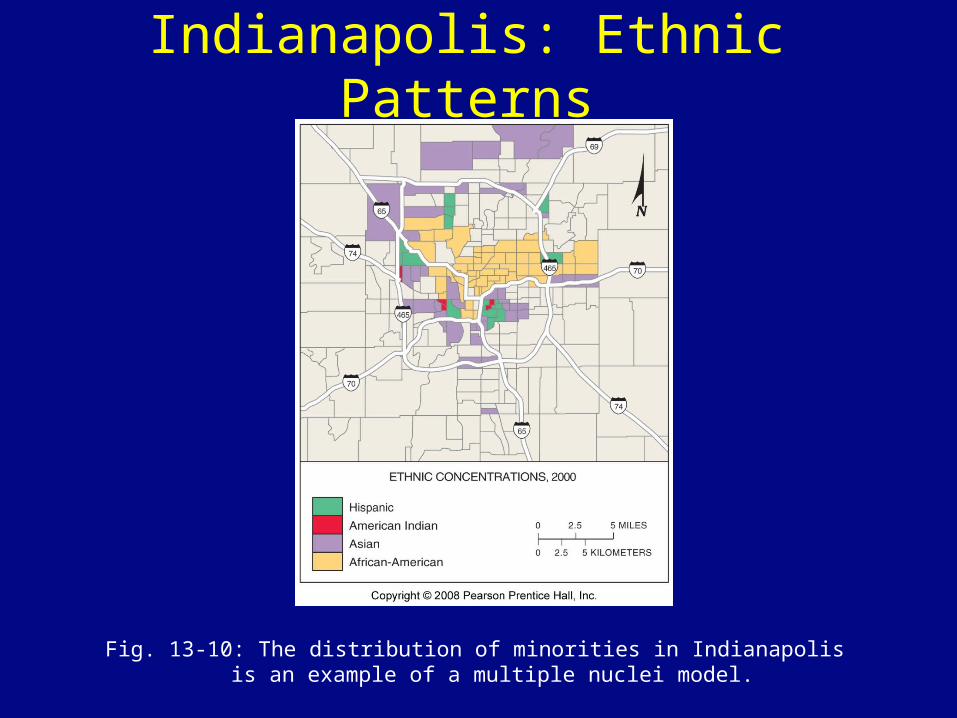
Indianapolis: Ethnic Patterns
Fig. 13-10: The distribution of minorities in Indianapolis is an example of a multiple nuclei model.
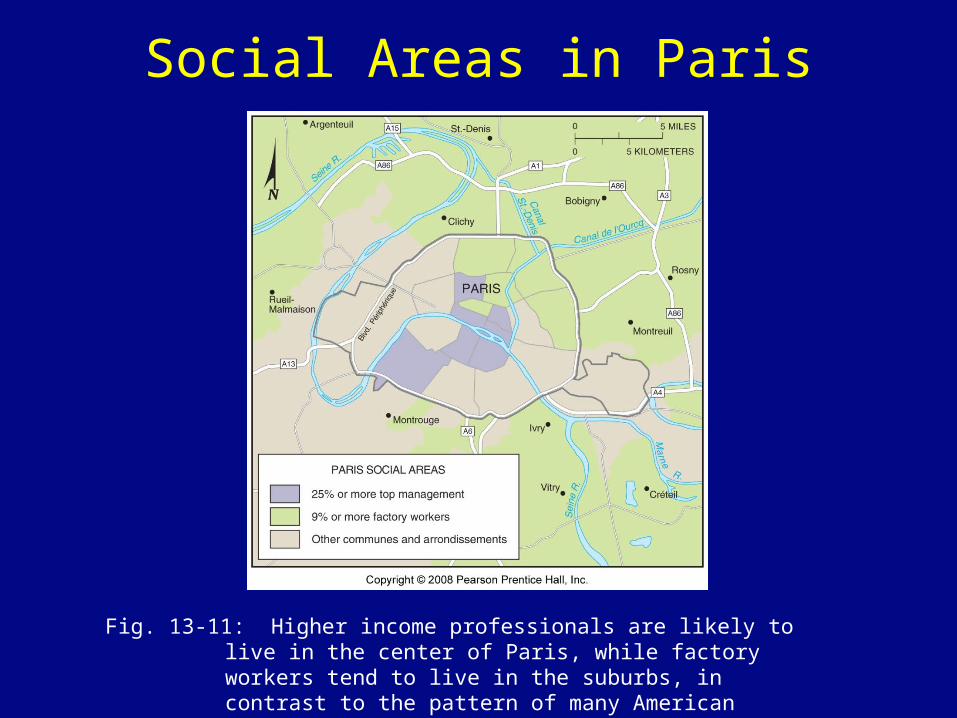
Social Areas in Paris
Fig. 13-11: Higher income professionals are likely to live in the center of Paris, while factory workers tend to live in the suburbs, in contrast to the pattern of many American cities.
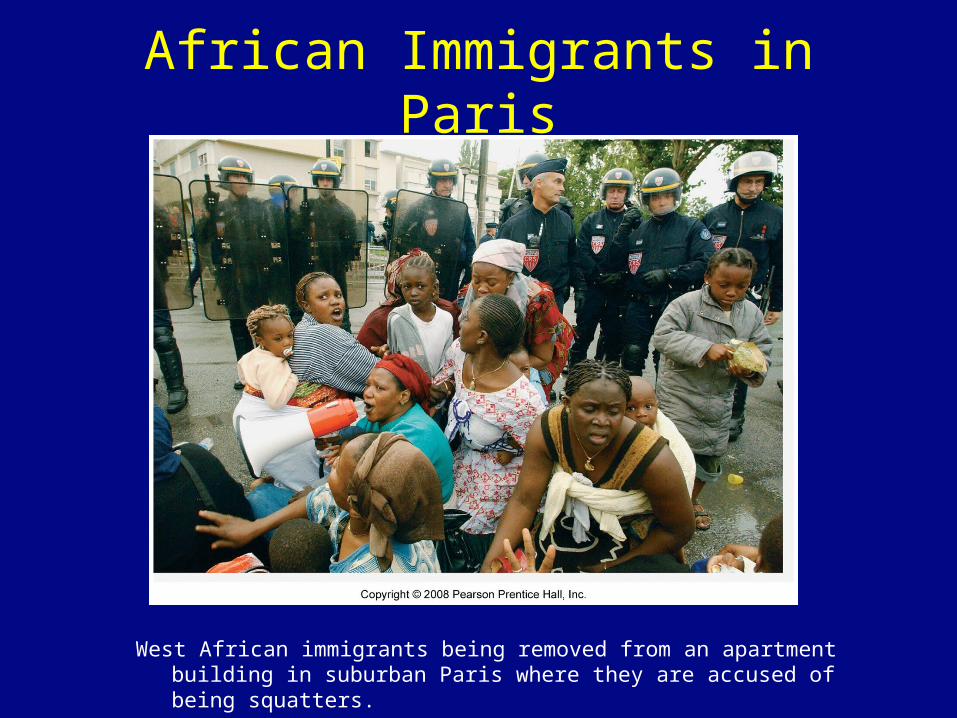
African Immigrants in Paris
West African immigrants being removed from an apartment building in suburban Paris where they are accused of being squatters.
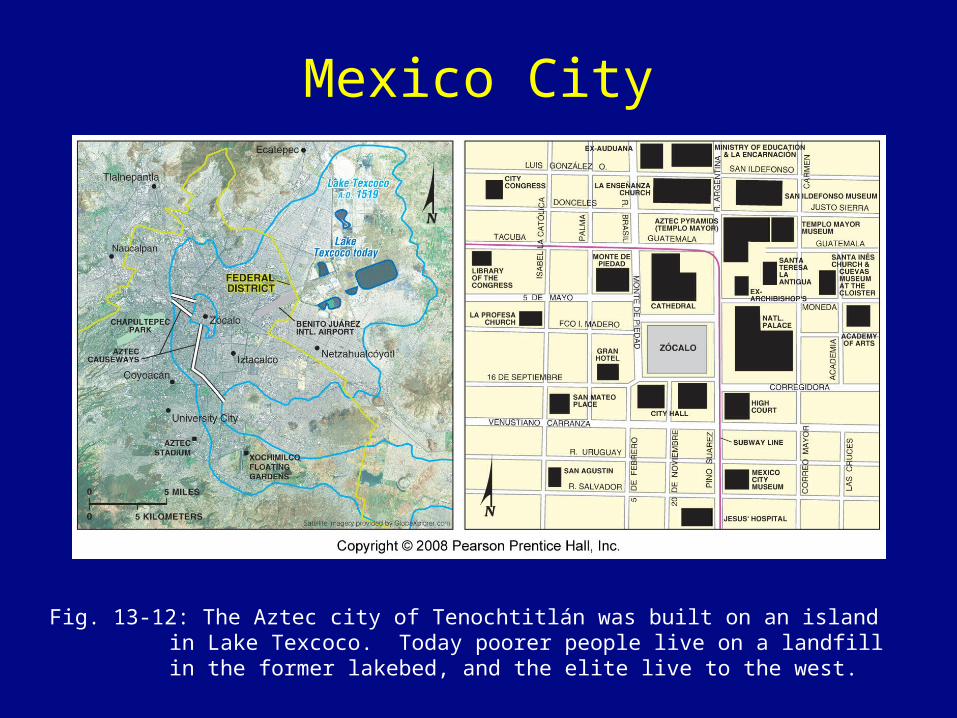
Mexico City
Fig. 13-12: The Aztec city of Tenochtitlán was built on an island in Lake Texcoco. Today poorer people live on a landfill in the former lakebed, and the elite live to the west.

Aztec Features in Mexico City
Fig. 13-12a: The Aztec city of Tenochtitlán was built on an island in Lake Texcoco. Some features from the old Aztec city and region can still be identified.
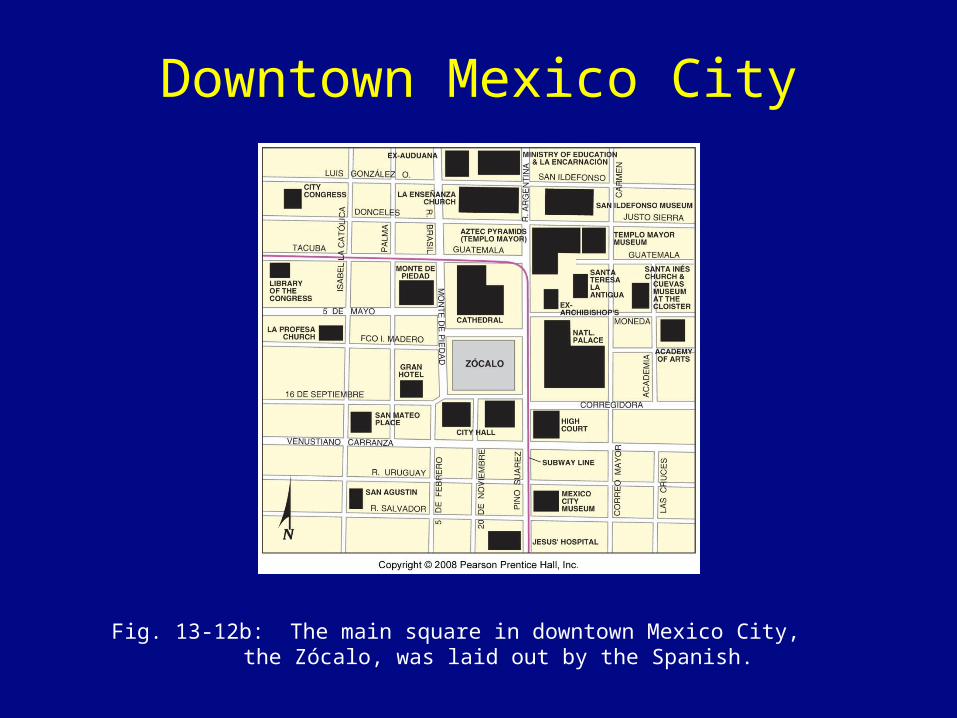
Downtown Mexico City
Fig. 13-12b: The main square in downtown Mexico City, the Zócalo, was laid out by the Spanish.
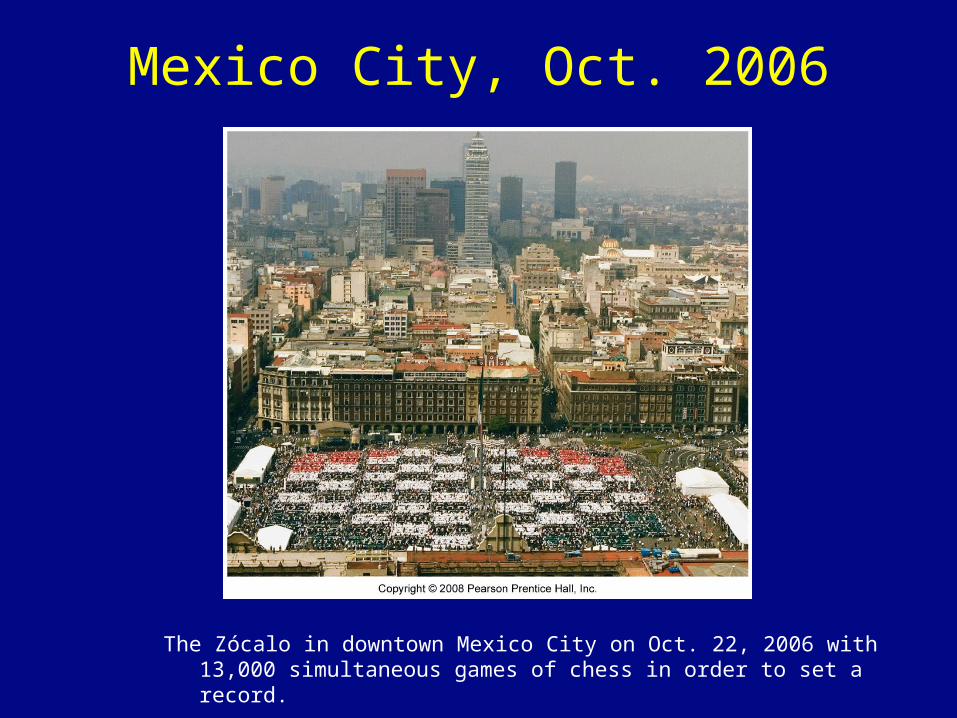
Mexico City, Oct. 2006
The Zócalo in downtown Mexico City on Oct. 22, 2006 with 13,000 simultaneous games of chess in order to set a record.
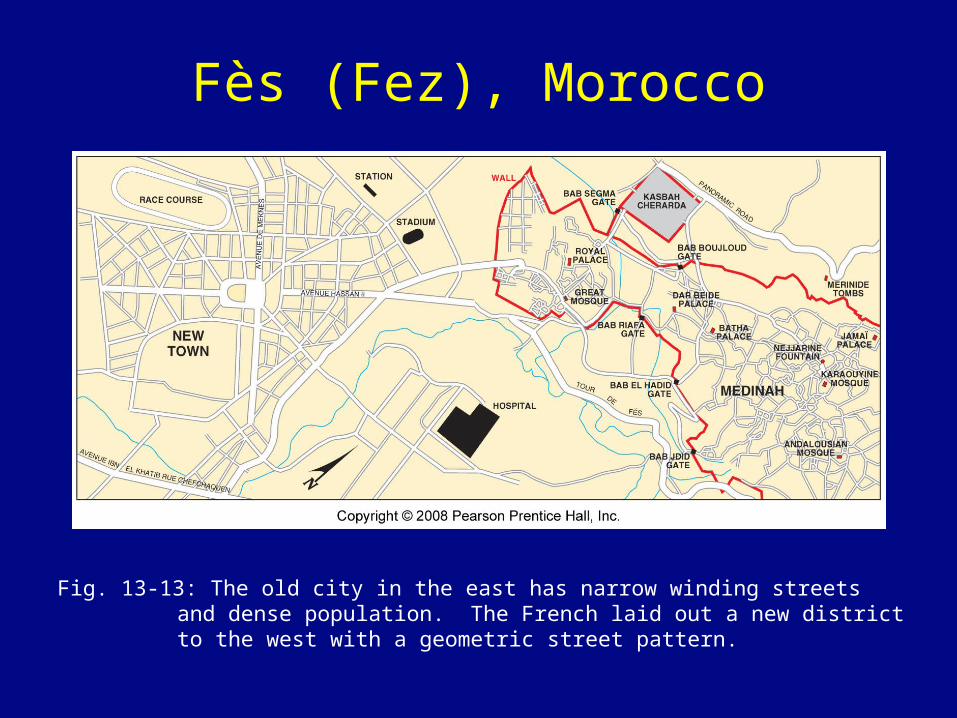
Fès (Fez), Morocco
Fig. 13-13: The old city in the east has narrow winding streets and dense population. The French laid out a new district to the west with a geometric street pattern.
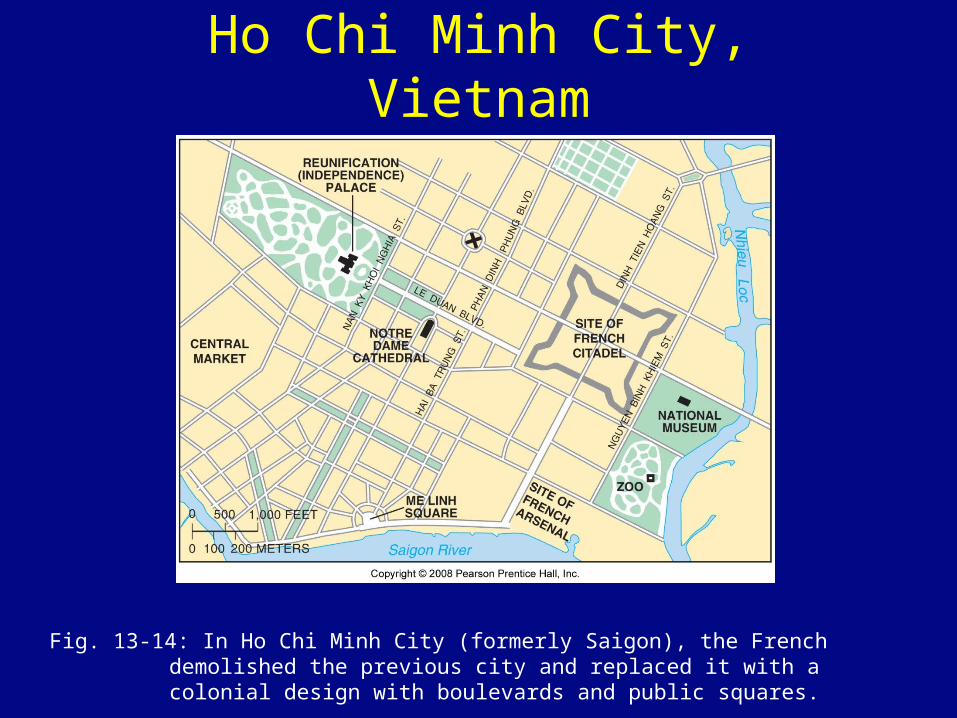
Ho Chi Minh City, Vietnam
Fig. 13-14: In Ho Chi Minh City (formerly Saigon), the French demolished the previous city and replaced it with a colonial design with boulevards and public squares.
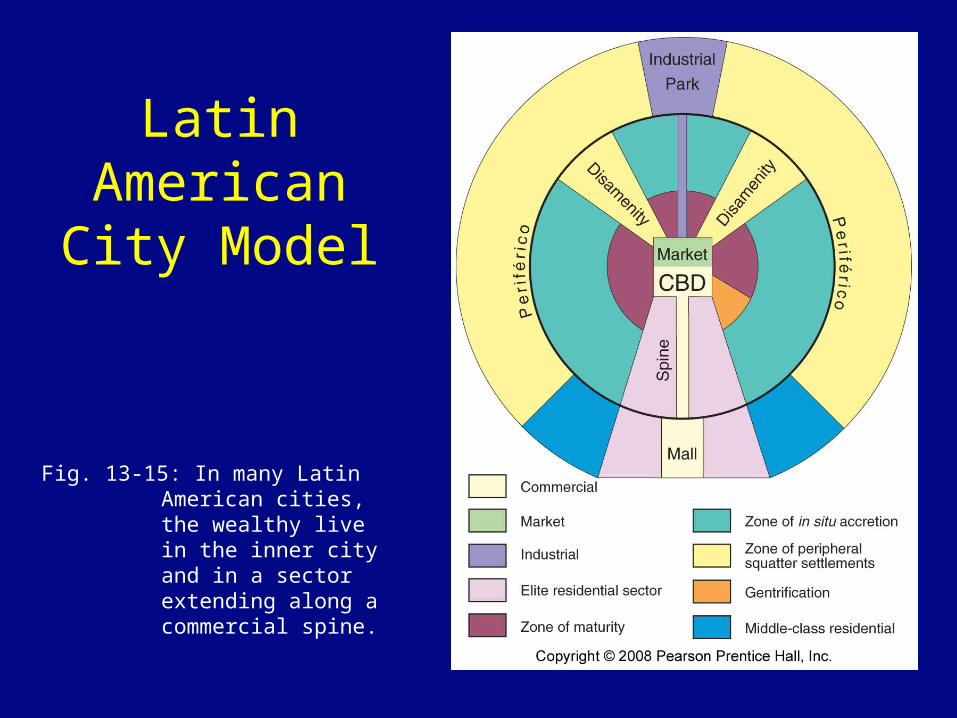
Latin American City Model
Fig. 13-15: In many Latin American cities, the wealthy live in the inner city and in a sector extending along a commercial spine.
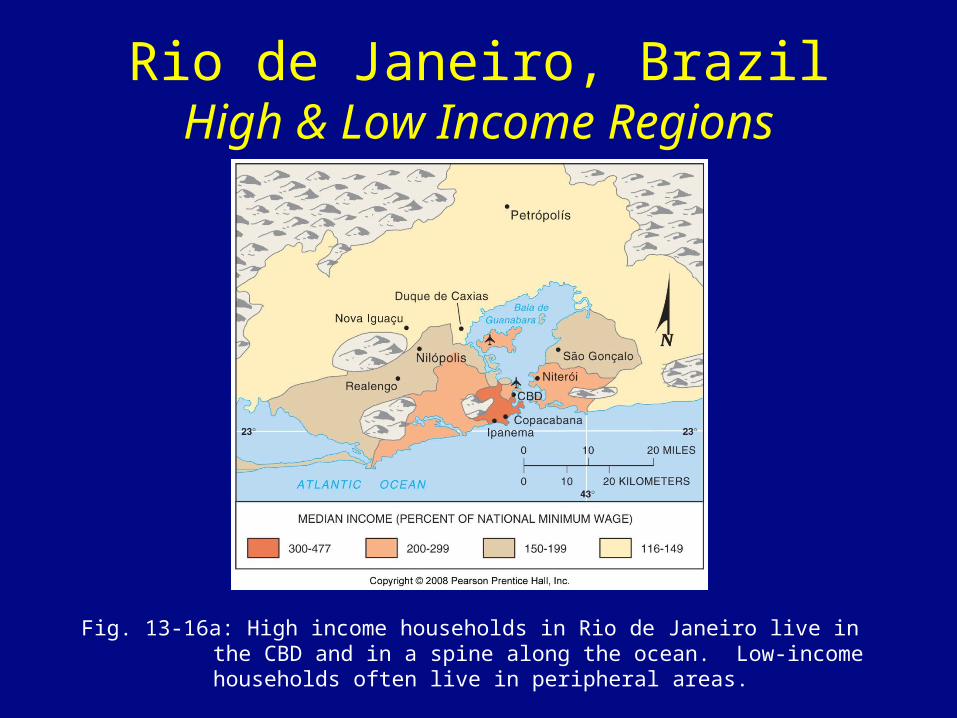
Rio de Janeiro, BrazilHigh & Low Income Regions
Fig. 13-16a: High income households in Rio de Janeiro live in the CBD and in a spine along the ocean. Low-income households often live in peripheral areas.
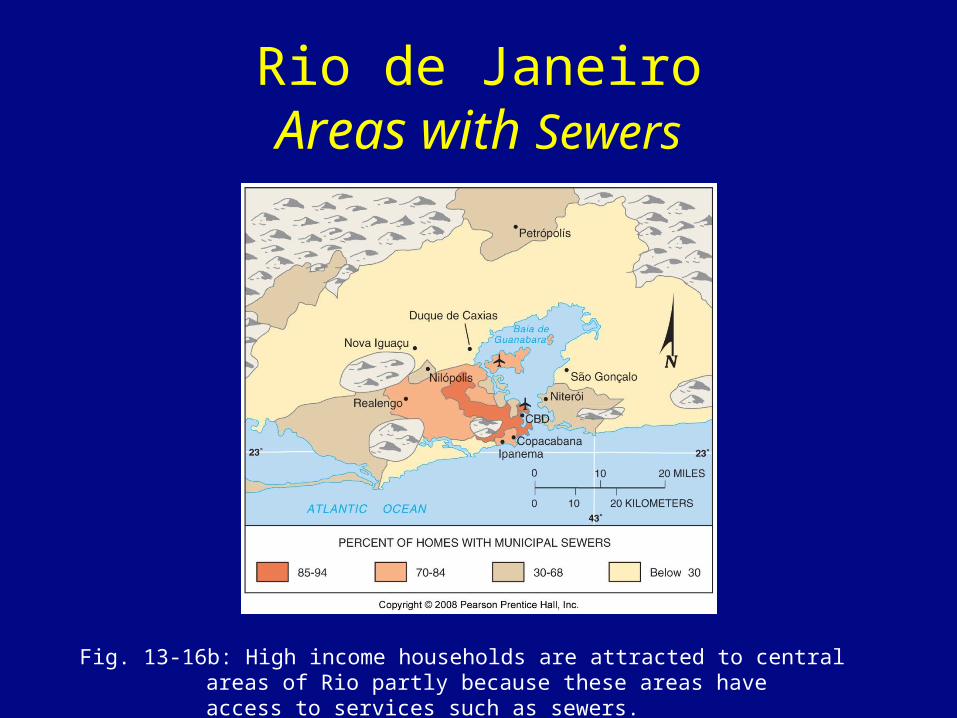
Rio de JaneiroAreas with Sewers
Fig. 13-16b: High income households are attracted to central areas of Rio partly because these areas have access to services such as sewers.
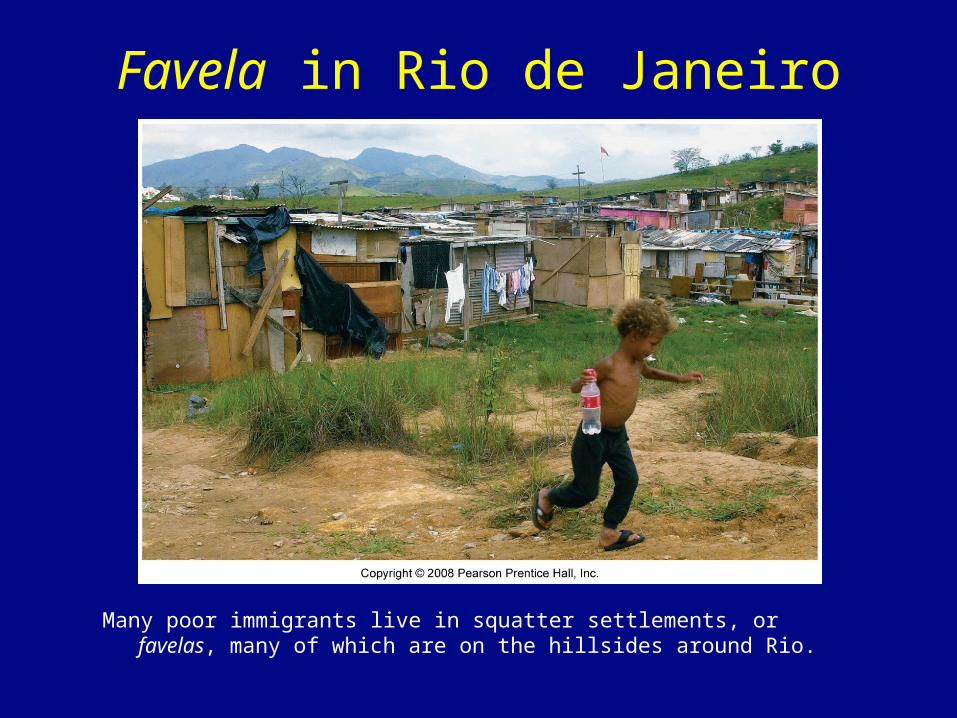
Favela in Rio de Janeiro
Many poor immigrants live in squatter settlements, or favelas, many of which are on the hillsides around Rio.


