F values cannot go below 0.93 and 0.92 respectively (7 and 8% of the oxygen is lost to
the fluid phase in these two reactions)3. The maximum shift in the 18OWR value due to
dehydration will almost always be less than 1‰. The bottom line is this: volatilization
reactions in metamorphic rocks cannot change the 18WR values of a lithology by
more than several per mil under any conditions. Larger shifts in 18OWR values in
geologic studies require the infiltration of a fluid or melt.
The effect of volatilization reactions on the isotopic composition of minor
elements, such as hydrogen and carbon, can be much larger. In the case of both hydrogen
and carbon, volatilization reactions can proceed until F approaches zero for that element,
as is the case for carbon in reaction 12.5. The delta values will decrease asymptotically
towards -1000‰ as F approaches 0. Such extreme lowering is never seen in metamorphic
systems, but examples of Rayleigh volatilization trends for hydrogen and carbon isotope
ratios are commonly observed as discussed in the following section.
In typical pelites, a series of dehydration reactions occurs with increasing
temperatures until, by the time granulite-facies conditions are reached, nearly all
hydrogen is driven from the rock. Hoernes and Hoffer (1979) found that the D values of
biotite in a prograde metamorphic sequence from Namibia decreased by 30‰ as
temperatures of metamorphism increased from 480 to 650°C. The decreasing D values
can be explained by removal of water with high D values during volatilization.
Nabelek et al. (1984) measured the 18O and 13C values of argillaceous
sediments intruded by a granitic stock. The 13C values decreased by almost 12‰ as the
intrusion was approached, concomitant with a decrease in the percentage of carbonate.
All data fit inside an envelope defined by the end-member batch and Rayleigh
decarbonation models (Fig. 12.3a) suggesting that the carbon isotope changes can be
explained entirely by decarbonation reactions. In contrast, the low 18O values cannot be
2 A maximum of 66% O2 loss is possible for the reaction CaCO3 CaO + CO2, but this reaction is
extremely rare. 3 An extreme case would be the dehydration of brucite (Mg(OH)2 or portlandite (Ca(OH)2), where F can
approach 50%, but this is an extreme example that is probably never encountered.
Chapter 12. Metamorphic Petrology
12-8
explained by decarbonation alone. Decarbonation would only lower the 18O value of the
sediments by a maximum of 2‰, far less than the 12‰ actually measured (Fig. 12.3b).
The 18O values falling below 18‰ require open system behavior, explained by a low
18O fluid from the crystallizing granite infiltrating the permeable sediments.
A study of the Elkhorn contact aureole serves as a second example of complex
volatilization and fluid infiltration behavior (Bowman et al., 1985). Changes in 13C and
18O values during decarbonation are calculated for both the batch (curve D-D) and
Rayleigh (curve D-R) equations (Fig. 12.4). Neither model reproduces the measured 13C
and 18O values of the metamorphosed carbonates, shown as filled green circles.
Bowman et al. proposed a two-stage model, incorporating partial decarbonation along a
Rayleigh path (curve D-B) followed by mixing with an magmatic fluid (curve B-M).
Valley (1986) plotted trends for sixteen studies of contact metamorphism along
with the predicted trends for pure volatilization. None of the coupled 13C-18O trends
can be explained purely in terms of volatilization. In all cases, infiltration of an external
fluid must be invoked.
12.3 Fluid sources and fluid rock-interaction
12.3.1 Oxygen and hydrogen
Through a combination of oxygen, hydrogen and carbon isotope analyses, it is
often possible to constrain, or even unambiguously define, the origin of an infiltrating
fluid. In order to go further and place numerical constraints on the amount of an
infiltrating fluid, two conditions must be met. First, the composition of the infiltrating
fluid must be different from that of the unaltered rock, and second, the isotopic
composition of the infiltrating fluid and unaltered rock must be known.
Fig. 12.3. a. Changes in 13C values of carbonate layers as a function of reaction progress for
argillaceous sediments surrounding the Notch Peak Stock, Utah. Dashed and solid lines are for CO2-cc =
1.0025 and 1.0045, respectively. All data fall between the end-member batch and Rayleigh fractionation
models, but not for any one value of . b. In contrast to the carbon data, 18O values near the stock are
far too low to be explained by Rayleigh fractionation during decarbonation reactions (curve). Instead,
light fluids emanating from the stock must have infiltrated the permeable argillaceous sediments. (After
Nabelek et al., 1984). If they were ‘pure’ aqueous fluids, they would affect only the oxygen, but not
carbon isotope composition.
Sharp, Z.D. Principles of Stable Isotope Geochemistry
12-9
A crude compartmentalization of
hydrogen-oxygen isotope compositions of
‘generic’ fluids from different sources is
given in Fig. 12.5. The isotopic
compositions of meteoric waters, ocean
water and brines have been measured
directly. Metamorphic and igneous fluids
are generally inferred. Direct
measurements of metamorphic and
igneous waters can be made on fumaroles
and fluid inclusions, but this is rarely
done. More often, the isotopic
composition of a metamorphic fluid is
calculated from the measured isotopic
composition of solid phases and an
assumed equilibrium fluid-rock
fractionations (Sheppard, 1986).
Meteoric and ocean waters have
distinct 18O values. Ocean waters have
unambiguously high D values whereas
meteoric waters, depending upon latitude
and elevation, may have extremely low
D and 18O values. Meteoric fluid-rock
interactions can occur prior to
metamorphism (Fourcade and Javoy,
1973; Valley and O'Neil, 1982; Sturchio
and Muehlenbachs, 1985; Yui et al., 1995 and examples that follow), during peak
metamorphism (Fricke et al., 1992), as a retrograde feature (Frey et al., 1976; Mora and
Valley, 1991; Jenkin et al., 1992; Jenkin et al., 1994a), and in contact metamorphic rocks
(Bowman et al., 1985; Jamtveit et al., 1992). It is reasonable to state with some certainty
that interaction of a metamorphic rock with meteoric waters had occurred if the whole
rock 18O or D values are less than 3 to 4‰, or -100‰, respectively.
Probably the most striking example of meteoric water alteration in a metamorphic
rock comes from the work of Yui et al. (1995) on the ultrahigh-pressure coesite-diamond-
bearing rocks of the Dabie and Sulu terranes of eastern China. These rocks have been
buried to depths far in excess of 100 km. The 18O values of all minerals are in
equilibrium for the expected metamorphic temperatures. What is remarkable are the 18O
values themselves. They range from -10.4 to -9.0‰, making them some of the lowest
18O values found in any rock. The authors suggest that the rocks underwent high
latitude/altitude hydrothermal alteration with meteoric waters prior to subduction and
metamorphism. This hypothesis requires that the system remained closed to external
fluids throughout the extended journey from the surface to depth and back to the surface
again.
Waters of oceanic origin have been recognized in metamorphic rocks by their
uniquely high D values. Wickham and Taylor (1985) found isotopic evidence for large-
scale seawater infiltration to depths of 6-12 km. Homogeneous 18O values and very high
Fig. 12.4. 13C vs. 18O values for the Elkhorn
contact aureole, Montana, USA (Bowman et al.,
1985) . The unmetamorphosed limestone plots at D.
Batch and Rayleigh volatilization curves are shown
by trajectories D-D’ and D-R, respectively. Mixing
with an magmatic fluid plots along D-M. The
metamorphosed calcites require a two stage model,
first Rayleigh volatilization (D-B), followed by fluid
infiltration (B-M).
Chapter 12. Metamorphic Petrology
12-10
D values of the muscovite (-25‰) point to a oceanic source.
The distinct isotopic signature of ocean fluids can be traced throughout a rock’s
metamorphic/tectonic history. Oceanic hydrothermal alteration produces hydrous phases
with high D values. Dehydration of the hydrous phases during later subduction-related
metamorphism will evolve a fluid with D and 18O values characteristic of seawater.
The high D values (-30) and low 18O values (8.3‰ for quartz) from some Alpine
eclogites are characteristic of rocks that have undergone seafloor metamorphism (Sharp
et al., 1993). Dehydration of seafloor metamorphosed rocks during subduction
presumably caused the release of fluids of an ocean affinity which then interacted with
the surrounding rocks. Similar characteristic signatures of volatilization and infiltration
from a subducting slab are seen at shallow levels (Bebout and Barton, 1989; Sharp and
Barnes, 2004), where D values as high as -25‰ are measured.
The compositional fields for waters other than oceanic or meteoric overlap, and
are therefore ambiguous. The primary magmatic water box represents mantle aqueous
fluids that have been modified by degassing during ascent (see Chapter 11). It overlaps
with the far larger metamorphic water box, the range reflecting the varied compositions
of the protoliths and their temperatures of metamorphism. The metamorphic water box
could be subdivided further on the basis of different rock types and water sources. For
example, the high D end of the metamorphic water box is defined by hydrothermally
altered ocean basalts, while the high 18 end of the metamorphic water box is for waters
that have equilibrated with high 18 metasediments.
Fig 12.5. “Generic” water boxes for different geological environments. The range of ocean water is
explained by changes in ice pack volume. Meteoric waters become lighter at higher latitudes and altitudes.
Primary igneous water should be derived from the mantle with some degree of modification due to vapor
loss. Organic water is related to the oxidation of organic material, and is a minor constituent in metamorphic
rocks. Metamorphic waters are buffered by metamorphic rocks. Because of the extreme variety of
metamorphic rock types, the metamorphic box is large. The sedimentary box is not sedimentary fluids, but
rather the 18O-D values of the rock itself. During sedimentation in the marine environment, the 18O-D
values are near zero (seawater). They increase during metamorphism as the fractionations between rock and
fluid decrease. Diagram after Sheppard (1986).
Sharp, Z.D. Principles of Stable Isotope Geochemistry
12-11
12.3.2 Carbon
Carbon isotope systematics
differ from oxygen in several ways.
First, carbon generally exists in only
two solid forms, either as carbonate
minerals or as reduced graphite (or
organic matter at lower grades and
diamonds at ultrahigh pressures). In
carbonate- and graphite-free rocks,
carbon is a minor or even trace
element. While the molar abundance
of oxygen is relatively constant for all
but the most unusual rock types,
carbon concentrations range from zero
up to 12 wt % (in a pure marble) and
approach 100% in graphite or coal
deposits. Oxygen is the major component of most aqueous metamorphic fluids, while
carbon is generally a trace component of the fluid, so that very high fluid-rock ratios (or
alternatively carbon-rich fluids) are required to alter the 13C value of a rock. Finally,
carbon can exist as a reduced or oxidized form in the fluid phase. The carbon isotope
fractionation between CO2 and CH4 is large (Fig. 12.6), so that the oxidation state of the
fluid will strongly affect the 13C value of a solid during fluid-rock interaction.
Carbon isotope measurements have traditionally been made on carbonates or
graphite4. The diffusion rate of carbon in graphite is too slow for any exchange to occur
at metamorphic temperatures. Carbon exchange between graphite and carbonate occurs
only during recrystallization of the graphite. Because the diffusion rate of carbon in
graphite is so slow, it is an excellent geothermometer for high temperature metamorphic
terranes. Peak temperatures are often preserved even when overprinted by a secondary
metamorphic event. This concept is discussed further in section 12.6.3.
Decarbonation reactions can change the 13C value of a carbonate, but only if a
significant fraction of the carbonate is reacted away. The insensitivity of the carbon
isotope composition to decarbonation is due to the small fractionation between CO2 and
carbonate (Fig. 12.6). A maximum (positive) fractionation of 2.6‰ occurs at ~450°C,
which decreases with increasing temperature. 50% decarbonation will lower the 13C
value of a carbonate by less than 2‰.
Another mechanism that changes the 13C value of carbonate is exchange with an
exotic CO2 or CH4-rich fluid. Such behavior has been proposed to explain carbon isotope
variations by a number of workers (Deines and Gold, 1969; Kreulen, 1980; Pineau et al.,
1981) and can be quite diagnostic of fluid infiltration. Pineau et al. (1981) measured
carbonates from deep granulites from Bamble, Norway where the 13C values were
-8.21‰. They interpreted these low values as evidence of extensive infiltration of a
mantle derived CO2-rich fluid. Simple decarbonation of a typical carbonate (see Fig.
413C determinations have been made on other non-carbonate phases such as cordierite (Vry et al., 1988),
scapolite (Hoefs et al., 1981; Moecher et al., 1994), and fluid inclusions (Hoefs and Touret, 1975; Rye et
al., 1976; Kreulen, 1980).
Fig 12.6. Carbon isotope fractionation between CO2
and other phases. See Fig. 11.4 for references.
Chapter 12. Metamorphic Petrology
12-12
11.1) would not lead to such low 13C values.
The generally accepted value for mantle carbon is approximately -6‰. A 13C
value of -6‰ is by no means proof of mantle origin, however. Any one of a number of
processes, such as exchange with CO2 derived by oxidation of organic matter, will lower
the 13C value of the carbonate as well (Frezzotti et al., 2000). While 13C values near
-6‰ might result from simple infiltration of magmatic carbon, they do not prove the
existence of a mantle-derived fluid. And finally, mysteries remain as to carbon sources,
where 13C values have unexplained origins. Ghent and O’Neil (1985) found
Precambrian marbles with 13C values of 8.9‰, which they tentatively explained as a
primary, ancient sedimentary value (see Fig. 7.15). Deines (1968) found the record heavy
sample. Carbonate inclusions in a mica peridotite have 13C values as high as +25‰.
These high values may be related to volatilization of a CH4-rich fluid, but the explanation
is not totally satisfactory. Clearly, mysteries remain.
12.3.3 Sulfur
Sulfur isotope systematics are similar to those of carbon for the following reasons:
1) in most rocks, sulfur is a trace component. 2) It occurs in both oxidized (sulfate) and
reduced (sulfide) form. 3) The concentration of sulfur in metamorphic fluids is low, and
4) sulfur-bearing species in the fluid can exist in a number of oxidation states.
At first glance, isolated sulfides appear to be far less ‘reactive’ than silicates or
carbonates, although the apparent cause of this observation is somewhat deceiving. In a
study of regionally metamorphosed graphitic sulfidic schists from south-central Maine,
Oliver et al. (1992) found that the 34S values of coexisting pyrite and pyrrhotite did not
approach equilibrium during metamorphism even in rocks that had reached 500°C.
Instead, the grains preserved their pre-metamorphic 34S values averaging about -27‰,
decreasing only slightly, if at all, with increasing metamorphic grade. The authors had
expected equilibrium to be attained on the scale of 10s to 100s of meters, on the basis of
published fluid fluxes for the region and the fact that exchange of sulfur between
coexisting sulfides occurs rapidly even at low temperature in sulfide deposits. What
Oliver et al. realized is that the lack of equilibrium on even the hand-sample scale is
caused by the low sulfur concentrations in the fluid, analogous to what had been
proposed by Monster et al. (1979). Although fluid flow was extensive and calculated
aqueous fluid fluxes were high, the lack of sulfur species in the fluid resulted in a sulfide
fluid flux that was vanishingly low. Sulfur concentrations in the fluid were simply so low
that the fluids did not act as a conduit for sulfur transport between isolated sulfide grains.
The exchangeability of sulfur during metamorphism was further refined in an
elegant in situ laser study of metamorphosed volcanogenic massive sulfide deposits
(Crowe, 1994). Both touching and isolated chalcopyrite and pyrrhotite grains were
analyzed from a suite of greenschist to amphibolite-grade rocks from Alaska (Fig. 12.7).
Sulfide grains that were completely enclosed in quartz preserved their original
hydrothermal 34S values. Touching sulfide pairs were reset to less-than-peak
metamorphic temperatures due to continued exchange during retrogression. The degree
of resetting was more pronounced in small touching pairs than large ones. Crowe
concluded that the blocking temperature for sulfur isotope exchange is low, and that
primary hydrothermal sulfur isotope compositions are only preserved in isolated grains
that could not ‘communicate’ with each other during retrogression.
Sharp, Z.D. Principles of Stable Isotope Geochemistry
12-13
12.4 Scales of equilibration during metamorphism
Remarkably varied types of fluid movement have been identified in metamorphic
terranes with the aid of stable isotope geochemistry. There are examples of fluid
exchange at the kilometer scale, channeled fluid flow restricted to the cm scale, meteoric
or seawater fluids penetrating down to depths in excess of 10 kilometers and channeled
fluids in regional terranes clustered tightly in “hot spots” or controlled by large scale
structural features or lithological boundaries. It is clear from the many different studies of
metamorphic rocks that no simple rules apply to fluid flow behavior. Each terrane (and
lithology) needs to considered on a case-by-case basis.
12.4.1 Regional scale exchange
Taylor et al. (1963) were the first to propose large-scale isotopic homogenization
attending metamorphism. They measured the 18 values of mineral separates from three
different bulk assemblages in kyanite zone pelitic schists in Central Vermont. Samples
were collected over distances of several hundred meters from two metasedimentary units.
The samples had a minimum of retrograde alteration and were all in textural equilibrium
at the thin-section (mm-cm) scale. The measured isotopic fractionations between
coexisting mineral pairs in a single lithology were the same in three of the four samples,
indicating that they had equilibrated under the same temperature conditions. More
surprising was that the 18O values of minerals common to all samples were nearly
identical. This could be due to initial sedimentary isotopic compositions and modal
abundances that coincidentally led to identical isotopic compositions at peak
metamorphic conditions. Or, as the authors proposed, a fluid phase had promoted
complete oxygen isotope homogenization between the different units. They suggested
Fig. 12.7. Temperature estimates from 34S values of coexisting pyrrhotite-chalcopyrite pairs
from the greenschist facies Rua Cove deposit, Alaska, USA. While isolated grains may
preserve fractionations corresponding to peak temperatures, samples in direct contact have
reequilibrated during cooling. After Crowe (1994).
Chapter 12. Metamorphic Petrology
12-14
that there was a pervasive metamorphic fluid that led to isotopic homogenization at the
>100 meter scale. One way of testing this hypothesis would be to run mineral separates
from rock types that were quite different, such as metapelites and coexisting calc-pelites.
In this way, one could more reliably state that the initial 18O value of the two lithologies
were different, yet the similar 18O values of hornblendes, epidotes, garnets, etc. were a
strong indication of fluid homogenization.
Shieh and Schwarz (1977) found essentially identical bulk 18O values of
different ortho- and para-gneisses over a 10,000 km2 area. There is no mechanism that
could explain fluid circulation and homogenization on such a large scale, rather these
data do support the idea of a “fortuitously” homogeneous protolith. Bowman and Ghent
(1986) measured the oxygen and hydrogen isotope composition of metapelites from
staurolite to sillimanite zone in British Columbia and concluded that the general
homogenity of the 18Oquartz values (13.30.3 1, n=9, 3 outliers) was caused by a
homogeneous protolith. Demonstrating the presence of a pervasive fluid is difficult, and
is best carried out when adjacent lithologies have clearly different protolith 18O values.
Isotope homogenization of hydrogen is probably more common than for oxygen.
First, the buffering capacity of a rock for hydrogen is not very strong, given the low
concentration of hydrogen in a rock. Second, the exchange rate of hydrogen between
minerals and fluids is much more rapid than for oxygen. In the classic example of this
phenomenom, Frey et al. (1976) state that rocks of the metamorphic Monta Rosa granite,
Central Swiss Alps have ‘stewed in their own juices’5, in order to explain the
homogeneity of hydrogen isotope ratios, and heterogeneity of oxygen isotope ratios.
12.4.2 Localized exchange
Fluid interaction between what are commonly deemed ‘impermeable rock types’,
particularly marbles and cherts, is extremely limited. Marbles often retain their original
18O and 13C values, even when surrounded by lithologies that have a completely
different isotopic composition or have evidence of extensive interaction with an external
fluid. Marbles are more susceptible to isotopic exchange in samples where the
permeability was enhanced by metamorphic decarbonation reactions (Rumble and Spear,
1983). Decarbonation reactions could produce a volatile phase which increases the fluid
pressure. At the same time the volume change of the solid phases for the reaction,
Vsolids, is negative, thereby increasing porosity. The degree of fluid infiltration is often
proportional to the magnitude of calc-silicate reactions that have occurred. It should be
pointed out, however, that ductile marbles probably cannot accommodate increased fluid
pressures without flowing, and there is very serious issue regarding wetting angles in
order for this process to persist for any significant period of time (see Holness and
Graham, 1991 for a further discussion).
Rye et al. (1976) made a comprehensive stable isotope study of interbedded schist
and marble units in a prograde metamorphic sequence at Naxos, Greece. The 18 values
of the quartz and muscovite in the schists correlate well with metamorphic grade. The
18 values of quartz decrease from a typical sedimentary value of 19‰ in the least
metamorphosed rocks to 9.4‰ in the migmatite6 samples. The marbles, on the other
5 One of the great ‘lines’ from a renowned stable isotope geochemist! 6 Migmatites are rocks that have gotten sufficiently hot to partially melt.
Sharp, Z.D. Principles of Stable Isotope Geochemistry
12-15
hand, have relatively constant 18 values, even in the highest grade rocks. Rye et al.
concluded that there was significant fluid infiltration into the schists from “deep-seated”
sources, while the marbles were impermeable to the evolving fluids.
Fluid flow is often controlled by large scale structural features, such as thrust
ramps, thermal domes related to igneous intrusions, antiforms and with kilometer-scale
vein systems. Shear zones often act as important conduits for enormous amounts of fluid
movement. Different 18 values between mylonites or ultramylonites and host rock
clearly indicate that fluids passed through the shear zone. Both downward penetration of
fluids – a meteoric source (McCaig et al., 1990; Morrison and Anderson, 1998) – and
upward flow from deeper levels (Kerrich, 1986; Fourcade et al., 1989; Burkhard and
Kerrich, 1990; Crespo-Blanc et al., 1995) have been identified.
12.5 Quantifying fluid-rock ratios and fluid fluxes
12.5.1 Simple mixing models: Zero dimensional water-rock interaction models
Taylor (1979) proposed a model for estimating fluid/rock ratios by assuming
instantaneous and constant isotopic equilibration between a fluid and rock. His model
was developed for fluids infiltrating a granite (Chapter 11), but has been applied to
metamorphic rocks as well. The basic mass balance equation for mixing a rock and fluid
is
2 2
δ Rδ δ Rδi i f f
H O rock H O rockW W 12.8
where i is the initial value, f is the final value, W is the atom fraction of the element in
water that has participated in the interaction, and R is the atom fraction of the element in
rock. It is necessary to assume a value for i
OH2 , such as local meteoric water values. The
i
OH2 value can almost never be measured because the initial fluid is no longer present in
the rock, other than as fluid inclusions which most likely have been modified during
metamorphism. Similarly, the 18O value of the unaltered rock must be estimated. For
shear zones, the non-sheared equivalent can be taken as the reasonable i
rock value. In
hydrothermal studies of epithermal granites, a normal granite is used for the i
rock
variable. The f
rock value is measured. The only variable not known is f
OH2 , which must
be calculated for an assumed temperature on the basis of known fractionation factors
between rock and fluid (rock-fluid).
Equation 12.8 can be rearranged to give a closed system water-rock relationship:
2
δ δ/
δ - δ - Δ
f i
rock rock
i f
H O rock rock fluid
W R
12.9,
where rock-fluid is the equilibrium fractionation between the rock and fluid at the
temperature of interest. Equation 12.9 is valid for the special case where fluid enters a
system, equilibrates with the rock and is expelled in a single event. It is equivalent to the
batch fractionation described above for volatilization/dehydration reactions. Ohmoto
(1986) compares the Taylor one-pass model to “an autoclave which contains water and
Chapter 12. Metamorphic Petrology
12-16
rock, and is maintained at
a constant temperature”.
The other end-member
scenario – the multi-pass
case models the process of
infinitely small quantities
of fluid coming into
contact with a rock,
equilibrating with it, and
then being expelled. This
model can be derived by
writing equation 12.8 in
differential form and
integrating it as follows:
2
2
δ Δ δ/ ln
δ - δ - Δ
i i
H O rock
i f
H O rock
W R
ln ( / ) 1closed sytemW R 12.10.
The equation is discussed in more detail by Nabelek (1991). Care should be taken when
using these water-rock ratio models. The simple W/R ratio equations above are too often
misapplied to metamorphic systems. In metamorphic rocks of deep-seated origin,
estimates of the i
OH2 and
irock values, as well as temperature of interaction may not be
well constrained, and the researcher should be aware of the potentially large uncertainties
that may be associated with calculated fluid/rock ratios.
In all cases, the W/R ratios calculated using equations 12.9 and 12.10 are
considered minimum values. Fluids can pass through a rock and not interact with it due to
sluggish kinetics, or only partially interact. In terms of the effect on the rock, it is the
same as if the fluid had never passed through the rock. Such a scenario could be imagined
where quartz precipitates along the walls of a newly-forming vein. Once a veneer of
quartz has precipitated, further fluid flow could be channeled through the center of the
vein without any effect on the rock.
12.5.2 One dimensional (directional) water-rock interaction models
The previously described fluid-rock interactions can be considered as ‘zero
dimensional’ models. They consist of three stages: 1) introduction of some amount of
fluid, 2) equilibration between the rock and fluid, and 3) expulsion of the fluid. It is a
simple mass balance treatment and does not consider flow direction. The model works
well in some cases, but does not adequately describe continuous fluid-rock interaction for
fluids travelling unidirectionally. Instead, it is necessary to consider a one-dimensional
system, where fluid comes from a source with a distinct isotopic composition and reacts
with the rock along a specific flow path. When considering fluid-rock interaction in this
way, we see how the isotopic compositions of the rock and the fluid change with time
and space.
The concept behind a one-dimensional flow model is based in chromatographic
Fig. 12.8. Simple mixing of freshwater and seawater. The salinity of
our beaker will only reach the salinity of the infiltrating fluid (3.5%) for
infinite W/R ratios. Curve a ‘one pass’; curve b ‘multi-pass’
Sharp, Z.D. Principles of Stable Isotope Geochemistry
12-17
theory, and can easily be
described by simple ‘laboratory’
analogs. First, we’ll consider the
zero dimensional model,
discussed above. For our
hypothetical example, we will
just consider mixing between
fresh water and salt water,
ignoring isotopes. It is easy to
visual this system, yet is no
different that mixing of two
reservoirs with different isotopic
compositions. Our system
consists of a beaker of fresh
water and infiltrating seawater
with a salinity of 3.5%. If we add a little bit of seawater to our beaker, the salinity
increases slightly. The more salt water we add, the higher the salinity. Using equation
12.9, our i
rock is the beaker’s initial salt-free water, and our i
OH2 is seawater with a
salinity of 3.5%. The beaker filling up with ever-greater amounts of seawater equivalent
to the one pass model. If the inflow of seawater is balanced by an outflow from the
beaker, so that the level of water never changes, then the multipath model is realized. A
graph depicting the W/R ratio using equations 12.9 and 12.10 is given in Fig. 12.8 for a
‘one pass’ (curve a) and ‘multi-pass’ model (curve b). Salinity at first increases rapidly
with the addition of salt water, but
ultimately approaches the 3.5 %
salinity of the incoming fluid
asymptotically. We need a W/R ratio
of to reach the identical salinity as
the infiltrating fluid.
Now, instead of a beaker,
consider a long, thin capillary tube
filled with fresh water. Seawater
enters one end of the tube with a
salinity of 3.5%. As the seawater
enters from the tube from one end,
fresh water is expelled from the
other end. If there is no dispersion or
diffusion at the seawater-freshwater
interface, then a sharp salinity front
exists at the boundary between the
two fluids. The interface migrates
forward with time, the rate of
forward progress related to the flux
(units of volume/area or simply
distance), or rate of flow. This
construction is illustrated in Fig.
Fig. 12.9. One-dimension flow model of seawater
infiltrating a column of freshwater. At time t=0, the entire
length of the column will have freshwater. As the seawater
flows into the column, a sharp front will migrate forward,
the rate being proportional to the fluid flux. Although the
salinity is not the same along the entire column, any plane
perpendicular to the length of the column has seen the same
amount of fluid (e.g., had the same W/R ratio).
Fig. 12.10. One-dimensional infiltration model, illustrating the
‘smoothing’ effects of dispersion, diffusion, and finite reaction
kinetics. tx refers to time after the beginning of mixing. As
time proceeds, the boundary becomes more diffuse.
Chapter 12. Metamorphic Petrology
12-18
12.9. At t=0, the salinity of the entire tube is 0 and seawater is just beginning to enter
from the left-hand side. As the flow continues, the seawater-freshwater front migrates to
the right, so that at time t=x, there is a salinity front at position lx. All of the fluid at l<lx
has a salinity of 3.5%, and all fluid at l>lx has a salinity of 0%. If we were to apply the
simple mixing equations, either 12.9 or 12.10 to this system, we would calculate a W/R
ratio of 0 at all points l>lx, and W/R ratios of at all point l<lx. In fact, all points along
the flowpath have seen the same fluid flux!
In real situations, the sharp front depicted in Fig. 12.9 becomes diffuse due to a
number of processes, including diffusion, dispersion, sluggish exchange kinetics
(between rock and fluid) and changing fractionation factors with changing temperature.
As a result, the infiltration front becomes less sharp (Fig. 12.10) as flow proceeds.
Spooner et al. (1977) first modeled stable isotope data using flow path
calculations. They divided the flow path up into a finite number of en echelon boxes, and
considered each as a zero-dimensional system. A finite quantity of fluid enters the first
box. It equilibrates with the rock volume in the first box, the 18O values of the rock and
fluid being determined by the fractionation factor 18Orock-fluid and the W/R ratio. The
amount of fluid entering the rock is determined by the porosity () of the rock. When a
small amount of fluid enters the first ‘box’, the 18O value of the rock changes very little,
while the tiny packet of fluid equilibrates ‘instantaneously’ with the rock. The simple
mass balance equation 12.9 applies. As the newly equilibrated fluid enters the second
box, it has an isotopic composition that is almost – but not exactly – in equilibrium with
the original rock, so that the 18O value of both the rock and the fluid box change nearly
imperceptibly. As each new increment of fluid enters the system, the integrated W/R ratio
of the first box increases, and the 18O (rock) value slowly shifts towards equilibrium
with the initial fluid. If we have an infinite number of infinitely small boxes, the
migrating front will be sharp. Increasing the size of each box causes the diffusion front to
smooth out.
A number of authors have developed mathematical solutions in the form of partial
differential equations which must be solved numerically to the problem of one-
dimensional fluid flow (Lichtner, 1985; Baumgartner and Rumble, 1988; Blattner and
Lassey, 1989). Some very nice applications have been made using this approach,
particularly to fluid-rock interaction in shallow-level contact environments (Nabelek and
Labotka, 1993; Bowman et al., 1994; Barnett and Bowman, 1995; Cook et al., 1997) and
between contrasting lithologies (Ganor et al., 1989; Bickle and Baker, 1990; Vyhnal and
Chamberlain, 1996).
As an example, Bickle and Baker (1990) made a detailed isotopic profile across a
schist-marble contact in a Tertiary metamorphosed sequence from Naxos, Greece. The
sigmoidal-shaped diffusion pattern is clearly displaced into the marble (Fig. 12.11). The
authors concluded that the pattern requires that there was a net transport (advection) from
the schist into the marble. The data can be explained by either a very modest degree of
fluid advection toward the marble from the schist combined with diffusion, or by a much
larger degree of fluid flow nearly parallel to bedding with only a small component
perpendicular to bedding. The two cannot be distinguished. Only the contact-
perpendicular component can be computed.
Sharp, Z.D. Principles of Stable Isotope Geochemistry
12-19
In a similar study, Cartwright and Valley (1990) measured a sigmoidal shaped
isotopic profile that was indeed centered on a granite-marble contact, in contrast to Bickle
and Baker’s displaced profile. They inferred this pattern to be related to diffusional
exchange via an intergranular pore fluid without any advective flow perpendicular to the
contact. The symmetry about the contact indicates that there was no preferential flow
direction (see Box 12.2).
Models have been developed to quantify fluid flow directions and fluxes in a
contact metamorphic event using stable isotope profiles. The situation has an additional
complexity that significant temperature changes occur along the flow path (Dipple and
Ferry, 1992), and consequently, isotopic fractionation between the fluid and rock varies
with distance. Two endmember flow models can be envisioned: fluid flow out of the
intrusion – that is the so-called ‘down-temperature’ flowpath; or fluid flow towards and
eventually into the intrusion – the ‘up-temperature’ flowpath. Both models have been
rigorously defended by various researchers. In fact, it seems likely that both flow regimes
may occur at a single contact aureole at different times. Fluids flows out of a pluton as it
crystallizes and expels water. Once crystallized, however, the temperature difference
between the intrusive and country rock creates a buoyant driving force for fluids to flow
towards the pluton and eventually upwards. The complexities of fluid rock interaction in
a contact metamorphic setting are discussed in Nabelek (1991).
12.6 Thermometry
12.6.1 Introduction
Stable isotope thermometry began in the late 40’s, with applications primarily to
low-temperature carbonates. Baertschi and Silverman (Baertschi, 1951; Baertschi and
Silverman, 1951) first measured the 18O values of bulk crystalline (silicate) rocks, but it
Fig. 12.11. Oxygen isotope profile of calcite across a schist-marble contact at Naxos, Greece. Data
are shown by circles; the solid line is derived from a combined infiltration-diffusion model in
which the fluid is moving from the schist into the marble. The arrows show the assumed initial
compositions of the schist and marble, respectively. Note that if there was only pure diffusional
exchange the sigmoidal profile would be symmetrical about the contact (as shown by the dashed
line). The displacement into the marble requires a component of flow from schist to marble. From
Bickle and Baker (1990).
Chapter 12. Metamorphic Petrology
12-20
wasn’t until some years later that Clayton and Epstein demonstrated that the
fractionations between coexisting minerals in high temperature rocks were large enough
to be valuable for thermometry (Clayton and Epstein, 1958, 1961). Garlick and Epstein
(1967) made a detailed study of prograde metamorphic sequences and demonstrated that
mineral-pair fractionations decrease with increasing metamorphic grade (Fig. 12.12). The
18O values increased in the following order: magnetite, ilmenite, chlorite, biotite, garnet,
muscovite, quartz. They were able to quantify temperatures of metamorphism on the
basis of quartz-magnetite fractionations, which had been calibrated experimentally.
Myriad thermometric studies have since been made in a wide range of metamorphic rock
types, ranging from subgreenschist facies to rocks heated to well over 1000°C (Sharp et
al., 1992; 1998).
Stable isotope thermometry applied to metamorphic rocks is complicated by the
slow cooling that occurs during retrogression. Taylor et al (1963) and Garlick and
Epstein (1967) both recognized the problem of retrograde reequilibration. Taylor et al.
asked whether or not chemical and mineralogical equilibrium are a prerequisite for
oxygen isotope equilibrium. They reasoned that if recrystallization processes are strong
enough to break Si-O bonds, they will surely result in anion reorganization as well.
Taylor et al wrote “If the O18/O16 ratios of these minerals are each “frozen in” at a
different, but constant, characteristic temperature, then similar -values might be
obtained in each rock”. This was the first mention of retrograde exchange in the sense of
the concept of “closure temperatures”. Although complications associated with retrograde
exchange exist, careful treatment of oxygen isotope data has led to numerous successful
thermometric studies in metamorphic rocks. In fact, with judicious sampling, more
Box 12.2: Comparison of isotopic data across lithological contacts.
It is common to consider isotopic variations across a lithological contact and
use differences to interpret mixing between the two lithologies. Care must be taken in
terms of what is being compared, however! Many studies exist where comparisons are
made incorrectly. Consider the juxtaposition of a quartzite and iron formation. The
18bulk rock values of the two lithologies are completely different and will show a
marked decrease across the boundary, which could be mistakenly interpreted as
isotopic disequilibrium. In fact, the iron formation has a lower 18Obulk rock simply
because it has a high percentage of magnetite. More meaningful information regarding
cross-lithology equilibrium is obtained when either similar lithologies or like minerals
are compared across lithologies. If the 18O values of quartz in the iron formation are
the same as in the quartzite, then isotopic equilibrium exists between the two
lithologies. It doesn’t matter what the 18O value of the bulk rock is. If fluid exchange
has resulted in isotopic equilibrium between the two lithologies, then the 18O values
of each mineral will be the same in each rock type, even though the bulk rock values
for each lithology could be completely different.
In a similar way, comparisons of the bulk rock 18O values of mafic and more
felsic igneous rocks are flawed, yet frequently made. A higher proportion of low 18O
minerals, such as olivine and pyroxene, in the more mafic magma will lead to a low
18O value, even when mafic and felsic co-mingled magmas are actually in isotopic
equilibrium.
Sharp, Z.D. Principles of Stable Isotope Geochemistry
12-21
information than just peak metamorphic temperatures can be ‘teased out’ of a rock that
has undergone partial retrograde exchange, as explained in section 12.7.
Two questions must be addressed when trying to extract metamorphic
temperature information using stable isotope thermometry: 1) Was isotopic equilibrium
attained during peak metamorphism, and 2) have the 18O values been modified during
the subsequent slow cooling? In low-grade metamorphic rocks, condition one is
commonly not met. Inheritance of pre-metamorphic values is all too common. In very
high-grade metamorphic rocks, high intragranular diffusion rates may lead to at least
partial reequilibration during slow cooling. There are a number of processes that can
disturb the isotopic equilibrium of an assemblage. These include 1) diffusional
reequilibration during simple cooling and in an otherwise stress-free system, 2)
deformation and recrystallization, and 3) introduction of a disequilibrium fluid. If the
diffusion rate of oxygen for a pair of minerals is fast, then some degree of resetting must
occur during slow cooling from high temperature. The isotope community is divided with
respect to the accuracy of high-temperature estimates obtained using stable isotope
fractionations. Some groups have had apparent success in retrieving peak metamorphic
temperatures; others maintain that peak-temperature equilibrium is almost never retained.
Strategies have been developed to use stable isotope thermometry to extract peak
metamorphic temperatures. Recent work indicates that certain minerals are extremely
‘refractory’, in the sense that they do not reequilibrate during cooling (Sharp, 1995;
Valley, 2001). It is safe to say that careful selection of lithologies and minerals is crucial
to any effort aimed at extracting peak temperature data from high-T metamorphic rocks
(e.g., Farquhar et al., 1993).
12.6.2 Oxygen isotope thermometry in metamorphic rocks – testing for equilibrium
Several strategies have been developed to extract accurate temperature estimate
from metamorphic rocks.
Fig. 12.12. Garlick and Epstein’s (1967) measured fractionations of minerals relative to quartz for several
metamorphic terranes. The authors noted that there is a general decrease in fractionation as temperatures
increase. Left: The data as plotted in the original paper. Each sample is placed at the temperature determined
by the quartz-magnetite calibration (based on published quartz-water and magnetite-water exchange
experiments). Right: The data are refit here to more recent quartz-mineral calibration curves and show a
generally smooth decrease in fractionation with increasing temperatures. Using the updated fractionation
data, lower temperature estimates are obtained than in the original paper.
Chapter 12. Metamorphic Petrology
12-22
1) Measure multiple minerals in a single sample. If all mineral pairs give the same
temperature, then there is more confidence in the validity of the results. The isotopic
fractionation between two solid phases can be expressed by the equation
6
2
101000ln α
x y
x y x y
ab
T
12.11,
where a is the temperature coefficient of fractionation for phases x and y and b is a
constant, usually equal to zero for anhydrous minerals, T is in Kelvins. Equation 12.11
can be rearranged in a simple linear format (y = mx)
6
2
101000ln α b a
T
12.12.
Our y = 1000ln- b, m = 106/T2, and x = a. If all minerals in an assemblage are in
isotopic equilibrium at temperature T, then the data must form a linear array on a
1000ln-b vs. a plot. The best fit line passes through the origin and has a slope of 106/T2
(Javoy et al., 1970). Consider the
mineral suite quartz, plagioclase,
biotite, muscovite, and magnetite.
In the example given in Fig. 12.13,
all minerals plot on a straight line
except magnetite. One could
reasonably conclude that all
minerals except magnetite are in
isotopic equilibrium, and the slope
defined by the data points for
quartz, plagioclase, muscovite and
biotite is equal to 106/T 2.
This form of graphical
representation has been used in
numerous studies. It provides a
statistical method for averaging
temperatures in a multi-mineral
system (assuming they are all in
equilibrium) and clearly indicates
any potential disequilibrium by one
or more mineral.
2) Analyze ‘refractory’ minerals. In the absence of recrystallization, isotopic
exchange occurs by the process of self-diffusion, or intracrystalline diffusion. This is the
process in which oxygen diffuses through a crystal lattice. The oxygen self-diffusion
Fig. 12.13. Typical isotherm plot for coexisting minerals.
All mineral data are plotted relative to quartz (although the
choice of reference mineral is arbitrary and will not change
the result). In the illustrated example, all minerals except
magnetite define an isotherm, and magnetite is clearly out
of equilibrium with the other phases. The slope of the best-
fit line is equal to 106/T2 (T in Kelvin).
Sharp, Z.D. Principles of Stable Isotope Geochemistry
12-23
rates of minerals are highly variable. The diffusion rates of biotite, leucite, and feldspar7
are so rapid that retrograde isotopic exchange is likely to occur during slow cooling.
Other minerals, such as garnet, olivine, zircon, and kyanite, have very slow self-diffusion
rates. For these minerals, the 18O value of the mineral should ‘lock in’ at the time of
crystallization, and not change at all during slow cooling. Bimineralic assemblages
containing at least one refractory phase are excellent targets for extracting peak
metamorphic temperatures from high-grade metamorphic rocks. Refractory minerals,
defined as those that are least likely to exchange once crystallized, have their own set of
problems, however. There are clear examples of refractory minerals forming during the
prograde path of a metamorphic event and not reequilibrating during peak metamorphic
conditions. Larson and Sharp (2003) demonstrated that the coexisting polymorphs
andalusite, sillimanite and kyanite (all Al2SiO5), from a single lithology do not have the
same 18O values. The differences are explained as being the result of different formation
temperatures for each polymorph. The minerals did not reequilibrate with each other at
the temperatures of peak metamorphism. The rocks went through discrete episodes of
metamorphism. The stable isotope data of the aluminum silicates reflect these multiple
events. It is necessary to consider phase equilibria and mineral reaction sequences when
interpreting stable isotope data of refractory phases.
3) Avoid ‘disturbed’ samples. Late fluid infiltration and/or deformation will act to
reset the 18O values of minerals. Fluids may preferentially interact with one mineral
relative to another. It is not uncommon to find 18O values of feldspars that are higher
than quartz, indicating that hydrothermal alteration has raised the 18O value of the
feldspar, but not quartz. By analyzing mineral phases that are sensitive to hydrothermal
exchange (e.g., micas, feldspar, carbonates), a late fluid infiltration event can often be
detected and the 18O value of the infiltrating fluid determined. Deformation and
recrystallization also enhance reequilibration rates. Oxygen isotope disequilibrium is
commonly observed in shear zones, where kinetically controlled reequilibration
overwhelms equilibrium thermodynamic controls (e.g., Crespo-Blanc et al., 1995).
Finally, it is well established that the diffusion rate of oxygen in a mineral is greatly
enhanced when an aqueous fluid is present (Sharp et al., 1991). Anhydrous rocks are
more likely to preserve peak temperatures than hydrous ones.
12.6.3 Applications of stable isotope thermometry
The most successful applications of stable isotope thermometry are generally
made in rocks of amphibolite- and lower- granulite-facies. At lower metamorphic grades
‒ greenschist and sub-greenschist facies ‒ mineral separation becomes difficult due to the
fine grain size, and temperatures may not have been high enough for all mineral phases to
attain isotopic equilibrium8. By the time amphibolite-facies conditions are reached
(~500°C), the rocks generally have coarse-grained minerals which can be easily separated
7 The diffusion rate of oxygen in feldspar is strongly dependent on the presence of absence of an aqueous
fluid – ‘wet’ vs ‘dry’ diffusion. See (Elphick et al., 1988; Sharp, 1991) for more information. 8 In low-grade rocks, a strategy of analyzing less refractory phases may be the most successful approach.
For example, quartz-calcite pairs can provide temperature information of less than 250°C (Kirschner et al.,
1995).
Chapter 12. Metamorphic Petrology
12-24
for isotope analysis. Temperatures are sufficiently high during amphibolite-facies
metamorphism that there is a strong likelihood that isotopic equilibrium was reached
during metamorphism, but not so high that retrograde diffusional effects should be a
serious factor. In very high temperature rocks, retrograde resetting is common, although
there are examples of successful applications to very hot rocks (Fourcade and Javoy,
1973; Sharp et al., 1992; Farquhar et al., 1993).
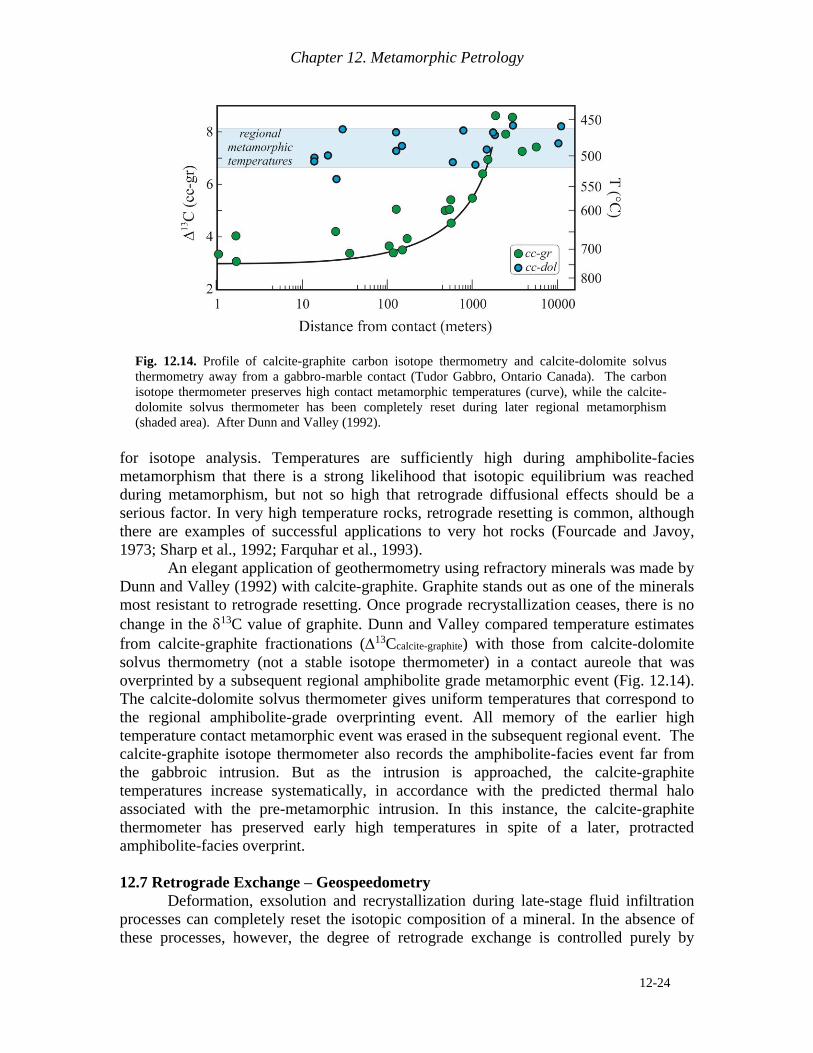
An elegant application of geothermometry using refractory minerals was made by
Dunn and Valley (1992) with calcite-graphite. Graphite stands out as one of the minerals
most resistant to retrograde resetting. Once prograde recrystallization ceases, there is no
change in the 13C value of graphite. Dunn and Valley compared temperature estimates
from calcite-graphite fractionations (13Ccalcite-graphite) with those from calcite-dolomite
solvus thermometry (not a stable isotope thermometer) in a contact aureole that was
overprinted by a subsequent regional amphibolite grade metamorphic event (Fig. 12.14).
The calcite-dolomite solvus thermometer gives uniform temperatures that correspond to
the regional amphibolite-grade overprinting event. All memory of the earlier high
temperature contact metamorphic event was erased in the subsequent regional event. The
calcite-graphite isotope thermometer also records the amphibolite-facies event far from
the gabbroic intrusion. But as the intrusion is approached, the calcite-graphite
temperatures increase systematically, in accordance with the predicted thermal halo
associated with the pre-metamorphic intrusion. In this instance, the calcite-graphite
thermometer has preserved early high temperatures in spite of a later, protracted
amphibolite-facies overprint.
12.7 Retrograde Exchange – Geospeedometry
Deformation, exsolution and recrystallization during late-stage fluid infiltration
processes can completely reset the isotopic composition of a mineral. In the absence of
these processes, however, the degree of retrograde exchange is controlled purely by
Fig. 12.14. Profile of calcite-graphite carbon isotope thermometry and calcite-dolomite solvus
thermometry away from a gabbro-marble contact (Tudor Gabbro, Ontario Canada). The carbon
isotope thermometer preserves high contact metamorphic temperatures (curve), while the calcite-
dolomite solvus thermometer has been completely reset during later regional metamorphism
(shaded area). After Dunn and Valley (1992).
Sharp, Z.D. Principles of Stable Isotope Geochemistry
12-25
intracrystalline diffusion which can be treated quantitatively. Although retrograde
diffusion-based resetting hinders our ability to obtain peak metamorphic temperatures, it
can be used to extract cooling-rate information, the so-called stable isotope
‘geospeedometer’.
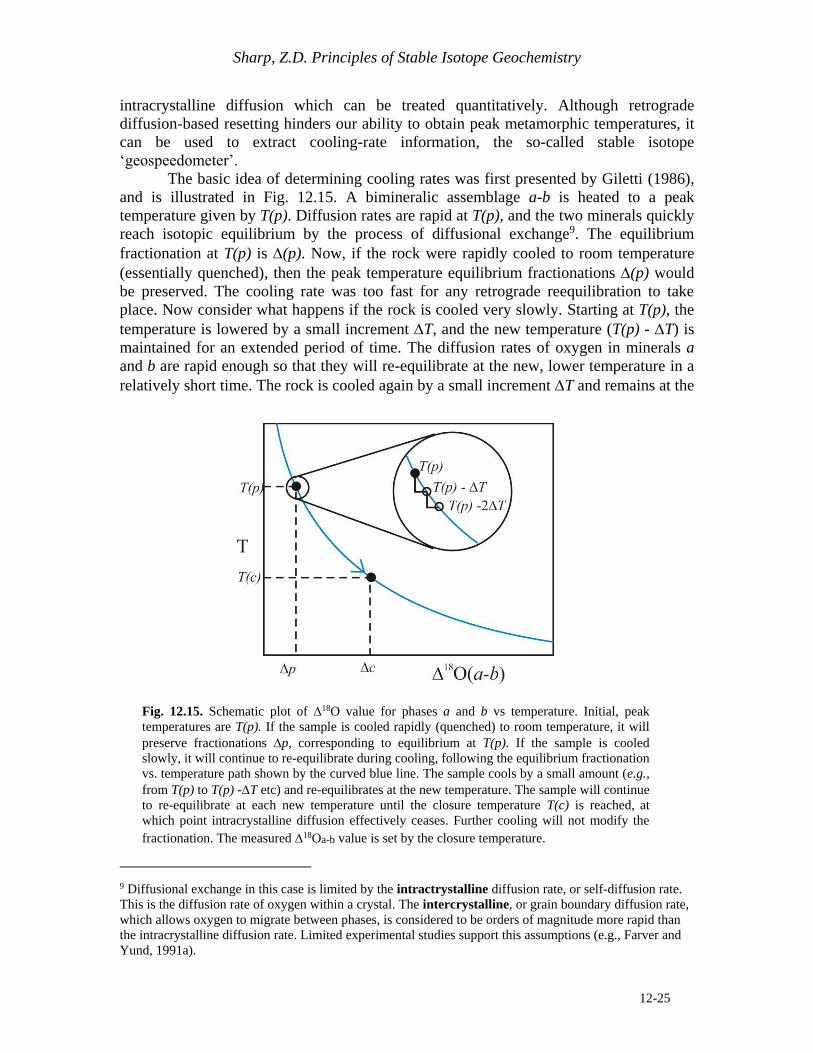
The basic idea of determining cooling rates was first presented by Giletti (1986),
and is illustrated in Fig. 12.15. A bimineralic assemblage a-b is heated to a peak
temperature given by T(p). Diffusion rates are rapid at T(p), and the two minerals quickly
reach isotopic equilibrium by the process of diffusional exchange9. The equilibrium
fractionation at T(p) is (p). Now, if the rock were rapidly cooled to room temperature
(essentially quenched), then the peak temperature equilibrium fractionations (p) would
be preserved. The cooling rate was too fast for any retrograde reequilibration to take
place. Now consider what happens if the rock is cooled very slowly. Starting at T(p), the
temperature is lowered by a small increment T, and the new temperature (T(p) - T) is
maintained for an extended period of time. The diffusion rates of oxygen in minerals a
and b are rapid enough so that they will re-equilibrate at the new, lower temperature in a
relatively short time. The rock is cooled again by a small increment T and remains at the
9 Diffusional exchange in this case is limited by the intractrystalline diffusion rate, or self-diffusion rate.
This is the diffusion rate of oxygen within a crystal. The intercrystalline, or grain boundary diffusion rate,
which allows oxygen to migrate between phases, is considered to be orders of magnitude more rapid than
the intracrystalline diffusion rate. Limited experimental studies support this assumptions (e.g., Farver and
Yund, 1991a).
Fig. 12.15. Schematic plot of 18O value for phases a and b vs temperature. Initial, peak
temperatures are T(p). If the sample is cooled rapidly (quenched) to room temperature, it will
preserve fractionations p, corresponding to equilibrium at T(p). If the sample is cooled
slowly, it will continue to re-equilibrate during cooling, following the equilibrium fractionation
vs. temperature path shown by the curved blue line. The sample cools by a small amount (e.g.,
from T(p) to T(p) -T etc) and re-equilibrates at the new temperature. The sample will continue
to re-equilibrate at each new temperature until the closure temperature T(c) is reached, at
which point intracrystalline diffusion effectively ceases. Further cooling will not modify the
fractionation. The measured 18Oa-b value is set by the closure temperature.
Chapter 12. Metamorphic Petrology
12-26
new temperature until isotopic equilibrium is again attained. It is clear that by cooling a
rock slowly, the (a-b) value will track along the equilibrium curve, shown by the arrow
in Fig. 12.15. At some point, however, temperatures drop low enough so that the
diffusion rates become too slow for any further exchange to occur. The temperature
interval over which we move from a situation where there is complete exchange during
cooling to one where there is effectively no exchange is narrow. This is because the
diffusion rate exponentially increases with increasing temperature. The narrow
temperature interval over which the assemblage goes from complete isotopic equilibrium
(rapid diffusion rates), to one where the diffusion rate effectively stops, is defined as the
closure temperature T(c) (Dodson, 1973). Further cooling does not change the 18O
values of either phase. The fractionation that is measured in the laboratory is (c), given
by the closure temperature of the system. It is unrelated to the peak temperature T(p), but
is related to the cooling rate. In both of the cooling scenarios considered above, the
mineralogy and peak temperature and final temperature (room temperature) are the same.
The only difference is in the rate of cooling, and the different measured fractionations are
related only to differences in cooling rates. If we could quantify this effect, then we
would have a geospeedometer, a tool to calculate how fast a rock cooled.
In a simple bimineralic assemblage, the closure temperature (Tc) is determined by
the mineral with the slower diffusion rate. This may seem counterintuitive but is easily
explained. During cooling, the Tc of the more refractory mineral is reached. Diffusion
stops for that mineral, and its isotopic composition does not change with further cooling.
The diffusion rate of oxygen in the second phase may still be rapid, but because there is
nothing for it to exchange with, its isotopic composition is also fixed.
The closure temperature of a mineral is a function of the following parameters: 1)
Geological Society of America, New York, pp. 217-233.
Jamtveit, B., Bucher, N.K. and Stijfhoorn-Derk, E. (1992) Contact metamorphism of
layered shale-carbonate sequences in the Oslo Rift; I, Buffering, infiltration, and the
mechanisms of mass transport. Journal of Petrology 33, 377-422.
Javoy, M., Fourcade, S. and Allegre, C.J. (1970) Graphical method for examination of 18O/16O fractionations in silicate rocks. Earth and Planetary Science Letters 10, 12-
Sharp, Z.D. Principles of Stable Isotope Geochemistry
12-33
16.
Jenkin, G.R.T., Fallick, A.E. and Leake, B.E. (1992) A stable isotope study of retrograde
alteration in SW Connemara, Ireland. Contributions to Mineralogy and Petrology
110, 269-288.
Jenkin, G.R.T., Craw, D. and Fallick, A.E. (1994a) Stable isotopic and fluid inclusion
evidence for meteoric fluid penetration into an active mountain belt; Alpine Schist,
New Zealand. Journal of Metamorphic Geology 12, 429-444.
Jenkin, G.R.T., Farrow, C.M., Fallick, A.E. and Higgins, D. (1994b) Oxygen isotope
exchange and closure temperatures in cooling rocks. Journal of Metamorphic
Geology 12, 221-235.
Kerrich, R. (1986) Fluid transport in lineaments. Philosophical Transactions of the Royal
Society of London, Series A 317, 219-251.
Kirschner, D.L., Sharp, Z.D. and Teyssier, C. (1993) Vein growth mechanisms and fluid
sources revealed by oxygen isotope laser microprobe. Geology 21, 85-88.
Kirschner, D.L., Sharp, Z.D. and Masson, H. (1995) Oxygen isotope thermometry of
quartz-calcite veins: Unraveling the thermal-tectonic history of the subgreenschist
facies Morcles nappe (Swiss Alps). Geological Society of America Bulletin 107,
1145-1156.
Kohn, M.J., Valley, J.W., Elsenheimer, D. and Spicuzza, M.J. (1993) O isotope zoning in
garnet and staurolite: Evidence for closed-system mineral growth during regional
metamorphsim. American Mineralogist 78, 988-1001.
Kohn, M.J. (1999) Why most "dry" rocks should cool "wet". American Mineralogist 84,
570-580.
Kreulen, R. (1980) CO2-rich fluids during regional metamorphism on Naxon (Greece):
carbon isotopes and fluid inclusions. American Journal of Science 280, 745-771.
Larson, T. and Sharp, Z.D. (2003) Stable isotope constraints on the Al2SiO5 ‘triple-point’
rocks from the Proterozoic Priest pluton contact aureole, New Mexico. Journal of
Metamorphic Geology 21, 785-798.
Lichtner, P.C. (1985) Continuum model for simultaneous chemical reactions and mass
transport in hydrothermal systems. Geochimica et Cosmochimica Acta 49, 779-800.
McCaig, A.M., Wickham, S.M. and Taylor, H.P., Jr. (1990) Deep fluid circulation in
Alpine shear zones, Pyrenees, France: field and oxygen isotope studies. Contributions
to Mineralogy and Petrology 106, 41-60.
Moecher, D.P., Valley, J.W. and Essene, E.J. (1994) Extraction and carbon isotope
analysis of CO2 from scapolite in deep crustal granulites and xenoliths. Geochimica et
Cosmochimica Acta 58, 959-967.
Monster, J., Appel, P.W.U., Thode, H.G., Schidlowski, M., Carmichael, C.M. and
Bridgwater, D. (1979) Sulfur isotope studies in early Archaean sediments from Isua,
West Greenland; implications for the antiquity of bacterial sulfate reduction.
Geochimica et Cosmochimica Acta. 43, 405-413.
Mora, C.I. and Valley, J.W. (1991) Prograde and retrograde fluid-rock interaction in calc-
silicates northwest of the Idaho Batholith; stable isotopic evidence. Contributions to
Mineralogy and Petrology 108, 162-174.
Morrison, J. and Anderson, J.L. (1998) Footwall refrigeration along a detachment fault;
implications for the thermal evolution of core complexes. Science 279, 63-66.
Applications of microananalytical techniques to understanding mineralizing
Chapter 12. Metamorphic Petrology
12-36
processes. Bookcrafters, Inc., Chelsea, pp. 73-98.
Valley, J.W. (2001) Stable isotope thermometry at high temperatures, in: Valley, J.W.,
Cole, D.R. (Eds.), Stable Isotope Geochemistry. Mineralogical Society of America,
Washington, D.C., pp. 365-413.
Vennemann, T.W., Kesler, S.E. and O, N., J.R. (1992) Stable isotope compositions of
quartz pebbles and their fluid inclusions as tracers of sediment provenance;
implications for gold- and uranium-bearing quartz pebble conglomerates. Geology 20,
837-840.
Vry, J.K., Brown, P.E., Valley, J.W. and Morrison, J. (1988) Constraints on granulite
genesis from carbon isotopic compositions of cordierite and graphite. Nature 332, 66-
68.
Vyhnal, C.R. and Chamberlain, C.P. (1996) Preservation of early isotopic signatures
during prograde metamorphism, eastern Vermont. American Journal of Science 296,
394-419.
Wickham, S.M. and Taylor, H.P., Jr. (1985) Stable isotopic evidence for large-scale
seawater infiltration in a regional metamorphic terrane; the Trois Seigneurs Massif,
Pyrenees, France. Contributions to Mineralogy and Petrology 91, 122-137.
Young, E.D. (1993) On the 18O/16O record of reaction progress in open and closed
metamorphic systems. Earth and Planetary Science Letters 117, 147-167.
Young, E.D. and Rumble, D., III (1993) The origin of correlated variations in in-situ 18O/16O and elemental concentrations in metamorphic garnet from southeastern
Vermont, USA. Geochimica et Cosmochimica Acta 57, 2585-2597.
Yui, T.-F., Rumble III, D. and Lo, C.-H. (1995) Unusually low 18O ultra-high-pressure
metamorphic rocks from the Sulu Terrain, eastern China. Geochimica et