39
Chapter 15 Managing Working Capital © 2003 John Wiley and Sons
| Date post: | 28-Dec-2015 |
| Category: |
Documents |
| Upload: | julie-webb |
| View: | 233 times |
| Download: | 1 times |
Chapter 15
Managing Working Capital
© 2003 John Wiley and Sons
2
Chapter Outcomes Explain what is meant by a firm’s operating cycle and its cash conversion cycle. Describe the impact of the operating cycle on the size of investment in accounts receivable and inventories. Explain how seasonal and cyclical trends affect the operating cycle, cash conversion cycle, and investments in current assets.
3
Chapter Outcomes
Explain how a cash budget is developed and how a treasurer will use it.Describe the motives underlying the management of cash and marketable securitiesBriefly explain what is involved in accounts receivable management and indicate how it is carried out.Describe inventory management from the standpoint of the financial manager.
4
Importance of Working Capital Issues
Current assets typically comprise 30-50% of a firm’s assets
Main day-to-day focus of financial managers
Mismatch between current assets and financingcash crunch, bankruptcy possibilities

5
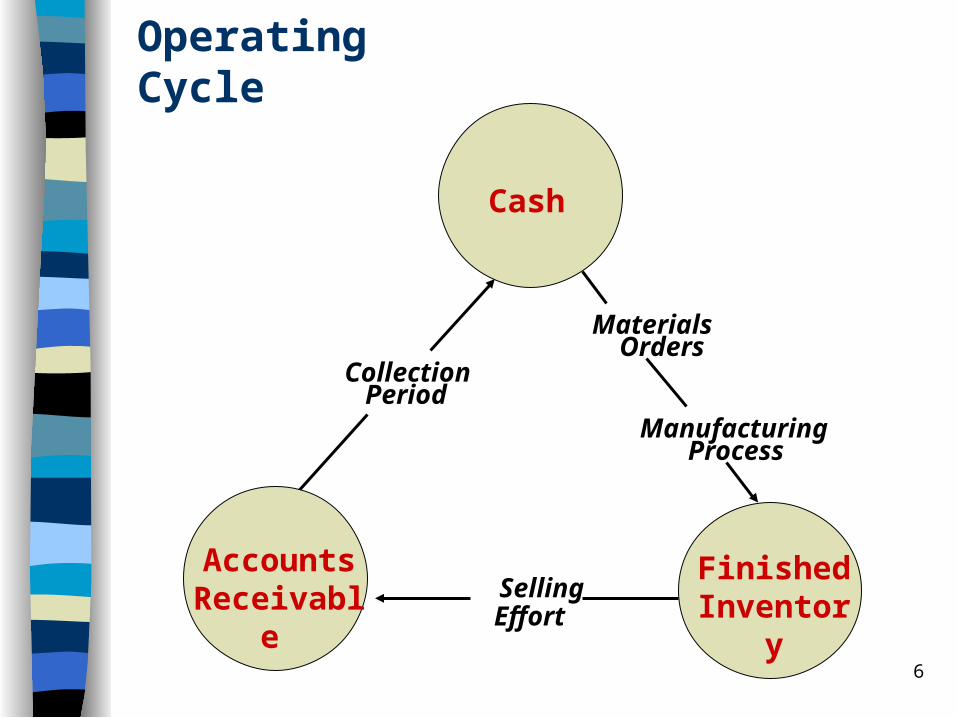
Operating Cycle
Operating cycle: time between ordering materials from suppliers and collecting cash following their sale as finished products
= inventory conversion period + average collection period
= 365 / inventory turnover +
AR / (sales/365)
6
Operating Cycle
Collection Period
Materials Orders
Manufacturing Process
Selling Effort
Cash
Finished Inventory
Accounts Receivable

7
Cash Conversion Cycle
Cash conversion cycle: time between paying cash to suppliers for material and collecting cash from customers from their subsequent sale
=Operating cycle - Avg payment period
where Avg payment period
= Accounts Payable/(COGS/365)
8
Cash Conversion Cycle, continued
The cash conversion cycle measures the financing gap in terms of time
As the cash conversion cycle increases, the firm’s financing needs grow larger
9
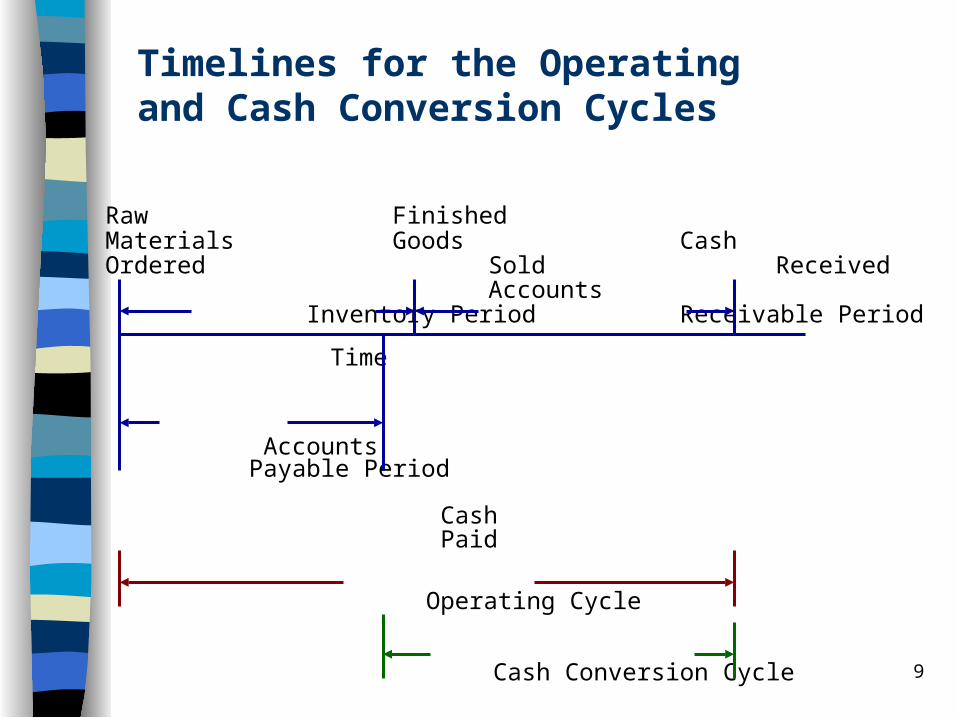
Timelines for the Operating and Cash Conversion Cycles
Raw FinishedMaterials Goods CashOrdered Sold Received
Accounts Inventory Period Receivable Period
Time
Accounts Payable Period
Cash Paid
Operating Cycle
Cash Conversion Cycle
10
Working Capital Needs
Working capital requirements are affected if sales change or if the cash conversion cycle components change
11
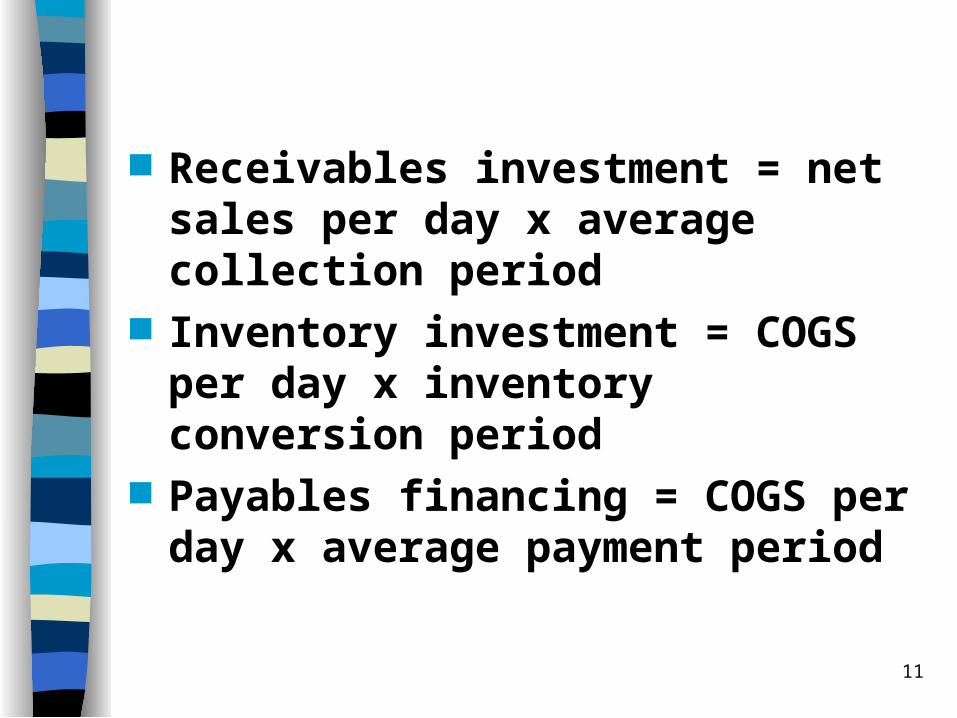
Receivables investment = net sales per day x average collection period
Inventory investment = COGS per day x inventory conversion period
Payables financing = COGS per day x average payment period
12
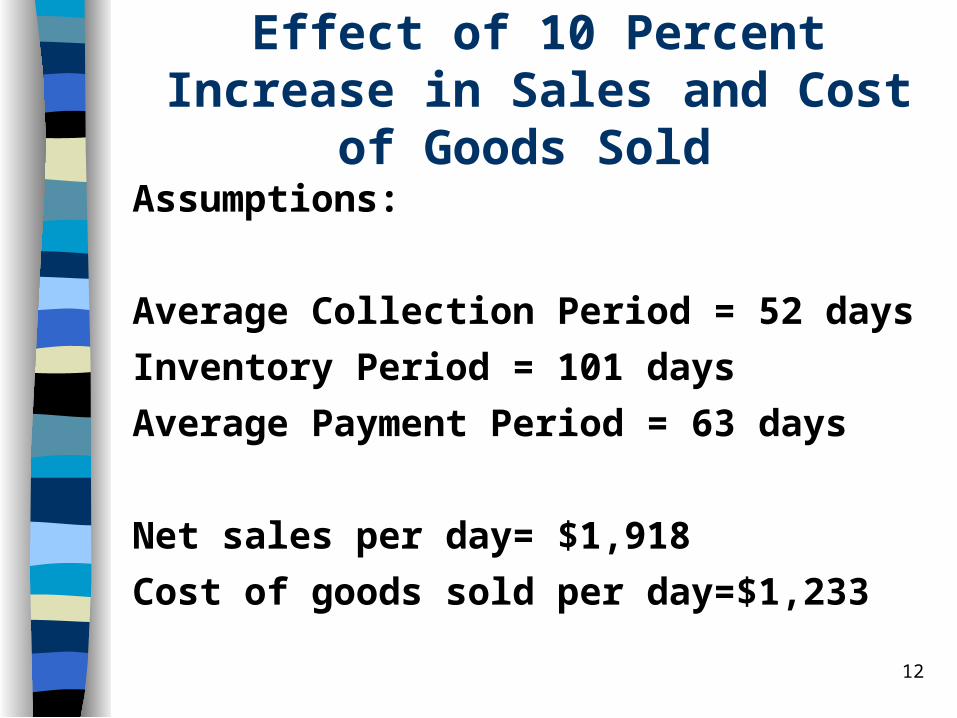
Effect of 10 Percent Increase in Sales and Cost of Goods Sold
Assumptions:
Average Collection Period = 52 days
Inventory Period = 101 days
Average Payment Period = 63 days
Net sales per day= $1,918
Cost of goods sold per day=$1,233
13
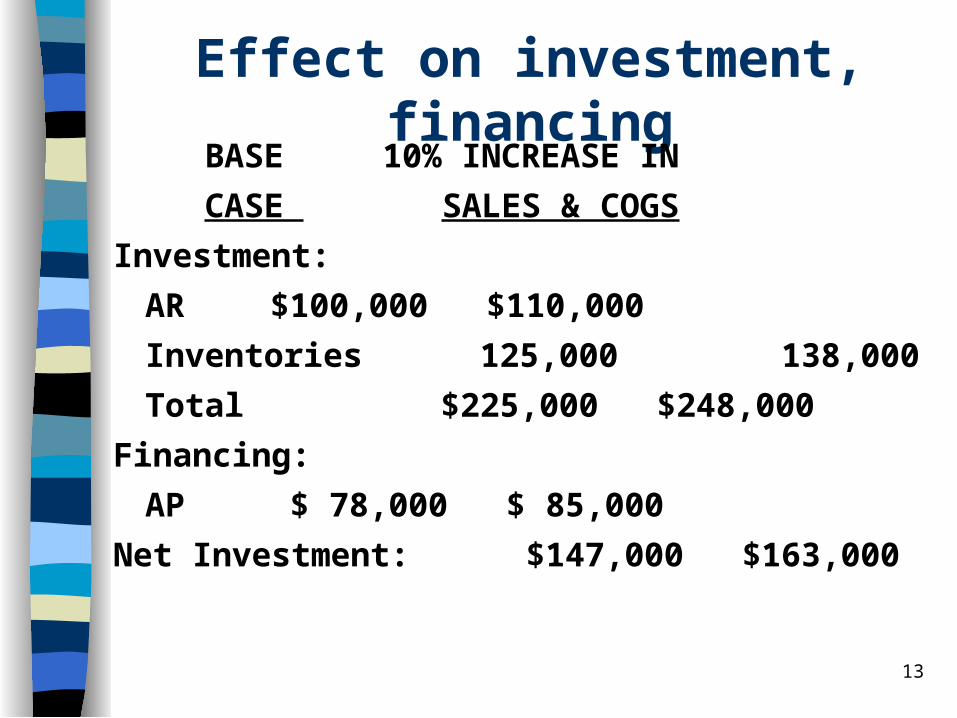
Effect on investment, financing BASE 10% INCREASE IN
CASE SALES & COGS
Investment:
AR $100,000 $110,000
Inventories 125,000 138,000
Total $225,000 $248,000
Financing:
AP $ 78,000 $ 85,000
Net Investment: $147,000 $163,000
14
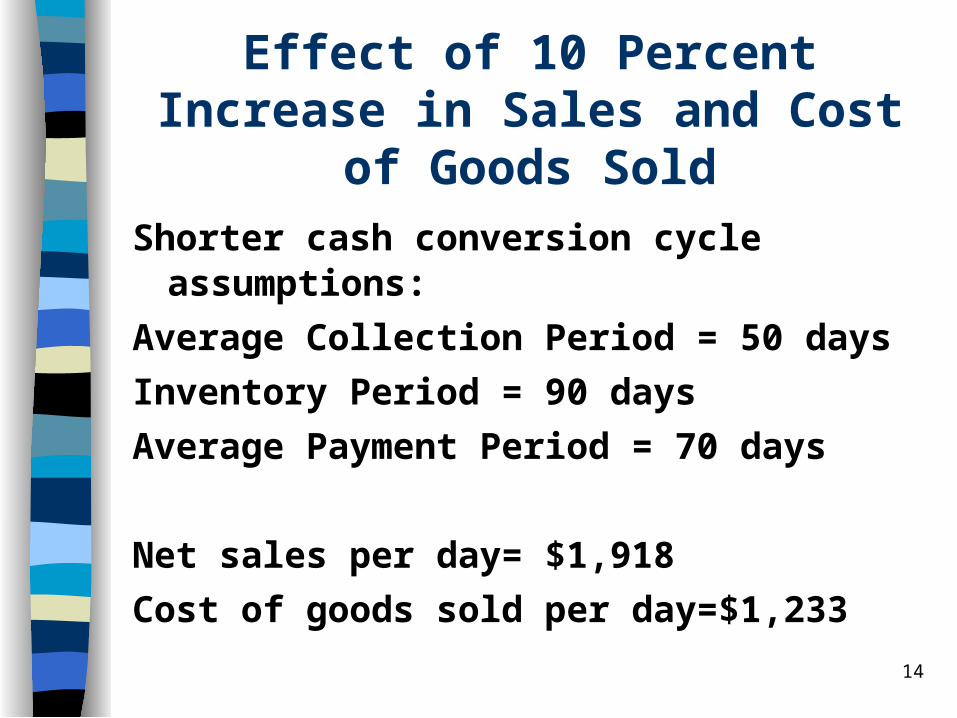
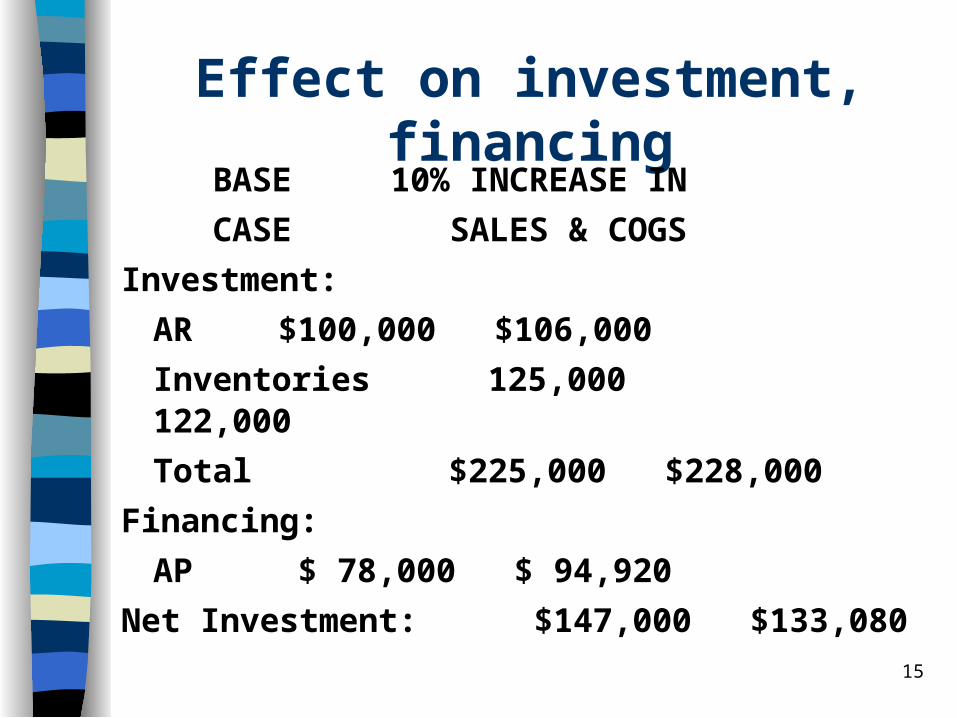
Effect of 10 Percent Increase in Sales and Cost of Goods Sold
Shorter cash conversion cycle assumptions:
Average Collection Period = 50 days
Inventory Period = 90 days
Average Payment Period = 70 days
Net sales per day= $1,918
Cost of goods sold per day=$1,233
15
Effect on investment, financing BASE 10% INCREASE IN
CASE SALES & COGS
Investment:
AR $100,000 $106,000
Inventories 125,000 122,000
Total $225,000 $228,000
Financing:
AP $ 78,000 $ 94,920
Net Investment: $147,000 $133,080
16
Cash Budget
Short-term forecast of cash inflows and outflows
Daily, weekly, monthly, quarterly Helpful in estimating short-term
borrowing needs, lender repayments
17
Cash Budget Inputs
Minimum desired cash balance Cash inflows
– sales forecast– customer payment patterns
Cash outflows– fixed outflows (interest, rent, lease)– supplier payments – effect of seasonal vs. level production
18
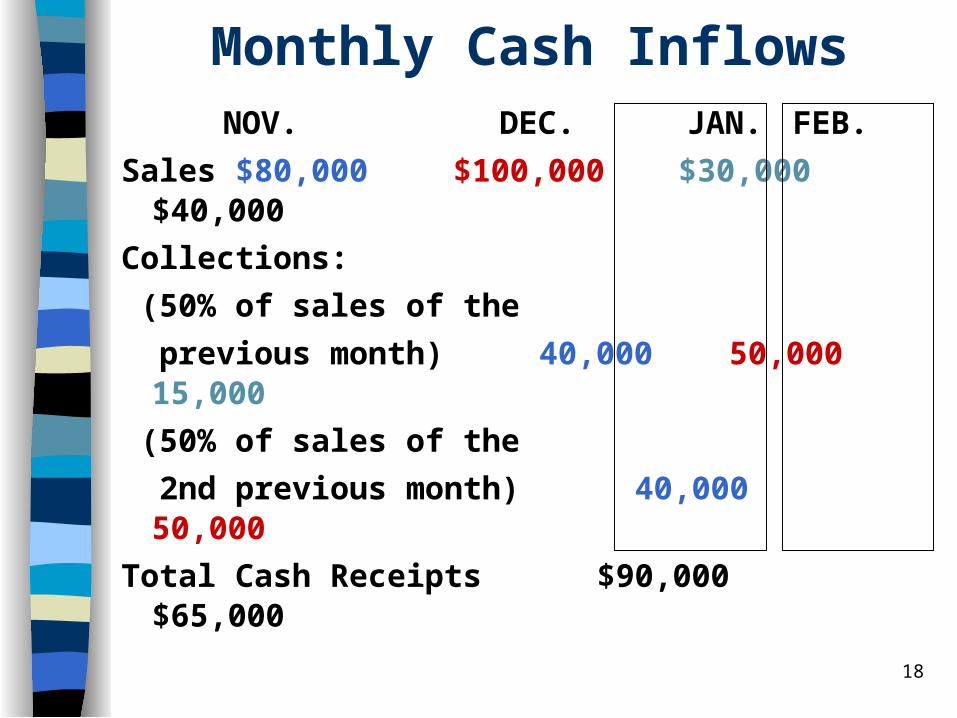
Monthly Cash InflowsNOV. DEC. JAN. FEB.
Sales $80,000 $100,000 $30,000 $40,000
Collections:
(50% of sales of the
previous month) 40,000 50,000 15,000
(50% of sales of the
2nd previous month) 40,000 50,000
Total Cash Receipts $90,000 $65,000
19
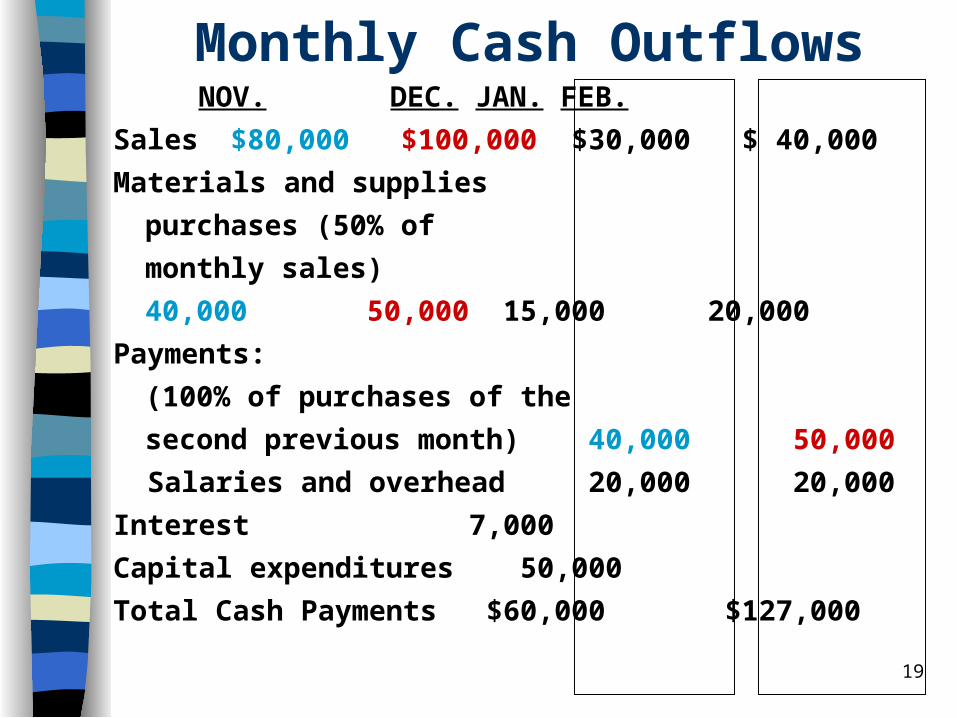
Monthly Cash OutflowsNOV. DEC. JAN. FEB.
Sales $80,000 $100,000 $30,000 $ 40,000
Materials and supplies
purchases (50% of
monthly sales)
40,000 50,000 15,000 20,000
Payments:
(100% of purchases of the
second previous month) 40,000 50,000
Salaries and overhead 20,000 20,000
Interest 7,000
Capital expenditures 50,000
Total Cash Payments $60,000 $127,000
20
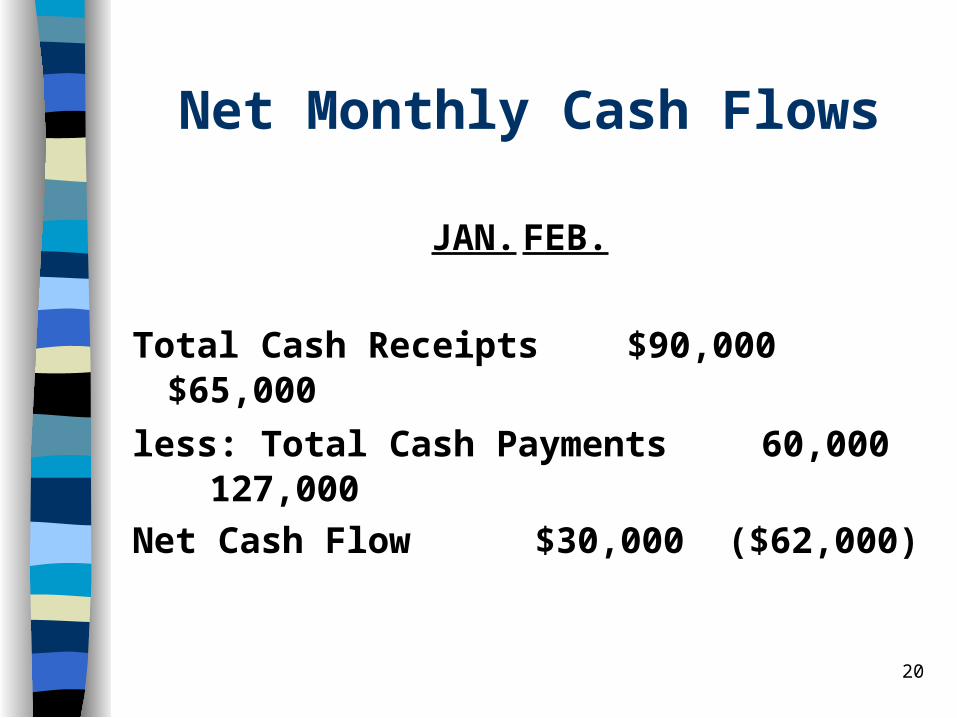
Net Monthly Cash Flows
JAN.FEB.
Total Cash Receipts $90,000 $65,000
less: Total Cash Payments 60,000 127,000
Net Cash Flow $30,000 ($62,000)
21
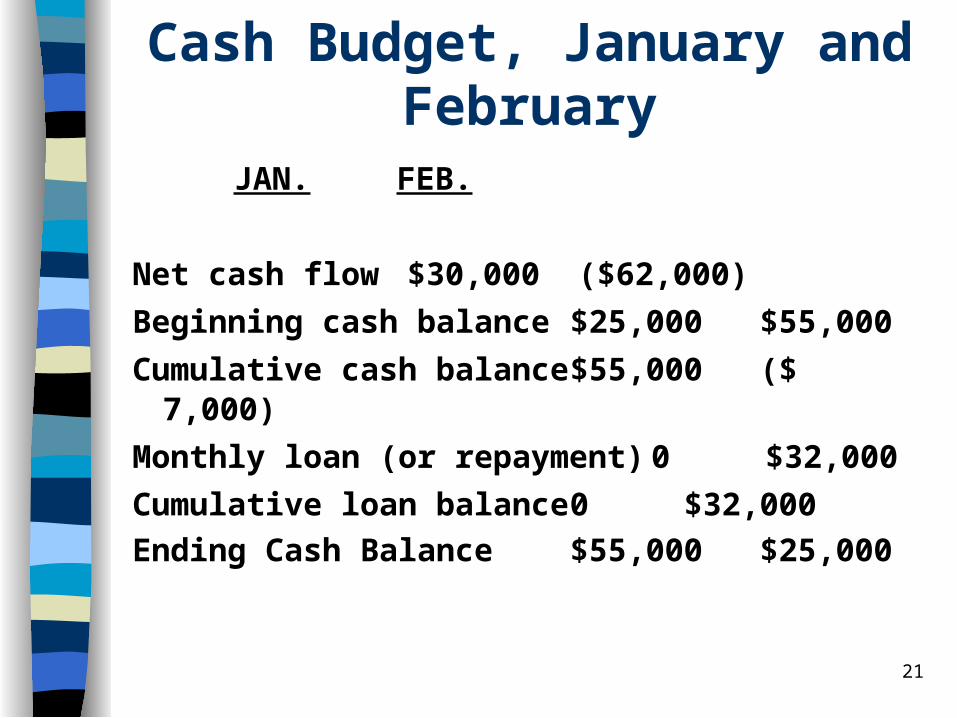
Cash Budget, January and February
JAN.FEB.
Net cash flow $30,000 ($62,000)
Beginning cash balance $25,000 $55,000
Cumulative cash balance $55,000 ($ 7,000)
Monthly loan (or repayment) 0 $32,000
Cumulative loan balance 0 $32,000
Ending Cash Balance $55,000 $25,000
22
Seasonal vs. Level Production Issues for Firms with Seasonal Sales
Seasonal Production:– Raw materials purchased shortly
before sales occur– Lower inventories– Idle plant, laid-off workers in slow
season– Production bottlenecks in busy
season
23
Level Production Issues
Produce equal amounts each month to meet annual sales forecast
Inventory build up prior to selling season
Cash outflows during year with little cash inflow
24
Management of Current Assets
Cash and Marketable Securities Accounts Receivable Management Inventory Management

25
Cash and Marketable Securities
Why should a business hold cash and marketable securities?
Transactions motive Precautionary motive Speculative motive

26
Desirable Characteristics of Marketable Securities
Highly liquid Short-term maturity High quality issuer

27
Types of Marketable Securities
U.S. Treasury bills Commercial paper Negotiable Certificates of Deposit Bankers’ Acceptances Eurodollars
28
Getting and Keeping the Cash
Goal: shorten cash conversion cycle by speeding up receipts, slowing disbursements
Float: delay between when funds are sent by a payer to the payee
– Collection float
– Disbursement
29
Reduce Collection Float
Lockbox system Pre-authorized checks
30
Increase Disbursement Float
Zero Balance Account
Will float eventually disappear?
– Electronic payment systems
31
Accounts Receivable Management
Credit Analysis Setting Credit Terms Collection Efforts
32
Credit Analysis
5 C’s– Character– Capacity– Capital– Collateral– Conditions
Credit bureaus Credit scoring
33
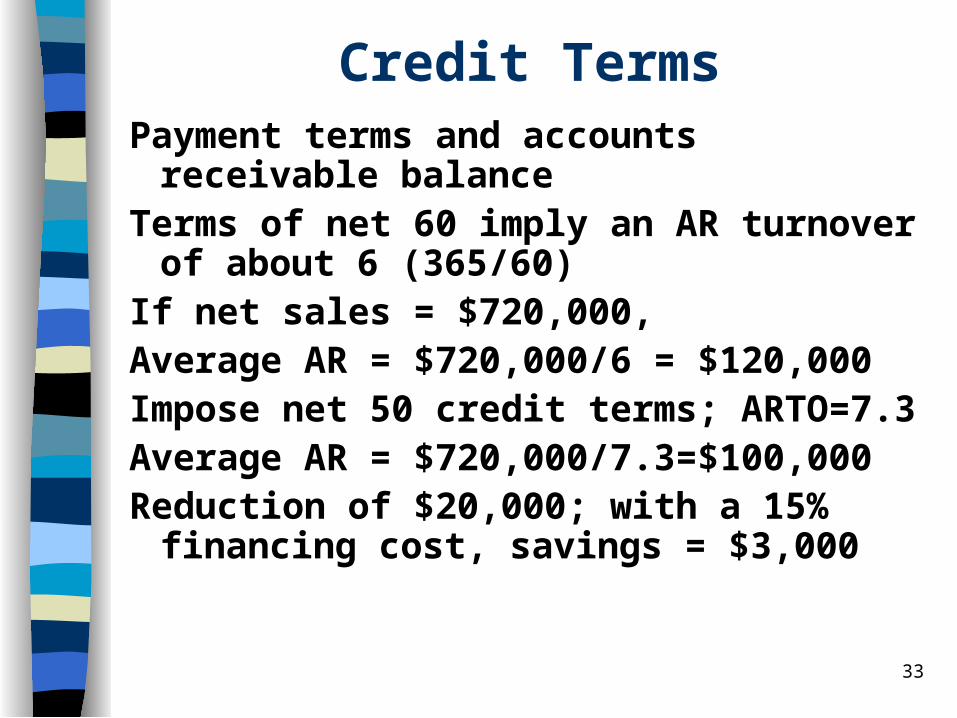
Credit TermsPayment terms and accounts
receivable balanceTerms of net 60 imply an AR turnover
of about 6 (365/60)If net sales = $720,000, Average AR = $720,000/6 = $120,000Impose net 50 credit terms; ARTO=7.3Average AR = $720,000/7.3=$100,000Reduction of $20,000; with a 15%
financing cost, savings = $3,000
34
Collection
Changing exchange rates in global business
Selling firm can
– Require payment in the selling firm’s home currency
– Use futures or options contracts to reduce risk if customer pays in their own currency
35
Collection Effort
Cost of process Customer alienation versus benefits
36
Changes in Credit Policy
Compare marginal benefits and marginal costs of changing credit policy, terms
Benefits: change in net sales, profits Costs: changes in working capital
accounts need to be financed Consider changing policy if marginal
benefits exceed marginal costs
37
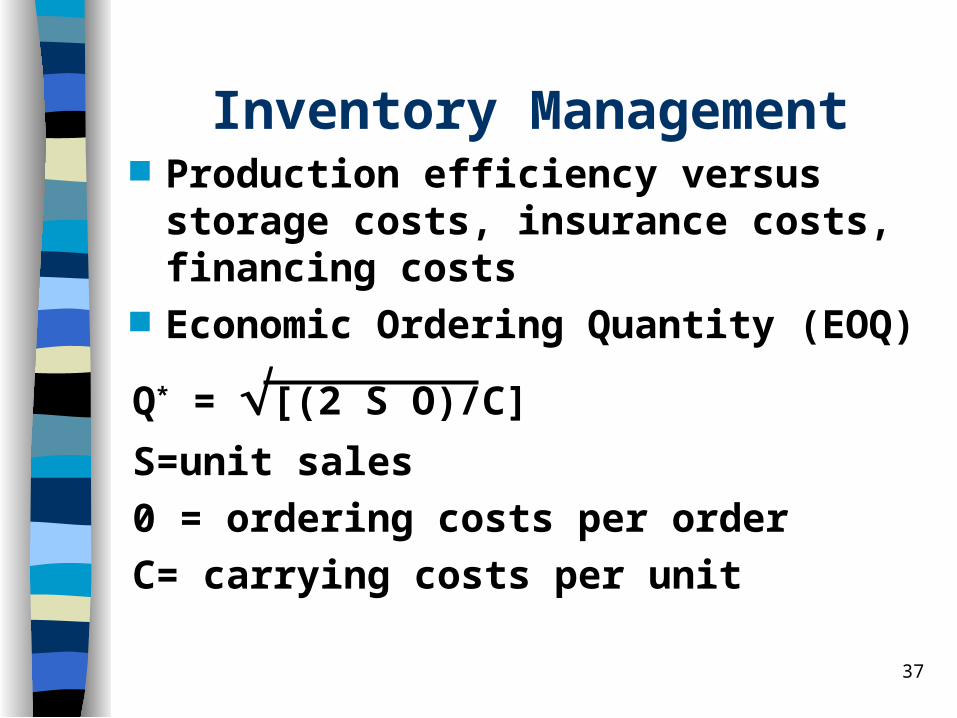
Inventory Management Production efficiency versus storage
costs, insurance costs, financing costs
Economic Ordering Quantity (EOQ)
Q* = [(2 S O)/C]
S=unit sales
0 = ordering costs per order
C= carrying costs per unit
38
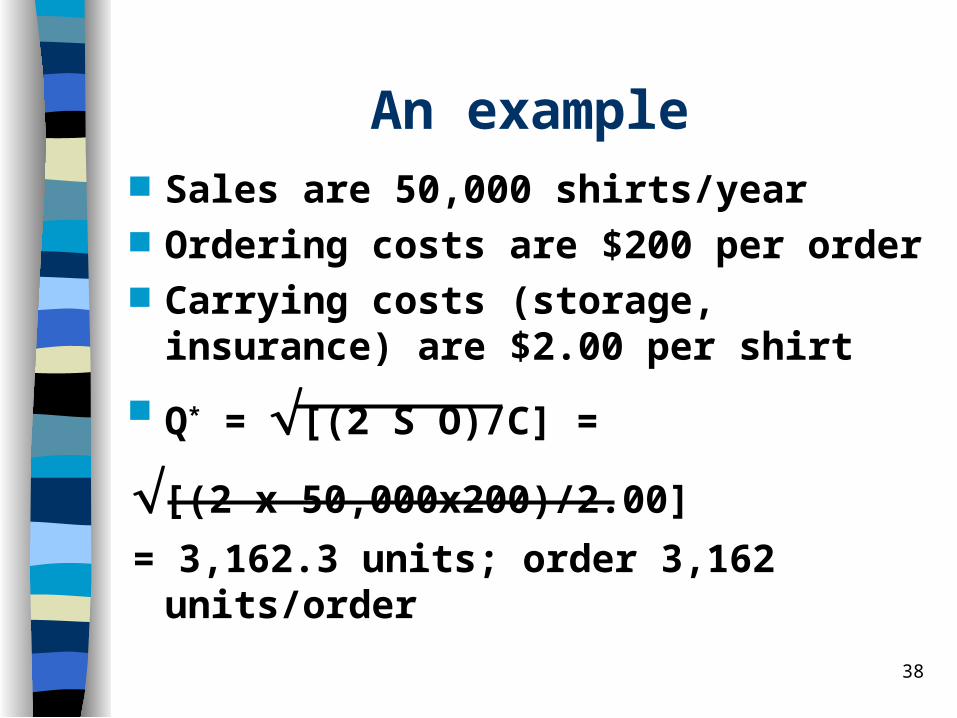
An example Sales are 50,000 shirts/year Ordering costs are $200 per order Carrying costs (storage, insurance)
are $2.00 per shirt
Q* = [(2 S O)/C] =
[(2 x 50,000x200)/2.00]
= 3,162.3 units; order 3,162 units/order
39
Modern Working Capital Management
JIT: Just-in-time JIT II B2B portals XML Firms have an incentive to reduce
working capital to free up cash and reduce financing costs.


