Chapter 16 COMPUTER MODELLING AND SIMULATION OF ANNEALING 16.1 INTRODUCTION In order to control the microstructure, texture and properties of an alloy during a complex industrial thermomechanical treatment, there is a need for quantitative models which will accurately predict the effect of the processing parameters on the material which is produced. The empirical approach, which has long been used, is now recognised as being of limited value and, in many cases, the cost of industrial scale parametric experimental investigations is prohibitively expensive. Many major metal- producing companies, particularly in the aluminium and steel industries, have now recognised that in order to have any predictive value, models are needed which are based on sound physical concepts (Melton 1999, Ricks 1999). Because of the com- plexity of industrial thermomechanical processing schedules and our lack of a sound understanding of many of the annealing phenomena, this remains a long term objective. 16.1.1 The role of computer simulation In discussing recovery, recrystallization and grain growth in earlier chapters, we have tried to show wherever possible, how an understanding of the physical mechanisms can lead to the development of quantitative models of the process. The ideal model would be 507
Transcript
Chapter 16
COMPUTER MODELLINGAND SIMULATIONOF ANNEALING
16.1 INTRODUCTION
In order to control the microstructure, texture and properties of an alloy during acomplex industrial thermomechanical treatment, there is a need for quantitative modelswhich will accurately predict the effect of the processing parameters on the materialwhich is produced. The empirical approach, which has long been used, is nowrecognised as being of limited value and, in many cases, the cost of industrial scaleparametric experimental investigations is prohibitively expensive. Many major metal-producing companies, particularly in the aluminium and steel industries, have nowrecognised that in order to have any predictive value, models are needed which arebased on sound physical concepts (Melton 1999, Ricks 1999). Because of the com-plexity of industrial thermomechanical processing schedules and our lack of a soundunderstanding of many of the annealing phenomena, this remains a long term objective.
16.1.1 The role of computer simulation
In discussing recovery, recrystallization and grain growth in earlier chapters, we havetried to show wherever possible, how an understanding of the physical mechanisms canlead to the development of quantitative models of the process. The ideal model would be
507
analytical and based on sound physical principles which perfectly describe the annealingprocess, thus allowing prediction of the resultant microstructure, texture and kinetics.It is clear that because of the complexity of the processes involved, we are still far fromthis goal and in part this is due to the heterogeneous nature of many annealingprocesses. Whereas it is feasible to describe simple processes such as the annealing of adislocation dipole with some accuracy by analytical means, the nucleation of primaryrecrystallization or the onset of abnormal grain growth are catastrophic events whichdepend not upon the average microstructure, but upon heterogeneities in themicrostructure. Analytical methods such as the JMAK approach and its extensionsdiscussed in chapter 7 or the cellular stability model of chapter 10 are useful in giving abroad description of a process, but cannot yet handle the spatial complexities ofrecrystallization in real materials. For these reasons, much effort has in recent yearsbeen put into the development of computer simulations of annealing. There have beenseveral methods of approach, each with its own particular advantages anddisadvantages. Some of the models involve simulation at or close to the atomisticlevel and once the rules for the motion of the basic units are defined then little furtherinput is necessary. Other computer models use analytical equations to describe parts ofthe annealing process and allow the computer to deal with the heterogeneity of theannealing.
16.1.2 The status of computer simulation
Computer simulations have been criticised as being incapable of making any significantpredictions, and it is of course true that they will not reveal any micromechanisms whichoccur on a smaller scale than the basic units of the model. However, by dealing with theannealing of a complete microstructure and thus taking into account long rangecooperative effects and those due to heterogeneity, the models are capable of revealinghitherto unknown phenomena. Bate (2001a) provides a concise critical review of thecurrent status of the modelling of deformation and annealing. Whilst most of themodels produce realistic microstructures or textures, the use of these models is atpresent limited by several factors.
� The size of the model, although this becomes less of a problem as computing powerincreases.
� The lack of accurate input data, e.g. deformation structures, boundary properties.� Inadequate understanding or modelling of the basic physical processes. For
example, most ‘recrystallization’ models are essentially growth models, with nodetailed or physically-based modelling of nucleation.
Unlike an analytical solution, it is usually impossible for the reader to verify a computersimulation, and there is always a real danger that the output of a model may be theresult of faulty, inaccurate or inadequately detailed modelling. A large number ofmodels are regularly presented in the literature as being successful. However, sensitivityanalyses of these models are rarely given, nor are the models tested with a range ofparameters against good experimental data. For these reasons the results of computersimulation should be treated with great caution. This is illustrated by the problemsencountered in using 2-D models to simulate the grain growth of 3-D microstructures asdiscussed in §11.2.4.2 and §11.5.2.3.
508 Recrystallization
One of the most useful roles of computer simulations is to draw attention to areas wherefurther theoretical or experimental work is needed. A good example of this is thecomputer simulation of grain growth, which has in the past 20 years, by producingresults which have questioned the accepted understanding of the subject, stimulated alarge amount of theoretical and experimental work, thus rejuvenating an important fieldwhich had become dormant. As our understanding of the physical phenomena involvedin annealing increases, modelling techniques become more sophisticated, and as thepower of computers grows, the role of modelling and computer simulation will becomeincreasingly dominant.
The modelling which has been carried out to date may be divided into two generalcategories. There are the micro models which aim to deal with individual processes suchas deformation or annealing, or perhaps only part of these, i.e. recovery, recrystalliza-tion or grain growth. Then there are the coupled models which may involve two models,e.g. combining a deformation and an annealing model, or may use many models in anattempt to simulate a large scale industrial process such as multi-pass hot rolling. In thischapter we will examine some of the micro models of annealing, with particularemphasis on topological models which can explicitly deal with spatial inhomogeneity.Other micro models which use parameters averaged over a larger length scale or usestatistical descriptions of microstructure have been discussed elsewhere in the book, e.g.chapter 10. We will not consider computer simulations of plastic deformation here, andwill only briefly comment on the use of coupled models.
16.2 MICRO MODELS
16.2.1 Monte Carlo simulations
In a series of papers, Anderson and colleagues (e.g. Anderson et al. 1984, Anderson1986) developed Monte Carlo methods for the simulation of grain growth in two andthree dimensions. More recently, the same approach has been used to study primaryrecrystallization, abnormal grain growth, dynamic recrystallization and dynamic graingrowth.
16.2.1.1 The method and its application to grain growth
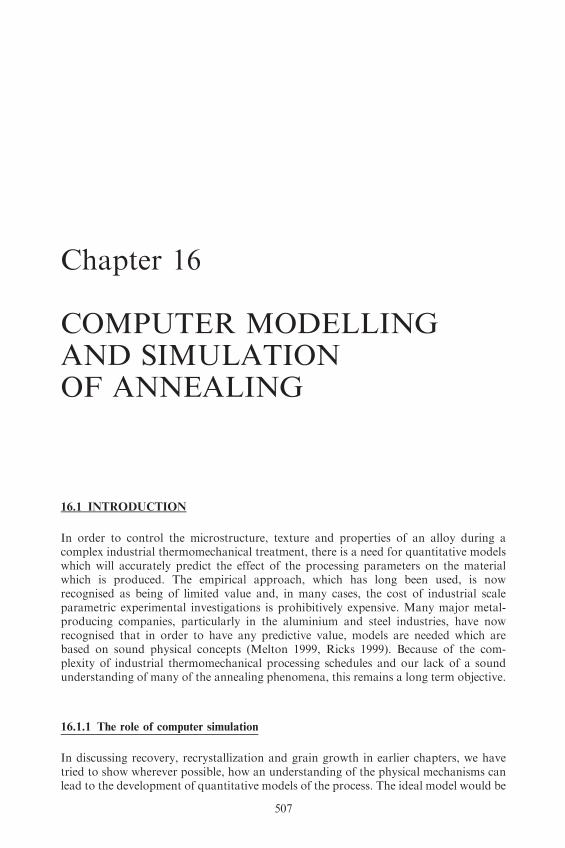
In this method, known as the Potts, or large-Q Potts model, the material is divided intoa number of discrete points which represent the centres of small areas or volumes ofmaterial and these points are arranged on a regular lattice. These are the fundamentalbuilding blocks of the model. They are regions within which the microstructure isassumed to be homogeneous and structureless. Each block may have an attribute suchas an orientation, but no subsidiary microstructure. Each region is given a numbercorresponding to a grain orientation as shown in figure 16.1, and a grain may compriseone or more blocks. A grain boundary is therefore characterised by the relative numbers(orientation) of the blocks, leading to boundaries of the type 4/6 and 3/7 etc. The grainboundary energy may then be specified in terms of the number pairs. For example, inthe simplest case we might take like number pairs (e.g. 3/3) to have a zero energy and allunlike pairs to have the same high energy, which would be a reasonable approximationfor high angle grain boundaries. Although, in a 2-D simulation, the boundary energy is
Computer Modelling and Simulation of Annealing 509
satisfactorily simulated by the interaction between nearest neighbour pairs, in 3-Dsimulations it has been found necessary to consider interactions of up to third nearestneighbours.
The model is run by selecting a block at random, and reorienting it to one of theadjacent grain orientations. The energy of the new state is then determined. If the energychange (�E) is less than or equal to zero then the transition is accepted. However, if �Eis greater than zero, then the reorientation is accepted with a probability which istypically exp(��E/kT), but other methods have been used, e.g. Raabe (2000). The unitof time in the simulation is the Monte Carlo Step which represents N attemptedtransitions, where N is the number of blocks or lattice sites in the model.
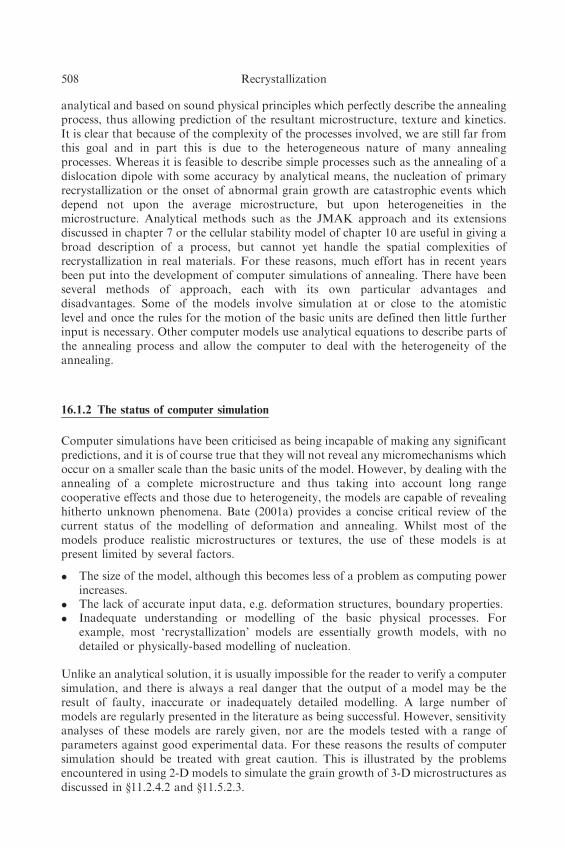
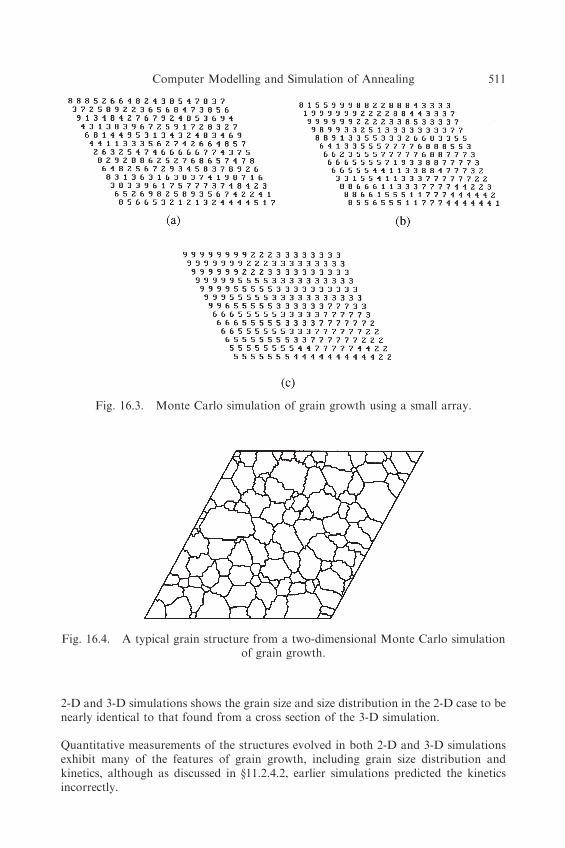
Transitions within a grain will not occur because of the severe energy penalty, buttransitions at grain boundaries may occur, giving rise to boundary migration. Figure 16.2shows how this arises. If the interaction energy between like sites is 0 and that betweenunlike sites is 1, then the energy of the configuration in 16.2a is greater than that of16.2b by 2 units, thus providing a driving force for reducing boundary curvature.Consequently, as the model is run, the grains grow, as shown in figure 16.3, exhibitingmany of the features of grain growth. Using larger arrays of at least 200� 200 points,realistic microstructures are produced as shown in figure 16.4.
The techniques may be extended to three dimensions (Anderson et al. 1985), althoughthe size of the array which can be used is rather limited, and the largest simulationsare currently �400� 400� 400 points (Miodownic et al. 2000). Comparison of the
Fig. 16.1. The basis of the Monte Carlo simulation method.
Fig. 16.2. Grain boundary migration in the Monte Carlo model.
510 Recrystallization
2-D and 3-D simulations shows the grain size and size distribution in the 2-D case to benearly identical to that found from a cross section of the 3-D simulation.
Quantitative measurements of the structures evolved in both 2-D and 3-D simulationsexhibit many of the features of grain growth, including grain size distribution andkinetics, although as discussed in §11.2.4.2, earlier simulations predicted the kineticsincorrectly.
Fig. 16.3. Monte Carlo simulation of grain growth using a small array.
Fig. 16.4. A typical grain structure from a two-dimensional Monte Carlo simulationof grain growth.
Computer Modelling and Simulation of Annealing 511
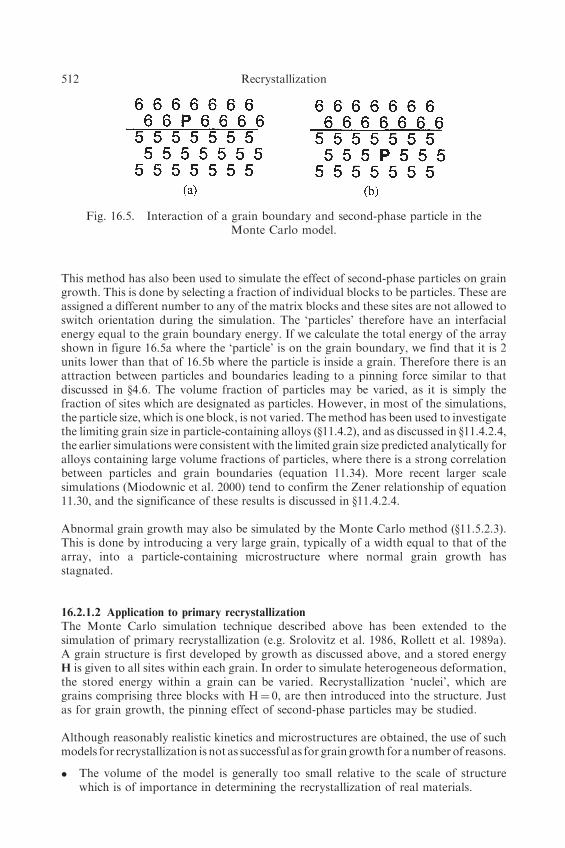
This method has also been used to simulate the effect of second-phase particles on graingrowth. This is done by selecting a fraction of individual blocks to be particles. These areassigned a different number to any of the matrix blocks and these sites are not allowed toswitch orientation during the simulation. The ‘particles’ therefore have an interfacialenergy equal to the grain boundary energy. If we calculate the total energy of the arrayshown in figure 16.5a where the ‘particle’ is on the grain boundary, we find that it is 2units lower than that of 16.5b where the particle is inside a grain. Therefore there is anattraction between particles and boundaries leading to a pinning force similar to thatdiscussed in §4.6. The volume fraction of particles may be varied, as it is simply thefraction of sites which are designated as particles. However, in most of the simulations,the particle size, which is one block, is not varied. Themethod has been used to investigatethe limiting grain size in particle-containing alloys (§11.4.2), and as discussed in §11.4.2.4,the earlier simulations were consistent with the limited grain size predicted analytically foralloys containing large volume fractions of particles, where there is a strong correlationbetween particles and grain boundaries (equation 11.34). More recent larger scalesimulations (Miodownic et al. 2000) tend to confirm the Zener relationship of equation11.30, and the significance of these results is discussed in §11.4.2.4.
Abnormal grain growth may also be simulated by the Monte Carlo method (§11.5.2.3).This is done by introducing a very large grain, typically of a width equal to that of thearray, into a particle-containing microstructure where normal grain growth hasstagnated.
16.2.1.2 Application to primary recrystallization
The Monte Carlo simulation technique described above has been extended to thesimulation of primary recrystallization (e.g. Srolovitz et al. 1986, Rollett et al. 1989a).A grain structure is first developed by growth as discussed above, and a stored energyH is given to all sites within each grain. In order to simulate heterogeneous deformation,the stored energy within a grain can be varied. Recrystallization ‘nuclei’, which aregrains comprising three blocks with H¼ 0, are then introduced into the structure. Justas for grain growth, the pinning effect of second-phase particles may be studied.
Although reasonably realistic kinetics and microstructures are obtained, the use of suchmodels for recrystallization is not as successful as for grain growth for anumber of reasons.
� The volume of the model is generally too small relative to the scale of structurewhich is of importance in determining the recrystallization of real materials.
Fig. 16.5. Interaction of a grain boundary and second-phase particle in theMonte Carlo model.
512 Recrystallization
� In many Monte Carlo simulations, a second-phase particle is represented by a singlelattice point, which is inadequate, because the effect of particles on recrystallizationis strongly dependent on particle size as well as spacing (§9.2). Later simulationshave allowed a variable particle size.
� The models fail to adequately model the nucleation stage, which is dependent onvariations in the microstructure over distances of the order of 100 nm, and useempirical rules for nucleation, recovery and stored energy.
Monte Carlo modelling of recrystallization has now largely been replaced by the use ofcellular automata models which are discussed in §16.2.2. These are closely related to theMonte Carlo method, but are capable of taking into account some of the more complexaspects of recrystallization.
16.2.1.3 Application to dynamic recrystallization
The Monte-Carlo simulation method has also been applied to dynamic recrystallization(Rollett et al. 1992, Peczac and Luton 1993). The 2-D simulations are similar to thestatic recrystallization simulations discussed above, except that the stored energy isallowed to increase with strain (time). In order to model dynamic recrystallization,‘nuclei’, consisting of a group of say three units, are introduced at random into thelattice. These nuclei have no internal energy when they are introduced, but subsequentlyacquire energy during the ‘deformation’. Nuclei grow or shrink according to the energycriteria which are discussed above. There is no explicit criterion for nucleation such as acritical strain, and the growth of the nuclei is determined by energetic criteria. There area number of parameters which need to be given to the model. These include the rates ofwork hardening and recovery and the rate of nucleation and its dependence on the otherparameters. Such models provide a means of examining the effect of variables ondynamic recrystallization. The outputs, which may be compared with experiment ortheory are the stress-strain data and the grain size. However, the advantages of theMonte-Carlo approach over the well established methods which use semi-empiricalequations to model hot working (§16.3) have yet to be demonstrated.
16.2.1.4 Success and limitations of Monte Carlo models
The merit of the Monte Carlo method lies in its inherent simplicity, its easyprogrammability and its straightforward implementation in 3-D. In its simplest formit can develop a realistic microstructure given little more than boundary energies.In its ultimate form, where the blocks are atoms, and the atoms are allowed to movefreely, this becomes molecular modelling (§16.2.3). A Monte Carlo model developsthe complete microstructure and is essentially deterministic apart from the local randomfluctuations at the boundaries. It therefore automatically includes the topographicfactors which have been a continuing problem in developing theories of graingrowth (§11.2).
The Monte Carlo method is most successful when used in its most simple form, e.g. forgrain growth in single phase materials, as in this situation the model requires very littleinput. However, for such applications it will ultimately be superseded by moleculardynamics modelling (§16.2.3). As the method is applied to more complex problems suchas static and dynamic recrystallization, more assumptions need to be incorporated,more relationships, either empirical or analytical, need to be included in the model,
Computer Modelling and Simulation of Annealing 513
and the unit blocks of the model need to have a larger number of attributes. Cellularautomata models are better equipped to deal with such problems.
Bate (2001a) has emphasised the limitations of Monte Carlo modelling in its treatmentof grain boundaries. Although the effects of boundary misorientation on energy andmobility can be incorporated (e.g. Holm et al. 1998), the effects of the boundary plane,which have a significant effect on these parameters (e.g. �3 twins and 40� <111> tiltboundaries) cannot be included, and this can be shown to have a significant effect on theevolution of microstructure and texture (Bate 2001a).
16.2.2 Cellular automata
Cellular automata (CA) models are closely related to Monte-Carlo models, in that thevolume of material is divided into cells or blocks. Although Monte Carlo blocks mayhave attributes as discussed above, CA models offer a much more efficient and flexiblemethod of doing this, and they are therefore better at simulating complex processes suchas recrystallization (Hesselbarth and Gobel 1991, Marx et al. 1999, Raabe 1999).
A cellular automaton consists of a grid of cells and is typically characterized byparameters such as:
� Cell geometry – the number, size, shape and arrangement of the cells needs to bespecified.
� The number and type of states that a cell can possess – in the simplest case, cells maybe characterised as either recrystallized or unrecrystallized. Alternatively a detaileddeformation microstructure may be included and each cell will be characterised bymicrostructural parameters such as dislocation density, cell or subgrain size andcrystallographic orientation.
� The definition of the neighbourhood of a cell – the question of whether the transitionof a cell is affected by its nearest neighbours or whether a more extendedneighbourhood is considered varies for different models.
� The rules of transition for a cell – as annealing proceeds, transitions may occur withincells, e.g. changes of dislocation density. Also events originating from adjacent cellssuch as the growth of recrystallized grains need to be accommodated.
Having specified the initial microstructure, annealing is then usually simulated on astatistical basis which neglects the details of the event. For example, nucleation may beassumed to be site saturated or to occur at a predetermined rate and the orientationsmay be random or related to the orientation of the specific cells. Such a model iscomputationally efficient, allowing large volumes to be examined and allowing effectssuch as orientation-dependent boundary mobility to be included. The output of suchmodels includes the recrystallization kinetics, texture, grain size and grain sizedistribution.
Cellular automata are essentially spatial frameworks into which simple models, such asanalytical or empirical equations which describe the details of the annealing mechanismsmay be inserted. They have the advantage over models which are not spatially resolved(e.g. the analytical model of chapter 10, that inhomogeneities of microstructure and thespatial distribution of texture may readily be taken into account.
514 Recrystallization
16.2.3 Molecular dynamics
Perhaps the ultimate tool for simulating annealing processes is molecular dynamics(MD), which has been used for over 40 years to study non-equilibrium dynamics inatomic systems. In this method, the trajectories of atoms in a defined cell of material aredetermined by integrating Newton’s equations of motion over finite time steps. Theatom motion is driven by the interatomic forces, and these are usually modelled in termsof the Lennard–Jones pair potential.
The main advantage of this method over other simulations is that the only inputsrequired are the interatomic force laws. The simulations make no assumptions about thephysical properties of the grain boundaries or the mechanisms of migration. Significantadvantages over other simulations are that the simulation uses real length and timescales. However, molecular dynamics is computationally demanding and currently onlyvery small atom arrays and very short times can be studied even with the best availablecomputers.
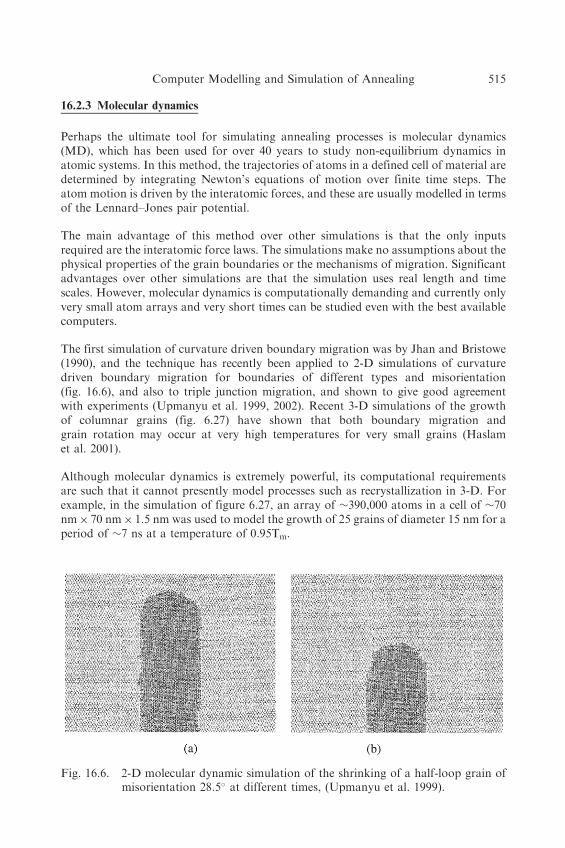
The first simulation of curvature driven boundary migration was by Jhan and Bristowe(1990), and the technique has recently been applied to 2-D simulations of curvaturedriven boundary migration for boundaries of different types and misorientation(fig. 16.6), and also to triple junction migration, and shown to give good agreementwith experiments (Upmanyu et al. 1999, 2002). Recent 3-D simulations of the growthof columnar grains (fig. 6.27) have shown that both boundary migration andgrain rotation may occur at very high temperatures for very small grains (Haslamet al. 2001).
Although molecular dynamics is extremely powerful, its computational requirementsare such that it cannot presently model processes such as recrystallization in 3-D. Forexample, in the simulation of figure 6.27, an array of �390,000 atoms in a cell of �70nm� 70 nm� 1.5 nm was used to model the growth of 25 grains of diameter 15 nm for aperiod of �7 ns at a temperature of 0.95Tm.
Fig. 16.6. 2-D molecular dynamic simulation of the shrinking of a half-loop grain ofmisorientation 28.5� at different times, (Upmanyu et al. 1999).
Computer Modelling and Simulation of Annealing 515
16.2.4 Vertex simulations
Vertex or network models are based on the assumption that the smallest microstructuralunit of importance during annealing is a grain or subgrain, and they represent themicrostructure as a cellular structure. Many models assume an ‘ideal grain assembly’with no variation of boundary properties and can therefore only model grain growth.However more sophisticated models which take into account the orientationdependence of boundary properties are now commonly used. A review of vertexmodels and comparison with Monte Carlo models is given by Maurice (2001).
The earliest simulations in this field were the bubble rafts used by Bragg and Nye (1947)to study grain growth. The coarsening of soap froths between glass plates has been usedas a grain growth simulation (e.g. Weaire and Glazier 1992) and has also been studied inits own right. Although the mechanisms of grain growth and froth coarsening are clearlydifferent as the latter involves gas diffusion, it is interesting that detailed measurementsof the kinetics of soap froth coarsening show a remarkable similarity to those for graingrowth (Ling et al. 1992). The computer models discussed below are mostly two-dimensional, but are being extended to 3-D. It should be re-emphasized that 2-Dsimulations of the annealing of 3-D microstructures may be misleading, and the resultsshould be interpreted with caution.
16.2.4.1 The basic model
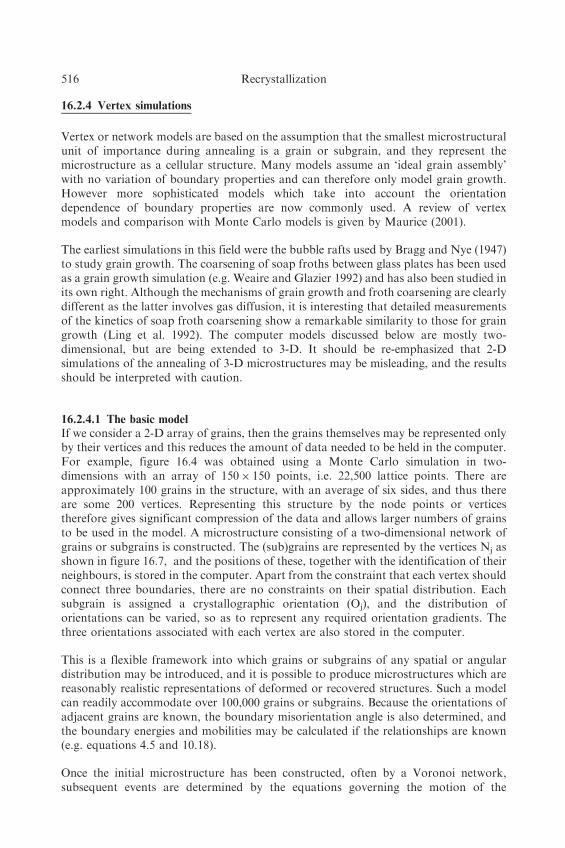
If we consider a 2-D array of grains, then the grains themselves may be represented onlyby their vertices and this reduces the amount of data needed to be held in the computer.For example, figure 16.4 was obtained using a Monte Carlo simulation in two-dimensions with an array of 150� 150 points, i.e. 22,500 lattice points. There areapproximately 100 grains in the structure, with an average of six sides, and thus thereare some 200 vertices. Representing this structure by the node points or verticestherefore gives significant compression of the data and allows larger numbers of grainsto be used in the model. A microstructure consisting of a two-dimensional network ofgrains or subgrains is constructed. The (sub)grains are represented by the vertices Nj asshown in figure 16.7, and the positions of these, together with the identification of theirneighbours, is stored in the computer. Apart from the constraint that each vertex shouldconnect three boundaries, there are no constraints on their spatial distribution. Eachsubgrain is assigned a crystallographic orientation (Oj), and the distribution oforientations can be varied, so as to represent any required orientation gradients. Thethree orientations associated with each vertex are also stored in the computer.
This is a flexible framework into which grains or subgrains of any spatial or angulardistribution may be introduced, and it is possible to produce microstructures which arereasonably realistic representations of deformed or recovered structures. Such a modelcan readily accommodate over 100,000 grains or subgrains. Because the orientations ofadjacent grains are known, the boundary misorientation angle is also determined, andthe boundary energies and mobilities may be calculated if the relationships are known(e.g. equations 4.5 and 10.18).
Once the initial microstructure has been constructed, often by a Voronoi network,subsequent events are determined by the equations governing the motion of the
516 Recrystallization
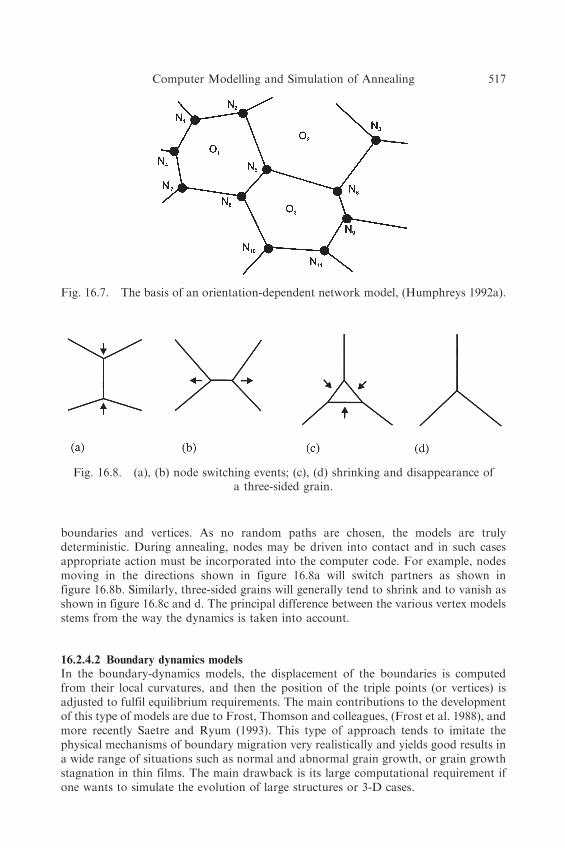
boundaries and vertices. As no random paths are chosen, the models are trulydeterministic. During annealing, nodes may be driven into contact and in such casesappropriate action must be incorporated into the computer code. For example, nodesmoving in the directions shown in figure 16.8a will switch partners as shown infigure 16.8b. Similarly, three-sided grains will generally tend to shrink and to vanish asshown in figure 16.8c and d. The principal difference between the various vertex modelsstems from the way the dynamics is taken into account.
16.2.4.2 Boundary dynamics models
In the boundary-dynamics models, the displacement of the boundaries is computedfrom their local curvatures, and then the position of the triple points (or vertices) isadjusted to fulfil equilibrium requirements. The main contributions to the developmentof this type of models are due to Frost, Thomson and colleagues, (Frost et al. 1988), andmore recently Saetre and Ryum (1993). This type of approach tends to imitate thephysical mechanisms of boundary migration very realistically and yields good results ina wide range of situations such as normal and abnormal grain growth, or grain growthstagnation in thin films. The main drawback is its large computational requirement ifone wants to simulate the evolution of large structures or 3-D cases.
Fig. 16.7. The basis of an orientation-dependent network model, (Humphreys 1992a).
Computer Modelling and Simulation of Annealing 517
16.2.4.3 Vertex-dynamics models
The vertex-dynamics models constitute an alternative, more economic, vertexsimulation technique which keeps track of the triple (or quadruple) points only,ascribing the boundary migration to the motion of these points. The reliability of thesevertex-dynamics models is, of course, very much dependent on the way vertex motionequations are derived from the migration of the adjacent interfaces. Several differentsolutions involving line-tension driven vertex motion have been proposed over the years(see for example Fullman 1952, Soares et al. 1985). More sophisticated formulationswere derived by Kawasaki and co-workers (1989) who considered a vertex networkconnected by straight edges, its dynamics being governed by the balance between thereduction of interfacial energy by boundary migration and the dissipation due to theviscous drag which opposes the interface motion. Humphreys (1992a,b) proposed theuse of a vertex-dynamics model to study the time evolution of structures with boundarymobilities and energies depending on the interface character. In the first version of hismodel, the grain boundaries were considered as straight edges, the line tensions beingsummed up at each vertex to give the driving force on the vertex.
16.2.4.4 Boundary versus vertex-dynamics models
All the vertex-dynamics models referred to above, treat the boundaries as straight edges,thus neglecting the fact that the migration of a boundary is driven by its curvature.Moreover, the mechanical equilibrium at triple junctions is not satisfied. The implicitassumption behind this type of model is that the boundary mobility is much higher thanthe triple junction mobility, which is true in most situations as discussed in §5.5. In theboundary-dynamics models, it is recognised that the boundary curvature governs theboundary migration, and the triple junction is considered to be in local equilibrium at alltimes. Weygand et al. (1998b) have recently proposed a modified Kawasaki model inwhich they consider the motion of the triple junctions together with that of ‘virtualvertices’ distributed along the grain boundaries. The main advantages of this approachare that it does not need to assume a particular shape for the boundaries, and that itdoes not enforce equilibrium at the triple junction. One of the striking results of theirstudy is that during normal grain growth, the structure evolves so as to fulfil the localequilibrium at the triple junctions. It is therefore not unreasonable to assume from thestart a local mechanical equilibrium in the vicinity of the vertex. Such an idea wasproposed by Svoboda (1993) as an improvement to Humphreys’ method, and has beenused by Maurice and Humphreys (1997, 1998).
The growth of an ideal grain assembly (all boundaries have equal properties) is perhapsthe simplest problem to tackle. A detailed comparison of the application of variousmodels to this problem is given by Atkinson (1988). Such models are tested bycomparing the growth kinetics and grain size distributions in a high angle boundaryarray with that produced by experiment or with other computer simulations such as 2-DMonte Carlo simulations and are usually found to produce similar results. Frost andcolleagues have made extensive use of their model to simulate grain growth in thinmetallic films, an area of importance in the technology of integrated circuits, and inwhich the limitation of the model to two dimensions does not pose a serious problem.They have incorporated grain boundary grooving into the model and an example oftheir simulation is shown in figure 16.9.
518 Recrystallization
16.2.4.6 Modelling recovery and recrystallization
In order to simulate recovery or the nucleation of recrystallization, the model has totake account of the grain and subgrain orientations, because the energy and mobilityof low angle boundaries are strongly dependent on orientation, and an early two-dimensional version of such a model was discussed by Humphreys (1992a,b). A modelsuch as this may of course only be used to simulate the recovery of a material in whichthe dislocations are arranged into low angle boundaries (e.g. a high stacking fault energymaterial such as Al or Fe).
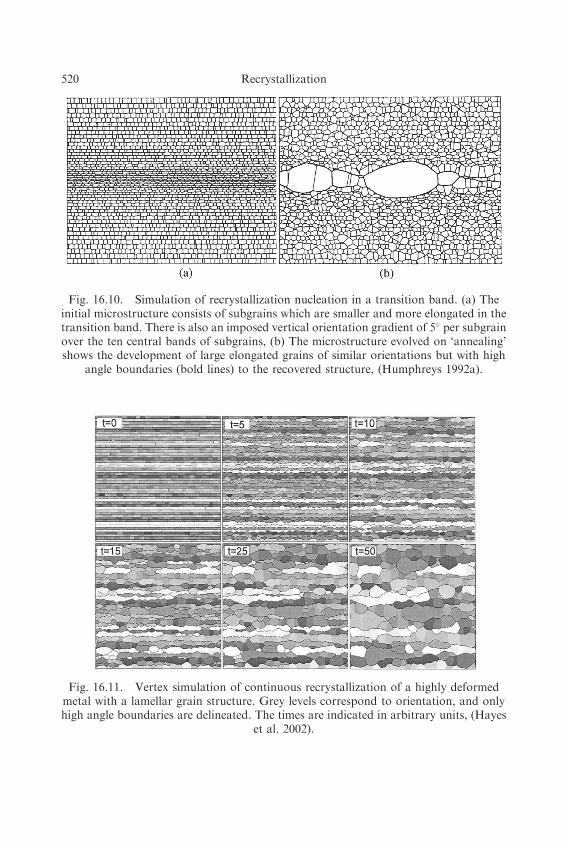
Vertex models in which grain and subgrain orientations can be included may be used toinvestigate recovery and the possible mechanisms of recrystallization nucleation,including SIBM and the annealing of a transition band in a deformed material asshown in figure 16.10. It should be emphasised that recrystallization nucleation, which isno more than heterogeneous recovery in a region of large orientation gradient, follows asa natural consequence of the spatial and angular heterogeneities in the startingmicrostructure and is not specifically programmed into the model. Pinning by particlesmay also be introduced into such a model (Humphreys 1992a, Weygand et al. 1999,Bate 2001b), and by producing a suitable orientation gradient at a large particle, particlestimulated nucleation of recrystallization may be simulated (Humphreys 1992a,b).
An interesting recent application of vertex modelling to the annealing of highlydeformed aluminium by Bate (see Hayes et al. 2002) is shown in figure 16.11. Theseauthors investigated the instability on annealing of the elongated grain structuresproduced by very large strain deformation (e.g. figs. 14.1 and 14.8) and which do notundergo discontinuous recrystallization on subsequent annealing (§14.3.4). The modelshows necking and ‘pinching off’ of high angle lamellar boundaries due to the surfacetension of the less mobile low angle boundaries. The grain aspect ratio is progressivelyreduced during annealing, and this process of continuous recrystallization ultimatelyproduces an equiaxed grain structure.
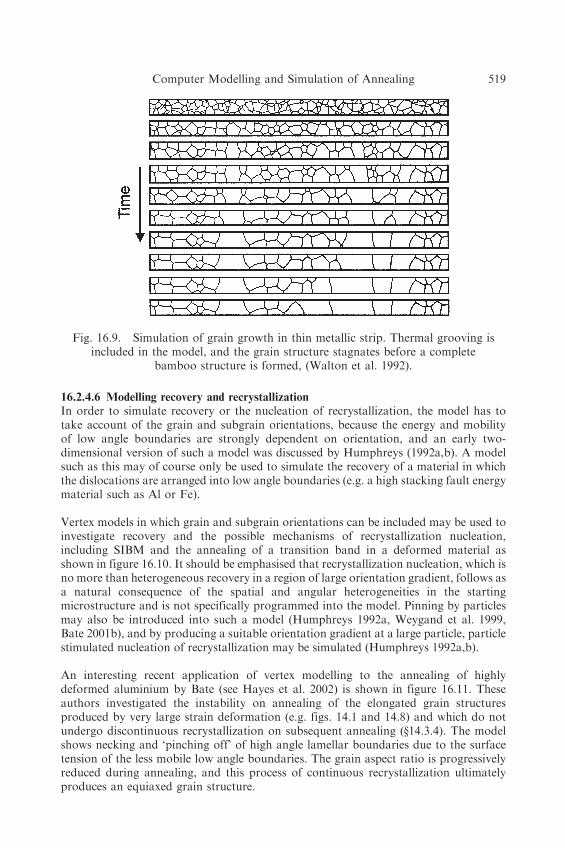
Fig. 16.9. Simulation of grain growth in thin metallic strip. Thermal grooving isincluded in the model, and the grain structure stagnates before a complete
bamboo structure is formed, (Walton et al. 1992).
Computer Modelling and Simulation of Annealing 519
Fig. 16.11. Vertex simulation of continuous recrystallization of a highly deformedmetal with a lamellar grain structure. Grey levels correspond to orientation, and onlyhigh angle boundaries are delineated. The times are indicated in arbitrary units, (Hayes
et al. 2002).
Fig. 16.10. Simulation of recrystallization nucleation in a transition band. (a) Theinitial microstructure consists of subgrains which are smaller and more elongated in thetransition band. There is also an imposed vertical orientation gradient of 5� per subgrainover the ten central bands of subgrains, (b) The microstructure evolved on ‘annealing’shows the development of large elongated grains of similar orientations but with high
angle boundaries (bold lines) to the recovered structure, (Humphreys 1992a).
520 Recrystallization
16.2.4.7 Dynamic grain growth
Vertex models have been successfully used to model dynamic grain growth during thehigh temperature deformation of particle-containing alloys (Bate 2001b). The Zenerdrag due to the particles is treated as an average drag on the boundaries rather thantreating the particles individually. This is justified if the particles are small and closelyspaced relative to the grain size.
16.2.4.8 Three dimensional vertex models
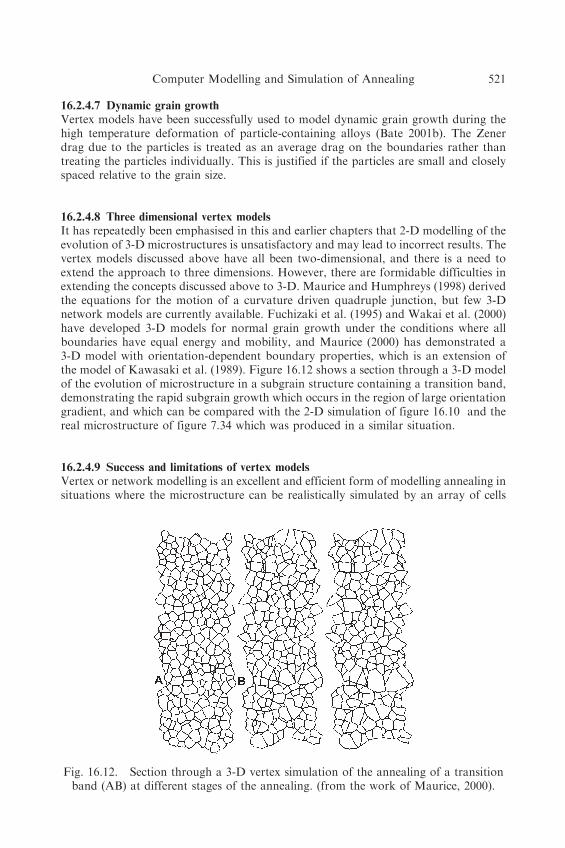
It has repeatedly been emphasised in this and earlier chapters that 2-D modelling of theevolution of 3-D microstructures is unsatisfactory and may lead to incorrect results. Thevertex models discussed above have all been two-dimensional, and there is a need toextend the approach to three dimensions. However, there are formidable difficulties inextending the concepts discussed above to 3-D. Maurice and Humphreys (1998) derivedthe equations for the motion of a curvature driven quadruple junction, but few 3-Dnetwork models are currently available. Fuchizaki et al. (1995) and Wakai et al. (2000)have developed 3-D models for normal grain growth under the conditions where allboundaries have equal energy and mobility, and Maurice (2000) has demonstrated a3-D model with orientation-dependent boundary properties, which is an extension ofthe model of Kawasaki et al. (1989). Figure 16.12 shows a section through a 3-D modelof the evolution of microstructure in a subgrain structure containing a transition band,demonstrating the rapid subgrain growth which occurs in the region of large orientationgradient, and which can be compared with the 2-D simulation of figure 16.10 and thereal microstructure of figure 7.34 which was produced in a similar situation.
16.2.4.9 Success and limitations of vertex models
Vertex or network modelling is an excellent and efficient form of modelling annealing insituations where the microstructure can be realistically simulated by an array of cells
Fig. 16.12. Section through a 3-D vertex simulation of the annealing of a transitionband (AB) at different stages of the annealing. (from the work of Maurice, 2000).
Computer Modelling and Simulation of Annealing 521
and where boundary migration is the mechanism of annealing. Apart from the initialmicrostructure, only the properties of the boundaries are required as input. Withorientation-dependent boundary properties, events such as the nucleation of recrys-tallization may readily be simulated, and a comparison of the kinetics of grain growthobtained by vertex and Monte Carlo models show great similarity (Maurice 2001).The advantages over Monte Carlo models are the larger microstructures which can beinvestigated, the more transparent physical mechanisms and the better treatmentof boundary properties. Mechanisms such as subgrain rotation and coalescence(fig. 6.26) and concurrent deformation (Bate 2001b) may be included, and two-phasemicrostructures investigated, although this is not simple if only the boundary verticesare tracked.
The main limitation of the network models compared to Monte Carlo models is thedifficulty of producing the 3-D models which are required for quantitative predictions.An interesting approach involving both models has been the use of small 3-D MonteCarlo models to verify the microstructures produced by larger 2-D vertex models ofrecrystallization (Bate 2001a, Hayes et al. 2002).
16.2.5 Computer avrami models
The application of the JMAK relationship of equation 7.17 which describes the kineticsof recrystallization, is limited by the spatial and temporal inhomogeneity of thenucleation and growth processes. By using analytical relationships to describenucleation and growth rates etc., but using a computer to deal with the spatialdistribution effects, more realistic models for recrystallization can be obtained.Although this does not have the flexibility of the cellular automata models (§16.2.2),by which it has largely been overtaken, it is a rapid and simple method of assessingthe effects of different nucleation and growth theories on the development ofmicrostructures and textures.
An early two-dimensional simulation of this type was demonstrated by Mahin et al.(1980), and the Trondheim group (Saetre et al. 1986a, Marthinsen et al. 1989, Furu et al.1990) extended the simulation to three dimensions and extensively refined the model. Inits most general form, nuclei are distributed within a cube at a given rate, and these thengrow according to a specified growth law, the transformation being complete whengrains impinge on one other. Microstructures are then obtained from two-dimensionalsections of the volume, which are analysed by a binary tree construction.
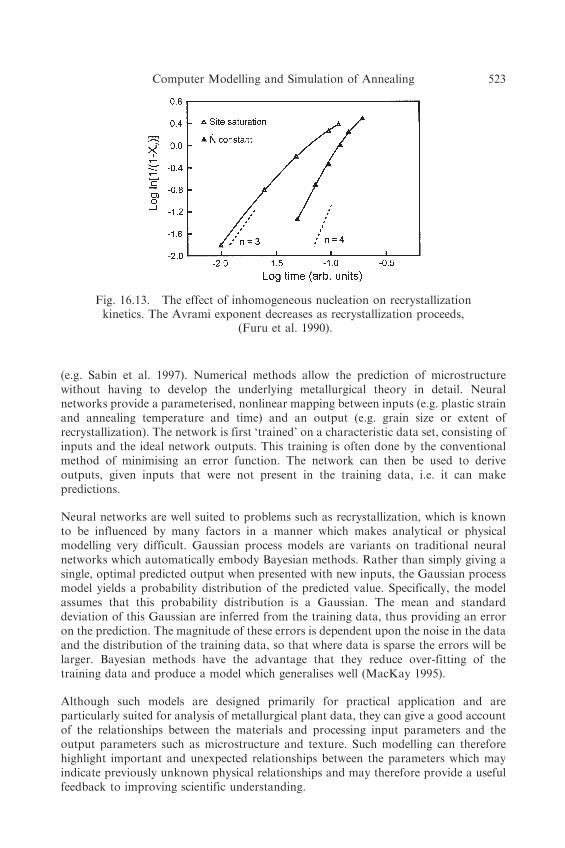
Applications of the model to recrystallization have shown good agreement with theanalytical models discussed §7.3 for randomly distributed nuclei, and it has been shownthat an inhomogeneous distribution of nuclei reduces the JMAK exponents asrecrystallization proceeds as shown in figure 16.13 (Furu et al. 1990).
16.2.6 Neural network modelling
The modelling of recrystallization by empirical equations has recently been enhanced bythe application of sophisticated numerical methods to model microstructural evolution
522 Recrystallization
(e.g. Sabin et al. 1997). Numerical methods allow the prediction of microstructurewithout having to develop the underlying metallurgical theory in detail. Neuralnetworks provide a parameterised, nonlinear mapping between inputs (e.g. plastic strainand annealing temperature and time) and an output (e.g. grain size or extent ofrecrystallization). The network is first ‘trained’ on a characteristic data set, consisting ofinputs and the ideal network outputs. This training is often done by the conventionalmethod of minimising an error function. The network can then be used to deriveoutputs, given inputs that were not present in the training data, i.e. it can makepredictions.
Neural networks are well suited to problems such as recrystallization, which is knownto be influenced by many factors in a manner which makes analytical or physicalmodelling very difficult. Gaussian process models are variants on traditional neuralnetworks which automatically embody Bayesian methods. Rather than simply giving asingle, optimal predicted output when presented with new inputs, the Gaussian processmodel yields a probability distribution of the predicted value. Specifically, the modelassumes that this probability distribution is a Gaussian. The mean and standarddeviation of this Gaussian are inferred from the training data, thus providing an erroron the prediction. The magnitude of these errors is dependent upon the noise in the dataand the distribution of the training data, so that where data is sparse the errors will belarger. Bayesian methods have the advantage that they reduce over-fitting of thetraining data and produce a model which generalises well (MacKay 1995).
Although such models are designed primarily for practical application and areparticularly suited for analysis of metallurgical plant data, they can give a good accountof the relationships between the materials and processing input parameters and theoutput parameters such as microstructure and texture. Such modelling can thereforehighlight important and unexpected relationships between the parameters which mayindicate previously unknown physical relationships and may therefore provide a usefulfeedback to improving scientific understanding.
Fig. 16.13. The effect of inhomogeneous nucleation on recrystallizationkinetics. The Avrami exponent decreases as recrystallization proceeds,
(Furu et al. 1990).
Computer Modelling and Simulation of Annealing 523
16.3 COUPLED MODELS
An important impediment to the successful implementation of the annealing modelsdiscussed in §16.2 is the lack of information about the initial deformed condition. Notonly are we currently unable to model or predict the deformation microstructureaccurately or in sufficient detail, but we do not even have sufficiently detailedexperimental measurements of deformed microstructures to provide an adequate basefor modelling annealing. However, many annealing models are now being coupled todeformation models or to real deformation microstructures.
16.3.1 The annealing of ‘real’ microstructures
Automated methods for obtaining detailed quantitative microstructures such as EBSDmapping (Appendix 2) can readily provide microstructures suitable for input to the 2-DMonte Carlo, cellular automata or vertex models described in §16.2. The input data caninclude orientations, together with a measure of the local stored energies obtained frompattern quality (Engler 1998), or may be higher resolution EBSD maps in whichreconstructed subgrains and grains are used (Baudin et al. 2000, Caleyo et al. 2002).
16.3.2 The annealing of computer generated deformation microstructures
Alternatively, an annealing model may be coupled with a model describing thedeformed state. The coarser aspects of the deformed state may be predicted from FiniteElement (FE) (Gottstein et al. 1999, Raabe and Becker 1999, Radhakrishnan et al. 1998)or Self Consistent Plasticity modelling (Solas et al. 1999). However, standard FEprocedures operate on much too coarse a scale to give more than an approximateaccount of the deformed state, although they may provide some indication of the spatialdistribution of stored energy. Crystal Plasticity Finite Element models (CPFEM) whichcan model the deformed state more accurately, have been developed (Raabe and Becker1999, Bate 1999, Bate 2001a), but, particularly in 3-D, remain very computer intensive,and are currently unable to predict the scale of grain fragmentation. Such models mayprovide a reasonable description of the driving pressures for recrystallization, but arecurrently unable to model the deformed state with sufficient accuracy to deal with thenucleation of recrystallization. Bate (2001a) has critically reviewed the coupling ofCPFEM deformation models to annealing models, and demonstrated the extremesensitivity of vertex or Monte Carlo annealing simulations to small changes in thedeformation microstructures arising from slightly different CPFEM conditions.
Another approach has been to derive more detailed local microstructural parameters,such as dislocation densities, by coupling FE modelling to work hardening models (e.g.Gottstein et al. 1999, Luce et al. 2001) and using this as input to an annealing model.
16.3.3 Modelling an industrial thermomechanical process
The development of quantitative physically-based models of thermomechanicalprocessing is already established in the steel industry and is being developed for the
524 Recrystallization
aluminium industry. Although detailed consideration of such models is beyond thescope of this book, it is instructive to see how some of the basic concepts discussedearlier in this book fit into the larger perspective of industrial practice.
16.3.3.1 Outline of a model
The modelling of industrial multi-pass hot rolling which has been of particular interestto modellers involves successive hot rolling reductions with intermediate stages duringwhich the material may recrystallize. Each rolling pass is modelled in terms of four steps(e.g. Sellars 1992a).
� The starting microstructure, is characterised by several parameters which mayinclude grain, subgrain and dislocation structure, together with texture.
� Deformation to a particular strain takes place at an imposed strain rate andtemperature.
� Annealing occurs between rolling passes.� The final microstructure is produced and becomes the starting microstructure for the
next cycle.
The microstructural changes during deformation and annealing, and the strain andstrain rate vary during the overall process. Models to predict changes of microstructureand texture at each stage are required. Micro-models, such as the recrystallizationmodels discussed in §16.2 can be used to describe these processes, although currently,the semi-empirical state-variable constitutive models discussed in §13.2.5 and §13.6.2 aremore commonly used.
The temperature is non-uniform through the material and changes continuously withtime and stock geometry. The surface oxide film and lubricants will also affect heattransfer to the environment and to the rolling mill. Finite difference computing methodsare used to calculate instantaneous values of temperature.
16.3.3.2 Application to steels
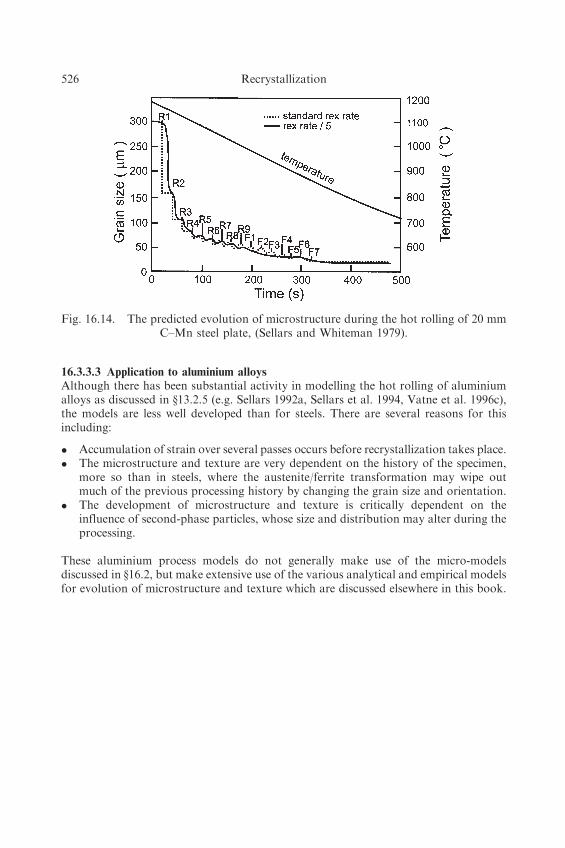
Models such as that discussed above have been successfully used by the steel industryfor some time (see Jonas 1990, Sellars 1990, Torizuka et al. 1997). The predicted changein grain size during multiple rolling of C–Mn steel is shown in figure 16.14. The steel isreduced from 250 mm slab in equal passes of 15% reduction, with 20 seconds betweenpasses. The broken line, which represents the predicted recrystallization kinetics showsthat after each roughing pass (R) the grain size is refined by complete recrystallizationand when the grain size is below 100 mm, some grain growth occurs between passes.Complete recrystallization also occurs during the first four finishing passes (F), but atthe lower temperatures recrystallization is incomplete between passes. For comparison,data has been computed (solid line) using a recrystallization rate which is 5 times slower.Although recrystallization is incomplete between all finishing passes, the overall changesin grain size remain similar.
The relative insensitivity of the output to differences in the input microstructuralequations and the good quantitative agreement between predicted and observed micro-structures has made modelling an accepted tool for the industrial thermomechanicalprocessing of steel.
Computer Modelling and Simulation of Annealing 525
16.3.3.3 Application to aluminium alloys
Although there has been substantial activity in modelling the hot rolling of aluminiumalloys as discussed in §13.2.5 (e.g. Sellars 1992a, Sellars et al. 1994, Vatne et al. 1996c),the models are less well developed than for steels. There are several reasons for thisincluding:
� Accumulation of strain over several passes occurs before recrystallization takes place.� The microstructure and texture are very dependent on the history of the specimen,
more so than in steels, where the austenite/ferrite transformation may wipe outmuch of the previous processing history by changing the grain size and orientation.
� The development of microstructure and texture is critically dependent on theinfluence of second-phase particles, whose size and distribution may alter during theprocessing.
These aluminium process models do not generally make use of the micro-modelsdiscussed in §16.2, but make extensive use of the various analytical and empirical modelsfor evolution of microstructure and texture which are discussed elsewhere in this book.
Fig. 16.14. The predicted evolution of microstructure during the hot rolling of 20 mmC–Mn steel plate, (Sellars and Whiteman 1979).