15
Contents 4.1 Introduction to Statistics 4.2 Statistical Investigations 4 Uses and Abuses of Statistics
| Date post: | 13-Nov-2014 |
| Category: |
Documents |
| Upload: | api-3704862 |
| View: | 68 times |
| Download: | 2 times |
Contents
4.1 Introduction to Statistics
4.2 Statistical Investigations
4Uses and Abuses of Statistics
P. 2
Content
Uses and Abuses of Statistics44.1 Introduction to Statistics
Statistics is a branch of mathematics that involves collecting, organizing, presenting, analysing and interpreting data. It plays an important role in education, business and finance, public administration and socio-economic studies.
In general, statistics involves collection, representation, analysis and interpretation of numerial information. In our daily life, we receive statistical information mostly from the media.
A. Basic Concepts of Statistics
With the help of statistics, people can make more effective decisions and manage their work more efficiently.
P. 3
Content
Uses and Abuses of Statistics4
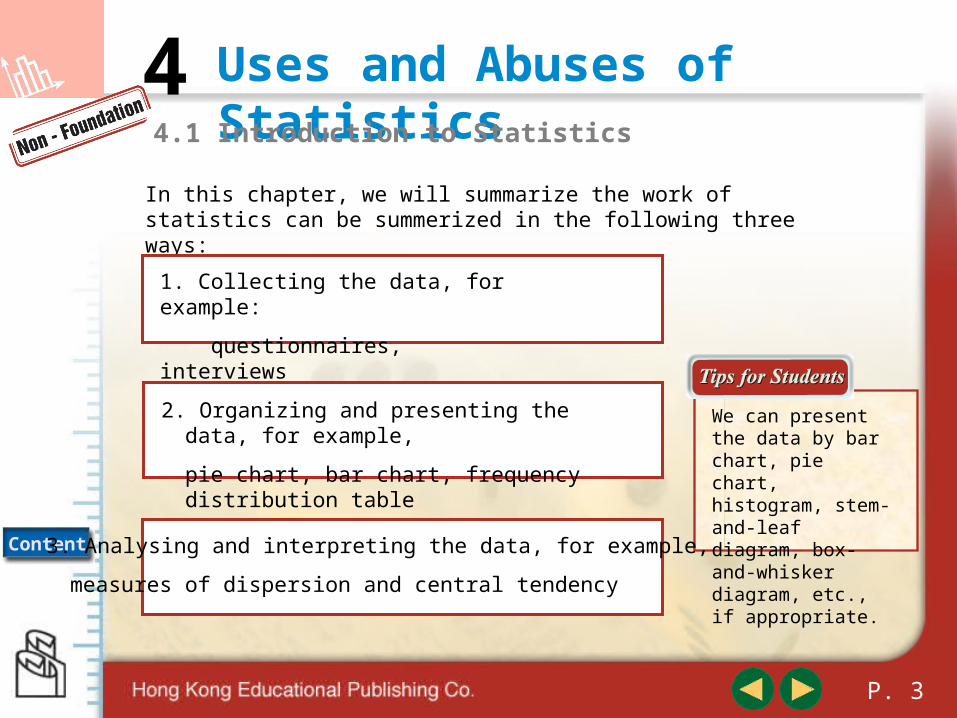
We can present the data by bar chart, pie chart, histogram, stem-and-leaf diagram, box-and-whisker diagram, etc., if appropriate.
4.1 Introduction to Statistics
In this chapter, we will summarize the work of statistics can be summerized in the following three ways:
1. Collecting the data, for example:
questionnaires, interviews
2. Organizing and presenting the data, for example,
pie chart, bar chart, frequency distribution table
3. Analysing and interpreting the data, for example,
measures of dispersion and central tendency
P. 4
Content
Uses and Abuses of Statistics4
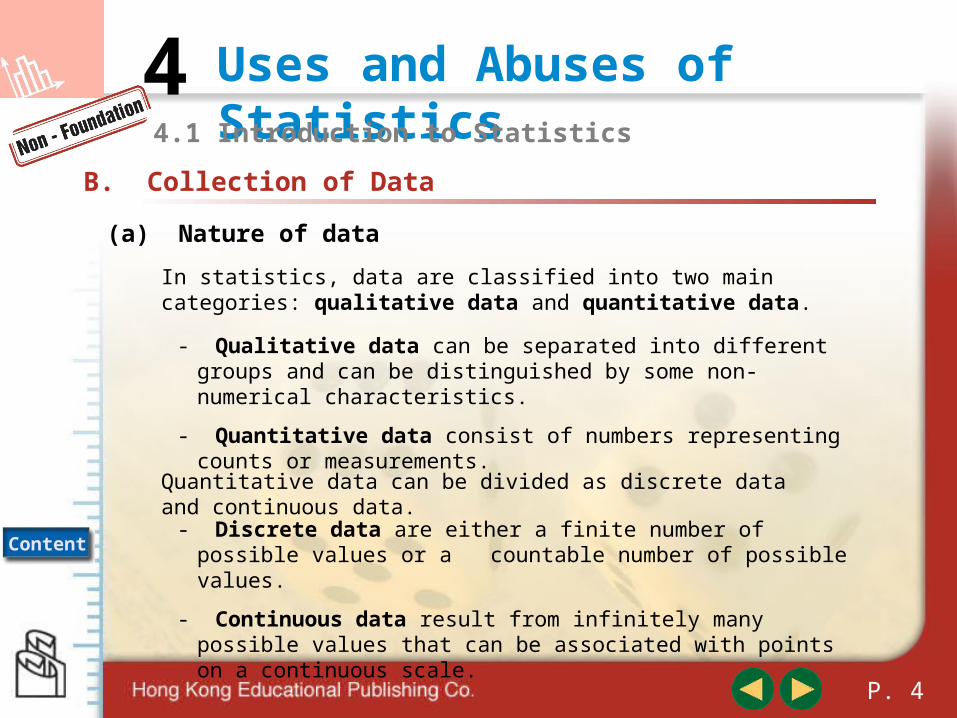
In statistics, data are classified into two main categories: qualitative data and quantitative data.
4.1 Introduction to Statistics
- Qualitative data can be separated into different groups and can be distinguished by some non-numerical characteristics.
- Quantitative data consist of numbers representing counts or measurements.
B. Collection of Data
Quantitative data can be divided as discrete data and continuous data.
- Discrete data are either a finite number of possible values or a countable number of possible values.
- Continuous data result from infinitely many possible values that can be associated with points on a continuous scale.
(a) Nature of data
P. 5
Content
Uses and Abuses of Statistics44.1 Introduction to Statistics
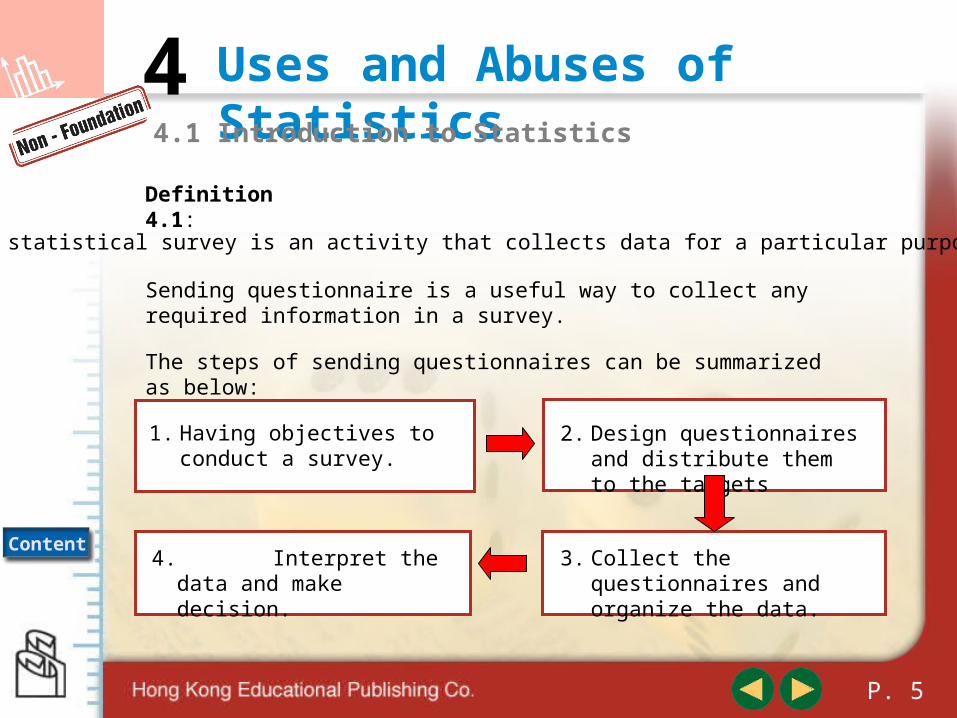
Definition 4.1:
Sending questionnaire is a useful way to collect any required information in a survey.
The steps of sending questionnaires can be summarized as below:
1. Having objectives to conduct a survey.
A statistical survey is an activity that collects data for a particular purpose.
2. Design questionnaires and distribute them to the targets
4. Interpret the data and make decision.
3. Collect the questionnaires and organize the data.
P. 6
Content
Uses and Abuses of Statistics4
The terms population and sample are commonly used in statistics.
These terms are very core of statistics and we define them as below.
C. Sampling Methods
4.1 Introduction to Statistics
1. A population in statistics refers the entire set of individuals under study.
2. A sample refers to a chosen part of the population.
In many real-life cases, the population is very large or inaccessible. The cost of collecting data from the whole population is very expensive and time consuming. Moreover, we can hardly carry out a statistical survey on the whole population.
There are three methods of sampling: simple random sampling,
systematic sampling and stratified random sampling.
P. 7
Content
Uses and Abuses of Statistics4
Simple random sampling is a method of selecting a sample such that each item in the population has an equal chance of being chosen.
4.1 Introduction to Statistics
In order to use the method of simple random sampling, we should first list and assign a unique identification number to each item in the population, then group all the numbers in a table. This number list is called the sampling frame of the population.
(a) Simple Random Sampling
Suppose a population consists of 900 students of a school. If we want to select a random sample of students from it, we can set a list of the names of all students and assign a number to each student.
Once a sampling frame is constructed, we can select a sample at random by one of the following two methods.
P. 8
Content
Uses and Abuses of Statistics44.1 Introduction to Statistics
For example, we may write down all the numbers on a piece of paper and then select them from a box at random.
Method 2: Using the random number table
Random number can be obtained in the following ways:
Method 1: Using the lottery method
(a) Random number table is often available in statistics reference books.
(b) Using statistical software ‘Winstats’ or spreadsheet to generate random numbers
(c) In a scientific calculator, press “SHIFT” “RAN” to generate random numbers
P. 9
Content
Uses and Abuses of Statistics44.1 Introduction to Statistics
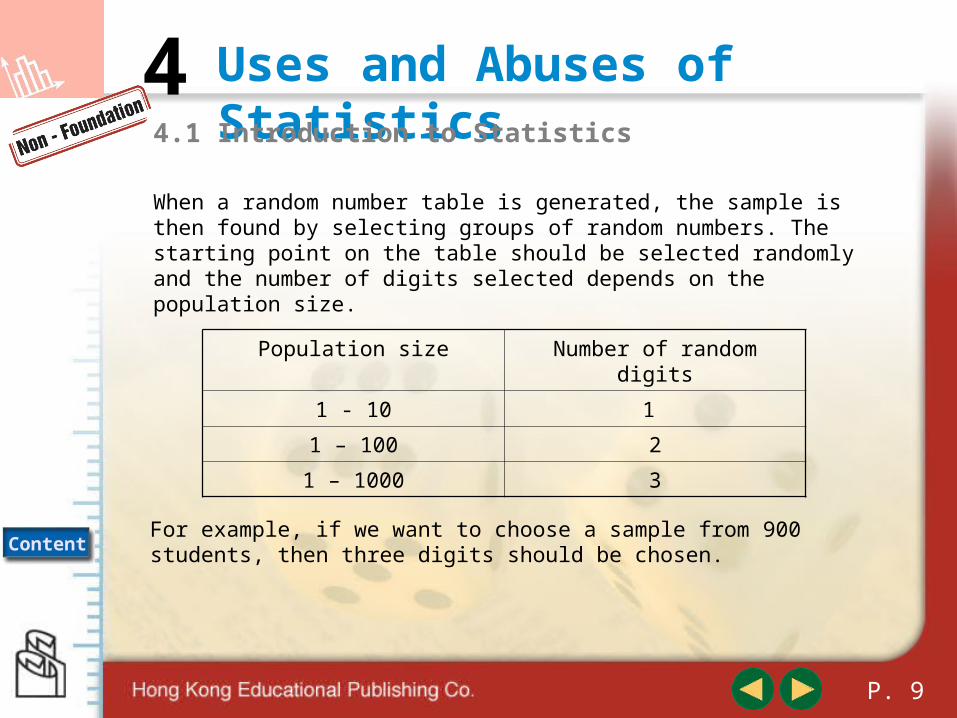
When a random number table is generated, the sample is then found by selecting groups of random numbers. The starting point on the table should be selected randomly and the number of digits selected depends on the population size.
Population size Number of random digits
1 - 10 1
1 – 100 2
1 – 1000 3
For example, if we want to choose a sample from 900 students, then three digits should be chosen.
P. 10
Content
Uses and Abuses of Statistics44.1 Introduction to Statistics
Systematic sampling is a method in which we first select a starting point randomly, then select every kth (such as 10th or 50th ) item in the population.
1. The starting point of the systematic sampling method can be selected by the lottery method or using the random number table
Notes:
(b) Systematic Sampling
For example, if a company wants to conduct a survey of its 1000 employees, it can select every 10th employee and obtain a sample of size 100.
2. Systematic sampling method is easier to handle than the simple random sampling method.
P. 11
Content
Uses and Abuses of Statistics4(c) Stratified Random Sampling
4.1 Introduction to Statistics
Notes :
Stratified random sampling is a sampling method that divides the
population into at least two subgroups (called strata) that share the
same characteristics (such as gender), and then select samples from
each stratum.
The stratified sampling method may reflect the characteristics of a
population more accurately than the other two sampling methods
P. 12
Content
Uses and Abuses of Statistics44.2 Statistical Investigations
A. Uses of Statistics
Everyday, there are many statistical reports in the media. Those reports are presented according to the nature of the data in different types of graphs, such as
(a) pie chart
(b) broken line graph
(c) histogram / bar chart
(d) stem-and-leaf diagram
P. 13
Content
Uses and Abuses of Statistics4
For example, a company has five cars with prices: $22 000, $33 000, $80 000, $100 000 and $108 000. the manager claims that the average price of the cars is $68 800. Customers may think that the prices of the cars in this company are around $70 000, but actually there are only two cars with prices under $70 000!
The above case shows that an average can be misleading when used to represent a data set.
B. Abuses of Statistics
4.2 Statistical Investigations
(a) Using ‘Average’ to Mislead Readers
P. 14
Content
Uses and Abuses of Statistics44.2 Statistical Investigations
(b) Misinterpreted Percentage
Sometimes, the statistical information presented in the media is also unclear or misleading.
For example, the marketing department of a computer software company asked ten of its customers about the performance of the new software company asked ten of its customers about the performance of the new software.
Since nine of ten of the customers said the software was good, the company claimed that over 90% of the customers were satisfied with the performance of the software.
P. 15
Content
Uses and Abuses of Statistics44.2 Statistical Investigations
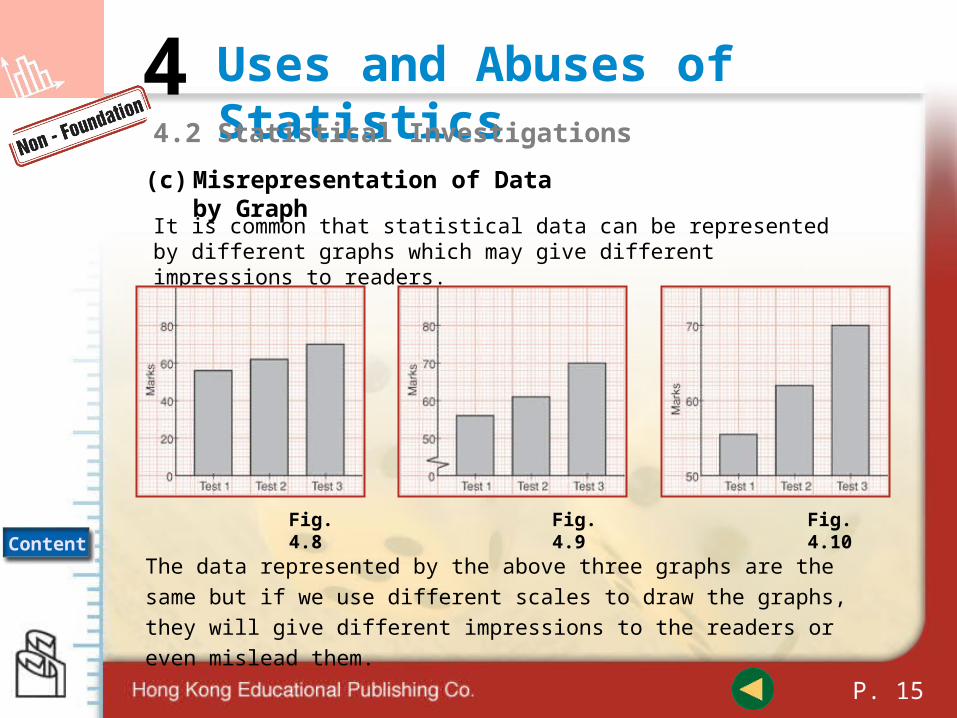
The data represented by the above three graphs are the same but if we
use different scales to draw the graphs, they will give different impressions
to the readers or even mislead them.
(c) Misrepresentation of Data by Graph
It is common that statistical data can be represented by different graphs which may give different impressions to readers.
Fig. 4.8 Fig. 4.9 Fig. 4.10


