Chapter 18 - Equity Valuation Models 18-1 CHAPTER 18: EQUITY VALUATION MODELS PROBLEM SETS 1. Theoretically, dividend discount models can be used to value the stock of rapidly growing companies that do not currently pay dividends; in this scenario, we would be valuing expected dividends in the relatively more distant future. However, as a practical matter, such estimates of payments to be made in the more distant future are notoriously inaccurate, rendering dividend discount models problematic for valuation of such companies; free cash flow models are more likely to be appropriate. At the other extreme, one would be more likely to choose a dividend discount model to value a mature firm paying a relatively stable dividend. 2. It is most important to use multi-stage dividend discount models when valuing companies with temporarily high growth rates. These companies tend to be companies in the early phases of their life cycles, when they have numerous opportunities for reinvestment, resulting in relatively rapid growth and relatively low dividends (or, in many cases, no dividends at all). As these firms mature, attractive investment opportunities are less numerous so that growth rates slow. 3. The intrinsic value of a share of stock is the individual investor’s assessment of the true worth of the stock. The market capitalization rate is the market consensus for the required rate of return for the stock. If the intrinsic value of the stock is equal to its price, then the market capitalization rate is equal to the expected rate of return. On the other hand, if the individual investor believes the stock is underpriced (i.e., intrinsic value < price), then that investor’s expected rate of return is greater than the market capitalization rate. 4. a. k = D 1 /P 0 + g 0.16 = $2/$50 + g g = 0.12 = 12% b. P 0 = D 1 /(k – g) = $2/(0.16 – 0.05) = $18.18 The price falls in response to the more pessimistic dividend forecast. The forecast for current year earnings, however, is unchanged. Therefore, the P/E ratio falls. The lower P/E ratio is evidence of the diminished optimism concerning the firm's growth prospects.
Transcript
Chapter 18 - Equity Valuation Models
18-1
CHAPTER 18: EQUITY VALUATION MODELS
PROBLEM SETS
1. Theoretically, dividend discount models can be used to value the stock of rapidly
growing companies that do not currently pay dividends; in this scenario, we would be
valuing expected dividends in the relatively more distant future. However, as a practical
matter, such estimates of payments to be made in the more distant future are notoriously
inaccurate, rendering dividend discount models problematic for valuation of such
companies; free cash flow models are more likely to be appropriate. At the other
extreme, one would be more likely to choose a dividend discount model to value a
mature firm paying a relatively stable dividend.
2. It is most important to use multi-stage dividend discount models when valuing
companies with temporarily high growth rates. These companies tend to be companies in
the early phases of their life cycles, when they have numerous opportunities for
reinvestment, resulting in relatively rapid growth and relatively low dividends (or, in
many cases, no dividends at all). As these firms mature, attractive investment
opportunities are less numerous so that growth rates slow.
3. The intrinsic value of a share of stock is the individual investor’s assessment of the true
worth of the stock. The market capitalization rate is the market consensus for the
required rate of return for the stock. If the intrinsic value of the stock is equal to its price,
then the market capitalization rate is equal to the expected rate of return. On the other
hand, if the individual investor believes the stock is underpriced (i.e., intrinsic value <
price), then that investor’s expected rate of return is greater than the market
capitalization rate.
4. a. k = D1/P0 + g
0.16 = $2/$50 + g g = 0.12 = 12%
b. P0 = D1/(k – g) = $2/(0.16 – 0.05) = $18.18
The price falls in response to the more pessimistic dividend forecast. The
forecast for current year earnings, however, is unchanged. Therefore, the P/E
ratio falls. The lower P/E ratio is evidence of the diminished optimism
concerning the firm's growth prospects.
Chapter 18 - Equity Valuation Models
18-2
5. a. g = ROE b = 16% 0.5 = 8%
D1 = $2(1 – b) = $2(1 – 0.5) = $1
P0 = D1/(k – g) = $1/(0.12 – 0.08) = $25
b. P3 = P0(1 + g)3 = $25(1.08)
3 = $31.49
6. a. k = rf + (rM) – rf ] = 6% + 1.25(14% – 6%) = 16%
g = 2/3 9% = 6%
D1 = E0(1 + g) (1 – b) = $3(1.06) (1/3) = $1.06
60$10.0.060.16
$1.06
gk
DP 1
0
b. Leading P0/E1 = $10.60/$3.18 = 3.33
Trailing P0/E0 = $10.60/$3.00 = 3.53
c. 275.9$16.0
18.3$60.10$
k
EPPVGO 1
0
The low P/E ratios and negative PVGO are due to a poor ROE (9%) that is less
than the market capitalization rate (16%).
d. Now, you revise b to 1/3, g to 1/3 9% = 3%, and D1 to:
E0 1.03 (2/3) = $2.06
Thus:
V0 = $2.06/(0.16 – 0.03) = $15.85
V0 increases because the firm pays out more earnings instead of reinvesting a poor
ROE. This information is not yet known to the rest of the market.
7. Since beta = 1.0, then k = market return = 15%
Therefore:
15% = D1/P0 + g = 4% + g g = 11%
Chapter 18 - Equity Valuation Models
18-3
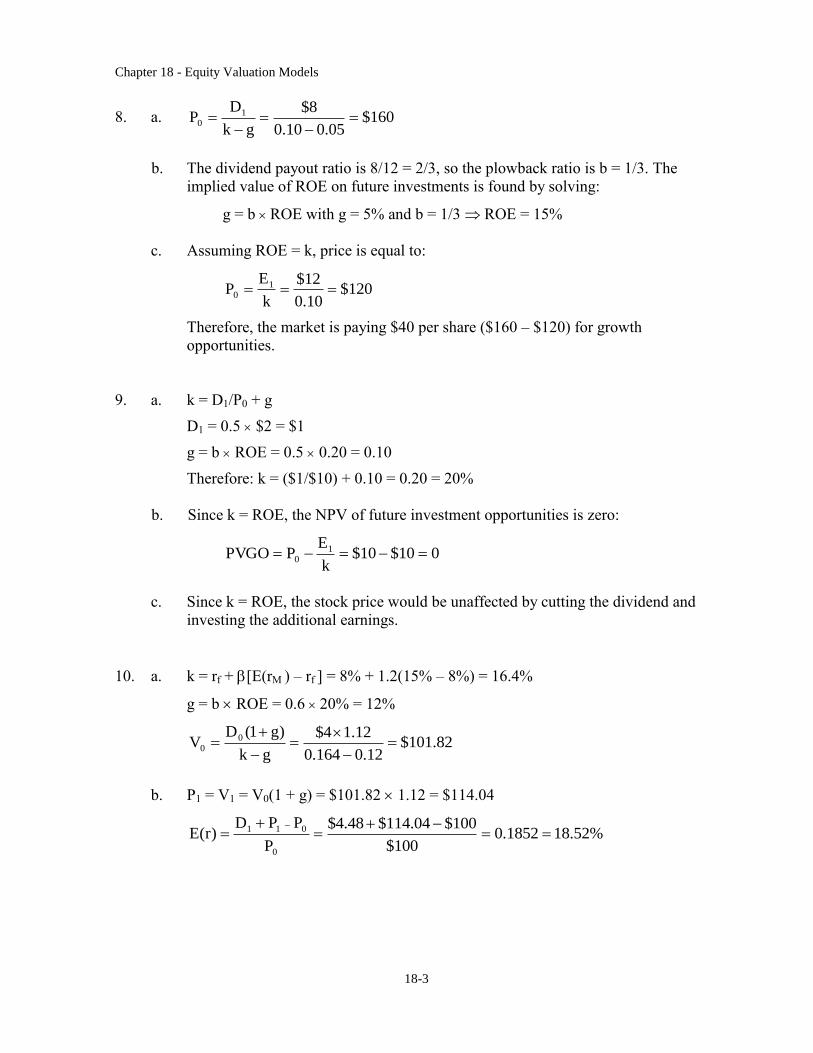
8. a. 160$05.010.0
8$
gk
DP 1
0
b. The dividend payout ratio is 8/12 = 2/3, so the plowback ratio is b = 1/3. The
implied value of ROE on future investments is found by solving:
g = b ROE with g = 5% and b = 1/3 ROE = 15%
c. Assuming ROE = k, price is equal to:
120$10.0
12$
k
EP 1
0
Therefore, the market is paying $40 per share ($160 – $120) for growth
opportunities.
9. a. k = D1/P0 + g
D1 = 0.5 $2 = $1
g = b ROE = 0.5 0.20 = 0.10
Therefore: k = ($1/$10) + 0.10 = 0.20 = 20%
b. Since k = ROE, the NPV of future investment opportunities is zero:
010$10$k
EPPVGO 1
0
c. Since k = ROE, the stock price would be unaffected by cutting the dividend and
investing the additional earnings.
10. a. k = rf +[E(rM ) – rf ] = 8% + 1.2(15% – 8%) = 16.4%
g = b ROE = 0.6 20% = 12%
82.101$12.0164.0
12.14$
gk
)g1(DV 0
0
b. P1 = V1 = V0(1 + g) = $101.82 1.12 = $114.04
%52.181852.0100$
100$04.114$48.4$
P
PPD)r(E
0
011
Chapter 18 - Equity Valuation Models
18-4
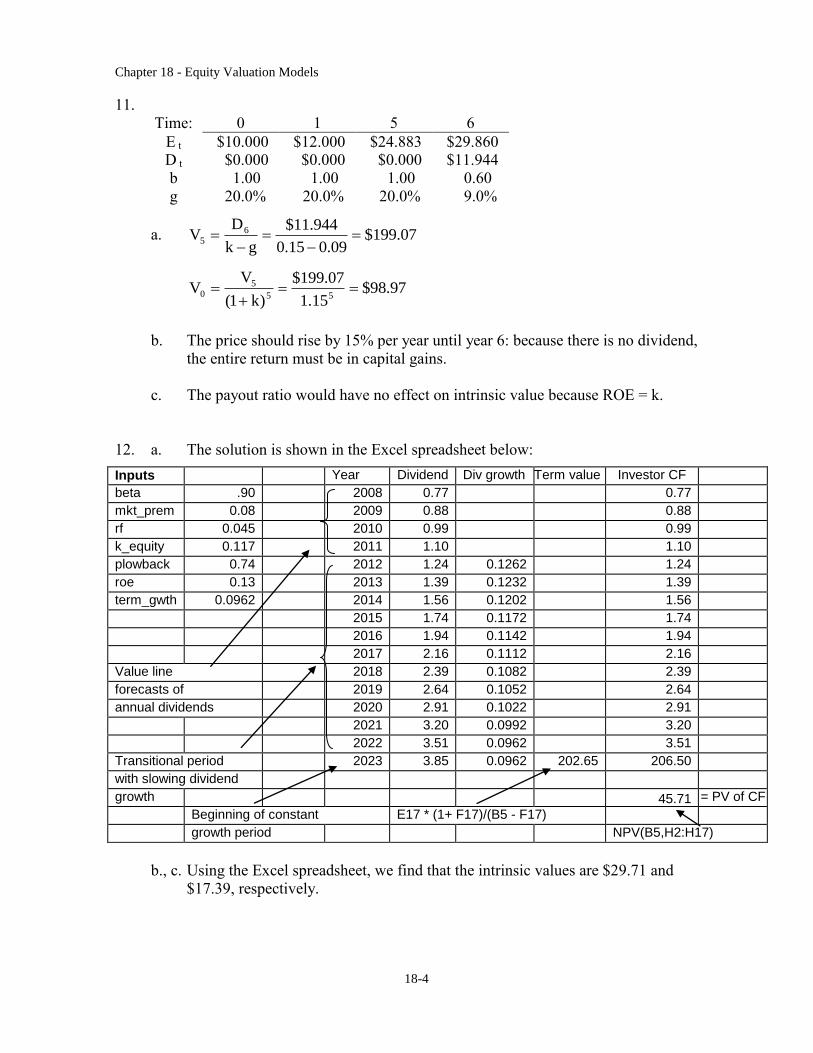
11.
Time: 0 1 5 6
E t $10.000 $12.000 $24.883 $29.860 D t $0.000 $0.000 $0.000 $11.944
b 1.00 1.00 1.00 0.60
g 20.0% 20.0% 20.0% 9.0%
a. 07.199$09.015.0
944.11$
gk
DV 6
5
97.98$15.1
07.199$
)k1(
VV
55
50
b. The price should rise by 15% per year until year 6: because there is no dividend,
the entire return must be in capital gains.
c. The payout ratio would have no effect on intrinsic value because ROE = k.
12. a. The solution is shown in the Excel spreadsheet below:
Inputs Year Dividend Div growth Term value Investor CF
beta .90
2008 0.77 0.77
mkt_prem 0.08 2009 0.88 0.88
rf 0.045 2010 0.99 0.99
k_equity 0.117 2011 1.10 1.10
plowback 0.74 2012 1.24 0.1262 1.24
roe 0.13 2013 1.39 0.1232 1.39
term_gwth 0.0962 2014 1.56 0.1202 1.56
2015 1.74 0.1172 1.74
2016 1.94 0.1142 1.94
2017 2.16 0.1112 2.16
Value line 2018 2.39 0.1082 2.39
forecasts of 2019 2.64 0.1052 2.64
annual dividends 2020 2.91 0.1022 2.91
2021 3.20 0.0992 3.20
2022 3.51 0.0962 3.51
Transitional period 2023 3.85 0.0962
202.65 206.50
with slowing dividend
growth 45.71
= PV of CF
Beginning of constant E17 * (1+ F17)/(B5 - F17)
growth period NPV(B5,H2:H17)
b., c. Using the Excel spreadsheet, we find that the intrinsic values are $29.71 and
$17.39, respectively.
Chapter 18 - Equity Valuation Models
18-5
13. The solutions derived from Spreadsheet 18.2 are as follows:
Intrinsic value:
FCFF
Intrinsic value:
FCFE
Intrinsic value
per share: FCFF
Intrinsic value
per share: FCFE
a. 81,171 68,470 36.01 37.83
b. 59,961 49,185 24.29 27.17
c. 69,813 57,913 29.73 32.00
14.
Time: 0 1 2 3
D t $1.0000 $1.2500 $1.5625 $1.953125 g 25.0% 25.0% 25.0% 5.0%
a. The dividend to be paid at the end of year 3 is the first installment of a dividend
stream that will increase indefinitely at the constant growth rate of 5%. Therefore, we
can use the constant growth model as of the end of year 2 in order to calculate intrinsic
value by adding the present value of the first two dividends plus the present value of