Chapter 2 - Basic Concepts of Movement Data Natalia Andrienko 1 , Gennady Andrienko 1 , Nikos Pelekis 2 , and Stefano Spaccapietra 3 1 Fraunhofer Institute, Germany {gennady.andrienko, natalia.andrienko} @iais.fraunhofer.de 2 Computer Technology Institute (CTI) and Department of Informatics, University of Piraeus, Greece [email protected]3 Database laboratory, ´ Ecole Polytechnique F´ ed´ erale de Lausanne, Switzerland [email protected]1 Introduction Perhaps, ever since people exist, they have observed various moving entities, from insects and fishes to planets and stars, and investigated their movement behaviours. While methods that were used in earlier times for observation, measurement, recording, and analysis of movements are very different from modern technologies, there is still much to learn from past studies. First, this is the thorough attention paid to the multiple aspects of movement. These include not only the trajectory (path) in space, characteristics of motion itself such as speed and direction, and their dynamics over time but also character- istics and activities of the entities that move. Second, this is the striving to relate movements to properties of their surroundings and to various phenom- ena and events. As an illustration, let us take the famous depiction of Napoleon’s march on Moscow published by Charles Joseph Minard in 1861 (this representation is reproduced in Fig. 1; a detailed description can be found in Tufte [15]). The author engages the readers in the exploration of the fate of Napoleon’s army in the Russian campaign of 1812-1813. Beginning at the Polish-Russian border, the thick band shows the size of the army at each position. The path of Napoleon’s retreat from Moscow in the cold winter is depicted by the dark lower band, which is tied to temperature and time scales. Tufte [15] identified six separate variables that were shown within Minards drawing. First, the line width continuously marked the size of the army. Second and third, the line itself showed the latitude and longitude of the army as it moved. Fourth, the lines themselves showed the direction that the army was travelling, both in advance and retreat. Fifth, the location of the army with respect to certain dates was marked. Finally, the temperature along the path of retreat was displayed. It can also be noted that, despite of the schematic character of the
Transcript
Chapter 2 - Basic Concepts of Movement Data
Natalia Andrienko1, Gennady Andrienko1, Nikos Pelekis2, and StefanoSpaccapietra3
1 Fraunhofer Institute, Germany {gennady.andrienko, natalia.andrienko}@iais.fraunhofer.de
2 Computer Technology Institute (CTI) and Department of Informatics,University of Piraeus, Greece [email protected]
3 Database laboratory, Ecole Polytechnique Federale de Lausanne, [email protected]
1 Introduction
Perhaps, ever since people exist, they have observed various moving entities,from insects and fishes to planets and stars, and investigated their movementbehaviours. While methods that were used in earlier times for observation,measurement, recording, and analysis of movements are very different frommodern technologies, there is still much to learn from past studies. First, thisis the thorough attention paid to the multiple aspects of movement. Theseinclude not only the trajectory (path) in space, characteristics of motion itselfsuch as speed and direction, and their dynamics over time but also character-istics and activities of the entities that move. Second, this is the striving torelate movements to properties of their surroundings and to various phenom-ena and events.
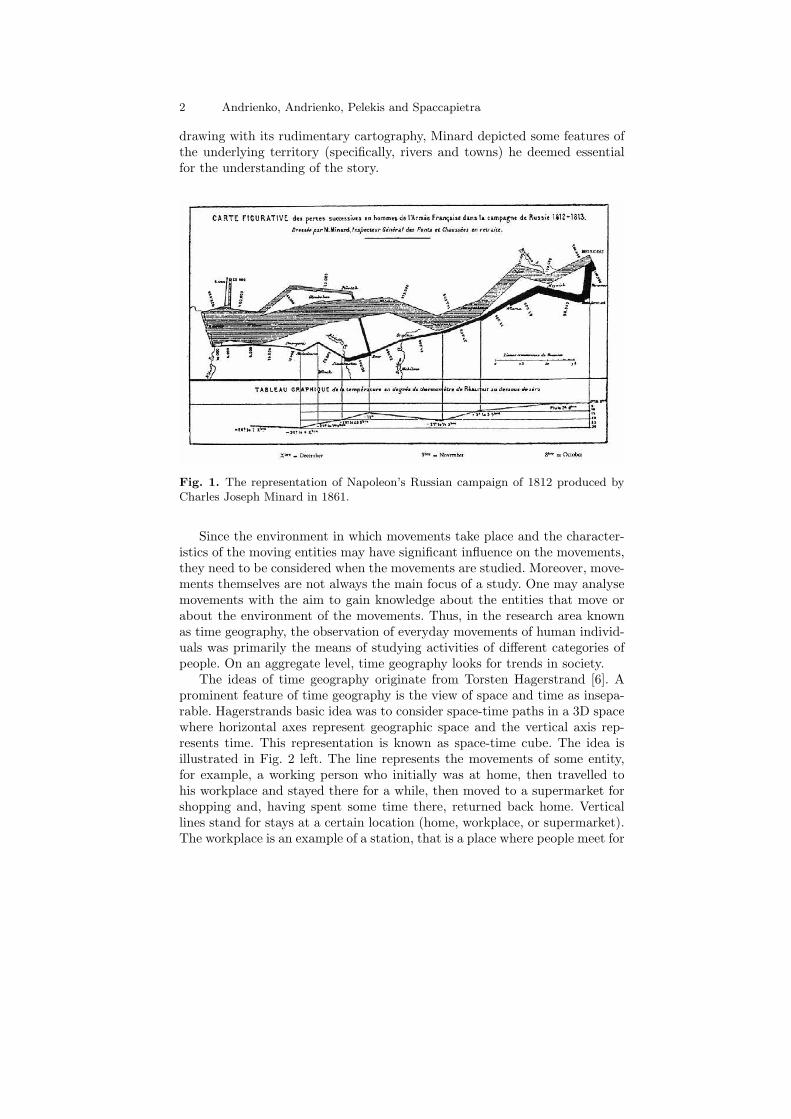
As an illustration, let us take the famous depiction of Napoleon’s marchon Moscow published by Charles Joseph Minard in 1861 (this representationis reproduced in Fig. 1; a detailed description can be found in Tufte [15]).The author engages the readers in the exploration of the fate of Napoleon’sarmy in the Russian campaign of 1812-1813. Beginning at the Polish-Russianborder, the thick band shows the size of the army at each position. The pathof Napoleon’s retreat from Moscow in the cold winter is depicted by the darklower band, which is tied to temperature and time scales. Tufte [15] identifiedsix separate variables that were shown within Minards drawing. First, the linewidth continuously marked the size of the army. Second and third, the lineitself showed the latitude and longitude of the army as it moved. Fourth, thelines themselves showed the direction that the army was travelling, both inadvance and retreat. Fifth, the location of the army with respect to certaindates was marked. Finally, the temperature along the path of retreat wasdisplayed. It can also be noted that, despite of the schematic character of the
2 Andrienko, Andrienko, Pelekis and Spaccapietra
drawing with its rudimentary cartography, Minard depicted some features ofthe underlying territory (specifically, rivers and towns) he deemed essentialfor the understanding of the story.
Fig. 1. The representation of Napoleon’s Russian campaign of 1812 produced byCharles Joseph Minard in 1861.
Since the environment in which movements take place and the character-istics of the moving entities may have significant influence on the movements,they need to be considered when the movements are studied. Moreover, move-ments themselves are not always the main focus of a study. One may analysemovements with the aim to gain knowledge about the entities that move orabout the environment of the movements. Thus, in the research area knownas time geography, the observation of everyday movements of human individ-uals was primarily the means of studying activities of different categories ofpeople. On an aggregate level, time geography looks for trends in society.
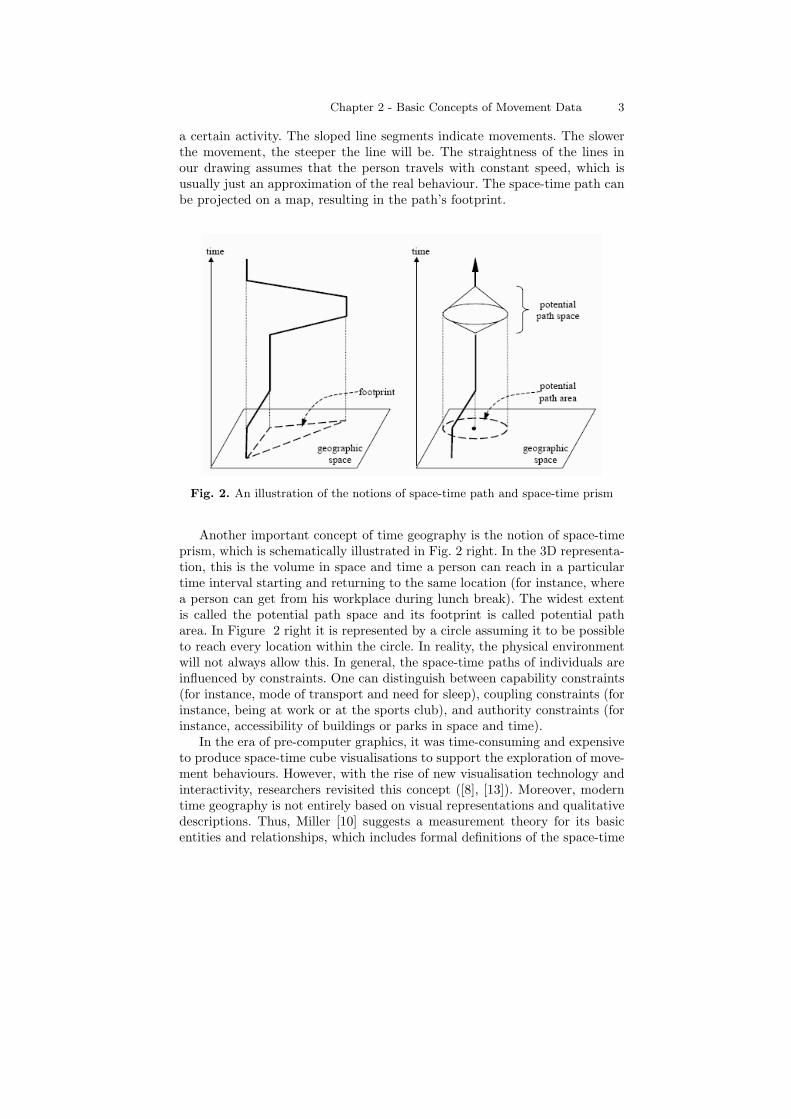
The ideas of time geography originate from Torsten Hagerstrand [6]. Aprominent feature of time geography is the view of space and time as insepa-rable. Hagerstrands basic idea was to consider space-time paths in a 3D spacewhere horizontal axes represent geographic space and the vertical axis rep-resents time. This representation is known as space-time cube. The idea isillustrated in Fig. 2 left. The line represents the movements of some entity,for example, a working person who initially was at home, then travelled tohis workplace and stayed there for a while, then moved to a supermarket forshopping and, having spent some time there, returned back home. Verticallines stand for stays at a certain location (home, workplace, or supermarket).The workplace is an example of a station, that is a place where people meet for
Chapter 2 - Basic Concepts of Movement Data 3
a certain activity. The sloped line segments indicate movements. The slowerthe movement, the steeper the line will be. The straightness of the lines inour drawing assumes that the person travels with constant speed, which isusually just an approximation of the real behaviour. The space-time path canbe projected on a map, resulting in the path’s footprint.
Fig. 2. An illustration of the notions of space-time path and space-time prism
Another important concept of time geography is the notion of space-timeprism, which is schematically illustrated in Fig. 2 right. In the 3D representa-tion, this is the volume in space and time a person can reach in a particulartime interval starting and returning to the same location (for instance, wherea person can get from his workplace during lunch break). The widest extentis called the potential path space and its footprint is called potential patharea. In Figure 2 right it is represented by a circle assuming it to be possibleto reach every location within the circle. In reality, the physical environmentwill not always allow this. In general, the space-time paths of individuals areinfluenced by constraints. One can distinguish between capability constraints(for instance, mode of transport and need for sleep), coupling constraints (forinstance, being at work or at the sports club), and authority constraints (forinstance, accessibility of buildings or parks in space and time).
In the era of pre-computer graphics, it was time-consuming and expensiveto produce space-time cube visualisations to support the exploration of move-ment behaviours. However, with the rise of new visualisation technology andinteractivity, researchers revisited this concept ([8], [13]). Moreover, moderntime geography is not entirely based on visual representations and qualitativedescriptions. Thus, Miller [10] suggests a measurement theory for its basicentities and relationships, which includes formal definitions of the space-time
4 Andrienko, Andrienko, Pelekis and Spaccapietra
path, space-time prism, space-time stations as well as fundamental relation-ships between space-time paths and prisms. This provides foundations forbuilding computational tools for time geographic querying and analysis.
Whatever tools and technologies have been used for the collection, repre-sentation, exploration, and analysis of movement data, the underlying basicconcepts related to the very nature of movement in (geographical) space re-main stable and the characteristics of movement examined in past studiesdo not lose their relevance. In Section 2, we present a synthesis from exist-ing literature concerning the basic concepts and characteristics of movement.Movement occurs in space and in time; so we discuss the possible ways ofspatial and temporal referencing and relevant properties of space and time.We also briefly mention other matters that may have an impact on movementand therefore need attention in analysis. These include properties and activi-ties of moving entities and various space- and/or time-related phenomena andevents.
Data analysis is seeking answers to various questions about data. In Sec-tion 3, we define the types of questions that can arise in analysis of movementdata. For the question types to be independent of any analysis methods andtools, we define them on the basis of an abstract model of movement data,which involves three fundamental components: population of entities, time,and space. We distinguish between elementary questions, which refer to in-dividual data items, and synoptic questions, which refer to the data as awhole or to data subsets considered in their entirety. Synoptic questions playthe primary role in data analysis. At the end, we relate the tool-independenttaxonomy of analytical questions to the established typology of data miningtasks.
2 Movement data and their characteristics
This section presents a synthesis from the current literature talking aboutmovement and movement data: what is movement? How can movement bereflected in data? How can movement be characterised? What does it dependon?
2.1 Trajectories
A strict definition of movement relates this notion to change in the physicalposition of an entity with respect to some reference system within which onecan assess positions. Most frequently, the reference system is geographicalspace.
A trajectory is the path made by the moving entity through the spacewhere it moves. The path is never made instantly but requires a certainamount of time. Therefore, time is an inseparable aspect of a trajectory’. Thisis emphasised in the term ‘space-time path’ [6][10][11], one of the synonyms
Chapter 2 - Basic Concepts of Movement Data 5
for ‘trajectory’. Another well-known term, ‘geospatial lifeline’ introduced byHornsby and Egenhofer [7], also refers to time although less explicitly (throughthe notion of ‘life’).
If t0 is the time moment when the path started and tend is the momentwhen it ended, for any moment ti between t0 and tend there is a position inspace that was occupied by the entity at this moment (although in practicethis position is not always known). Hence, a trajectory can be viewed as afunction that matches time moments with positions in space. It can also beseen as consisting of pairs (time, location). Since time is continuous, there arean infinite number of such pairs in a trajectory. For practical reasons, how-ever, trajectories have to be represented by finite sequences of time-referencedlocations. Such sequences may result from various ways used to observe move-ments and collect movement data:
• time-based recording: positions of entities are recorded at regularly spacedtime moments, e.g. every 5 minutes;
• change-based recording: a record is made when the position of an entitydiffers from the previous one;
• location-based recording: records are made when an entity comes close tospecific locations, e.g. where sensors are installed;
• event-based recording: positions and times are recorded when certainevents occur, in particular, activities performed by the moving entity (e.g.calling by a mobile phone);
• various combinations of these basic approaches.
Typically, positions are measured with uncertainty. Sometimes it is pos-sible to refine the positions taking into account physical constraints, e.g. thestreet network.
In studying movements, an analyst attends to a number of characteristics,which can be grouped depending on whether they refer to states at individualmoments or to movements over time intervals. Moment-related characteristicsinclude:
• time, i.e. position of this moment on the time scale;• position of the entity in space;• direction of the entity’s movement;• speed of the movement (which is zero when the entity stays in the same
place);• change of the direction (turn);• change of the speed (acceleration);• accumulated travel time and distance.
Overall characteristics of a trajectory as a whole or a trajectory fragmentmade during a subinterval [t1, t2] of the entire time span [t0, tend] include:
• geometric shape of the trajectory (fragment) in the space;• travelled distance, i.e. the length of the trajectory (fragment) in space;
6 Andrienko, Andrienko, Pelekis and Spaccapietra
• duration of the trajectory (fragment) in time;• movement vector (i.e. from the initial to the final position), or major di-
rection;• mean, median, and maximal speed;• dynamics (behaviour) of the speed:
– periods of constant speed, acceleration, deceleration, and stillness;– characteristics of these periods: start and end times, duration, initial
and final positions, initial and final speeds, etc.;– arrangement (order) of these periods in time;
• dynamics (behaviour) of the directions:– periods of straight, curvilinear, circular movement;– characteristics of these periods: start and end times, initial and final
positions and directions, major direction, angles and radii of the curves,etc.;
– major turns (‘turning points’) with their characteristics: time, position,angle, initial and final directions, and speed of the movement in themoment of the turn;
– arrangement (order) of the periods and turning points in time.
Besides examining a single trajectory, an analyst is typically interested incomparison of two or more trajectories. These may be trajectories of differ-ent entities (e.g. different persons), trajectories of the same entity made atdifferent times (e.g. trajectories of a person on different days), or differentfragments of the same trajectory (e.g. trajectories of a person on the wayfrom home to the workplace and on the way back). Generally, the goal ofcomparison is to establish relations between the objects that are compared.Here are some examples of possible relations:
• equality or inequality;• order (less or greater, earlier or later, etc.);• distance (in space, in time, or on any numeric scale);• topological relations (inclusion, overlapping, crossing, touching, etc.).
Many other types of relations may be of interest, depending on the natureof the things being compared. In comparing trajectories, analysts are mostoften interested in establishing the following types of relations:
• similarity or difference of the overall characteristics of the trajectories,which have been listed above (i.e. shapes, travelled distances, durations,dynamics of speed and directions, and so on);
• spatial and temporal relations:– co-location in space, full or partial (i.e. the trajectories consist of the
same positions or have some positions in common):· ordered co-location: the common positions are attained in the same
order;· unordered co-location: the common positions are attained in differ-
ent orders;
Chapter 2 - Basic Concepts of Movement Data 7
– co-existence in time, full or partial (i.e. the trajectories are made duringthe same time period or the periods overlap);
– co-incidence in space and time, full or partial (i.e. same positions areattained at the same time);
– lagged co-incidence, i.e. entity e1 attains the same positions as entitye0 but after a time delay ∆t;
– distances in space and in time.
Most researchers dealing with movement data agree in recognising thenecessity to consider not only trajectories with their spatial and temporalcharacteristics but also the structure and properties of the space and timewhere the movement takes place as having a great impact upon the movementbehaviour. The concepts and characteristics related to space and time arebriefly discussed below.
2.2 Space
Space can be seen as a set consisting of locations, or places. An importantproperty of space is the existence of distances between its elements. At thesame time, space has no natural origin and no natural ordering between theelements. Therefore, in order to distinguish positions in space, one needs tointroduce in it some reference system, for example, a system of coordinates.While this may be done, in principle, quite arbitrarily, there are some estab-lished reference systems such as geographical coordinates.
Depending on the practical needs, one can treat space as two-dimensional(i.e. each position is defined by a pair of coordinates) or as three-dimensional(each position is defined by a triple of coordinates). In specific cases, space canbe viewed as one-dimensional. For example, when movement along a standardroute is analysed, one can define positions through the distances from thebeginning of the route, i.e. a single coordinate is sufficient.
Theoretically, one can also deal with spaces having more than three di-mensions. Such spaces are abstract rather than physical; however, movementsof entities in abstract spaces may also be subject to analysis. Thus, Laubeet al. [9] explore the movement (evolution) of the districts of Switzerland inthe abstract space of politics and ideology involving three dimensions: left vs.right, liberal vs. conservative, and ecological vs. technocratic.
The physical space is continuous, which means that it consists of an infinitenumber of locations and, moreover, for any two different locations there arelocations ”in between”, i.e. at smaller distances to each of the two locationsthan the distance between the two locations. However, it may also be usefulto treat space as a discrete or even finite set of locations. For example, instudying the movement of tourists over a country or a city, one can ”reduce”space to the set of points of interest visited by the tourists. Space discretisationmay be even indispensable, in particular, when positions of entities cannot be
8 Andrienko, Andrienko, Pelekis and Spaccapietra
measured precisely and are specified in terms of areas such as cells of a mobilephone network, city districts, or countries.
The above-cited examples show that space may be structured, in particular,divided into areas. The division may be hierarchical; for instance, a country isdivided into provinces, the provinces into municipalities, and the municipali-ties into districts. Areas can also be derived from a geometric decomposition(e.g. 1sq.km. cells), with no semantics associated to the decomposition. Astreet (road) network is another common way of structuring physical space.
Like coordinate systems, space structuring also provides a reference sys-tem, which may be used for distinguishing positions, for instance, by referringto streets or road fragments and relative positions on them (house numbersor distances from the ends). The possible ways of specifying positions in spacecan be summarised as follows:
• coordinate-based referencing: positions are specified as tuples of numbersrepresenting linear or angular distances to certain chosen axes or angles;
• division-based referencing: referring to compartments of an accepted geo-metric or semantic-based division of the space, possibly, hierarchical;
• linear referencing: referring to relative positions along linear objects suchas streets, roads, rivers, pipelines, etc.; for example, street names plushouse numbers or road codes plus distances from one of the ends.
Since it is often the case that positions of entities cannot be determinedaccurately, they may be represented in data with uncertainty, for example, asareas instead of points.
Sometimes, an analyst is not so much interested in absolute positions inspace as in relative positions with regard to a certain place. For example, theanalyst may study where a person travels with regard to his/her home ormovements of spectators to and from a cinema or a stadium. In such cases,it is convenient to define positions in terms of distances and directions fromthe reference place (or, in other words, by means of polar coordinates). Thedirections can be defined as angles from some base direction or geographically:north, northwest, and so on.
Comprehensive analysis may require consideration of the same data withindifferent systems of spatial referencing and, hence, transformation of one ref-erence system to another: geographical coordinates to polar (with various ori-gins), coordinate-based referencing to division-based or network-based, etc.
It may also be useful to disregard the spatial positions of locations andconsider them from the perspective of their domain-specific semantics, e.g.home, workplace, shopping place, etc.
It should be noted that space (in particular, physical space) is not uniformbut heterogeneous, and its properties vary from place to place. These prop-erties may have a great impact on movement behaviours and, hence, shouldbe taken into account in analysis. The relevant characteristics of individuallocations include:
Chapter 2 - Basic Concepts of Movement Data 9
• altitude, slope, aspect and other characteristics of the terrain;• accessibility with regard to various constraints (obstacles, availability of
roads, etc.);• character and properties of the surface: land or water, concrete or soil,
forest or field, etc.;• objects present in a location: buildings, trees, monuments, etc.;• function or way of use, e.g. housing, shopping, industry, agriculture, or
transportation;• activity-based semantics, e.g. home, work, shopping, leisure, and so on.
When locations are defined as space compartments (i.e. areas in two-dimensional space or volumes in three-dimensional space) or network elementsrather than points, the relevant characteristics also include:
• spatial extent and shape;• capacity, i.e. the number of entities the location can simultaneously con-
tain;• homogeneity or heterogeneity of properties (listed above) over the com-
partment.
It should be noted that properties of locations may change over time.For example, a location may be accessible on weekdays and inaccessible onweekends; a town square may be used as a marketplace in the morning hours;a road segment may be blocked or its capacity reduced because of an accidentor reparation works.
Similarly to space, there are different ways of defining positions in time,and time may also be heterogeneous in terms of properties of time momentsand intervals.
2.3 Time
Mathematically, time is a continuous set with a linear ordering and distancesbetween the elements, where the elements are moments, or positions in time.Analogously to positions in space, some reference system is needed for thespecification of moments in data. In most cases, temporal referencing is doneon the basis of the standard Gregorian calendar and the standard division ofa day into hours, hours into minutes, and so on. The time of the day may bespecified according to the time zone of the place where the data are collectedor as Greenwich Mean Time (GMT). There are cases, however, when datarefer to relative time moments, e.g. the time elapsed from the beginning of aprocess or observation, or abstract time stamps specified as numbers 1, 2, andso on. Unlike the physical time, abstract times are not necessarily continuous.
Like positions in space, moments may be specified imprecisely, i.e. as in-tervals rather than points in time. But even when data refer to points, theyare indispensably imprecise: since time is continuous, the data cannot refer toevery possible point. For any two successive moments t1 and t2 referred to in
10 Andrienko, Andrienko, Pelekis and Spaccapietra
the data there are moments in between for which there are no data. Therefore,one cannot know definitely what happened between t1 and t2 but can onlyestimate this by means of interpolation.
Physical time is not only a linear sequence of moments but includes in-herent cycles resulting from the earths daily rotation and annual revolution.These natural cycles are reflected in the standard method of time referencing:the dates are repeated in each year and the times in each day. Besides thesenatural cycles, there are also cycles related to people’s activities, for example,the weekly cycle. Various domain- and problem-specific cycles exist as well,for example, the revolution periods of the planets in astronomy or the cyclesof the movement of buses or local trains on standard routes.
Temporal cycles may be nested; in particular, the daily cycle is nestedwithin the annual cycle. Hence, time can be viewed as a hierarchy of nested cy-cles. Several alternative hierarchies may exist, for example, year/month/day-in-month and year/week-in-year/day-in-week.
It is very important to know which temporal cycles are relevant to themovements under study and to take these cycles properly into account in theanalysis. For this purpose, it is necessary that the cycles were reflected intemporal references of the data items. Typically, this is done through speci-fying the cycle number and the position from the beginning of the cycle. Infact, the standard references to dates and times of the day are built accordingto this principle. However, besides the standard references to the yearly anddaily cycles, references to other (potentially) relevant cycles, e.g. the weeklycycle of people’s activities or the cycles of the movement of satellites, may benecessary or useful. Hence, an analyst may need to transform the standardreferences into references in terms of alternative time hierarchies.
Temporal cycles may have variable periods. For example, the cycle of ElNino and La Nina climatic events, which influences the movement of air andwater masses in the Pacific Ocean, has an average return period of four anda half years but can recur as little as two or as much as ten years apart.In order to make data related to different cycles comparable, one needs to”standardise” somehow the time references, for example, divide the absolutetime counts from the beginning of a cycle by the length of this cycle.
Transformation of absolute time references to relative is also useful when itis needed to compare movements that start at different times and/or proceedwith different speeds. The relative time references would in this case be thetime counts from the beginning of each movement, possibly, standardised inthe way of dividing them by the duration of the movement.
As we have noted, the properties of time moments and intervals may vary,and this variation may have significant influence on movements. For example,the movements of people on weekdays notably differ from the movements onweekends; moreover, the movements on Fridays differ from those on Mondaysand the movements on Saturdays from those on Sundays. In this example, wehave a case of a regular difference between positions within a cycle. Anotherexample of the same kind is the difference between times of a day: morning,
Chapter 2 - Basic Concepts of Movement Data 11
midday, evening, and night. However, the regularity in the variation of proper-ties of time moments may be disrupted, for example, by an intrusion of publicholidays. Not only the intrusions themselves but also the preceding and/orfollowing times may be very different from the ”normal” time; think, for ex-ample, of the days before and after Christmas. Such irregular changes shouldalso be taken into account in the analysis of time-dependent phenomena, inparticular, movements.
The regularity of changes may itself vary, in particular, owing to interac-tions between larger and smaller temporal cycles. Thus, the yearly variationof the duration of daylight has an impact on the properties of times of aday, which, in turn, influence movements of people and animals. In the re-sults, movements at the same time of the day in summer and in winter maysubstantially differ.
Typically, the heterogeneity of properties of time is not explicitly reflectedin data and, hence, cannot be automatically taken into account in data anal-ysis. Much depends on the analyst’s ability to involve his/her backgroundknowledge. Hence, the methods and tools used for the analysis must allow theanalyst to do this.
2.4 Moving entities and their activities
Like locations in space and moments in time, the entities that move have theirown characteristics, which may influence the movement and, hence, need to betaken into account in the analysis. Thus, the movements of people may greatlydepend on their occupation, age, health condition, marital status, and otherproperties. It is also relevant whether an entity moves by itself or by meansof some vehicle. The way and means of the movement pose their constraintson the possible routes and other characteristics of the movement.
People are an example of entities that typically move purposely. The pur-poses determine the routes and may also influence the other characteristics,in particular, the speed. For other types of entities, for example, tornadoesor elementary particles, one needs to attend to the causes of the movementrather than the purposes.
Movement characteristics may also depend on the activities performed bythe entities during their movement. For example, the movement of a person ina shop differs from the movement on a street or in a park. The characteristicsof the movement may change when the person starts speaking by a mobilephone.
2.5 Related phenomena and events
Any movement occurs in some environment and is subject to the influencesfrom various events and phenomena taking place in this environment. Thus,Minard included a graph of winter temperatures in his depiction of Napoleon’sRussian campaign since he was sure that the temperatures produced a great
12 Andrienko, Andrienko, Pelekis and Spaccapietra
influence on the movement and fate of the army. Movements of people areinfluenced by the climate and current weather, by sport and cultural events,by legal regulations and established customs, by road tolls and oil prices,by shopping actions and traffic accidents, and so on. In order to detect suchinfluences or to take them into account in movement data analysis, the analystneeds to involve additional data and/or background knowledge.
We have reviewed thus far what characteristics and aspects of movementare considered in the analysis of movement data and what other types infor-mation are relevant. However, we did not define what it means, ”to analysemovement data”, and for what purposes such an analysis is done. Let us nowtry to do this.
3 Analytical questions
One can hardly find a strict definition of the term ”data analysis” in hand-books or research literature. However, most of the writers agree in the viewof data analysis as an iterative process consisting of the following activities:
• formulate questions;• choose analysis methods;• prepare the data for application of the methods;• apply the methods to the data;• interpret and evaluate the results obtained.
In short, data analysis is formulating questions and seeking answers. Inthis section, we try to define the types of questions that can arise in analysisof movement data. Examples of various questions concerning moving entitiescan be easily found in literature, for instance, in (Guting and Schneider [5]).
• How often do animals stop?• Which routes are regularly used by trucks?• Did the trucks with dangerous goods come close to a high-risk facility?• Were any two planes close to a collision?• Find ”strange” movements of ships, indicating illegal dumping of waste.
However, we did not find a systematic taxonomy of the types of questionsrelevant to the analysis of movement data. Therefore, we try to build sucha taxonomy by applying and adapting the general framework suggested byJacques Bertin [3] and extended by Andrienko and Andrienko [2].
Jacques Bertin is a French cartographer and geographer, who was thefirst in articulating a coherent and reasoned theory for what is now calledInformation Visualisation. Bertin has developed a comprehensive frameworkfor the design of maps and graphics intended for data analysis, where thefunction of a graphic is answering questions. Logically, a part of Bertin’stheory deals with the types of questions that may need to be answered. The
Chapter 2 - Basic Concepts of Movement Data 13
question types, as Bertin defines them, have no specific ”graphical flavour”and no influence of any other method for data representation or analysis.Questions are formulated purely in the ”language” of data, and hence havegeneral relevance. Therefore, we can use Bertin’s framework to define thetypes of questions that arise in analysis of movement data irrespectively ofwhat analysis methods are chosen.
To achieve this independence, we define the question types on the basis ofan abstract view of the structure of movement data, which is presented next.In our typology, we distinguish between elementary questions, which refer toindividual data items, and synoptic questions, which refer to the data as awhole or to data subsets considered in their entirety. Synoptic questions playthe primary role in data analysis. We consider various types of elementaryand synoptic questions. At the end, we relate the tool-independent taxonomyof analytical questions to the established typology of data mining tasks.
3.1 Data structure
According to the general framework, the types of questions are defined on thebasis of the structure of the data under analysis, i.e. what components thedata consist of and how they are related. On an abstract level, movement datacan be viewed as consisting of the three principal components:
• time: a set of moments;• population (this term is used in statistical rather than demographic sense):
a set of entities that move;• space: a set of locations that can be occupied by the entities.
As noted above, a trajectory may be viewed as a function mapping timemoments onto positions in space. Analogously, movement of multiple enti-ties may be seen as a function mapping pairs <time moment, entity> ontopositions. This is a very abstract data model, which is independent of any rep-resentation formalism (of course, there may be other models; for example, adatabase-oriented view would consider the same data as a table of tuples withat least three attributes Entity, Time, and Space). The time and populationof entities play the role of ”independent variables”, or referential components,according to the terminology suggested by Andrienko and Andrienko [2] andthe space plays the role of ”dependent variable”, or characteristic component.
A combination of values of the referential components is called a refer-ence. In our case, a reference is a pair consisting of a time moment and anentity. The set of all possible references is called the reference set. Valuesof the characteristic components corresponding to the references are calledcharacteristics of these references.
As it was mentioned in the previous section, the state of a moving entity ata selected time moment can be characterised not only by its position in spacebut also by additional characteristics such as speed, direction, acceleration,
14 Andrienko, Andrienko, Pelekis and Spaccapietra
etc. These characteristics can be viewed as secondary since they can be derivedfrom the values of the principal components. Nevertheless, we can extendour concept of movement data and see it as a function mapping references<time moment, entity> onto combinations of characteristics (position, speed,direction, ...).
We have also mentioned in the previous section that locations, time mo-ments, and entities may have their own characteristics. For example, locationsmay be characterised by altitude, slope, character of the surface, etc.; entitiesmay be characterised by their kind (people, vehicles, animals, ...), age, gen-der, activity, and so on. Such characteristics are independent of the movement,that is, do not refer to pairs <time moment, entity> but to individual valuesof the three principal components, time, population, and space. Note that thespace plays the role of a referential component for altitude, slope, and so on.The characteristics of time moments, entities, and locations will be furthercalled supplementary characteristics. The characteristics of the pairs <timemoment, entity> (including the secondary ones) will be called characteristicsof movement.
Analytical questions arising in the analysis of movement data address firstof all the references (i.e. times and entities) and the characteristics of move-ment. However, they may also involve supplementary characteristics.
3.2 Elementary and synoptic questions
The types of questions are differentiated first of all according to their level :whether they address individual references or sets of references. Questionsaddressing individual references are called elementary. The term ‘elementary’means that the questions address elements of the reference set. Questionsaddressing sets of references (either the whole reference set or its subsets)are called synoptic. The word ‘synoptic’ is defined in a dictionary (Merriam-Webster [1], p.1197) as follows:
1. affording a general view of a whole2. manifesting or characterized by comprehensiveness or breadth of view3. presenting or taking the same or common view; specifically often capital-
ized : of or relating to the first three Gospels of the New Testament4. relating to or displaying conditions (as of the atmosphere or weather) as
they exist simultaneously over a broad area
The first interpretation is the closest to what we mean by synoptic ques-tions, which assume a general view of a reference (sub)set as a whole, as willbe clear from examples below. Interpretations 2 and 4 are also quite consistentwith our usage of the term.
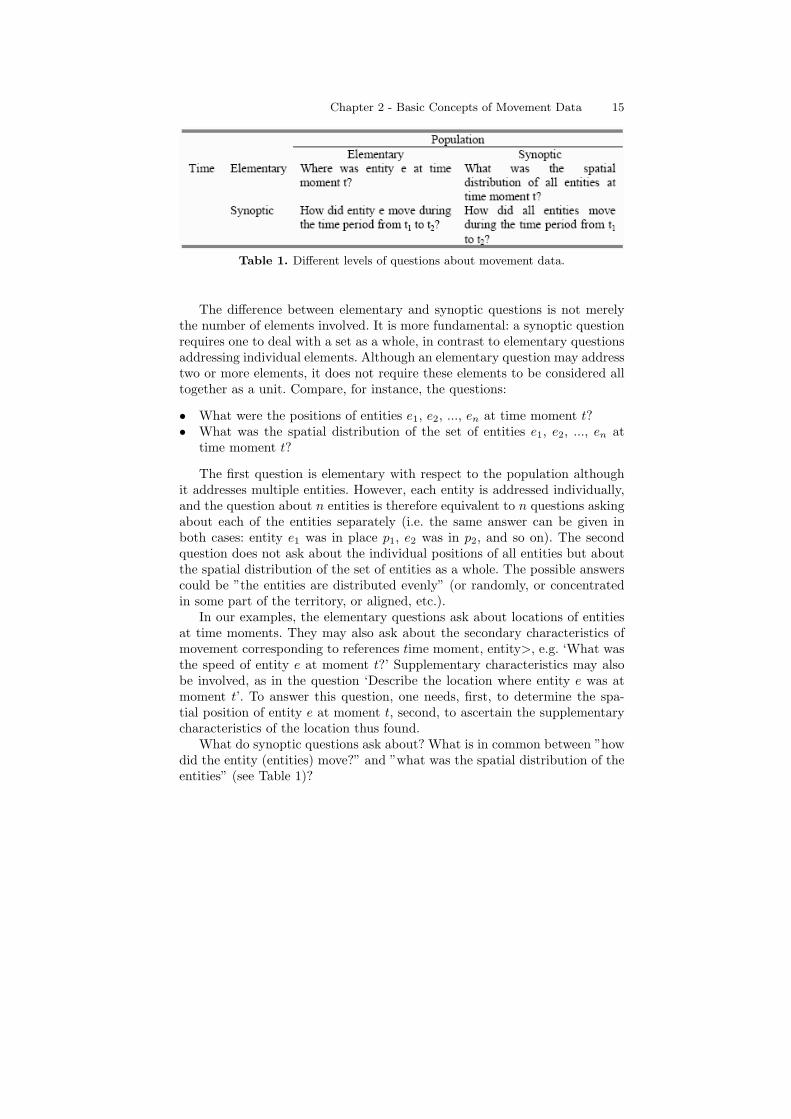
When there are two referential components, like in movement data, a ques-tion may be elementary with respect to one of them and synoptic with respectto the other. Examples are given in Table 1. Note that these examples aretemplates rather than specific questions since they contain slots, or variables.
Chapter 2 - Basic Concepts of Movement Data 15
Table 1. Different levels of questions about movement data.
The difference between elementary and synoptic questions is not merelythe number of elements involved. It is more fundamental: a synoptic questionrequires one to deal with a set as a whole, in contrast to elementary questionsaddressing individual elements. Although an elementary question may addresstwo or more elements, it does not require these elements to be considered alltogether as a unit. Compare, for instance, the questions:
• What were the positions of entities e1, e2, ..., en at time moment t?• What was the spatial distribution of the set of entities e1, e2, ..., en at
time moment t?
The first question is elementary with respect to the population althoughit addresses multiple entities. However, each entity is addressed individually,and the question about n entities is therefore equivalent to n questions askingabout each of the entities separately (i.e. the same answer can be given inboth cases: entity e1 was in place p1, e2 was in p2, and so on). The secondquestion does not ask about the individual positions of all entities but aboutthe spatial distribution of the set of entities as a whole. The possible answerscould be ”the entities are distributed evenly” (or randomly, or concentratedin some part of the territory, or aligned, etc.).
In our examples, the elementary questions ask about locations of entitiesat time moments. They may also ask about the secondary characteristics ofmovement corresponding to references time moment, entity>, e.g. ‘What wasthe speed of entity e at moment t?’ Supplementary characteristics may alsobe involved, as in the question ‘Describe the location where entity e was atmoment t’. To answer this question, one needs, first, to determine the spa-tial position of entity e at moment t, second, to ascertain the supplementarycharacteristics of the location thus found.
What do synoptic questions ask about? What is in common between ”howdid the entity (entities) move?” and ”what was the spatial distribution of theentities” (see Table 1)?
16 Andrienko, Andrienko, Pelekis and Spaccapietra
3.3 Behaviour and pattern
We introduce the notion of behaviour : this is the configuration of characteris-tics corresponding to a given reference (sub)set. The notion of behaviour is ageneralisation of such notions as distribution, variation, trend, dynamics, tra-jectory, etc. In particular, a trajectory of a single entity is a configuration oflocations (possibly, in combination with the secondary characteristics of move-ment) corresponding to a time interval. We say ”configuration” rather than”set” meaning that the characteristics are arranged in accordance with thestructure and properties of the reference (sub)set and the relations betweenits elements. Thus, since a time interval is a continuous linearly ordered set,a trajectory is a continuous sequence of locations ordered according to thetimes they were visited.
The term ”behaviour” is used here in a quite general sense and does notnecessarily mean a process going on in time. Thus, the spatial distribution ofa set of entities at some time moment is also a kind of behaviour although itdoes not involve any temporal variation.
Since a population of entities is a discrete set without natural ordering anddistances between the elements, it does not impose any specific arrangement ofthe corresponding characteristics. Still, the corresponding behaviour is not justa set of characteristics. Thus, one and the same characteristic or combinationof characteristics can occur several times, and these occurrences are treatedas different while in a set each element may occur only once. A behaviour overa set of entities may be hence conceptualised as the frequency distribution ofthe characteristic values over this set of entities.
The absence of natural ordering and distances on a population of entitiesdoes not mean that ordering and distances between entities cannot exist atall. Thus, a set of participants of a military parade is spatially ordered andhas distances between the elements. However, the ordering and distances aredefined in this case on the basis of certain characteristics of the entities, specif-ically, their spatial positions. The characteristics that define ordering and/ordistances between entities can be chosen, in principle, quite arbitrarily. Thus,participants of a parade can also be ordered according to their heights, orweights, or ages. In data analysis, it may be useful to consider different or-derings of the entities and the corresponding arrangements of characteristics.In such cases, the behaviours are not just frequency distributions but morecomplex constructs where characteristic values are positioned according to theordering and/or distances between the entities they are associated with.
The collective movement behaviour of a population of entities over a timeperiod is a complex configuration built from movement characteristics of allentities at all time moments, which has no arrangement with respect to thepopulation of entities and has a continuous linear arrangement with respectto the time.
Hence, synoptic questions address reference (sub)sets and correspondingbehaviours while elementary questions address individual references and cor-
Chapter 2 - Basic Concepts of Movement Data 17
responding characteristics. An answer to an elementary question is (are) thevalue(s) of the characteristic component(s) it is asking about. An answer toa synoptic question is a description of the behaviour or, more generally, arepresentation of this behaviour in some language, e.g. natural, mathemati-cal, graphical, etc. Such a representation will be called pattern. This agreeswith the definition of a pattern in the data mining literature: ”a pattern isan expression E in some language L describing facts in a subset FE of a setof facts F so that E is simpler than the enumeration of all facts in FE” ([4]).Note that the latter definition emphasises the synoptic nature of a pattern: apattern does not simply enumerate some facts but describes them all togetheras a whole.
As should be clear from the definition, different patterns (e.g. focusing ondifferent aspects) may represent one and the same behaviour. A pattern maybe compound, i.e. composed of other patterns. For example, the description”most of the people tend to move towards the city centre in the morningand outwards in the evening” is a compound pattern including two simplerpatterns, inward and outward movement. Patterns representing movementbehaviours of individual entities (i.e. trajectories) and collective movementbehaviours of sets of entities base first of all on the characteristics of move-ment but may also involve supplementary characteristics. Thus, our examplepattern concerning the movement of people describes first of all the directionof the movement but also mentions such supplementary characteristics as thecharacter of the moving entities (people), the character of a location (citycentre), and the character of the times (morning or evening).
In a pattern describing the movement behaviour on a set of references, onemay include various summary values derived from the individual characteris-tics of the references, for instance, the average speed, prevailing direction, orfrequency of turns.
3.4 Structure of a question
Any question contains some information that is known to the person whoasks the question and aims at gaining some new information, which must besomehow related to the known information. The expected new information willbe called the target of the question while the known information will be calledthe constraint (since it sets certain requirements to the content of the newinformation being sought). Thus, in a question asking about the characteristiccorresponding to a given reference, the characteristic is the target while thereference is the constraint. For example, in the question ”Where was the entitye at time moment t?” the reference, i.e. the pair (e, t), is the constraint andthe target is the location corresponding to this pair. There are also inversequestions, which ask about references corresponding to given characteristics,for example, ”What entities visited place p and when?” In this question, thetarget is the unknown pair consisting of an entity and a time moment thatcorresponds to the given place p, which is the constraint of this question.
18 Andrienko, Andrienko, Pelekis and Spaccapietra
When references consist of two components, as time and entity in the caseof movement data, one of the components may be included in the questionconstraint while the other being the target:
• What entities were present in place p at time t?• At what moments (if any) did entity e visit place p?
These are examples of elementary questions. Synoptic questions, whichdeal with reference sets and behaviours, have the same structure, i.e. includetargets and constraints. In the examples of synoptic questions in Table 1,the constraints are (sub)sets of references and the targets are the behaviourscorresponding to these (sub)sets. There are also questions where behaviours(described by means of appropriate patterns) are the constraints and reference(sub)sets are the targets, for example, ”What group(s) of entities and in whattime period(s) moved as specified by pattern P?”
Like in elementary questions, one of the components defining the references(i.e. set of entities or time interval) may appear in the constraint of a sentencewhile the other being the target:
• What entities moved as specified by pattern P during the time intervalfrom t1 to t2?
• In what time period(s) did the group of entities e1, e2, , en move as specifiedby pattern P?
Synoptic questions requiring the search for occurrences of specified pat-terns, as in the above-presented examples, may be called pattern search tasks.We highlight this question type and give it a special name since it plays aprominent role in visual data exploration, which is generally viewed as beingbased on pattern recognition.
3.5 Comparison questions
In the examples considered so far, the questions were targeted at (i.e. askingabout) characteristics, or behaviours, or references, or reference sets. Let usgive a few examples of a different kind:
1. What were the relative positions of entities e1 and e2 at time t?2. How did the location of entity e change from time t1 to time t2?3. What is the difference in the times when entity e visited places p1 and p2?4. What are the commonalities and differences between the movement be-
haviours of entities e1 and e2 (or groups of entities E1 and E2) on thetime interval from t1 to t2?
5. How does the movement behaviour of entity e (or group of entities E) intime interval from t1 to t2 differ from the behaviour in interval from t3 tot4? What is in common?
6. Compare the time intervals when entity e (or group of entities E) movedaccording to pattern P1 and according to pattern P2.
Chapter 2 - Basic Concepts of Movement Data 19
These questions are targeted at relations between characteristics (ques-tions 1 and 2), between behaviours (questions 4 and 5), between references(question 3), or between reference sets (question 6). Such questions are calledcomparison questions. Questions 1 to 3 are elementary comparison questionswhile questions 4 to 6 are synoptic comparison questions. The term ‘compar-ison’ is used in a quite broad sense as establishing relations between things.The nature of the things determines what relations are possible. Let us listthe relations relevant to movement data.
1. Relations between characteristics (including both characteristics of move-ment and auxiliary characteristics)a) Positions: spatial relations including distance, direction, and topolog-
ical relations such as touch, inside, overlap, etc.b) Numeric characteristics, e.g. speed, acceleration, angle of turn: equal-
ity (equal or not equal), order (greater than or less than), and distance(difference).
c) Qualitative characteristics, e.g. direction of movement or character ofa location: equality.
2. Relations between referencesa) Time moments: equality, order, distance (amount of time between two
moments).i) Additionally, relations between the auxiliary characteristics of
time moments (numeric or qualitative): see 1b and 1c.b) Entities: equality.
i) Additionally, relations between the auxiliary characteristics of en-tities (numeric or qualitative): see 1b and 1c.
3. Relations between behaviours: equality (equal or not equal); similarity(similar or dissimilar); conformity (conformal or opposite).a) Additionally, relations between the summary characteristics of the
behaviours such as the average speed (numeric) or prevailing direction(qualitative): see 1b and 1c.
4. Relations between sets of referencesa) Time intervals: temporal order, distance, topological relations such as
touch, inside, overlap, etc.i) Additionally, relations between the auxiliary characteristics of the
intervals such as length (numeric) or character of the times (qual-itative): see 1b and 1c.
b) Groups (subsets) of entities: equality, inclusion, overlap or absence ofoverlap.i) Additionally, relations between the auxiliary characteristics of the
groups such as size (numeric) or character of the entities (quali-tative): see 1b and 1c.
20 Andrienko, Andrienko, Pelekis and Spaccapietra
3.6 Relation search
In opposite to comparison questions, in which relations are unknown and needto be ascertained, there are questions requiring the search for occurrences ofspecified relations. In such questions, it is typically necessary to determine anddescribe the characteristics or behaviours linked by the specified relations andthe corresponding references or reference subsets, i.e. where these relationsoccur. For example:
• Find all cases when two or more entities met in the same location (In whatlocations? What entities did meet? At what time moments?)
• Find all cases when two or more entities moved together, i.e. simultane-ously passed the same locations (What sequences of locations, i.e. pathsin space? What entities? On what time intervals?)
• Find all cases when an entity repeatedly made the same path in space(What path in space? What entity? On what time intervals?)
• Finds groups of entities that had similar movement behaviours (What isthe common pattern for these behaviours? What entities? On which timeintervals?)
From the examples given above, the first is an elementary question sinceit addresses individual characteristics (locations) and references (entities andtime moments). The remaining examples are synoptic since they involve be-haviours (in particular, paths in space) and reference subsets (in particular,time intervals). It may be noted, however, that both elementary and synopticquestions are not atomic but involve several tasks:
1. Detect an occurrence of the specified relation, i.e. at least two character-istics or at least two behaviours related in this way.
2. Find out what references or reference subsets correspond to the charac-teristics or behaviours thus detected.
3. For the answer to be complete, the characteristics or behaviours shouldalso be described, in particular, the behaviours represented by suitablepatterns.
3.7 Building an overall pattern
One of the major goals of the analysis of movement data is to characterise theoverall movement behaviour of the whole set of entities over the entire timeperiod the data refer to, or, in other words, to build an appropriate patternrepresenting this overall behaviour (in data mining and statistics, a patterndescribing the entire set of facts has the special name model). ”Appropriate”means adequate to the further goals, which may be, for example, prediction ofthe future behaviour or optimisation of the road network. The overall pattern(model) needs to be sufficiently comprehensive and precise. Typically, therequired precision cannot be achieved in a simple (”atomic”) pattern but
Chapter 2 - Basic Concepts of Movement Data 21
rather in a compound pattern built from sub-patterns, which, in turn, mayalso be compound.
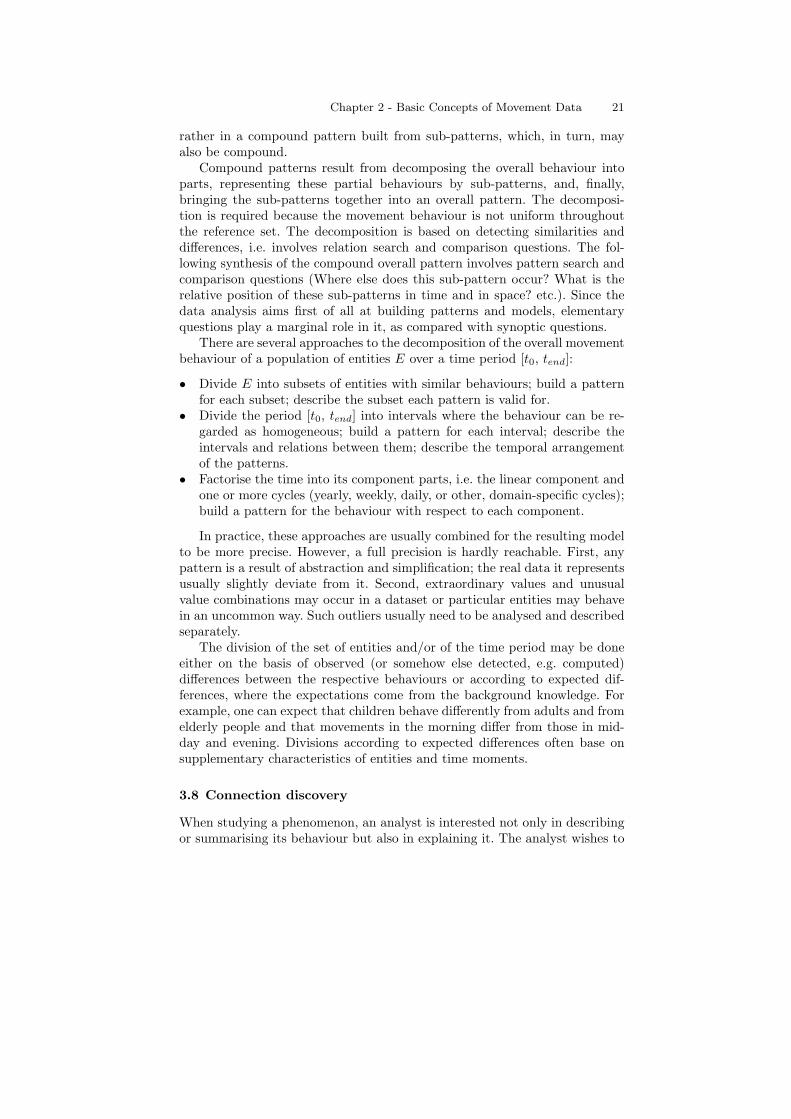
Compound patterns result from decomposing the overall behaviour intoparts, representing these partial behaviours by sub-patterns, and, finally,bringing the sub-patterns together into an overall pattern. The decomposi-tion is required because the movement behaviour is not uniform throughoutthe reference set. The decomposition is based on detecting similarities anddifferences, i.e. involves relation search and comparison questions. The fol-lowing synthesis of the compound overall pattern involves pattern search andcomparison questions (Where else does this sub-pattern occur? What is therelative position of these sub-patterns in time and in space? etc.). Since thedata analysis aims first of all at building patterns and models, elementaryquestions play a marginal role in it, as compared with synoptic questions.
There are several approaches to the decomposition of the overall movementbehaviour of a population of entities E over a time period [t0, tend]:
• Divide E into subsets of entities with similar behaviours; build a patternfor each subset; describe the subset each pattern is valid for.
• Divide the period [t0, tend] into intervals where the behaviour can be re-garded as homogeneous; build a pattern for each interval; describe theintervals and relations between them; describe the temporal arrangementof the patterns.
• Factorise the time into its component parts, i.e. the linear component andone or more cycles (yearly, weekly, daily, or other, domain-specific cycles);build a pattern for the behaviour with respect to each component.
In practice, these approaches are usually combined for the resulting modelto be more precise. However, a full precision is hardly reachable. First, anypattern is a result of abstraction and simplification; the real data it representsusually slightly deviate from it. Second, extraordinary values and unusualvalue combinations may occur in a dataset or particular entities may behavein an uncommon way. Such outliers usually need to be analysed and describedseparately.
The division of the set of entities and/or of the time period may be doneeither on the basis of observed (or somehow else detected, e.g. computed)differences between the respective behaviours or according to expected dif-ferences, where the expectations come from the background knowledge. Forexample, one can expect that children behave differently from adults and fromelderly people and that movements in the morning differ from those in mid-day and evening. Divisions according to expected differences often base onsupplementary characteristics of entities and time moments.
3.8 Connection discovery
When studying a phenomenon, an analyst is interested not only in describingor summarising its behaviour but also in explaining it. The analyst wishes to
22 Andrienko, Andrienko, Pelekis and Spaccapietra
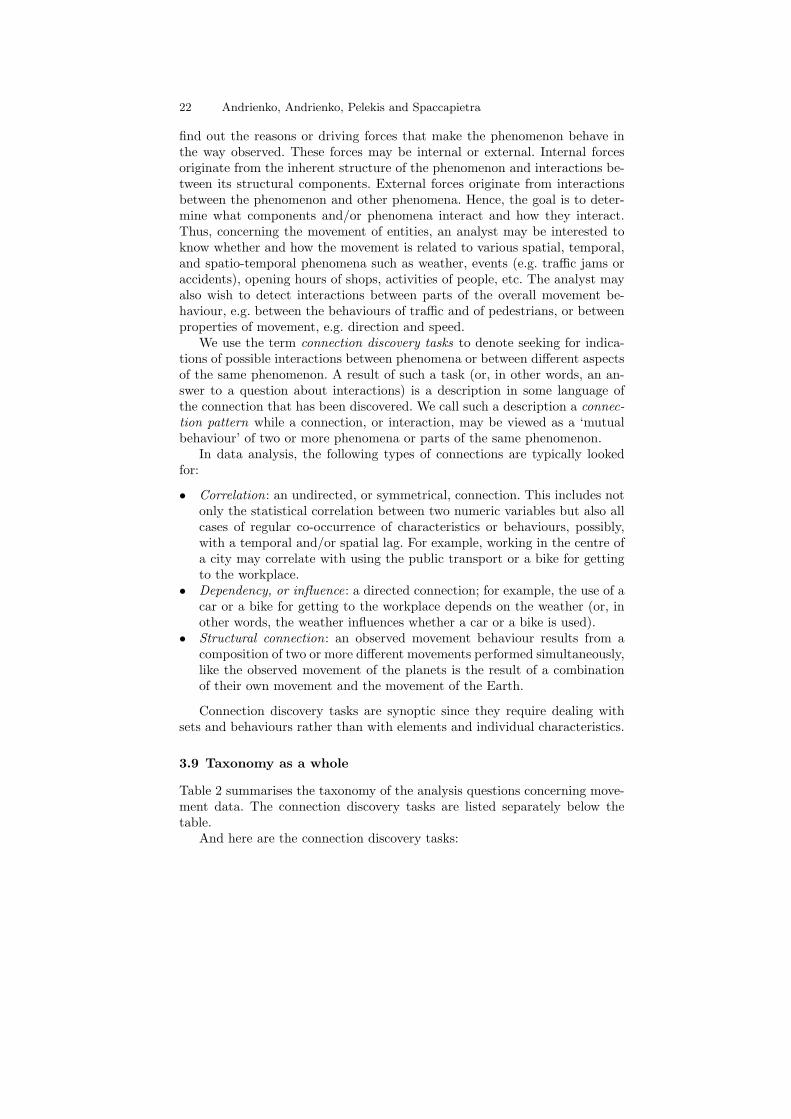
find out the reasons or driving forces that make the phenomenon behave inthe way observed. These forces may be internal or external. Internal forcesoriginate from the inherent structure of the phenomenon and interactions be-tween its structural components. External forces originate from interactionsbetween the phenomenon and other phenomena. Hence, the goal is to deter-mine what components and/or phenomena interact and how they interact.Thus, concerning the movement of entities, an analyst may be interested toknow whether and how the movement is related to various spatial, temporal,and spatio-temporal phenomena such as weather, events (e.g. traffic jams oraccidents), opening hours of shops, activities of people, etc. The analyst mayalso wish to detect interactions between parts of the overall movement be-haviour, e.g. between the behaviours of traffic and of pedestrians, or betweenproperties of movement, e.g. direction and speed.
We use the term connection discovery tasks to denote seeking for indica-tions of possible interactions between phenomena or between different aspectsof the same phenomenon. A result of such a task (or, in other words, an an-swer to a question about interactions) is a description in some language ofthe connection that has been discovered. We call such a description a connec-tion pattern while a connection, or interaction, may be viewed as a ‘mutualbehaviour’ of two or more phenomena or parts of the same phenomenon.
In data analysis, the following types of connections are typically lookedfor:
• Correlation: an undirected, or symmetrical, connection. This includes notonly the statistical correlation between two numeric variables but also allcases of regular co-occurrence of characteristics or behaviours, possibly,with a temporal and/or spatial lag. For example, working in the centre ofa city may correlate with using the public transport or a bike for gettingto the workplace.
• Dependency, or influence: a directed connection; for example, the use of acar or a bike for getting to the workplace depends on the weather (or, inother words, the weather influences whether a car or a bike is used).
• Structural connection: an observed movement behaviour results from acomposition of two or more different movements performed simultaneously,like the observed movement of the planets is the result of a combinationof their own movement and the movement of the Earth.
Connection discovery tasks are synoptic since they require dealing withsets and behaviours rather than with elements and individual characteristics.
3.9 Taxonomy as a whole
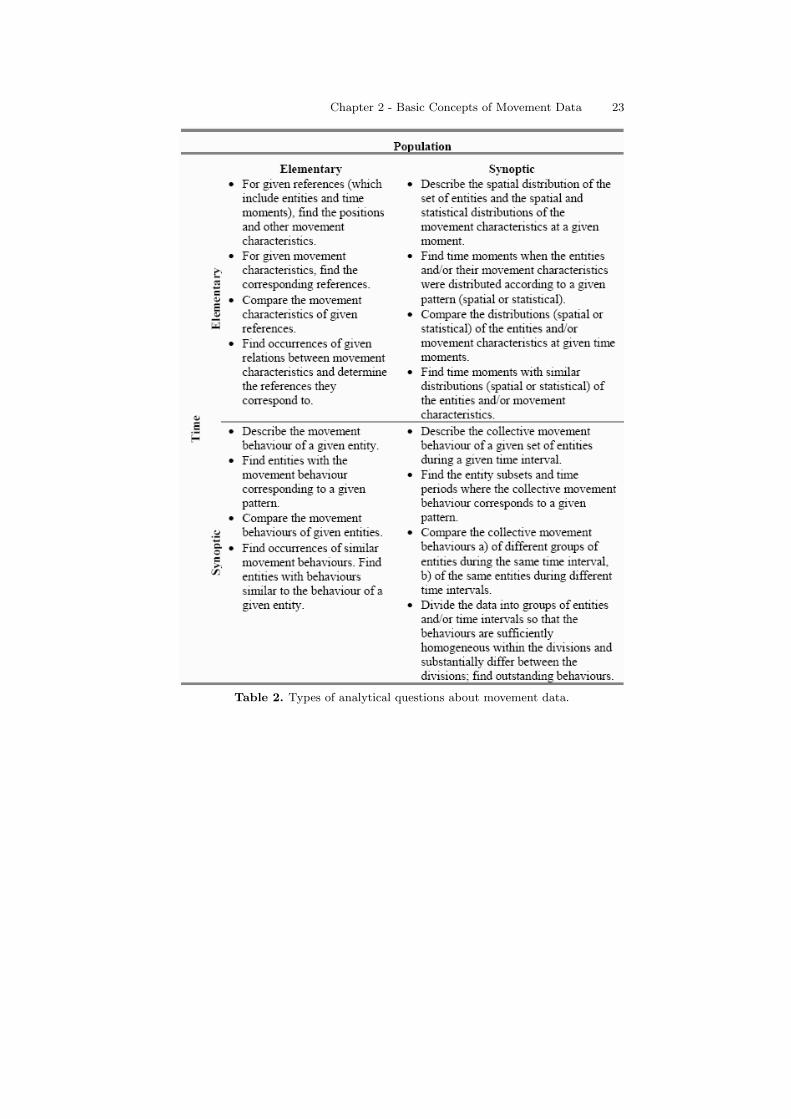
Table 2 summarises the taxonomy of the analysis questions concerning move-ment data. The connection discovery tasks are listed separately below thetable.
And here are the connection discovery tasks:
Chapter 2 - Basic Concepts of Movement Data 23
Table 2. Types of analytical questions about movement data.
24 Andrienko, Andrienko, Pelekis and Spaccapietra
• Detect correlations and dependencies between different characteristics ofthe movement.
• Detect correlations and dependencies between the movement and varioussupplementary characteristics of the locations, time moments, and entitiesand/or various external phenomena and events.
• Represent the observable movement as a composition of several interactingmovements of different kinds.
We have defined these question types purely by reasoning about movementdata, irrespectively of any methods of analysis. It may be interesting to seehow these types are related to the established typology of the tasks of datamining.
3.10 Relation to the data mining tasks
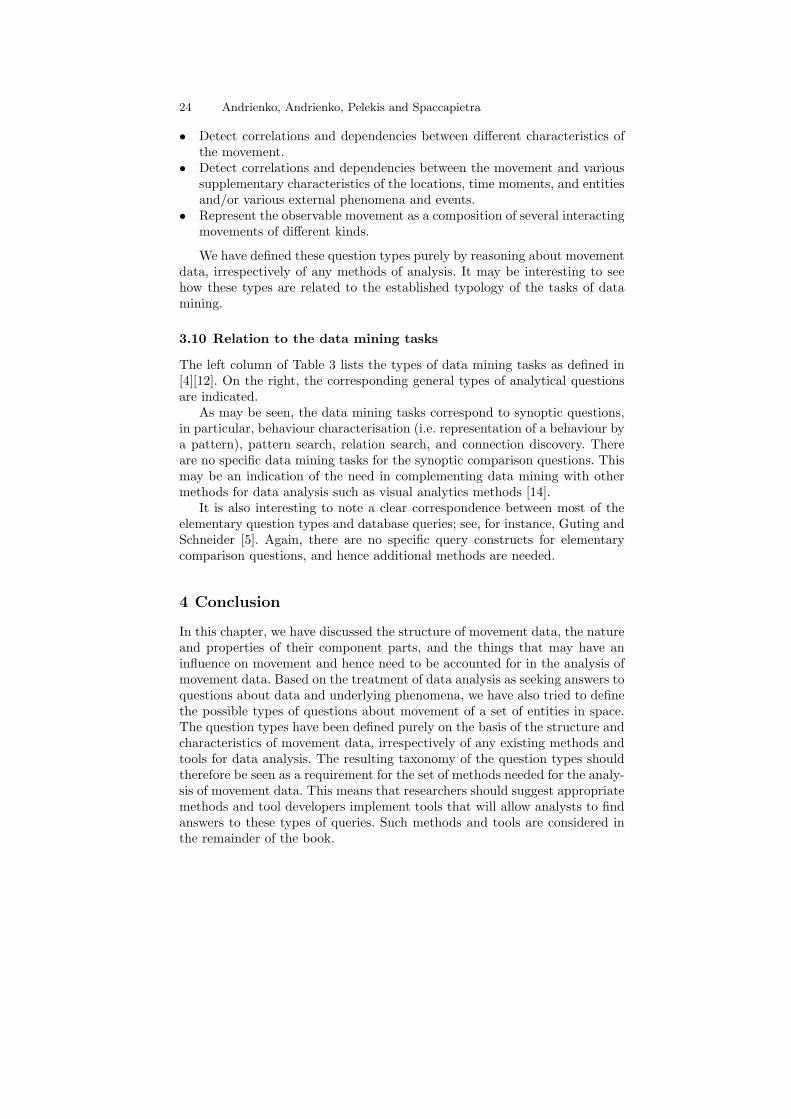
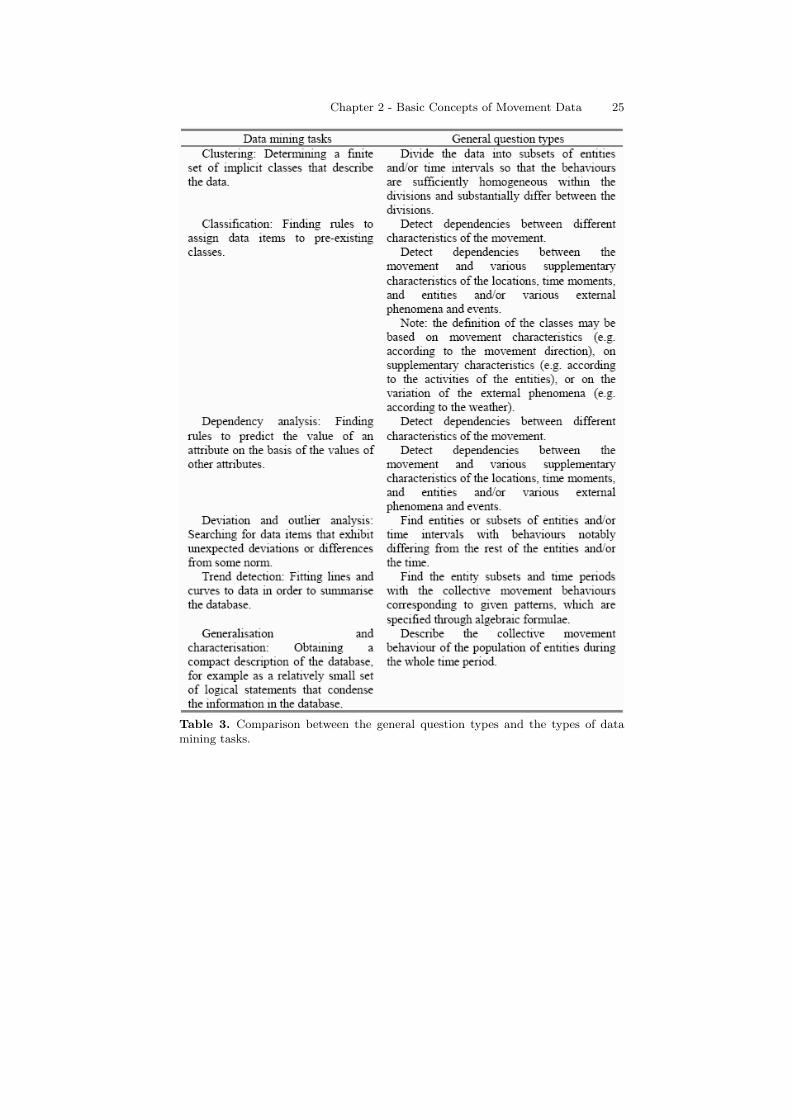
The left column of Table 3 lists the types of data mining tasks as defined in[4][12]. On the right, the corresponding general types of analytical questionsare indicated.
As may be seen, the data mining tasks correspond to synoptic questions,in particular, behaviour characterisation (i.e. representation of a behaviour bya pattern), pattern search, relation search, and connection discovery. Thereare no specific data mining tasks for the synoptic comparison questions. Thismay be an indication of the need in complementing data mining with othermethods for data analysis such as visual analytics methods [14].
It is also interesting to note a clear correspondence between most of theelementary question types and database queries; see, for instance, Guting andSchneider [5]. Again, there are no specific query constructs for elementarycomparison questions, and hence additional methods are needed.
4 Conclusion
In this chapter, we have discussed the structure of movement data, the natureand properties of their component parts, and the things that may have aninfluence on movement and hence need to be accounted for in the analysis ofmovement data. Based on the treatment of data analysis as seeking answers toquestions about data and underlying phenomena, we have also tried to definethe possible types of questions about movement of a set of entities in space.The question types have been defined purely on the basis of the structure andcharacteristics of movement data, irrespectively of any existing methods andtools for data analysis. The resulting taxonomy of the question types shouldtherefore be seen as a requirement for the set of methods needed for the analy-sis of movement data. This means that researchers should suggest appropriatemethods and tool developers implement tools that will allow analysts to findanswers to these types of queries. Such methods and tools are considered inthe remainder of the book.
Chapter 2 - Basic Concepts of Movement Data 25
Table 3. Comparison between the general question types and the types of datamining tasks.
2. N. Andrienko and G. Andrienko. Exploratory Analysis of Spatial and TemporalData: A Systematic Approach. Springer, 2006.
3. J. Bertin. Semiology of Graphics. Diagrams, Networks, Maps. University ofWisconsin Press, 1983.
4. U. M. Fayyad, G. Piatetsky-Shapiro, and P. Smyth. From data mining to knowl-edge discovery: An overview. In Advances in Knowledge Discovery and DataMining, pages 1–34. 1996.
5. R. H. Gueting and M. Schneider. Moving Objects Databases. Elsevier, 2005.6. T. Hagerstrand. What about people in regional science? Papers of the Regional
Science Association, 24:7–21, 1970.7. K. Hornsby and M. J. Egenhofer. Modeling moving objects over multiple gran-
ularities. Ann. Math. Artif. Intell., 36(1-2):177–194, 2002.8. M.-J. Kraak. The space-time cube revisited from a geovisualization perspec-
tive. In 21st International Cartographic Conference, Durban, South-Africa,pages 1988–1995, 2003.
9. P. Laube, S. Imfeld, and R. Weibel. Discovering relative motion patterns ingroups of moving point objects. International Journal of Geographical Informa-tion Science, 19(6):639–668, 2005.
10. H. Miller. A measurement theory for time geography. Geographical Analysis,37:17–45, 2005.
11. H. Miller. Modeling accessibility using space-time prism concepts within geo-graphical information systems: Fourteen years on. In Classics of IJGIS, pages177–182. CRC Press, 2006.
12. H. Miller and J. Han. Geographic data mining and knowledge discovery: anoverview. In Geographic Data Mining and Knowledge Discovery, pages 3–32.Taylor and Francis, 2001.
13. A. Moore, P. Whigwham, A. Holt, C. Alridge, and K. Hodge. A time geographyapproach to the visualization of sport. In Proc. of the 7th Intern. Conferenceon Geocomputation, 2003.
14. J. Thomas and K. Cook. Illuminating the Path. The Research and developmentAgenda for Visual Analytics. IEEE Computer Society, 1983.
15. E. Tufte. Visual Display of Quantitative Information. Graphics Press, 1983.