+ All Categories
Home > Documents > Chapter 2 Changes in the trade structures of the world and ...

Chapter 2 Changes in the trade structures of the world and ...

Date post: 07-Nov-2021
Category:
Upload: others
View: 0 times
Download: 0 times
Share this document with a friend
41
Chapter 2 Changes in the trade structures of the world and Japan Chapter 2 provides analysis to verify the economic circumstances in which Japan is placed based on the recent changes in the world economy shown in Chapter 1. Contrary to Chapter 1, which discussed the kinetic changes, Chapter 2 examines the macro structural changes. Firstly, Section 1 provides the world trading structural changes created over the past 20 years and the impact on the structural changes caused by the world economic crisis triggered by the Lehman shock in September 2008 by tracing the trade relationship between Japan and major countries and unified economies of the world. In addition, it also shows the impact caused by these changes on the production networks called the world factoryconstructed by Japan and East Asian countries/ regions. Secondly, Section 2 provides the overall situation of Mercado Comun del Cone Sur (MERCOSUR) which has been recently increasing its presence. Additionally, the Section provides analysis on the economic and trading relationship focused on Brazil. Finally, Section 3, focusing on Japan, examines the impact caused by the structural changes in the trade of Japan on domestic employment, economic and industrial structures. Section 1 Transition of world trade surrounding Japan 1. The world economic crisis and changes in the global trade structure The world trade volume and movement in 2009 was affected by the world economic crisis with the greatest impact after World War II. In the section below, six polesof major players (or beginning to be the major players) in world trade including the unified regional economies such as NAFTA, the EU, ASEAN, MERCOSURand China and Japan are defined as a framework for understanding the trade structure over the past 20 years. Overall changes in the global trade structure over the past 20 years are examined by looking at the trade relationship between the six poles and making time-series comparisons. The impact generated by the world economic crisis as a temporary shock to the global trade structure is examined with the framework. (1) Changes in the trade relationship of the six poles (A) Changes in the bilateral/ bi-regional amount of trade (export plus import) and share In order to overview the changes in trade relationships in the six poles, the amount of trade (export plus import) between the countries/ regions is shown in the Figures (Figures 2-1-1-1, 2-1-1-2 and 2-1-1-3). Shares of the amount of trade between each bilateral/ bi-regional trade which account for the total amount of trade between the six poles are confirmed (Table 2-1-1-4).
Transcript

Chapter 2 Changes in the trade structures of the world and Japan

Chapter 2 provides analysis to verify the economic circumstances in which Japan is placed

based on the recent changes in the world economy shown in Chapter 1. Contrary to Chapter 1,

which discussed the kinetic changes, Chapter 2 examines the macro structural changes.

Firstly, Section 1 provides the world trading structural changes created over the past 20 years

and the impact on the structural changes caused by the world economic crisis triggered by the

Lehman shock in September 2008 by tracing the trade relationship between Japan and major

countries and unified economies of the world. In addition, it also shows the impact caused by

these changes on the production networks called “the world factory” constructed by Japan and

East Asian countries/ regions. Secondly, Section 2 provides the overall situation of Mercado

Comun del Cone Sur (MERCOSUR) which has been recently increasing its presence.

Additionally, the Section provides analysis on the economic and trading relationship focused on

Brazil. Finally, Section 3, focusing on Japan, examines the impact caused by the structural

changes in the trade of Japan on domestic employment, economic and industrial structures.

Section 1 Transition of world trade surrounding Japan

1. The world economic crisis and changes in the global trade structure

The world trade volume and movement in 2009 was affected by the world economic crisis

with the greatest impact after World War II.

In the section below, “six poles” of major players (or beginning to be the major players) in

world trade including the unified regional economies such as “NAFTA, the EU, ASEAN,

MERCOSUR” and China and Japan are defined as a framework for understanding the trade

structure over the past 20 years. Overall changes in the global trade structure over the past 20

years are examined by looking at the trade relationship between the six poles and making

time-series comparisons. The impact generated by the world economic crisis as a temporary

shock to the global trade structure is examined with the framework.

(1) Changes in the trade relationship of the six poles

(A) Changes in the bilateral/ bi-regional amount of trade (export plus import) and share

In order to overview the changes in trade relationships in the six poles, the amount of trade

(export plus import) between the countries/ regions is shown in the Figures (Figures 2-1-1-1,

2-1-1-2 and 2-1-1-3). Shares of the amount of trade between each bilateral/ bi-regional trade

which account for the total amount of trade between the six poles are confirmed (Table 2-1-1-4).

Figure 2-1-1-1 Bilateral and regional amount of trade(export + import) (1990)

Figure 2-1-1-2 Bilateral and regional amount of trade(export + import) (2000)

Figure 2-1-1-3 Bilateral and regional amount of trade(export + import) (2008)

Sources: RIETI “RIETI-TID2010”

Table 2-1-1-4 Share of bilateral and regional amount of trade accounting for the total

amount of trade among the six poles (from left to right 1990, 2000 and 2008)

Rank Country/ region Share

1 NAFTA-EU 29.3

2 NAFTA – Japan 19.6

3 EU – Japan 12.6

4 Japan-ASEAN 7.9

5 NAFTA-ASEAN 6.5

6 EU-ASEAN 5.8

7 NAFTA-MERCOSUR 3.9

8 EU-MERCOSUR 3.5

9 NAFTA-China 3.3

10 EU-China 3.0

11 Japan-China 2.5

12 China-ASEAN 0.9

13 Japan-MERCOSUR 0.8

14 MERCOSUR-ASEAN 0.3

15 China-MERCOSUR 0.1

Rank Country/ region Share

1 NAFTA-EU 27.0

2 NAFTA – Japan 14.0

3 NAFTA-ASEAN 8.5

4 NAFTA-China 8.2

5 EU-Japan 7.8

6 Japan-ASEAN 7.3

7 EU-ASEAN 6.1

8 Japan-China 5.5

9 EU-China 5.5

10 NAFTA-MERCOSUR 4.0

11 EU-MERCOSUR 2.8

12 China-ASEAN 2.3

13 Japan-MERCOSUR 0.5

14 China-MERCOSUR 0.3

15 MERCOSUR-ASEAN 0.2

Rank Country/ region Share

1 NAFTA-EU 20.7

2 NAFTA – China 13.2

3 EU – China 13.2

4 Japan-China 7.5

5 NAFTA-Japan 6.8

6 China-ASEAN 5.8

7 EU-ASEAN 5.7

8 NAFTA-ASEAN 5.6

9 Japan-ASEAN 5.5

10 EU-Japan 5.1

11 NAFTA-MERCOSUR 4.2

12 EU-MERCOSUR 3.6

13 China-MERCOSUR 2.1

14 MERCOSUR-ASEAN 0.5

15 Japan-MERCOSUR 0.5

Sources: RIETI “RIETI-TID2010”

Examining the characteristics at the time of the 3 surveys, in 1990, trade between the so-called

advanced countries/ regions such as NAFTA – EU, NAFTA – Japan, EU – Japan accounted for

more than half (61.5%) of the total trade volume. Examining by the sheer volume of trade,

marked shares were held by Japan – ASEAN (7.9%), NAFTA – ASEAN (6.5%) and EU –

ASEAN (5.8%). The trade structure had a trade relationship led by the advanced countries/

regions such as EU, NAFTA and Japan followed by ASEAN. The largest trade between the

emerging economies was China – ASEAN, but the structural ratio accounting for the total trade

was less than 1% (0.9%).

The first and second share (NAFTA – EU (27.0%) and NAFTA – Japan (14.0%)) in 2000 were

unchanged in comparison with 1990, but the trade relation involving Japan i.e. EU – Japan and

Japan – ASEAN which were the third and forth places in 1990 were replaced by NAFTA –

ASEAN and NAFTA – China in 2000, and the first to fourth places were dominated by NAFTA.

Noted increased rates of the amount of trade from 1990 were China – ASEAN (5.3 times),

China – NAFTA (5.3 times) and it showed that China’s economic growth was beginning to

change the world economy and trade structure triggered by China’s admission to WTO.

In 2008, the share between NAFTA and the EU drastically declined (20.7%) and the trade

relation involving China made a dramatic rise in the ranks. Trade between NAFTA – Japan

(6.8%) which was second in ranking was replaced by NAFTA – China (13.2%) in 2008. In the

trade relation involving NAFTA, China – ASEAN share (5.8%) was ranked at the top by

outreaching the EU (5.7%) and NAFTA (5.6%). Noted increased rates of the amount of trade

from 2000 were China – MERCOSUR (13.7 times), China – ASEAN (5.4 times), China – EU

(5.1times) and MERCOSUR – ASEAN (5.1 times). All of those were trade relations involving

China or MERCOSUR. It suggests that the amount of trade between China and MERCOSUR

drastically increased from 2000 through 2008.

Categorizing the trade relations between the six poles into 3 categories and their changes were

examined as follows:

Advanced – trade by advanced countries

At one point in 1990, trade among advanced countries (NAFTA – EU, NAFTA – Japan and

EU - Japan), which dominated the trade with an amount of (61.5%), over one half of the total

of that of the six poles, decreased its presence according to the increased economic power in

the emerging economies (48.9% in 2000 and 32.6% in 2008).

Advanced – trade by emerging countries

At one point in 1990, percentage of trade between advanced countries and ASEAN, such as

Japan – ASEAN (7.9%) was larger, but in 2008, NAFTA – China (13.2%) and the EU – China

(13.2%) increased their weight (Japan – ASEAN declined to 5.5% in 2008). In comparison with

NAFTA, the characteristic was large increase, especially in the EU – China (5.1 times) and

(NAFTA – China was 3.4 times).

Emerging –trade by emerging countries / region

ASEAN – China trade attained favorable growth, and MERCOSUR still maintained close

relations with NAFTA, but the trade relation between China and ASEAN was also becoming

increasingly closer.

(B) Evaluating the increases in the amount of trade

The above mentioned bilateral/ bi-regional amount of trade is revised under the framework of

the gravity model. According to the gravity model, the amount of trade is determined by the

economic sizes and distance between the two countries/ regions. Specifically, the amount of

trade is described by a figure that is derived by dividing the economic sizes of two countries/

regions (generally their GDPs are used) by the square of the distance between the two countries/

regions. As the distance between two countries/ regions cannot be changed during the period of

time-series comparison in this paper, the most important factors causing the difference and

changes in amount trade of the six poles are economic growth in these countries/ regions. In

other words, expansion in trade relations between countries/ regions can be mostly explained by

the economic growth of each country/ region, i.e. it is thought that it can be explained by the

production of GDPs in the gravity model. Simply evaluating volume and changes in trade may

mean only describing the differences in the economic growth of each country/ region.

Therefore, GDP increase rates (increase in the rate of production of GDP) are compared with

the amount of trade increase rates during the same periods.

When these values are calculated, there are two types of values in the relations between the

two countries, i.e. one that the amount trade increase rate is higher than the GDP increase rate,

and another that the amount trade increase rate is lower than the GDP increase rate. This

difference of the “amount of trade increase rate / GDP increase rate” by countries/ regions

means that there is a temporal variation of the “sense of existence” between the two countries/

regions, which is held by the two countries/ regions in their relation to world trade and this

cannot be explained simply by economic size. Therefore, the “amount of trade increase rate /

GDP increase rate” is called the “sense of existence” index, which shows the “sense of

existence” of the relations between the two countries/ regions in relation to world trade. The

details are examined in the section below (Table 2-1-1-5).

Table 2-1-1-5 GDP scale factor and the amount of trade scale factor among countries/

regions of the six poles (2009 / 1990)

Region GDP scale

factor (A, scale)

Amount of trade scale

factor (B, scale)

Presence index (B / A)

Group

China MERCOSUR 40.4 52.8 1.31

High

ranked

group

EU China 29.8 16.7 0.56

Japan China 21.4 11.7 0.55

MERCOSUR ASEAN 13.2 7.0 0.53

NAFTA China 31.3 16.0 0.51

EU MERCOSUR 7.4 3.3 0.45

China ASEAN 53.2 23.3 0.44

NAFTA EU 5.7 2.4 0.42

Low

ranked

group

NAFTA MERCOSUR 7.8 3.3 0.42

Japan MERCOSUR 5.3 2.1 0.40

EU ASEAN 9.7 3.5 0.36

EU Japan 3.9 1.3 0.34

Japan ASEAN 7.0 2.2 0.32

NAFTA ASEAN 10.2 3.1 0.30

NAFTA Japan 4.1 1.1 0.27

Notes: GDP scale is scale of multiplied two countries’ GDP.

Sources: IMF “World Economic Outlook October 2010; RIETI “RIETI-TID2010”

When the “sense of existence” indices are compared among countries/ regions in the six poles,

the countries/ regions, which have a higher amount of trade increase rate than GDP increase rate,

i.e. the sense of existence is larger compared with trade relations of other two countries/ regions.

This trend is represented by “MERCOSUR – China”. On the other hand, the amount of trade

increase rate is lower than the GDP increase rate in other 14 trade relationships. The “sense of

existence” indices of the above mentioned 15 trade relationships are calculated and arranged in

ascending order (Table 2-1-1-5). These can be divided into the upper group of “sense of

existence” index (= amount of trade increase rate is relatively higher) and the lower group (=

amount of trade increase rate is relatively lower) bordering on the middle place of NAFTA – EU

relations. The results are as follows:

The upper group: Trade relationships whose trade partner is China or MERCOSUR

The lower group: Trade relationships whose trade partner is ASEAN or Japan

China and MERCOSUR have accomplished drastic economic growth and in addition to the

increase in economic growth rate, the “sense of existence” index shows that each country/

region of six poles has made efforts to strengthen relations with the country/ region. The

background of this theory may be global recognition of the potential growth power in China and

MERCOSUR in the future and the movement of each country/ region of six poles under this

recognition to strengthen the relations with them. Details of the economic movement of

MERCOSUR will be analyzed in the Section 2 of this Chapter.

(2) Conceptual framework to perceive the macro structure of the world trade

Thus, the amount of trade between the six poles was examined at three time periods to

macroscopically perceive world trade relationships. It seems that the three poles structure

consisting of NAFTA, the EU and Japan until 2000 has been changed to a three poles structure

consisting of NAFTA, the EU and China as the rapid growth of China started at the beginning of

this century.

Now, the three poles structure of world trade relationships is drawn with a triangular

conceptual chart with the three verticals representing the three poles and the length of the three

sides representing the ratio of amount of trade between the two poles. Changes in the global

trade structure are perceived by shape variations of the triangle.

(A) Structural changes in trade relationships from 1990 to 2008

The global trade structure in 1990 was the three poles structure with the two main axes of the

EU and NAFTA and Japan added as another pole (Figure 2-1-1-6, the blue triangle). But in 2008,

it changed into a form that Japan was left behind in the three poles structure of China, NAFTA

and the EU by overall economic expansion, especially the overwhelming growth of China

(Figure 2-1-1-7, the red triangle)1.

Figure 2-1-1-6 Conceptual chart of trade relationships among the three poles (1990)

(Blue line shows trade relationships in 1990 and red line shows the trade relationship in

2008)

1 The conditions for drawing the triangle are the base < right side + left side>. If the conditions are

not satisfied, the triangle cannot be drawn. At the time period of 1990, a triangle of

EU-NAFTA-China cannot be drawn and at the time period of 2008, the triangle for

EU-NAFUTA-Japan cannot be drawn.

Amount of trade in 1990

Countries/ region Amount of trade

(US$100 million)

NAFTA EU 2,441

Japan NAFTA 1,639

Japan EU 1,054

NAFTA China 272

EU China 253

Japan China 206

NAFTA

Japan

EU

Sources: RIETI “RIETI-TID2010”

Figure 2-1-1-7 Conceptual chart of trade relationships among the three poles (from 1990

to 2008)

From 1990 to 2008

1990 2008

Countries/ regions Amount

(US$100 million) Countries/ regions

Amount

(US$100 million)

1 NAFTA EU 2,441 NAFTA EU 7,690

2 Japan NAFTA 1,639 NAFTA China 4,904

3 Japan EU 1,054 EU China 4,893

4 NAFTA China 272 Japan China 2,791

5 EU China 253 Japan NAFTA 2,530

6 Japan China 206 Japan EU 1,886

China

EU NAFTA

Japan

NAFTAEU

1990

2008

1990

2008

Notes: The larger the distance between the peaks, the larger the amount of trade

Sources: RIETI “RIETI-TID2010”; World Trade Atlas

(B) Where did the world economic crisis have an impact on?

Secondly, the impact caused by the world economic crisis on world trade relationships is

examined by viewing world trade relationships after the world economic crisis. Changes in the

amount of trade (amount of export plus import) among the six poles following the world

economic crisis are shown in the figures (Figures 2-1-1-8 and 2-1-1-9).

Figure 2-1-1-8 Bilateral and regional amount of trade (exports + imports) (2009)

Figure 2-1-1-9 Bilateral and regional amount of trade (exports + imports) (2010)

Notes: Amount of trade between ASEAN and MERCOSUR is not shown due to any data has been published yet.

Sources: RIETI “RIETI-TID2010”; World Trade Atlas

Trade in 2009 shrunk worldwide affected by the world economic crisis, but it basically

recovered in 2010. However, the pace of recovery differed by country/ region. There may be

newly strengthened economic and political relations and also newly occurring worsening

relations as well as improving relations. It cannot be completely concluded that world trade

relations have similarly recovered and expanded since before and after the world economic

crisis.

Therefore, the conceptual chart of the trade relationships of the three poles shows trade

relationships in 2009 and 2010 after the world economic crisis similar to the previous section

(Figure 2-1-1-10).

Figure 2-1-1-10 Conceptual chart of trade relationships among the three poles (from 2008

to 2010)

1990 2008 2009 2010

Countries/

regions

Amount (US$100 million)

Countries/

regions

Amount (US$100 million)

Countries/

regions

Amount (US$100 million)

Countries/

regions

Amount (US$100 million)

1 NAFTA EU 2,441 NAFTA EU 7,690 NAFTA EU 5,894 NAFTA EU 6,388

2 Japan NAFTA 1,639 NAFTA China 4,904 NAFTA China 4,353 EU China 5,007

3 Japan EU 1,054 EU China 4,893 EU China 4,224 NAFTA China 4,801

4 NAFTA China 272 Japan China 2,791 Japan China 2,407 Japan China 3,031

5 EU China 253 Japan NAFTA 2,530 Japan NAFTA 1,796 Japan NAFTA 2,229

6 Japan China 206 Japan EU 1,886 Japan EU 1,417 Japan EU 1,536

NAFTAEU

China

China

EU NAFTA

1990年2008年2009年2010年

Japan

NAFTAEU

1990

2010

2009

2008

19902008

20092010

Compared with 2008 (the red triangle), the globally reduced world trade relationships (the

yellow triangle) in 2009 changed its shape into that of 2010 (the green triangle).

In the recovery process from 2008 (the red triangle) to 2010 (the green triangle), the sense of

existence of China – EU and China – NAFTA relations further increased. On the other hand,

recovery of NAFTA – EU relations, which formed the basis of the three poles structure (having

formed an axis of world trade) has been weak compared with relationships between other two

countries/ regions and decreased its sense of existence in world trade.

As a result, while the base line of EU – NAFTA relations shrunk, China’s vertex of the triangle

increasingly rose due to its rapid economic growth and China’s location, which was

approximately directly between the EU and NAFTA, also moved to the right due to an increase

in trade volume with the EU.

It should be noted that China is demonstrating the sense of existence as a gigantic pole backed

by a rapid economic growth a lot faster than those of the EU and NAFTA. If the trend of

advanced economies stagnating and emerging economies advancing, especially China,

continues, and if the size of trade volume among China, ASEAN and MERCOSUR becomes

equivalent to that of Europe and the United States, the global trade structure with three poles

should not be seen as a triangle but may be more reasonable to perceive it with a pentagonal

structure located with China at the center. If it is true, the world economic crisis might have an

irreversible impact on world trade, though it is a conditional outlook.

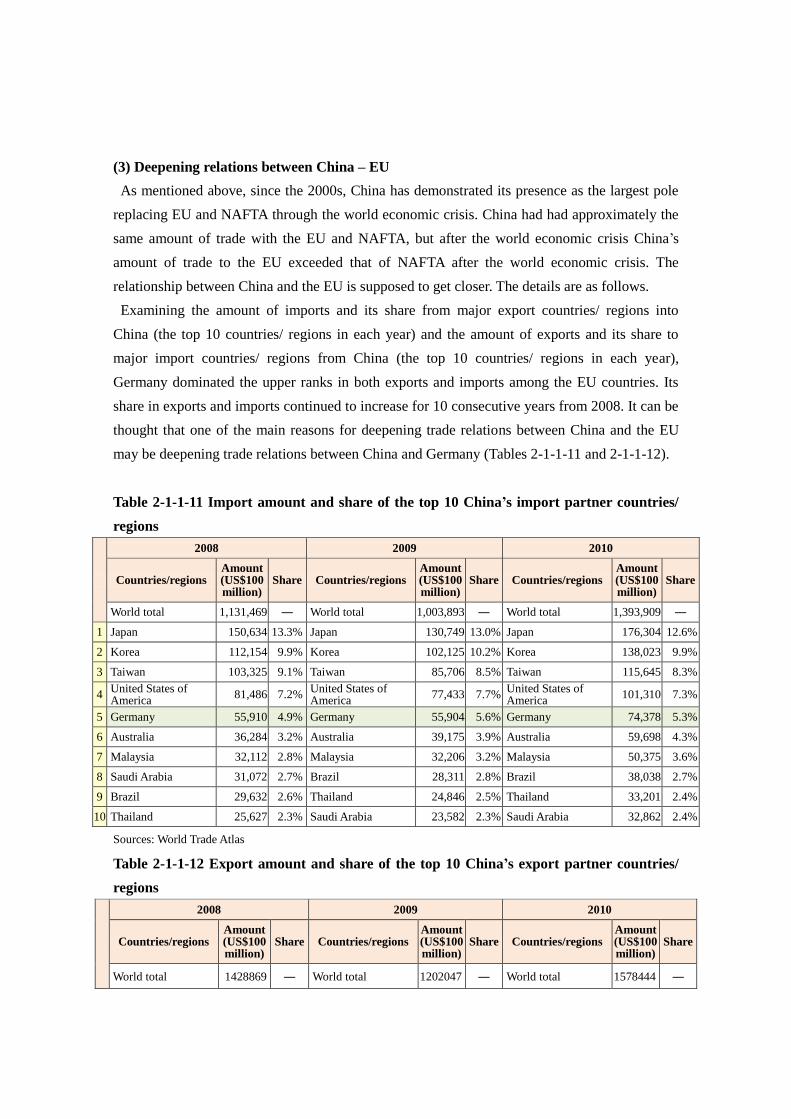
(3) Deepening relations between China – EU

As mentioned above, since the 2000s, China has demonstrated its presence as the largest pole

replacing EU and NAFTA through the world economic crisis. China had had approximately the

same amount of trade with the EU and NAFTA, but after the world economic crisis China’s

amount of trade to the EU exceeded that of NAFTA after the world economic crisis. The

relationship between China and the EU is supposed to get closer. The details are as follows.

Examining the amount of imports and its share from major export countries/ regions into

China (the top 10 countries/ regions in each year) and the amount of exports and its share to

major import countries/ regions from China (the top 10 countries/ regions in each year),

Germany dominated the upper ranks in both exports and imports among the EU countries. Its

share in exports and imports continued to increase for 10 consecutive years from 2008. It can be

thought that one of the main reasons for deepening trade relations between China and the EU

may be deepening trade relations between China and Germany (Tables 2-1-1-11 and 2-1-1-12).

Table 2-1-1-11 Import amount and share of the top 10 China’s import partner countries/

regions

2008 2009 2010

Countries/regions Amount (US$100 million)

Share Countries/regions Amount (US$100 million)

Share Countries/regions Amount (US$100 million)

Share

World total 1,131,469 ― World total 1,003,893 ― World total 1,393,909 ―

1 Japan 150,634 13.3% Japan 130,749 13.0% Japan 176,304 12.6%

2 Korea 112,154 9.9% Korea 102,125 10.2% Korea 138,023 9.9%

3 Taiwan 103,325 9.1% Taiwan 85,706 8.5% Taiwan 115,645 8.3%

4 United States of America

81,486 7.2% United States of America

77,433 7.7% United States of America

101,310 7.3%

5 Germany 55,910 4.9% Germany 55,904 5.6% Germany 74,378 5.3%

6 Australia 36,284 3.2% Australia 39,175 3.9% Australia 59,698 4.3%

7 Malaysia 32,112 2.8% Malaysia 32,206 3.2% Malaysia 50,375 3.6%

8 Saudi Arabia 31,072 2.7% Brazil 28,311 2.8% Brazil 38,038 2.7%

9 Brazil 29,632 2.6% Thailand 24,846 2.5% Thailand 33,201 2.4%

10 Thailand 25,627 2.3% Saudi Arabia 23,582 2.3% Saudi Arabia 32,862 2.4%

Sources: World Trade Atlas

Table 2-1-1-12 Export amount and share of the top 10 China’s export partner countries/

regions

2008 2009 2010

Countries/regions Amount (US$100 million)

Share Countries/regions Amount (US$100 million)

Share Countries/regions Amount (US$100 million)

Share

World total 1428869 ― World total 1202047 ― World total 1578444 ―

1 United States of

America 252327 17.7%

United States of

America 220706 18.4%

United States of

America 283184 17.9%

2 Hong Kong 190772 13.4% Hong Kong 166109 13.8% Hong Kong 218205 13.8%

3 Japan 116176 8.1% Japan 97209 8.1% Japan 120262 7.6%

4 Korea 73905 5.2% Korea 53630 4.5% Korea 68811 4.4%

5 Germany 59192 4.1% Germany 49932 4.2% Germany 68069 4.3%

6 Holland 45921 3.2% Holland 36689 3.1% Holland 49711 3.1%

7 United Kingdom 36079 2.5% United Kingdom 31267 2.6% India 40879 2.6%

8 Russia 33011 2.3% Singapore 30050 2.5% United Kingdom 38776 2.5%

9 Singapore 32325 2.3% India 29570 2.5% Singapore 32333 2.0%

10 India 31516 2.2% France 21445 1.8% Italy 31136 2.0%

Sources: World Trade Atlas

Examining the transition of the balance of trade between China – Germany, China’s export

surplus continued for some years from the mid 2000s due to China’s economic growth and its

elevated presence as the world factory, but China’s imports surged to surplus from around the

time of the world economic crisis (Figure 2-1-1-13). In 2009, most countries/ regions in the

world suffered negative effects of the post world economic crisis leading to stagnation in

exports, but Germany did not decrease its exports to China’s expanding market (refer to Figure

2-1-1-11. China’s import from Germany was US$55.91 billion in 2008 and US$55.904 billion

in 2009), and China’s exports to Germany also increased due to economic recovery in 2010

(from US$59.192 billion in 2008 to US$68.069 billion in 2010).

Figure 2-1-1-13 Transition of trade balance between China and Germany

Sources: World Trade Atlas

As mentioned above, it was suggested that trade relations between China and Germany at the

time period before and after the world economic crisis was good in relation to Germany’s

exports to China.

The top 5 commodities (HS code 2 digits basis) of China’s import from Germany are as shown

in Table 2-1-1-14. The hatched parts show the commodities, which largely increased.

Table 2-1-1-14 Transition of import amount from Germany to China by commodities

HS Commodities

Amount

(US$1

million)

Share

(%)HS Commodities

Amount

(US$1

million)

Share

(%)HS Commodities

Amount

(US$1

million)

Share

(%)

― Total import amount 55,910 ― ― Total import amount 55,904 ― ― Total import amount 74,378 ―

1  8703

Passenger cars and

other automobiles

(Station wagons and

racing cars are

included;

automobiles limited

to designed mainly

for transportation

of personnel; ones

that stipulated by

No. 87.02 are

excluded).

4,500 8.0%  8703

Passenger cars and

other automobiles

(Station wagons and

racing cars are

included; automobiles

limited to designed

mainly for

transportation of

personnel; ones that

stipulated by No. 87.02

are excluded).

4,886 8.7%  8703

Passenger cars and

other automobiles

(Station wagons and

racing cars are

included; automobiles

limited to designed

mainly for

transportation of

personnel; ones that

stipulated by No.

87.02 are excluded).

11,365 15.3%

2  8708

Automobile parts

and accessories

Parts and

accessories limited

for automobiles

stipulated in No.

87.01 through No.

87.05

3,084 5.5%  8708

Automobile parts and

accessories

Parts and accessories

limited for automobiles

stipulated in No. 87.01

through No. 87.05

2,941 5.3%  8708

Automobile parts and

accessories

Parts and accessories

limited for

automobiles stipulated

in No. 87.01 through

No. 87.05

4,827 6.5%

3  8802

Other types of aircraft

(For example,

helicopters and

airplanes) and

spacecrafts (including

artificial satellite) and

rocket boosters

1,519 2.7%  8802

Other types of aircraft

(For example,

helicopters and

airplanes) and spacecrafts

(including artificial

satellite) and rocket

boosters

2,159 3.9%  8802

Other types of aircraft

(For example,

helicopters and

airplanes) and

spacecrafts (including

artificial satellite) and

rocket boosters

2,004 2.7%

4  8479

Machinery

(Limited to ones with

innate function;

excluding ones

suitable to other types

of this item)

1,403 2.5%  8479

Machinery

(Limited to ones with

innate function;

excluding ones suitable

to other types of this

item)

1,311 2.3%  8479

Machinery

(Limited to ones with

innate function;

excluding ones suitable

to other types of this

item)

1,635 2.2%

5  8542

Integrated circuit

1,313 2.3%  8504

Transformer, static

converter (for example,

rectifier) and inductor

1,239 2.2%  8504

Transformer, static

converter (for example,

rectifier) and inductor

1,615 2.2%

2008 2009 2010

Sources: World Trade Atlas

From the Table, commodities that contributed to the increase in China’s imports from Germany

were known to be “passenger cars and other automobiles (HS8703)” and “auto parts and

accessories (HS8708)”. Especially, importation of passenger cars and other automobiles

amounted to US$11.3 billion in 2010, which increased from US$4.5 billion in 2008, a 3-fold

increase within a span of only 2 years. The importation of auto parts and accessories, the second

most imported items, achieved a 1.5-fold increase in 2010 compared with that of 2008. This

means that the export of automobiles to China has been going strong from the German

viewpoint.

It is clearly known that China’s imports of automobiles from Germany increased by a large

amount as shown above. The importance of this as a part of China’s total imports of finished

cars should be examined. Figure 2-1-1-15 shows the share of imported “passenger cars and

other automobiles (HS8703)” by origin of export in 2000, 2008 and 2010.

During 2008 and 2010, Germany, being the top supplier of China’s automobile imports, further

extended its advantage over the second supplier, Japan and the third supplier, the United States.

China’s import amount of finished cars was US$760 million in 2000, approximately 1/40th

compared with that of 2010 (US$28.91 billion), but Japan accounted for more than 50% of the

share. Taking this into consideration, under the circumstance of rapid expansion of domestic

demand for automobiles in China, Germany extended its advantage over other countries in

fostering China’s automobile import demand and it led to the increase of German car exports to

China.

Figure 2-1-1-15 Share of imported “passenger cars and other automobiles (HS58703)” in

China by export countries/ regions (upper left 2008, upper right 2010 and lower center

2000)

Germany

32.1%

Japan

28.7%

U.S.A.

13.3%

U.K.

6.9%

South

Korea

6.7%

Others

12.3%

China

"Passenger car

Other car (HS8703)"

Total import

$14,040 million

Japan

23.5%

U.S.A.

11.0%

U.K.

7.3%

Others

13.4%

Germany

39.3%

South

Korea

5.5% China

"Passenger car

Other car (HS8703)"

Total import

$28,910 million

Japan

59.3%

Germany

23.0%

Sweden

4.7%

U.S.A.

3.1%

Hungary

2.2% Others

7.7%

China

"Passenger car

Other car (HS8703)"

Total import

760 million

FY2008 FY2010

FY2000 Sources: World Trade Atlas Souces: World Trade Atlas

Sources: World Trade Atlas

2. Deepening and changing the East Asia production network

As discussed above, Japan has decreased its presence in world trade over the past 10 to 20

years; and on the other hand, China increased its presence backed by the overwhelming

economic growth in recent years.

As it was examined in the previous White Papers, Japan and China have secured a position as

the “world’s factory” in the East Asia region by dynamically enhancing their economic situation

complimentarily and constructing and optimizing the production structure with regional

specialization. In the following section, it is confirmed how the East Asia production network

has been affected by the changes in the world trading structure over the past 20 years.

Specifically, it is verified that China exists as a major base to connect the production network in

the East Asia region with the products and consuming areas outside the region; the decreased

weight of the presence of Europe and the United States as final consumption areas; and the

presence of China as a self-sustaining consumption market backed by increased consumption in

China and other countries in the region, or the East Asia network beginning to show signs of

becoming a self-sustaining network, which does not necessarily need Europe and the United

States as final consuming areas. As a premise of the discussion, an outline of the Asia Pacific

regional economy is shown in the table (Table 2-1-2-1).

Table 2-1-2-1 Overview of Asia Pacific Region

Population Nominal

GDP

Nominal GDP per

capita

Total amount

of trade

Total export

amount

Total import amount

Export amount

to Japan

Import amount

from Japan

Direct investment

from Japan

Investment balance

from Japan

Year 2010 2010 2010 2010 2010 2010 2010 2010 2010 2010

Unit 100 million US$1 billion Dollar US$1

billion US$1 billion

US$1 billion

US$1 billion

US$1 billion

¥100 million

¥100 million

Brunei 0.004 13 31,228 11 8 3 3.7 0.2 13 -

Indonesia 2.34 707 3,015 293 158 136 25.8 17.0 409 9,738

Malaysia 0.28 238 8,423 416 231 185 20.6 19.4 906 8,128

Philippine 0.94 189 2,007 131 57 74 7.4 10.7 433 7,081

Singapore 0.05 223 43,117 665 354 311 16.4 24.5 3,319 22,417

Thailand 0.64 319 4,992 380 195 185 20.4 38.3 1,983 22,651

Cambodia 0.14 12 814 14 5 10 0.2 0.2 12 -

Laos 0.06 6 984 6 2 4 0.0 0.1 4 -

Myanmar 0.61 43 702 17 7 10 0.4 0.3 -5 -

Vietnam 0.88 104 1,174 164 68 96 7.4 9.0 636 3,668

Total of ASEAN 6.0 1,852 96,456 2,097 1,085 1,013 102.4 119.5 7,711 73,970

Japan 1.27 5,459 42,820 1,466 772 694 - - - -

China 13.41 5,878 4,382 2,974 1,580 1,394 120.3 176.3 6,284 54,187

Korea 0.49 1,007 20,591 857 442 415 26.0 68.5 936 12,261

Total of ASEAN 21.1 14,197 164,249 7,395 3,879 3,516 248.7 364.3 14,931 140,417

+ 3

India 12.16 1,538 1,265 574 217 356 5.0 9.6 2,411 11,051

Australia 0.22 1,236 55,590 426 212 214 40.1 18.4 5,622 32,487

New Zealand

0.04 140 32,143 62 31 31 2.4 2.3 -56 1,852

Total of ASEAN + 6

33.6 17,111 253,247 8,456 4,340 4,117 296.2 394.6 22,909 185,807

United States of America

3.10 14,658 47,284 3,246 1,278 1,968 60.5 123.6 7,968 205,246

Chile 0.17 203 11,828 125 66 59 6.8 3.0 508 -

Peru 0.30 153 5,172 58 29 28 2.0 1.1 47 -

Total of TPP 5.1 16,967 235,958 5,172 2,277 2,895 160.1 201.4 18,964 273,799

NAFTA 4.53 17,271 38,152 4,637 1,948 2,689 72.6 148.4 8,501 216,078

EU 5.01 16,282 32,497 10,159 4,987 5,171 50.7 80.3 7,146 148,506

World total 69.0 62,909 9,123 30,512 14,994 15,518 617.7 816.4 49,388 676,911

Notes: Nominal GDP per capita = Nominal GDP / population

Sources: IMF “World Economic Outlook Database April 2011” for nominal GDP; IMF “DOT” for amount of trade;

Ministry of Finance and Bank of Japan “International Balance Statistics” for direct investment amount; Eurostat for

population of EU; IMF “World Economic Outlook Database April 2011” for population of countries/ regions except

EU’s

(1) An overview of East Asia trading structure

The recent economy of the Asia Pacific region and the changes in the trading structures of East

Asian countries/ regions by production processes are briefly examined (Figure 2-1-2-2).

Figure 2-1-2-2 Composition of trade goods in East Asian countries/ regions by production

process

0.3%

0.4%

1.3%

28.7%

20.1%

27.2%

18.9%

19.5%

28.5%

33.5%

25.3%

26.7%

25.8%

33.8%

30.2%

6.5%

14.6%

11.6%

30.8%

27.8%

22.6%

7.7%

13.4%

10.6%

24.3%

18.5%

17.3%

23.6%

26.6%

23.9%

0% 20% 40% 60% 80% 100%

Export 1990

Export 2000

Export 2009

Import 1999

Import 2000

Import 2009

Material Processed goods Parts Capital goods Consumption goods

Sources: RIETI “RIETI-TID 2010”

Japan

1.4%

0.5%

0.8%

22.9%

22.9%

26.1%

25.7%

31.6%

31.8%

35.2%

30.9%

35.7%

15.9%

27.7%

32.6%

17.0%

23.5%

17.0%

13.7%

23.1%

23.5%

20.1%

15.9%

13.4%

43.3%

17.1%

11.3%

4.9%

6.8%

7.9%

0% 20% 40% 60% 80% 100%

Export 1990

Export 2000

Export 2009

Import 1999

Import 2000

Import 2009

Material Processed goods Parts Parts Capital goods Consumption goods

Sources: RIETI “RIETI-TID 2010”

Korea

9.7%

3.0%

1.1%

9.6%

15.6%

26.7%

22.7%

17.8%

18.5%

36.9%

38.4%

29.6%

3.6%

12.2%

17.2%

16.9%

23.7%

22.4%

9.8%

18.2%

28.7%

28.6%

17.6%

16.2%

54.2%

48.8%

34.5%

8.0%

4.8%

5.1%

0% 20% 40% 60% 80% 100%

Export 1990

Export 2000

Export 2009

Import 1999

Import 2000

Import 2009

Materia Processed goods Parts Capital goods Consumption goods

Sources: RIETI “RIETI-TID 2010”

China

16.6%

7.0%

11.0%

11.4%

9.3%

12.6%

32.5%

23.6%

30.3%

34.2%

27.9%

34.1%

14.8%

31.1%

24.7%

22.9%

37.8%

29.2%

11.7%

20.6%

15.2%

19.9%

15.9%

14.9%

24.4%

17.8%

18.8%

11.6%

9.2%

9.1%

0% 20% 40% 60% 80% 100%

Export 1990

Export 2000

Export 2009

Import 1999

Import 2000

Import 2009

Material Processed goods Parts Capital goods Consumption goods

Notes: Export and import within the region is included the trade. Sources: RIETI “RIETI-TID 2010”

ASEAN

The percentage of parts was the largest in the composition of traded goods by production

process exported from Japan in 2009. After 1990, the percentage of intermediate goods exports

continued to increase and it accounted for 58.7% of Japan’s total exports. The percentage of

materials imports became higher. Japan’s structure to export relatively advanced intermediate

goods worldwide and to depend on imports of the resources seemed to continue.

In China, consumption goods accounted for the largest percentage of exports in 2009 and the

final goods as a total of capital goods and consumption goods accounted for approximately 60%

(63.2%). Changes from 1990 showed that the percentage of consumption goods decreased and

percentage of capital goods increased. This means that, besides the advancement of the

industrial structure, produced consumption goods may possibly be consumed domestically. On

the import side, intermediate goods accounted for 52% and this became 78.7% when materials

were included. The characteristics of the export type production structure to import of

intermediate goods and export of final goods were shown.

In Korea, intermediate goods accounted for 64.4% of the exports in 2009. The percentage of

the intermediate exports was higher than that of Japan. It suggested that the structure became

similar to that of Japan in which the intermediate goods were the main engine to drive exports

and there may be competition between the two countries. Comparing with exports in 1990,

where final goods accounted for 57% of the total exports, it is known that a large shift in the

structure has occurred over the past 20 years.

In ASEAN, the export and import structures seemed to be relatively balanced with materials,

parts, processed goods, capital goods and consumption goods. The background of this may be

the fact that ASEAN countries have enhanced their supplementary functions among each other.

(2) China’s increasing presence as an assembly and export base

Constructing optimized specialization between production processes in East Asia has led to the

development of the East Asia production network. Specifically, Japan, Korea and Taiwan

produced relatively high value added parts and finished goods and China and ASEAN imported

the intermediate goods and assembled them to produce the final goods and supplied them to

Europe and the United States. The existence of the whole East Asia as the “world’s factory” had

been verified in previous White Papers.

Now, changes in the global and East Asia trading structures over the past decade are confirmed

once again. The main flow of trade in the East Asia production network is summarized from the

export amount of the intermediate and final goods in East Asia in 2009 and compared them with

those of 1999 (Figures 2-1-2-3 and 2-1-2-4). The structure to export the intermediate goods to

China and ASEAN and China and ASEAN export the final goods to Europe and the United

States was found in 1999, and the East Asia production network seemed to be functioning.

However, the final goods export from Japan to Europe and the United States were US$94.4

billion to the United States and US$50.7 billion to the EU. It is also known that the export

amount from Japan was larger than those of China and ASEAN to the United States and to the

EU.

Figure 2-1-2-3 Movement of trade of intermediate and final goods in East Asian countries/

regions (1999)

Figure 2-1-2-4 Movement of trade of intermediate and final goods in East Asian countries/

regions (2009)

In 2009, the export amount of each trade relationship increased compared with that of 1999,

but only exports of final goods from Japan to the EU and the United States decreased (exports to

the United States were US$94.44 billion in 1999, but decreased to US$51.14 billion in 2009,

and exports to the EU were US$50.71 billion in 1999 and decreased to US$44.33 billion in

2009). On the other hand, a large increase in the export amount of final goods were from China

to Europe (exports to the EU were US$37.69 billion in 1999 and increased to US$207.87 billion

in 2009) and the United States (exports to the United States were US$92.36 billion in 1999 and

increased to US$214.95 billion in 2009) and the export of intermediate goods from Japan,

Korea and ASEAN to China. The export amount of intermediate goods from Japan to China

continued to be the largest, but those of Korea and ASEAN increased rapidly to US$74.44

billion and US$64.05 billion respectively. It expanded almost to the same level of Japan

(US$88.14 billion).

On the other hand, exports of intermediate goods from Japan and Korea to ASEAN were larger

than those to China in 1999, but the amount has not increased greatly compared with the amount

of intermediate exports to China over the past 10 years. The largest intermediate goods export

destination of Japan and Korea was not ASEAN but China. Final goods exports from ASEAN to

the United States and EU also did not increase compared with those achieved by China to the

United States and the EU.

As shown above, in 1999, the East Asia production network was functioning as a system so

that ASEAN was a main supply base of intermediate goods; Japan and Korea exported

intermediate goods and assembled them in ASEAN; then exported them to advanced countries

in Europe and the United States as the final consumption areas. However, it is suggested that the

system has deepened and changed over the past 10 years; namely, (i) the East Asia production

network has been expanding its supply and demand of intermediate goods in the region; (ii) a

tremendously large part of the “assemble and final goods export” process for which ASEAN had

mainly played the role has been replaced by China and ASEAN and started to play a role

expanding the supply of intermediate goods to China. For example, Japan’s export of final

goods to destinations outside the region such as Europe and the United States decreased and

Japan’s export of intermediate goods to China increased. This suggests that China has become a

kind of “window” to connect the production network in the East Asia region with demand from

outside the region.

Examining the export of final goods from China to Europe and the United States, as shown in

the abovementioned triangle, the increase in exports to Europe were larger than the increase in

exports to the United States. Thus, China established its absolute position as a production and

export base in the East Asia production network. East Asian countries/ regions such as Japan

and ASEAN played their roles by supplying intermediate goods to China, i.e. a structure

emerged that Japan and ASEAN supplied goods to outside the region via China. The situation

can be recognized that China played the role as the window to connect the East Asia region with

countries/ regions outside East Asia. When a conceptual chart of the global trading structure was

shown with the triangle shown above, it also should be mentioned the fact that China together

with the United States and the EU formed a pole of the world trading structure was backed by

the burst of intermediate goods supply from Japan, Korea and ASEAN.

Secondly, assuming China as the only assembling and export base, it was estimated the amount

of trade of electric machine in the East Asia production network, which has notable specialized

productive structure and large amount of intra-regional trade(Figure 2-1-2-5). Specifically,

defining the total amount of intermediate goods exported from Japan, Korea, Taiwan and

ASEAN, and amount of final goods exported from China to the United States and the EU as the

amount of trade in the East Asia production network, we show the changes in share of that

amount of trade in the East Asia production network account for the whole economy. According

to the estimate, the amount traded in the triangle trade structure continuously increased until

2008. In 2009, the amount of trade decreased, affected by the world economic crisis, but the

percentage of the amount of trade within the triangle trade structure accounted for the whole

amount of trade increased by 23.5%. Comparing with 2009, the amount of trade increased

4.9-fold and the share to the whole trade increased 2.7-fold. It was shown that the East Asia

production network of trade, for which China was an assembling and exporting base, was

leading the trade of the member countries/ regions.

Figure 2-1-2-5 Movement of trade relating to East Asia Production Network

34 3649

73

106

136167 184 186

167

8.7%10.8%

13.5%16.6%

18.3%20.7%

21.9%23.3% 22.4% 23.5%

0

20

40

60

80

100

120

140

160

180

200

2000 2001 2002 2003 2004 2005 2006 2007 2008 2009

($ billion )

0%

10%

20%

30%

40%

50%

Trade amount relating to East Asia production network

Percentage of trade relating to East Asia network to the entire trade

(YEAR)

Notes: 1. It is assumed that the trade value related to East Asia production network = value of Chinese imports of

intermediate commodities from Japan/South Korea/Taiwan/ASEAN + value of Chinese exports of final

commodities to the EU and the U.S.

2. Percentage of trade related to East Asia network in the total trade = trade value related to the East Asia

production network / export amount to worldwide destinations from Japan/South

Korea/Taiwan/ASEAN/China

Source: RIETI "RIETI-TID2010"

(3) Japan to continuously expand intermediate goods exports

Now, Japan’s trade movement in the East Asia production network is fully confirmed. Japan

has played a role to produce relatively high value added parts and finished goods and provided

them as intermediate goods to assembly bases in China and other countries. Examining changes

in Japan’s export amount of intermediate goods by export destination, the export of intermediate

goods to the United States was larger than others until 2000, but exports to China, Hong Kong

and ASEAN grew to exceed those of the United States after 2000. Especially, the increase in

supply to China was significantly large and it grew to become approximately 8.2 times larger in

2009 than that of 1990 (Figure 2-1-2-6). Japan’s intermediate export worldwide reached a level

of approximately US$340.5 billion in 2009, and this was approximately a 2.6-fold increase over

that of 1990 (US$131.3 billion). Showing Japan’s share of the intermediate export amount by

destination, the share of China/ Hong Kong in Japan’s intermediate goods exports reached the

largest share of 31.6% in 2009, and it was approximately a 3-fold increase from that of 1990

(Figure 2-1-2-7).

Figure 2-1-2-6 Transition of intermediate goods export amount from Japan (by export

destination)

0

200

400

600

800

1,000

1,200

1,400

19

90

19

91

19

92

19

93

19

94

19

95

19

96

19

97

19

98

19

99

20

00

20

01

20

02

20

03

20

04

20

05

20

06

20

07

20

08

20

09

(US$10 million)

China + Hong Kong ASEAN

United States of America EU

Sources: RIETI “RIETI-TID 2010” (Year)

Figure 2-1-2-7 Transition of share of export amount of intermediate goods from Japan (in

1990, 1999 and 2009)

China + Hong

Kong

31.6%

ASEAN

15.7%

United

States of

America

11.2%

EU

11.5%

Others

29.9%

Sources: RIETI “RIETI-TID 2010”

2009

United

States of

America

26.9%

EU

17.6%

ASEAN

17.0%

China +

Hong

Kong

10.1%

Others

28.4%

Sources: RIETI “RIETI-TID 2010”

1990

United

States of

America

26.9%

China +

Hong

Kong

16.7%ASEAN

16.6%

EU

15.0%

Others

24.8%

Sources: RIETI “RIETI-TID 2010”

1999

(4) ASEAN, expanding regional trade and strengthening its independence

ASEAN, together with China, has played a role of an assembly base in the East Asia production

network. Specifically, it imported intermediate goods from Japan, Korea and Taiwan, assembled

and exported them to the advanced countries in Europe and the United States, the final

consumption destinations. Examining the movement of trade in ASEAN, while China increased

its presence as an assembly base, ASEAN was found to have deepened its trade over the past 10

years and 20 years in a pattern different from previous ones. Examining the share of the amount

of intermediate goods exported to ASEAN by foreign countries in 1990 and 2009, Japan had the

largest share of 22.9% as a country providing the intermediate goods in 1990. But in 2009, the

procurement from countries within ASEAN reached 21.1% largely exceeding Japan’s share of

11.8%, which ranked at the second (Figure 2-1-2-8).

Figure 2-1-2-8 Transition of share of export amount of intermediate goods to ASEAN (in

1990, 1999 and 2009)

ASEAN

23.3%

Japan

20.3%

United States

of America

16.0%

EU

11.5%

Taiwan

6.3%

Korea

5.9%

China

3.7%

Others

13.0%

Sources: RIETI “RIETI-TID 2010”

2009

Japan

22.9%

ASEAN

15.4%

EU

14.5%

United States

of America13.5%

Taiwan

5.0%

Korea

3.6%

China

2.4%

Others

22.6%

Sources: RIETI “RIETI-TID 2010”

1990

A S E A N

2 1 . 1 %

J a p a n

1 1 . 8 %

U n i t e d S t a t e s

o f A m e r i c a9 . 7 %

C h i n a

9 . 6 %

EU

9 . 1 %T a i w a n

6 . 1 %

K o r e a

6 . 0 %

O t h e r s

2 6 . 5 %

S o u r c e s : R I E T I “ R I E T I-T I D 2 0 1 0 ”

1999

In other words, Japan’s intermediate goods supply was replaced by procurement within the

ASEAN region, and it might be a sign that ASEAN is becoming self-sustaining in terms of

production. As the consumption size in the said region has steadily increased, it can be thought

that procurement, production and consumption will expand in the future and the self-sustaining

tendency may be further enhanced. In the discussion on above-mentioned triangular world

trading conceptual chart, unlike China and MERCOSUR, despite the fact that ASEAN was an

emerging region with remarkable growth, it rarefied its trade relations with other countries/

regions. This may be caused by the fact that ASEAN managed to deepen its trade within the

ASEAN region.

(5) Being a global “production and demand network”

The deepening of the East Asia network as the “world’s factory” has been so far examined

from the production side. It is shown in the following section that China is not merely an

assembling base as before but it is becoming a great demand center. The possibility of the East

Asia network to be a “world demand center” is to be confirmed. Examining the movement of

the amount of final goods exported from countries/ regions to China, the final goods exported

from countries/ regions rapidly increased after 2000 (Figure 2-1-2-9). Especially, it should be

noted that the increase in the amount and share of final goods exported from advanced countries

such as the EU and Japan has been remarkable in recent years. There were no such differences

in the export amounts of the EU, Japan and the United States in the 1990s, but through the

2000s, the EU achieved a 4.7-fold increase in its final goods export amount, and Japan also

managed a 4.1-fold increase and the United States was left behind.

Figure 2-1-2-9 Transition of final goods export amount to China

(By exporting countries/ regions; scale was calculated by dividing amount of 2009 by the

amount of 1999)

0

100

200

300

400

500

600

700

800

1990

1991

1992

1993

1994

1995

1996

1997

1998

1999

2000

2001

2002

2003

2004

2005

2006

2007

2008

2009

(US$100 million)

Japan

United States of America

ASEAN

EU27

Korea

Taiwan

EU: 3.7 times increase

Japan: 3.0 times increase

(Year)

Summarizing the final goods amount exported from countries/ regions to China in 2009 and

comparing them with those of 1999, it has been found that the final goods exported from the

countries/ regions have largely increased over the past 10 years (Figures 2-1-2-10 and 2-1-2-11).

Figure 2-1-2-10 Flow to export final goods to China (1999)

Figure 2-1-2-11 Flow to export final goods to China (2009)

Figure 2-1-2-12 Details of final goods export to China (by production process)

0

200

400

600

800

1,000

1,200

1,400

1,600

Capital goods Consumption goods Capital goods Consumption goods

1999 2009

(US$100 million)

Others

EU27

United States of America

Korea

Japan

292

76

1406

439

Sources: RIETI “RIETI-TID 2010”

hkae5381
長方形
hkae5381
スタンプ

As confirmed in the figures above, the increase in the number of final goods exported from the

EU and Japan is especially remarkable. The remarkable increase in the export of final goods

from the EU and Japan to China suggests that China has started to demand relatively high

value-added final goods produced in the EU and Japan. It shows that China has begun to

enhance markets not only quantitatively but also qualitatively. For some time past, the East Asia

network structure has functioned as the “world’s factory” to supply products to Europe and the

United States, but, with the overwhelming expansion of China’s demand, it is probably showing

signs that East Asia is becoming a self-sustaining network involving “China as a world demand

center”. One of the important reasons is the fact that the presence of Europe and the United

States has shrunk for the East network in the background of the global economic crisis. Seen in

this light, it can be said that the global economic crisis has triggered the change in the structure

of the East Asia production network.

As discussed above, the final goods exported from the countries and regions to China have

increased and China has become a large demand center for areas both within and outside the

region. The final goods imported by China are briefly discussed below. Examining details of the

capital goods and consumption goods in the final quantity of goods imported by China, the

percentage of capital goods was larger than that of consumption goods both in 1990 and 2009

(Figure 2-1-2-12). Contents of the capital goods may be production-related ones due to China’s

active construction demand and the increase in investment for procuring the necessary

equipment. In other words, the abovementioned increase in China’s final goods imports will

result in accelerating the production capacity within China and strengthen the competitiveness

of Chinese companies. The fact is confirmed that the final goods exported from the countries/

regions to China have increased and China is becoming to grow into a gigantic “world demand

center” for the exporting countries/ regions. However, it should be noted that the exporting

countries couldn’t always dominate China’s huge consumption market by exports.

Increases in incomes and the growth of the middle and wealthy classes in China are steadily

advancing and China’s potential to continue to grow as a consumption market is very high. In

the future, it is becoming increasingly important for Japan to provide products needed by the

China market by utilizing the close trade and investment relationship it has deepened under the

East Asia network. China and the growing Asian consumption markets will be thoroughly

analyzed in Chapter 3.

(6) India, incorporated into the East Asia trade and investment networks

Viewing the recent trade and investment structures in East Asia, it is evident that India has

been incorporated into the region’s trade and investment networks. Recently, India has

continued to achieve high economic growth. According to the IMF outlook, 8.2% growth in

2011 is expected. In this situation, many companies continue to expand their business targeting

the growing markets in India and presence of India in the regional trade and investment network

is being strengthened.

For instance, the trade between Japan and India was worth ¥939.1 billion in 2009 and ¥1,290.6

billion in 2010, approximately a 1.4-fold increase within one year. Goods exported from India to

Japan have been traditional commodities such as iron ore, precious stones and jewelry, but

recently exports of petroleum products have been rapidly increasing. Goods actively exported

from Japan to India are general machinery, electronics instruments, steel products and transport

machines. The direct investment from Japan to India amounted to ¥240.1 billion and the number

of Japanese companies operating in India was 725 (double that of 2007) in 2010 (Figure

2-1-2-13). According to a questionnaire sent to Japanese companies, India is the second likely

destination they would like to operate in after China for a period of about three years in future.2.

The Japanese companies cite the growth potential of the market is the main reason why they

regard India as a promising destination to operate in. According to the questionnaire, 89% of the

companies pointed out India’s growth potential. This far surpassed other reasons cited, such as

low labor costs (44%) and a supply base for assembling manufacturers (22%).

Figure 2-1-2-13 Transition of number of Japanese companies operating in India

(Year)0

200

400

600

800

Apr05 Jan06 Feb07 Jan08 Oct08 Oct09 10-Oct

248 267

362

550

438

627

725

Source: Reprint from the website of Japanese Embassy in India

Trade and investment relations between India and the East Asia region are expanding. India’s

export amount to ASEAN10 was US$17.37 billion in 2009, which accounted for 10.5% of

2 Jap “ Survey Report on Overseas Business Operation of Japanese Manufacturing Industry 2010

edition” by Bank of International Cooperation (JBIC)

India’s total export amount (US$165.2 billion). This was an 8.4-fold increase compared with

that of US$2.08 billion in 1999. India’s exports to China amounted to US$10.15 billion (the

structural ratio was 6.1%). This was a 20.4-fold increase compared with that of US$5 billion in

1999. And India’s imports from ASEAN10 in 2009 amounted US$23.94 billion (the structural

ratio was 9.3%). This was a 5.6-fold increase compared with that of US$4.29 billion in 1999.

Imports from China amounted US$28.83 billion (the structural ratio was 11.2%). This was

24.5-fold increase compared with that of US$1.18 billion in 1999.

Examining the tendency of India’s trade in the intermediate and final goods trade in East Asia,

the intermediate goods exported from East Asia to India and the final goods exported from India

to Europe and the United States were rapidly increasing. It may show that India as a new

intermediate goods assembling and exporting base that has been incorporated into the East Asia

network (Figures 2-1-2-14 and 2-1-2-15). Intermediate goods exported from East Asia to India

amounted to US$41.89 billion in 2009. The amount was 5.4-fold increase compared with that of

1999. Especially, the intermediate goods exported from China to India dramatically increased to

US$14.44 billion in 2009. This was a 15.5-fold increase compared with the amount in 1999.

And also, final goods exported from East Asia to India amounted US$19.63 billion at the time

of 2009 which was a 9.4-fold increase compared with the amount in 1999. India has increased

its presence as a great demand center backed by the size of population and significant economic

growth (Figures 2-1-2-16 and 2-1-2-17).

Figure 2-1-2-14 Movement of intermediate and final goods trade focused on India

Entire world1999 (US$100 million)

India

10.0Korea Japan14.9

33.4

Final goods Intermediate goodsEU United

States of

America

9.3

ASEAN 54.7China58.9

244.2

( East Asia

77.8)

Sources: RIETI “RIETI-TID 2010”

Figure 2-1-2-15 Movement of intermediate and final goods trade focused on India

Entire world2009

(US$100 million)

India

Korea Japan

121.6

(3.6 times

increase)

Final goods Intermediate goodsEU United

States of

America

144.4

(15.5 times

increase)

ASEAN

111.8

(2.0 times

increase)China

196.7

(3.3 times

increase)

1217.2 (5.0 times increase)

(East Asia

418.9 (5.4 times increase) )

Notes: Scales in parenthesis are ratio to value of 1999

Sources: RIETI “RIETI-TID 2010”

50.7

(5.1 time

increase)

41.0 (2.8 times

increase)

Figure 2-1-2-16 Flow of final goods export to India (US$100 million)

Entire world1999

(US$100 million)

India

2.2Korea Japan6.9

7.1

Final goodsEU United

States of

America

2.2

ASEAN9.4

China17.9

64.7

(East Asia 20.8)

Sources: RIETI “RIETI-TID 2010”

Figure 2-1-2-17 Flow of final goods export to India (US$100 million)

Entire world2009

(US$100 million)

India

Korea Japan

36.1

(5.1 times

increase)

Final goods Intermediate goods EU United States of

America

108.0

(4.9 times

increase)

ASEAN China

113.1

(6.3 times

increase)

422.8(6.5 times increase)

(East Asia 196.3

(9.4 times increase))

Notes: Scales in parenthesis are ratio to value of 1999

Sources: RIETI “RIETI-TID 2010”

19.2

(8.7 times

increase)

20.6

(3.0 times

increase)

45.1

(4.8 times

increase)

In this situation, more companies have placed greater importance on India as an export

destination rather than a destination of business operation.

According to the “Status Survey on Activities of Japanese Companies Operating in Asia and

Oceania” reported by JETRO, a large number of Japanese companies especially operating in

Singapore, Thailand and Indonesia regarded India as the most important market. Examining the

Japanese companies operating in Singapore and desiring to operate in India by type of industry,

the “shipping and warehousing industry” was the most dominant with 71.4%. This may be

caused by the expansion of Singapore’s logistics for India and the convenient access to India3.

Thus, India has been incorporated into the East Asia trade and investment networks, but

various problems have been pointed out in its business environment. According to the

questionnaire mentioned above, incomplete development of infrastructure (48% of the replies)

was stated as the greatest challenge. Other problems such as severe competition with others

(32%) and uncertainty in legislative enforcement were pointed out by many companies4. It is

expected that these problems can be improved and solved by the bilateral cooperation projects

and effectuation of the Economic Partnership Agreement (EPA)5 as well as Asia wide efforts of

“Asia Overall Development Plan6” and East Asia Comprehensive Economic Partnership

3, “Status Survey on Activities of Japanese Companies Operating in Asia and Oceania” by JETRO

4 Japan Bank of International Cooperation (JBIC)

5 Japan-India EPA is scheduled to be effective on August 1, 2011.

6 A strategy to integrally carry out the development of hard and soft infrastructures and promotion

Framework (Figure 2-1-2-18 and Figure 2-1-2-19).

Figure 2-1-2-18 Scene of Japan India EPA signing ceremony on February 16, 2011

Sources: Data from Ministry of Foreign Affairs

Sources: Data from Ministry of Foreign Affair

of industries in the Region formulated by the Economic Research Institute for ASEAN and East Asia

(ERIA) aiming at doubling the income in Asia. This was agreed at the East Asia Economic Ministers

Meeting in August 2010, and reported at the East Asia Summit Meeting in October, which was

appreciated by the leaders of the countries/ regions. Approximately 700 projects were listed as

specific hard infrastructure development targets in relevant areas and the priority of the projects was

decided. The total investment is expected to be approximately US$390 billion.

Figure 2-1-2-19 Outline of Asia Overall Development Plan

IEDC

MIEC

アジア総合開発計画

ERIAの研究プロジェクトの集大成の1つ。「経済統合の深化」と「開発格差の是正」を同時に追求すべく、経済理論を用いインフラ開発と産業立地を関連付ける空間デザインを策定。その中で、具体的なプロジェクトの投資効果、優先順位付けも実施。

実現すれば民間企業にも大きな利益に。また、その一部はインドネシア・ユドヨノ政権の優先政策に採用(インドネシア経済回廊=IEDC)。

ERIAが約700本のプロジェクトを格付け。総額約4000億ドルの投資。

CADPの将来プロジェクト(ロングリスト)総括表

To

tal

Meko

ng

BIM

P+

IMT

+

Total 695 452 190 61

Priority

Top Priority 170 113 51 14

Priority 166 87 56 23

Normal 359 252 83 24

Tier

Tier 1 178 109 63 6

Tier 2 313 217 59 45

Tier 3 204 126 68 10

Type

Public 541 358 146 45

PPP 154 94 44 16

2008年 約4270ドル

2020年 約8540ドル

域内の一人当たりGDPが2020年までに2倍に。

インフラ開発市場のビジネスチャンス

中間所得層の拡大によるビジネスチャンス

地域内のインフラプロジェクトの地域大の経済効果を最新のモデルで分析(GDPへの10年間の累積経済効果)

Philippine

Deli Mumbai Industrial

Main Artery

Mekong India Industrial main artery

BIMP broad area

development

Mekong Overall Development

Ho Chi Minh

IMT growth triangle zone

Indochina Economic Corridor

Bangalore

South India Core Base

Development Framework

Deli

Mumbai

Chennai

BruneiMalaysia

Indonesia

Sources: Ministry of Economy, Trade and Industry

3. Changing global trade structure and Japan’s future

Changes in the global trade structure in recent years, especially the movement of trade in the

East Asia production network were discussed above.

As having shown using triangular conceptual charts of the global trade structure at the start of

the discussion, a pole of the world trade, which was played by Japan together with the EU and

the United States in 1990, seemed to be replaced by China after 20 years. Similarly, it was

discussed that the trade relationships of Japan with each pole of ASEAN seemed to be relatively

Asia Overall Development Plan The plan is one of the integrated achievements of Economic Research Institute for ASEAN and East Asia (ERIA) research projects. In order to seek the “deepening economic unification” and “correction of development gaps” at the same time, a space design to connect the infrastructure development and industrial location is formulated by using economic theory. In these conditions, the investment effects of specific projects are verified and the projects are prioritized. When those are realized, it may have great benefits to private companies. A part of the research projects has been adopted by President Yudhoyono, Indonesia as a priority measures (Indonesia Economic Development Corridor (IEDC)).

Business opportunity in the infrastructure

development markets

ERIA rated about 700 projects. The investment will

be approximately US$400 billion in total.

Business opportunity by the expanding

middle-income group

GDP per capita in the region will be doubled by 2020.

Approximately US$4,270 in 2008

Approximately UA$8,540 in 2020

Economic effects of the infrastructure projects in the region are analyzed with the newest model.

(Ten years accumulated economic effects to GDP)

General list of CADP future projects

(long list)

rarefied.

However, upon close examination, the East Asia network including Japan and ASEAN have

significantly expanded the amount of trade exceptionally in the world and have deepened their

trade relationships over the past 20 years. Undoubtedly, China rapidly enhanced its presence in

the global trade structure, but one of its important factors was China’s establishment of its

position in the East Asia production network as a production and export base and the stronger

presence of China to connect inside and outside of the East Asia region.

The background to this, as mentioned above, was the expanded supply of intermediate goods

from countries/ regions in East Asia including Japan, Korea, Taiwan and ASEAN to China.

Japan and ASEAN, on the surface, seemed to rarefied their presence in the global trade structure,

but it may be said that the optimized specialization system has been increasingly advancing in

East Asia by active cross-border business activities including the direct investment of Japanese

companies.

As previously shown using the global trade conceptual charts, the world economic crisis

affected the global trade structure. In that situation, the East Asia production network continued

to deepen and showed a slight sign of changes and improvement. After the world economic

crisis triggered by the Lehman shock, stagnation of global demand, especially in the advanced

countries in Europe and the United States, became serious. On the other hand, rapidly

recovering Asian countries in region such as China and ASEAN led the growth of the world

economy. Following this situation, the “East Asia production network”, which had depended on

consumption of Europe and the United States, begun to seek final goods as a demand center

within the region, and to have a self-sustaining nature as “East Asia being the production/

demand network”. This represents one of the positive changes and improvements. Demand

continued to increase the supply not only within the region but also outside the region. The

“world’s factory” has maintained and strengthened its position and at the same time has been

becoming a “world demand center”.

However, as mentioned above, currently, increased import “demand” does not always show the

consumption demand and the transactions of consumption goods within the region are not large

compared with total transactions. On the other hand, increases in the income and population of

middle and wealthy classes have progressed steadily and high potential as a consumption

market has undoubtedly increased. In order to acquire the world’s largest growth energy, the

most important thing for Japan will be the further promotion of bold and active trade

investments by Japanese companies, which have been the foundation to establish and deepen

the East Asia production network and supplying products satisfying the needs of the enlarged

global market. For example, if a virtuous cycle is created and Japanese companies further

develop local production and sales suitable to the markets in the region, boost the local potential

demand, promote the expansion of markets, and set off increased supply from Japan, it will

contribute to the further development of Asia as a whole. Overseas deployment of Japanese

companies will be further analyzed in Chapter 3.


Recommended