Page 1
- 48 -
Chapter 2. Development of RNA interference for
genomic studies and therapeutic applications
2.1 Introduction.
RNA interference (RNAi) is an exciting new technology that involves the use of small interfering
double stranded RNA (siRNA). RNAi is a protective innate response observed in a wide variety of
organisms, and is a feature of all eukaryotes. At the cellular level, the detection of a double stranded
RNA molecule triggers the specific degradation of the mRNA of an exact sequence to an expressed
gene, leading to loss of phenotype. This technology has been developed as the method of choice to
produce gene knockouts for high throughput functional genomic studies in a number of species,
opening the way to utilize this for studies in the chicken. As well as genomic studies, RNAi has
potential for therapeutic applications. For example, siRNA molecules against essential viral genes
have been shown to reduce viral loads in cell culture. Gene specific therapeutics for cancer and auto-
immune diseases are also being investigated and show promise in in vitro systems. A major obstacle to
overcome in the development of RNAi therapeutics is efficient delivery of siRNA’s into target cells in
vivo. This has been dramatically advanced by CSIRO’s discovery that small hairpin loop RNAs
(shRNAs), transcribed from DNA elicit RNAi in vertebrate animal cells. This now enables DNA
delivery systems such as plasmids, bacterial and viral vectors to be developed for targeted delivery of
shRNAs to animals for therapeutic RNAi use.
A major focus of the project work undertaken in Strategy 2 has been the development of DNA
delivery systems to express shRNAs in chicken cells. Foremost to this work was the identification and
characterisation of the chicken polymerase III family of promoters for optimised expression of RNAi
molecules. This was central to subsequent project work that applied RNAi technology to functional
genomic studies linked with Strategy 1 and antiviral therapeutic development for chicken anaemia
virus (CAV). Following a review of the RNAi work in March 2007, the major focus of project work
was directed to the potential to use RNAi to control expression of genes with important production
benefits, in particular genes that determine sex differentiation and genes negatively regulating muscle
development. This work has been very successful and has lead to two patent applications and a
collaborative project with researches at the University of Melbourne to confirm the role of the DMRT1
gene in male sex determination in chickens. This work was published in Nature.
Page 2
- 49 -
Outcomes
1. RNAi developed for routine in vitro and in ovo use as a gene knock-down tool to study the
function of genes identified by genomic studies, including those responsible for sex-
determination and muscle development (see Strategy 1).
• 4 publications
i. Wise T, Schafer D, Lambeth L, Tyack S, Bruce M, Moore R, Doran T (2007)
Characterisation and application of a chicken U6 promoter for expression of
small hairpin RNAs. Animal Biotechnology 18: 156-163.
ii. Bannister SC, Wise TG, Cahill DM, Doran TJ (2007) Comparison of chicken
7SK and U6 RNA polymerase III promoters for short hairpin RNA
expression. BMC Biotechnology 7: 79-88.
iii. Hinton TM, Wise TG, Cottee PA, Doran TJ (2008) RNA loop structures are
important for efficient processing of short hairpin RNAs for gene silencing.
RNAi and Gene Silencing 4: 295-301.
iv. Smith CA, Roeszler KN, Ohnesorg T, Cummins DM, Farlie PG, Doran TJ,
Sinclair AH The conserved avian Z-linked gene DMRT1 is required for male
sex determination in the chicken embryo. Nature. 461: 267-271.
2. RNAi developed as an anti-viral agent (e.g. CAV)
• 1 publication
i. Hinton TM, Doran TJ (2008) Inhibition of chicken anaemia virus replication
using multiple short-hairpin RNA. Antiviral Research 80: 143-149.
ii.
3. Generation of IP and potential commercial products identified via proof-of-concept.
• 2 patent applications
i. Commonwealth Scientific and Industrial Research Organisation, Australian
Poultry CRC Pty Ltd
International Patent Application PCT/AU2008/000835
Entitled: "Modulating production traits in avians"
ii. Commonwealth Scientific and Industrial Research Organisation, Australian
Poultry CRC Pty Ltd
United States of America Provisional Patent Application 61/138235
Entitled: "Methods of modulating the sex of avians"
Page 3
- 50 -
2.2 Results
2.2.1 Outcome - RNAi developed for routine in vitro and in ovo use as a gene
knock-down tool to study the function of genes iden tified by genomic
studies, including those responsible for sex-determ ination and muscle
development (see Strategy 1).
2.2.1.1 Characterisation and application of a chick en U6 promoter for expression of
small hairpin RNAs.
The naturally occurring cellular process of RNA interference (RNAi) is used to induce sequence
specific gene knockdown to control gene expression. The conserved RNAi pathway involves the
processing of double stranded RNA (dsRNA) duplexes into 21-23 nucleotide (nt) molecules known as
small interfering RNAs (siRNA) to initiate gene suppression (Fire 1999; Hannon 2002). This intrinsic
cellular process has been exploited for the extensive analysis of gene function in plants, invertebrates,
and more recently mammalian cells. Since the initial discovery of RNAi in animals (Fire et al. 1998),
the use of homologous long dsRNA has been effectively used in lower eukaryotes as a method to
study gene function. However, in higher order eukaryotes such as vertebrates, the cellular processing
of long dsRNA can induce an interferon (IFN) mediated antiviral defence mechanism that ultimately
leads to non-specific translational shutdown and apoptosis. This non-specific cellular activity can be
circumvented by the direct transfection of in vitro synthesised siRNAs of up to 30 nucleotides (nt) in
length into mammalian cells. These short molecules do not activate the IFN response, but can induce
reliable and efficient transient knockdown of target genes. Since this discovery, the development of
DNA-based vectors for expression of short hairpin RNA (shRNA) molecules that are processed within
the cell to produce active siRNA molecules has progressed rapidly.
DNA-based expression of shRNA offers some advantages over in vitro synthesised siRNA. Vector
construction is less expensive compared to the chemical synthesis of siRNA, selection of transfected
cells is possible via antibiotic markers and the option of inducible shRNA transcription is also
available. Vectors for shRNA expression have been engineered using both plasmid and viral-based
systems that often utilize promoters from a small subclass of pol III promoters, known as type 3, to
drive the expression of shRNA. Promoters of this subclass are often preferred because they naturally
direct the synthesis of small, highly abundant non-coding RNA transcripts, do not contain intragenic
control regions and have defined termination sequences consisting of 4-5 thymidines (Ts).
Page 4
- 51 -
The U6 small nuclear RNA (snRNA) promoters are the best studied type III pol III promoters
commonly used in RNAi expression vectors. They contain promoter element sequence motifs located
within enhancer and core regions. The core region comprises a proximal sequence element (PSE) and
a TATA-like element, and the enhancer region, also known as the distal sequence element (DSE),
consists of an octamer motif (OCT) and an SPH element. The human U6 gene encodes a 107 nt
snRNA and from the estimated 200 copies in the human genome nine full-length loci have been
identified. These nine loci are dispersed throughout the genome and five were found to have
associated promoter regions, each displaying differential activities. Recently, Kudo and Sutou (2005)
identified four full-length U6 genes in the chicken genome, with recognisable pol III promoter element
sequences upstream. We too have independently identified the same chicken U6 promoters and report
here a comparison of their use in shRNA expression vectors for RNAi.
Methods
Characterisation of chicken U6 promoters
Chicken U6 snRNA sequences were identified by comparison of the full-length human U6 snRNA
sequence to the chicken whole genome sequence using Megablast
(http://www.ncbi.nlm.nih.gov/genome/seq/GgaBlast.html) with default parameters. Identified
sequences for each were checked for repeat elements using the pre-masked chicken genome
(http://www.repeatmasker.org/). Based on the presence of pol III promoter element sequence motifs,
four predicted U6 promoter sequences were identified (cU6-1, cU6-2, cU6-3 and cU6-4). Chicken
genomic DNA was isolated from whole blood using a Wizard Genomic DNA purification kit
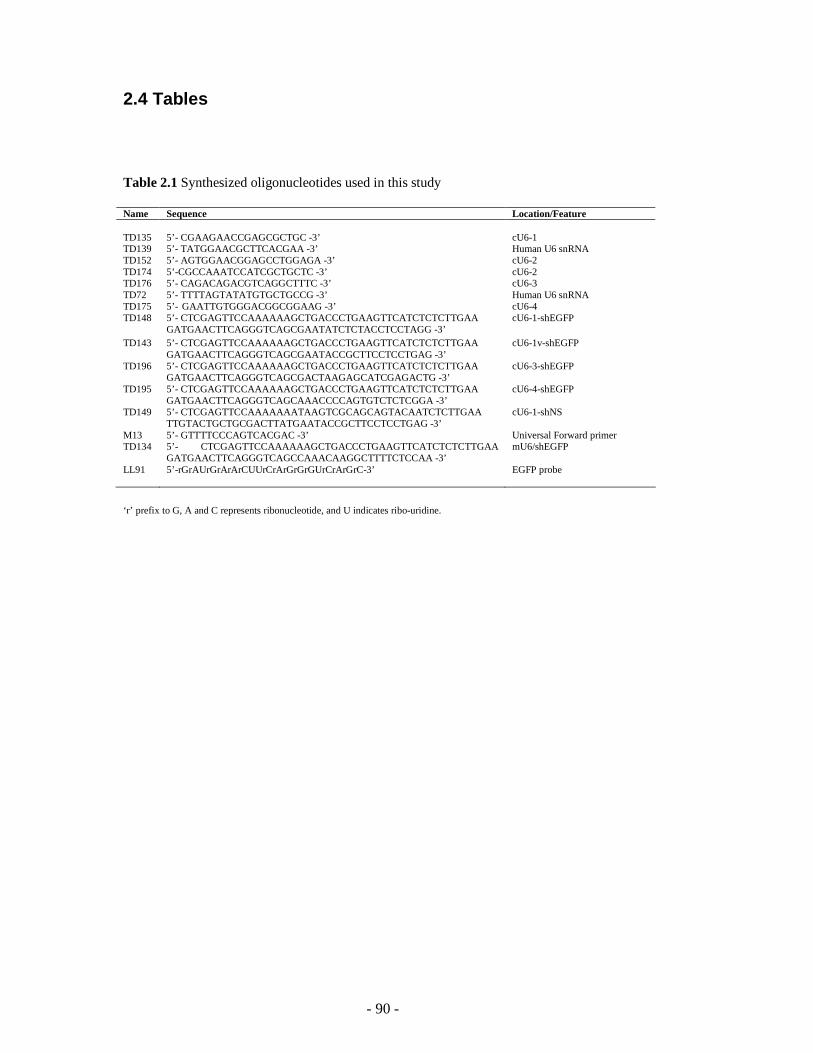
(Promega) for use as template in PCR. Each promoter was amplified by PCR using primers TD135
and TD139 (cU6-1), TD152 / TD174 and TD139 (cU6-2), TD176 and TD72 (cU6-3) and TD175 and
TD139 for cU6-4 (sequences shown in Table 2.1). All oligonucleotides were obtained from
GeneWorks Pty. Ltd. (Adelaide, Australia). PCR products were obtained for cU6-1, cU6-3 and cU6-4
and each were ligated into pGEM-T Easy and sequenced.
Expression vector construction and shRNA target sit es
The cloned chicken U6 promoters were used as templates to construct EGFP shRNA expression
plasmids using a one-step PCR approach. PCR for the construction of four plasmids used the primer
pairs TD135 and TD148 (cU6-1), TD135 and TD143 (cU6-1v), TD176 and TD196 (cU6-3) or TD175
and TD195 (cU6-4). The reverse primers in each PCR were designed to comprise the last 20 nt of each
promoter sequence, EGFP shRNA sense, loop, and EGFP shRNA antisense sequence (Table 2.1) and
were HPLC purifed to ensure full length. The EGFP siRNA sequence was from Kim & Rossi (2003).
Page 5
- 52 -
All three PCR products for shRNA expression constructs were ligated into pGEM-T Easy (Promega)
and sequenced. A chU6-1v irrelevant control plasmid was also constructed. Forward primer TD135
was paired with reverse primer TD149 comprising the last 20 nt of the chU6-1 promoter and all other
irrelevant shRNA components. The PCR product was ligated into pGEM-T Easy and sequenced.
A mouse U6 EGFP shRNA construct was produced using one-step PCR with pSilencer 1.0-U6 siRNA
Expression Vector (Ambion) as template. Universal primer M13 Forward was paired with reverse
primer TD134, comprising the last 20 nt of the mouse promoter, and all other EGFP shRNA
components. The PCR product was ligated into pGEM-T Easy and sequenced.
Cell culture and transfection
DF-1 (ATCC CRL-12203, chicken fibroblast) cells were cultured in Dulbecco’s Modified Eagle’s
Medium (DMEM) containing 4.5g/l glucose, 1.5g/l sodium bicarbonate, 10% foetal calf serum (FCS),
2mM L-glutamine supplemented with penicillin (100 U/ml) and streptomycin (100 µg/ml). Vero
(ATCC CCL-81, African green monkey kidney) cells were cultured in Eagle's minimal essential
medium (EMEM) medium containing 1.5g/l sodium bicarbonate,10% fetal calf serum (FCS), 2 mM
glutamine, 10 mM HEPES, supplemented with penicillin (100 U/ml) and streptomycin (100 µg/ml).
All cells were cultured in humidified atmosphere containing 5% CO2 at 37°C and were grown to
approximately 90% confluence on either 24-well plates (Nunc) for Flow Cytometry or on 8-well
chamber slides (Lab-Tek) for fluorescence microscopy. Cotransfection with 500 ng of plasmid DNA
(shRNA plasmids and/or pEGFP-N1 (Clonetech), was carried out using Lipofectamine 2000
(Invitrogen) according to the manufacturers instructions and was completed in triplicate for each
transfection.
EGFP knockdown assays
EGFP expression was monitored at 48-hours post-transfection using fluorescence microscopy (Leica
DMLB). Cells to be analysed by flow cytometry were trypsinized, washed in PBSA, resuspended in
200 µL of 0.01% sodium azide and 2% FCS in PBSA and analysed using a FACScalibur (Becton
Dickinson) flow cytometer. Data analysis was performed using CELLQuest software (Becton
Dickinson).
Page 6
- 53 -
shRNA detection
Detection of EGFP shRNAs (shEGFP) was carried out using an RNAse protection assay on extracts
enriched for small RNAs isolated from transfected Vero cells using the mirVana microRNA (miRNA)
Isolation Kit (Ambion). An RNA oligonucleotide complementary to the EGFP shRNA sequence
(LL91) was end labelled with [gamma-32P] ATP using the mirVana Probe & Marker Kit (Ambion) and
hybridised to the enriched RNAs using the mirVana miRNA Detection Kit (Ambion). The RNA
fragments were then separated by electrophoresis on a 15% denaturing polyacrylamide/ 8 M Urea gel
and detected by autoradiography.
Results
Characterisation and isolation of chicken U6 promot ers
We used the 107 nt human U6 snRNA sequence to search the chicken genome sequence for potential
U6 promoters. The search identified three sequences containing a 107 nt region with 100% identity to
human U6 snRNA and one sequence with 99% identity. Analysis of upstream regions of these four
sequences revealed promoter elements associated with other pol III promoters. These were the same
four sequences recently reported by Kudo and Sutou (2005), named cU6-1, cU6-2, cU6-3 and cU6-4.
We independently designed PCR primers (Table 2.1) to amplify the four predicted promoters from
genomic DNA purified from chicken blood. We could only obtain PCR products for the predicted
promoters of cU6-1, cU6-3 and cU6-4 and these were cloned into pGEM-T Easy and sequenced (Fig.
2.1). Similar to Kudo and Sutou (2005) our sequences were confirmed by analysing several
independent clones, which had been amplified from genomic DNA isolated from two different
chickens. Our cloned promoter sequences had some minor differences outside of the pol III promoter
element sequences compared to the database and for cU6-1 we cloned a variable PCR product from
one of the independent chicken genomic DNA samples. This variant sequence was also confirmed by
analysing several independent clones and the predicted promoter was named cU6-1v. One of the
sequence variances of potential importance in cU6-1v, is a single nt substitution in the conserved PSE
sequence and we therefore decided to use this promoter along with cU6-1, cU6-3 and cU6-4 in the
construction of plasmids to compare expression of shRNAs.
Page 7
- 54 -
shRNA expression vector construction and validation
Each of the predicted promoter sequences cU6-1, cU6-1v, cU6-3, cU6-4 and the mouse U6 were used
as templates to construct shRNA expression vectors targeting EGFP, via a one-step PCR reaction (Fig.
2.2). Full-length amplified expression cassette products were ligated into pGEM-T Easy and then
sequenced to confirm the promoters were correct. The final shRNA expression plasmids were named
pcU6-1-shEGFP, pcU6-1v-shEGFP, pcU6-3-shEGFP, pcU6-4-shEGFP and pmU6-shEGFP
respectively. An irrelevant control shRNA vector (pcU6-1v-irrshRNA) was also produced using the
cU6-1v sequence as template. Each plasmid was constructed so that the start of each shRNA sequence
was at the +1 position of the native U6 snRNA transcripts. A XhoI restriction enzyme site was
engineered downstream of the termination signal to allow screening for full-length shRNA products
inserted into pGEM-T Easy which lacks a XhoI site. All final shRNA expression vectors consisted of
either one of the full length chicken U6 promoters or the mouse promoter, a shRNA sense sequence, a
loop sequence, a shRNA antisense sequence, a termination sequence and a XhoI site.
Validation of each expression construct encoding shRNA sequences targeting EGFP was first
conducted in Vero cells (Fig. 2.3). This cell line lacks the interferon α, β and ω genes indicating that
the reduction in EGFP expression was attributable to RNAi and not a non-specific inhibition of protein
translation characteristic of the IFN response triggered by exogenous dsRNA. To confirm that any
observed reduction in EGFP expression was a direct result of RNAi induced by the expression of
specific shRNA sequences, the transcription of these molecules was analysed in transfected Vero cells.
A radiolabelled RNA probe complementary in sequence to the EGFP shRNA sequence was used in an
RNAse protection assay to visualise the molecules. The mouse miRNA miR-16 probe used as a
loading control for each condition produced a strong signal at the expected size for all samples. The
EGFP shRNA was detected only in those samples that were transfected with the vectors containing the
EGFP shRNA target sequence (Fig. 2.3C). All shRNA constructs were then tested in DF-1 cells for
comparison of the chicken promoters in a homologous cell line. For each transfection condition,
knockdown of EGFP was visualised by fluorescence microscopy (Fig. 2.3A) and flow cytometry was
used to determine the mean fluorescence intensity (Fig. 2.3B). Results in both cell lines showed that
the knockdown induced by pmU6-shEGFP was greatest compared to the four chicken plasmids. All
four chicken plasmids gave a similar degree of knockdown in DF-1 cells however there was some
variability in Vero cells. Interestingly, pcU6-1v-shRNA produced a greater knockdown in Vero’s
compared to pcU6-1-shRNA, suggesting that the variant cU6-1 promoter is stronger in the monkey
cell line. Of the chicken plasmids, pcU6-3-shRNA produced the greatest degree of knockdown in the
Vero cell line, and this appeared to correlate with the intensity of the shEGFP signal detected in the
RNAse protection assay (Fig. 2.3C).
Page 8
- 55 -
Discussion
The use of type 3 pol III promoters for shRNA expression in vertebrate systems has been an
understandable choice because of their native function in small RNA expression. Until recently this
has been limited to pol III promoters derived from human and mouse, and now Kudo & Sutou (2005)
have reported the identification of chicken U6 promoters for shRNA expression. We too have
independently characterised four chicken U6 promoters and used them to construct shRNA expression
plasmids so that we could compare them for RNAi in a chicken cell line. Our aim was to identify
which U6 promoter was best for expressing shRNA in chicken cells for future functional genomic
projects. RNAi has become a standard approach to knock down gene expression for the functional
study of both human and mouse genes and RNAi will become increasingly important to study the role
of genes identified in genomic studies that stem from the recent completion of the chicken genome.
These studies will include the continued development and application of shRNA expression vectors in
chick embryo’s, where the chicken is used as an important model for large-scale analysis of vertebrate
development.
We cloned and sequenced three of the four predicted U6 promoters (cU6-1, cU6-3 and cU6-4) that
were identified in upstream regions of sequences matching the chicken U6 snRNA gene. All contained
pol III promoter element sequence motifs including the TATA-box, PSE and OCT domain, located
within the enhancer and core regions. The location and spacing of these elements is similar for all
known type 3 pol III promoters and their requirement for pol III activity is well documented. Within
the core region of each chicken promoter sequence were the PSE element and TATA-like element.
The spacing of both elements was very conserved which is consistent with previous findings with the
human U6 promoters (Fig. 2.1). The importance of this spacing has been highlighted by the finding
that a deletion or insertion of >2-3 bp results in drastically reduced transcription. Within the enhancer
region we could define the typical OCT motif but not the SPH element. Kudo and Sutou (2005)
reported that they too were unable to identify a typical SPH element for the chicken promoters, but
also they could not identify the PSE element that we have defined in the predicted position upstream
of the TATA-box.
The mouse U6 promoter used in the pSilencer 1.0-U6 siRNA Expression Vector also features these
element sequences and as it has been shown to be stronger than the human U6-1 promoter in vitro, we
used it as a benchmark for promoter comparison for shRNA expression. Similar to the report of Kudo
and Sutou (2005), the chicken shRNA plasmids gave a similar degree of knockdown in a chicken cell
line. However, we observed a high degree of variability in Vero cells, particularly for the plasmids
containing cU6-1 and the variant cU6-1v. pcU6-1v-shRNA induced a greater knockdown compared to
pcU6-1-shRNA, suggesting that the variant cU6-1 promoter is stronger in the monkey cell line. One
Page 9
- 56 -
sequence difference of potential importance in cU6-1v, is a single nt substitution within the conserved
PSE sequence. This is the only sequence difference that occurs within any of the pol III promoter
sequence elements for cU6-1. There is no spacing difference between the TATA-box and PSE
element, so it is therefore tempting to suggest that this change may be the reason for enhanced activity
in Vero cells. Results in both DF-1 and Vero cells showed that the knockdown induced by pmU6-
shEGFP was greatest compared to the four chicken shRNA plasmids. We predicted that a native
chicken U6 promoter may have been more effective for shRNA expression in the DF-1 chicken cell
line than the mouse U6 promoter. Kudo and Sutou (2005) also expected that their chicken U6 shRNA
vectors would induce greater silencing of a target gene in chicken cells than another commercially
available vector with a human U6 promoter. In their experiment this human U6 vector induced a
greater silencing of the target gene and they suggest the difference might reflect the additional junction
sequences between the promoters and the synthetic DNA encoding shRNAs. All of our plasmids were
constructed so that the start of the shRNA sequence was at the +1 position of the native U6 snRNA
transcripts for each promoter. Because the chicken promoters were not stronger than the benchmark
mouse U6 promoter, we suggest that the promoter sequence and structure is a much more important
factor in determining efficiency in vitro rather than origin alone. Therefore we would currently
recommend the use of the mouse U6 promoter for shRNA expression in chicken cells for gene
silencing experiments.
2.2.1.2 Comparison of chicken 7SK and U6 RNA polymerase III promoters for
short hairpin RNA expression.
RNAi is a sequence-specific gene silencing mechanism initiated by 21-25 nucleotide (nt) duplexes
known as small-interfering RNAs (siRNAs). siRNAs are processed from long double-stranded RNA
(dsRNA) molecules by the ribonuclease III enzyme Dicer and are unwound and loaded as single-
stranded RNAs into the RNA induced silencing complex (RISC). RISC silences gene expression via
cleavage of messenger RNA (mRNA) transcripts complementary to the loaded siRNA sequence.
RNAi-mediated silencing of specific genes in vertebrates can be harnessed by transfection of siRNA
duplexes or DNA vectors which express siRNAs as short-hairpin RNAs (shRNAs). shRNAs are
transcribed from these vectors as 19-29 nt inverted repeat sequences, separated by a 4-10 nt loop
sequence and fold spontaneously to form hairpin structures, which are cleaved by Dicer into active
siRNAs.
RNA polymerase III (pol III) type 3 promoters are most commonly used to express shRNAs, as these
promoters transcribe endogenous small-nuclear RNAs (snRNAs) such as U6 and 7SK. Termination of
transcription by Pol III also occurs at defined tracts of 4-5 thymidines (T4-5), which can be inserted
Page 10
- 57 -
downstream of shRNA coding sequences to ensure direct termination. Unlike type 1 and 2 promoters,
pol III type 3 promoters are located entirely upstream of transcription start sites (+1) and feature
characteristic promoter elements including; a TATA box beginning at around bp -20 (relative to +1), a
Proximal Sequence Element (PSE) centred around bp -50 and a Distal Sequence Element (DSE)
beginning around bp -240. In the human U6 and 7SK (h7SK) promoters, the DSE is comprised of at
least one Octamer (OCT) motif and an SphI Post-octamer Homology (SPH) domain. The DSE of the
human 7SK (h7SK) also, contains an additional CACCC box enhancer located between the OCT and
SPH elements. U6 promoters are the most common type used in vector-based shRNA expression
systems, however, more recent approaches have preferred the use of 7SK promoters.
Given the recent completion of the chicken genome project (Hillier et al., 2004), the adaptation and
use of shRNA expression systems for RNAi in the chicken will be important for ensuing functional
genomics studies. However, to date, most shRNA expression systems used in chickens feature
mammalian pol III promoters. Although several chicken U6 (cU6) promoters have now been
characterised and shown to drive efficient shRNA-mediated RNAi activity in chickens (Kudo and
Sutou, 2005; Wise et al 2007), recent work has highlighted that 7SK promoters in human (h7SK) and
bovine (b7SK) can stimulate more efficient shRNA expression and RNAi activity than corresponding
U6 promoters. Given that expression of the 7SK snRNA appears to be conserved across non-
mammalian and mammalian vertebrates we sought to investigate whether a chicken 7SK promoter
(ch7SK) would also confer greater levels of shRNA-mediated RNAi activity than the recently-
characterised cU6 promoters.
Methods
Isolation of the ch7SK promoter from chicken genomi c DNA
The ch7SK promoter sequence was amplified from chicken genomic DNA extracted from chicken
embryo fibroblast (DF-1) cells (ATCC, CRL-12203) (Wizard® Genomic DNA purification kit,
Promega), using the primers: forward (TD245): 5’- GTCCAGCCATCCACCTCCCACCAATACTTC
-3’ and reverse (TD237): 5’- AAAGCTACGAGCTGCCCCAA -3’. Gradient PCR was conducted
using; 9.5 ng of genomic DNA, 100 ng of each primer (TD245 & TD237), 2 mM MgCl2 (Qiagen), 250
µM dNTPs (Promega), 1 X PCR buffer (Qiagen) and 1 unit of Thermus acquaticus (Taq) polymerase
(Promega), in a Mastercycler EP Gradient S thermocycler (Eppendorf AG). Cycle conditions were:
94°C – 5 minutes, 35 cycles of; 94°C – 1 minute, 69.4°C – 45 sec and 72°C – 1 minute, with a 5
minute final extension at 72°C.
Page 11
- 58 -
A single PCR product of approximately 780 bp was amplified, purified using the Wizard SV PCR and
Gel cleanup kit (Promega) and cloned using the pGEM®-T Easy vector cloning system (Promega).
Ligations were transformed into TOP10F` Escherichia coli (E. coli) cells (Invitrogen) and plasmid
DNA isolated from bacterial clones (QIAprep® Spin Miniprep Kit, Qiagen) was sequenced (Micromon
DNA sequencing facility, Monash University). Sequences were compared to public sequence
databases using the mega-Basic Local Alignment Search Tool (mega-BLAST) [32]. The sequences of
three positive ch7SK promoter clones; pch7SK-1 (783bp), pch7SK-2 (782bp) and pch7SK-3 (782bp)
were deposited into Genbank under the accession numbers, EF488955, EF488956 and EF488957
respectively.
Construction of ch7SK-shRNA expression vectors
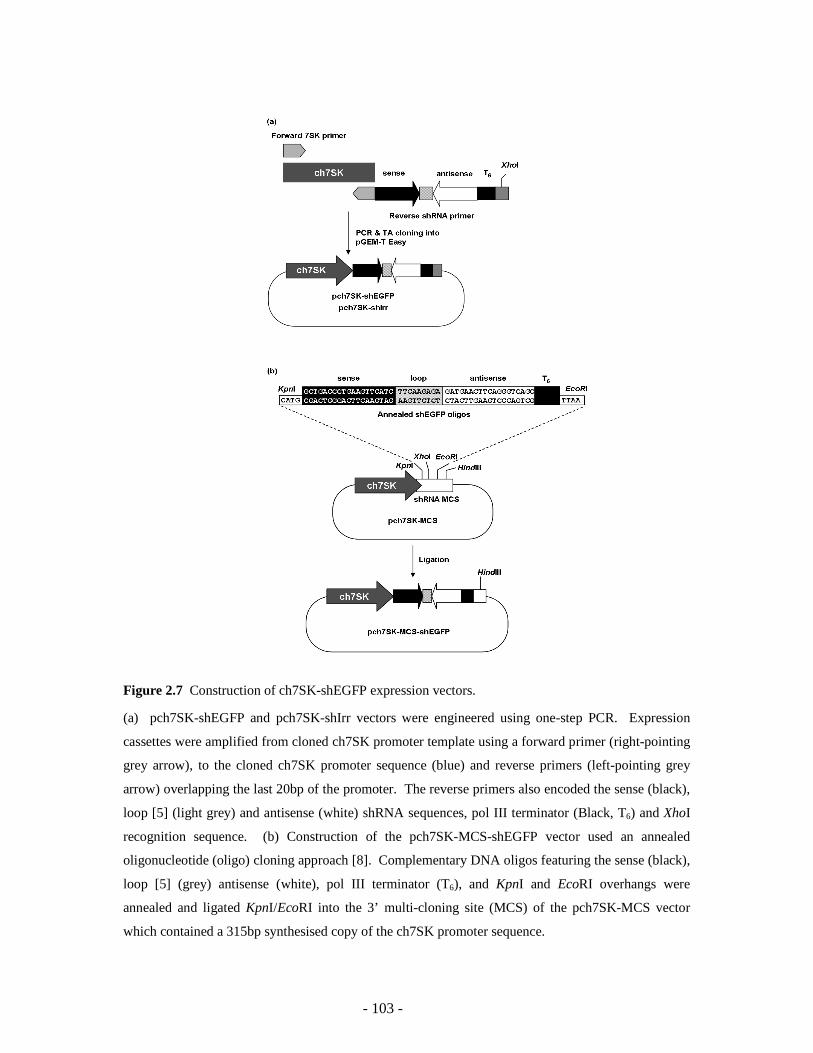
The pch7SK-shEGFP and pch7SK-shIrr expression vectors were constructed using the one-step PCR
approach (Figure 2.2 and 2.7a). The primers used were; forward primer TD269 (5’-
GAGGCTCAGTGTCACGCAGA-3’) and reverse primer TD267 (5’-
CTCGAGTTCCAAAAAAGCTGACCCTGAAGTTCATCTCTCTTGAAGATGAACTTCAGGGTC
AGCAAAGCTACGAGCTGCCCCAA-3’) (shEGFP) and TD268 (5’-
CTCGAGTTCCAAAAAAGGATCTTATTTCTTCGGAGTCTCTTGAACTCCGAAGAAATAAGA
TCCAAAGCTACGAGCTGCCCCAA-3’) (� hirr). Pch7SK-shEGFP was amplified using pch7SK-3
template and pch7SK-shIrr was amplified using pch7SK-1 template.
The pch7SK-MCS-shEGFP vector was constructed from the pch7SK-MCS base-vector by ligation of
complimentary annealed oligonucleotides (oligos) LL29 and LL30 as shown in Figure 2.7b. The
pch7SK-MCS base vector was constructed from pUC57 by ligating a 315 bp synthetic copy of the
ch7SK promoter sequence between the EcoRI and HindIII sites (Celtek Genes). The ch7SK promoter
sequence was altered between bp -5 to +11 to include a 3’ multi-cloning site (MCS) comprising
overlapping KpnI, XhoI and EcoRI sites (Figure 2.7b). All ligations were incubated at 4°C for 48
hours and transformed into TOP10F` E. coli.
Sequence management and bioinformatics
Chicken genome sequence information was accessed through the National Centre for Biotechnology
Information (NCBI) database (http://www.ncbi.nlm.nih.gov) and viewed using the NCBI Map Viewer,
Gallus gallus (chicken). Sequence alignments were performed using ClustalW and Clone Manager 7
software (SciEd Central).
Page 12
- 59 -
Cell culture and transfection
Chicken DF-1 cells were maintained in 5% CO2 at 37°C in growth media and harvested using 0.25%
(w/v) trypsin-ethylenediaminetetraacetic acid (EDTA). Transfection of plasmid DNA for EGFP
silencing assays was conducted in DF-1 cells grown to 80-90% confluence, in 8-well chamber slides
(Nunc) for fluorescence microscopy or 24 well culture plates (Nunc) for flow cytometry. Cells were
transfected with 500 ng or 1µg of each plasmid, per well, for chamber slides or 24-well plates,
respectively, using Lipofectamine™2000 transfection reagent (Invitrogen). For RNA extractions, DF-
1 cells were grown in 25 cm2 culture flasks (Corning) and transfected using 12.5 µg of plasmid and 25
µl of Lipofectamine™2000.
Detection of shEGFP expression by Rnase protection assay
RNA samples enriched for small RNAs (mirVana miRNA isolation kit, Ambion) were purified from
DF-1 cells 48 hours post-transfection of shEGFP expression plasmids. An RNAse protection assay
(RPA) was conducted to detect expression of shEGFP using the RNA probe LL91. Gel images were
transferred to Medical X-ray film over 5 days at -80°C and developed using an FPM-100A X-ray
processor (FUJIFILM).
EGFP knockdown assays
EGFP expression was analysed at 60 hours post-transfection. Fluorescence microscopy was
performed on duplicate co-transfections using a Leica DM LB Fluorescence Microscope (Leica
Microsystems, Germany). Images were captured at 50X magnification using a Leica DC300F colour
digital camera (Leica Microsystems, Germany) using Photoshop 7.0 imaging software (Adobe®). For
flow cytometry, the EGFP fluorescence intensity was quantified as a mean fluorescence intensity
(MFI) value for each co-transfection condition sampled in triplicate. Cells were harvested using
0.25% trypsin-EDTA, pelleted at 2000 rpm for 5 minutes, washed sequentially in cold phosphate
buffered saline-A (PBSA) (Oxoid) and FACS-solution (PBSA + 1% FCS) and re-suspended in FACS-
solution for sampling. Sampling and data acquisition was conducted using a FACScalibur (Becton
Dickinson) fluorescence activated cell sorter and CELLQuest software (Becton Dickinson). The
reduction in EGFP MFI for each co-transfection was calculated by normalising the average MFI from
triplicate sampling, as a percentage of the MFI of the negative control � hirr/pEGFP-N1 co-transfected
cells (100% ± 4.53% (SEM)) (Figure 2.6b).
Statistics
Page 13
- 60 -
Normalised MFI data from three independent co-transfection experiments was analysed statistically by
One-way Analysis Of Variance (ANOVA) and Tukey’s multiple comparisons tests (Prism, GraphPad
Software). Significant difference in EGFP knockdown was accepted where P<0.05.
Results
Identifying the chicken 7SK promoter
RNA polymerase (pol III) type 3 promoters are characterised by the presence of gene-external
promoter elements 5’ of the transcription start site. To identify the ch7SK promoter we used a
bioinformatics approach and scanned the chicken genome for sequences with significant (80%)
homology to the chicken 7SK snRNA gene sequence (GenBank Accession Number AJ890101). We
then analysed the 5’ flanking regions of these sequences for the presence of pol III promoter elements.
This analysis highlighted several putative 7SK pseudogenes in addition to the full-length 7SK snRNA
sequence. However, putative pol III promoter elements were only present within the 5’ flanking
region of the full-length, ch7SK snRNA sequence, located on chicken chromosome 3 (Gga3, Contig
NW_060336.1). Therefore, we reasoned that this region probably encoded the chicken homologue of
the 7SK promoter.
Using PCR we amplified a 783bp region containing the putative ch7SK promoter sequence, which
was cloned into pGEM®-T Easy. Sequencing of the cloned insert identified three clones; pch7SK-1
(783 bp), pch7SK-2 (782 bp) and pch7SK-3 (782 bp) with 99% homology to the first 782-783bp of the
ch7SK snRNA 5’ flanking region, as determined by alignment against the chicken genome. A further
alignment of the last 300 bp (5’ to 3’) of each of these clone sequences against the h7SK and b7SK
promoter sequences (Figure 2.4), identified typical pol III promoter elements in the cloned sequences
including; a TATA box at bp -31 to -25, a PSE at bp -67 to -46, an OCT-1 motif at bp -222 to -215,
two putative OCT-2 motifs OCT-2a at bp -138 to -132 and OCT-2b at bp -97 to -90 (not shown) and
an SPH domain at bp -192 to -210. The PSE, OCT-1 and SPH elements also displayed considerable
homology to published consensus sequences (Figure 2.4). The presence of these elements within the
cloned 5` flanking region of the ch7SK snRNA gene sequence, suggested that this region probably
encoded a functional ch7SK promoter.
The ch7SK promoter expresses shRNAs
In order to validate its function, the putative ch7SK promoter sequence was used to construct the
shRNA expression vectors, pch7SK-shEGFP and pch7SK-MCS-shEGFP, designed to transcribe
shRNAs targeting EGFP (shEGFP) (Figure 2.7). A third vector, pch7SK-shIrr, designed to transcribe
an irrelevant shRNA (� hirr) targeting an influenza virus nucleocapsid protein (NP) from the ch7SK
Page 14
- 61 -
promoter, was also constructed as a negative control (Figure 2.7a). The function of the isolated ch7SK
promoter sequence was verified by detection of shEGFP expression in DF-1 cells transfected with the
pch7SK-shEGFP or pch7SK-MCS-shEGFP constructs. RNA was extracted at 48 hours post-
transfection and shEGFP expression was detected using an Rnase protection assay (RPA) (Figure 2.5).
As a positive control for shEGFP detection, DF-1 cells were also transfected with vectors expressing
identical shEGFP sequences from pre-validated mouse U6 (pmU6-shEGFP), chicken U6-1 (pcU6-1-
shEGFP), chicken U6-4 (pcU6-4-shEGFP) and chicken U6-3 (pcU6-3-shEGFP) pol III promoters.
A 19 nt band was detected in RNA samples from cells transfected with both the pch7SK-shEGFP and
pch7SK-MCS-shEGFP constructs (Figure 2.5). This band corresponded with the expected size of
protected shEGFP sequence as well as specific bands detected in the positive control mouse U6 (mU6)
and cU6-shEGFP-transfected positive control cells (Figure 2.5). No shEGFP expression was detected
in RNA samples from the pch7SK-shIrr negative control, or non-transfected cells (cells only) (Figure
2.5). These results demonstrated the isolated ch7SK promoter sequence was transcriptionally active.
The ch7SK promoter directs shRNA-mediated RNAi knoc kdown
To verify that the shEGFP expressed by the ch7SK promoter could direct RNAi-mediated knockdown
of an EGFP reporter gene, we conducted EGFP knockdown assays by co-transfecting chicken DF-1
cells with the pch7SK-shEGFP, pch7SK-MCS-shEGFP and positive control, pmU6-shEGFP and pEZ-
b7SK-shEGFP constructs, with an EGFP expression vector (pEGFP-N1) (Figure 2.6). Given that co-
transfection of reporter and shRNA expression plasmids is considered to be 100% efficient for
validation of specific RNAi activity, we considered any reduction in EGFP fluorescence intensity to
reflect RNAi-mediated EGFP knockdown. EGFP knockdown was assessed for each co-transfection
condition in duplicate using fluorescence microscopy (Figure 2.6a) and quantified using flow
cytometry by sampling the mean fluorescence intensity (MFI) from triplicate co-transfections for each
condition (Figure 2.6b).
In DF-1 cells co-transfected with pEGFP-N1 and either the pch7SK-shEGFP or pch7SK-MCS-
shEGFP constructs, the EGFP MFI was significantly reduced to 45.19% (± 3.37%) and 47.28% (±
3.14%) respectively (P<0.001) (Figure 2.6b). These reductions were not found to differ significantly
from the EGFP % MFI measured in the positive control pmU6-shEGFP (42.8% ± 4.67%) and pEZ-
b7SK-shEGFP (45.27% ± 3.73%) co-transfected cells (P>0.05). Given both the mU6 and b7SK
promoters are known to express functional shEGFP molecules that direct specific EGFP knockdown
in DF-1 cells, this result indicated that the shEGFP molecules expressed by the ch7SK promoter could
direct knockdown of EGFP by over 50% in DF-1 cells.
Page 15
- 62 -
Comparison of ch7SK and cU6 promoter induced EGFP k nockdown
We further compared the efficiency of RNAi knockdown mediated by the ch7SK promoter, to cU6
promoters; cU6-1, cU6-3 and cU6-4, by comparing the reduction in EGFP MFI induced between the
pcU6-1-shEGFP, pcU6-3-shEGFP and pcU6-4-shEGFP vectors and the two ch7SK-shEGFP
constructs; pch7SK-shEGFP and pch7SK-MCS-shEGFP (Figure 2.6). Fluorescence microscopy
results indicated that the EGFP knockdown induced by both of the ch7SK-shEGFP constructs was
comparable to that induced by pcU6-4-shEGFP and pcU6-3-shEGFP, but greater than that conferred
by pcU6-1-shEGFP (Figure 2.6a). However, statistical analyses of MFI data indicated no significant
difference in the reduction of EGFP MFI between the pcU6-1-shEGFP (52.93% ± 6.25%), pch7SK-
shEGFP (45.19% ± 3.37%), pch7SK-MCS-shEGFP (47.28% ± 3.15%) or pcU6-3-shEGFP (39.78% ±
3.93%) transfection conditions (P>0.05). The pcU6-4-shEGFP co-transfected cells showed the
greatest reduction in EGFP MFI to 29.05% (± 3.26%), which was significantly lower than for the
pch7SK-MCS-shEGFP and pcU6-1-shEGFP co-transfected cells (P≤0.05), but not significantly
different to the MFI of either the pch7SK-shEGFP or pcU6-3-shEGFP-co-transfected cells (P>0.05).
Taken together, these results indicated that neither of the ch7SK-shEGFP constructs induced more
efficient RNAi-knockdown of EGFP than existing cU6-shEGFP constructs in DF-1 cells.
Discussion
The chicken is an important livestock animal and a key model for studies of vertebrate development
and gene function. Thus the development of RNAi technologies adapted for use in chicken systems
will be important for further annotation of the chicken genome. Although several recently
characterised chicken U6 (cU6) promoters have been used to develop effective chicken-specific
shRNA expression systems, 7SK promoters have been shown to direct more efficient RNAi activity
than U6 promoters in mammals (Lambeth et al., 2006). Therefore, we wanted to establish whether an
shRNA expression system based on the ch7SK promoter could induce more efficient RNAi activity
than those based on existing cU6 promoters.
Although several 7SK pseudogenes exist in the chicken genome we could only identify a single
ch7SK promoter sequence upstream of the full-length chicken 7SK snRNA sequence on chromosome
3. Single functional 7SK promoters are known to exist in the human, bovine and mouse genomes, so
our findings are consistent with the presence of only a single 7SK promoter in the chicken genome.
The ch7SK promoter was also found to contain typical pol III promoter elements; TATA, PSE, OCT
and SPH which show positional and sequence similarities to those of the h7SK and b7SK promoters.
Further, we noted that the chicken 7SK locus was flanked by homologues of the glutathione S
transferase-A3 and intestinal cell kinase (MAK-related kinase) genes which are also located 5’ and 3’
Page 16
- 63 -
respectively of each of the mammalian 7SK loci. This level of synteny in the arrangement of the 7SK
loci between chicken and other mammalian species, provides good evidence that the ch7SK promoter
characterised in the present study is the only functional 7SK promoter in the chicken genome.
Our results clearly demonstrated that the ch7SK promoter was able to express functional shRNA
molecules capable of mediating greater than 50% RNAi-knockdown of the target EGFP reporter gene.
However, we found no evidence that the ch7SK promoter could direct more efficient shRNA-mediated
RNAi knockdown compared to the cU6-1, cU6-3 and cU6-4 promoters, based on a lack of significant
difference in the level of EGFP MFI between cells co-transfected with pch7SK-shEGFP and any of
the cU6-shEGFP constructs, or between cells co-transfected with pch7SK-MCS-shEGFP and pcU6-1-
shEGFP and pcU6-3-shEGFP. Although we cannot rule out that the ch7SK promoter may actually be
less efficient than the cU6-4 promoter, given that our MFI data indicated the pcU6-4-shEGFP
construct could direct a more significant reduction in EGFP MFI than the pch7SK-MCS-shEGFP
construct, these findings indicated that in general, the efficiency of the ch7SK promoter was not
greater than, but comparable to that of cU6 promoters.
Interestingly, our results contrast findings published by Lambeth et.al., (2006), who independently
demonstrated that the b7SK and h7SK promoters confer more efficient shRNA expression and RNAi
activity than bovine and human U6 promoters, respectively. Despite close alignment of the ch7SK,
h7SK and b7SK promoters, we noted some distinct differences within the DSE or enhancer region of
the ch7SK promoter, which affect the structural organisation of the ch7SK promoter in relation to its
mammalian homologues. Given the structure and sequence of promoter elements within the DSE can
influence maximal transcription efficiency in U6 and 7SK promoters, the variable structure of the
ch7SK DSE may have an inherent impact upon its efficiency relative to U6 promoters.
Unlike the b7SK and h7SK promoters, the DSE of the ch7SK promoter does not contain a CACCC
box (Figure 2.4), which appears to be a distinct feature of 7SK promoters and is reported to serve an
important role in enhancing the transcriptional activity of the h7SK promoter. Interestingly, U6
promoters do not contain CACCC boxes, so it is possible that the absence of a CACCC box in the
ch7SK promoter may affect its overall efficiency by reducing enhancer activity in the ch7SK DSE to a
level more similar to that seen in U6 promoters. This would explain why we observed comparable
levels of EGFP knockdown induced between the ch7SK and cU6 promoters. Moreover, the absence
of the CACCC box from the enhancer may further indicate that the enhancer mechanism in the ch7SK
promoter may be more similar to that of U6 promoters than other mammalian 7SK promoters.
A second feature of the ch7SK enhancer, distinct from mammalian 7SK promoters is the presence of a
C/A substitution at position 1 (bp -222) of the ch7SK OCT-1 motif (Figure 2.4). Previous work has
Page 17
- 64 -
shown that mutation of the OCT-1 motif in the h7SK promoter has the strongest impact on
transcriptional efficiency, so it is possible that this substitution may affect the activity of the ch7SK
enhancer. However, an OCT-1 sequence identical to that of the ch7SK promoter is present in the
enhancer of the RNA polymerase II (pol II) promoter of the chicken U4B (cU4B) snRNA (Figure 2.8).
This cU4B OCT-1 motif shows full affinity for the Octamer transcription factor (Oct-1), so it is
unlikely that the ch7SK OCT-1 motif would affect promoter efficiency through a reduced ability to
bind Oct-1. However, it is also known for the cU4B promoter, that optimal enhancer activity is
dependent upon the presence of a downstream SPH domain adjacent to OCT-1. Interestingly, the
position of the ch7SK SPH domain 4bp downstream of OCT-1 corresponds closely to that of the cU4B
promoter and shows striking homology (84%) to the cU4B SPH sequence (Figure 2.8). Given this
level of structural identity, it is pertinent to suggest that the enhancer mechanism of the ch7SK
promoter may be analogous to that of the cU4B promoter, requiring adjacent OCT-1 and SPH
domains.
Co-dependence of OCT and SPH motifs in pol III enhancer mechanisms is common to other non-
mammalian vertebrate pol III promoters including the Xenopus laevis tRNAsec promoter. Similarly,
human U6 promoters also appear to rely upon the presence of both OCT and SPH elements for
efficient enhancer activity. This type of enhancer mechanism contrasts what is known about the
function of the h7SK enhancer, where optimal transcription efficiency is not dependent upon the
presence of an SPH domain. Based on these differences, we propose that the structure and function of
the ch7SK enhancer may be less divergent from pol II and pol III promoters such as U4B and U6, than
from other mammalian 7SK promoters.
In this study we have identified and isolated a functional chicken homologue of the 7SK snRNA
promoter and demonstrated its ability to confer efficient shRNA expression and RNAi-knockdown of
a reporter gene in a chicken cell line. We further found that the efficiency of the ch7SK promoter was
similar to that of existing cU6 promoters, which contrasts previous comparisons of mammalian U6
and 7SK promoters. The ch7SK promoter is the first non-mammalian vertebrate 7SK promoter to be
characterised, so this finding may reflect inherent differences in the divergence of pol III promoter
activities between mammalian and non-mammalian vertebrates. This aside, our results clearly indicate
that the ch7SK promoter is an efficient alternative to U6-based shRNA expression systems for
inducing efficient RNAi activity in chicken cells. This and the characterisation of other chicken-
specific promoters for RNAi applications will be of particular benefit to furthering functional
genomics in the chicken and developmental studies which utilise the chicken as a model system.
Page 18
- 65 -
2.2.1.3 RNA loop structures are important for efficient processing of short
hairpin RNAs for gene silencing
Animal cells use RNA interference (RNAi) as a natural mechanism to regulate gene expression
through the use of microRNAs (miRNAs). miRNAs are transcribed from the genome as approximately
70 nt primary miRNA transcripts (pri-miRNA), which are processed by Drosha into precursor miRNA
hairpins (pre-miRNA). Exportin-5 transports the hairpin from the nucleus into the cytoplasm where
the loop of the hairpin precursor is removed by the ribonuclease III enzyme Dicer, leaving the mature
22-25 nt double stranded miRNA. The miRNA guide strand loads into the RNA induced silencing
complex (RISC) which directs it to the complementary messenger RNA (mRNA). This forms double
stranded RNA resulting in cleavage of the target mRNA. Thousands of miRNAs are predicted to be
present in every cell and many of these miRNAs are highly regulated to be tissue or cell cycle specific.
The cellular RNAi mechanism has been successfully adapted to specifically silence genes of interest
including viral and endogenous genes.
One method to artificially induce RNAi induced gene silencing is to express short hairpin (sh) RNAs.
shRNAs consist of a silencing (si) RNA target sense sequence acting as the 5’ stem, a spacer sequence
which forms the loop and the anti-sense sequence forming the 3’ stem. An alternative method is to
mimic naturally occurring pri-miRNA structures called miRNA adapted shRNAs (shRNAmirs). Once
transcribed from an expression vector these molecules enter the RNAi pathway at the Drosha step for
shRNAmirs or the Dicer step for shRNAs, to be cleaved into siRNAs.
It has been shown that the shRNA loop sequence is critical for efficient mRNA silencing as the
majority of the processing by Dicer occurs near the loop. Initial shRNA expression experiments
showed that a 19 nt siRNA sequence and a 9 nt spacer was the most efficient and this structure has
become the standard for shRNAs (Brummelkamp et al, 2002). The use of endogenous miRNA loop
sequences to improve shRNA silencing has not been extensively investigated. To determine whether
shRNA silencing of viral genes could be improved by the use of microRNA loop sequences, shRNAs
targeting influenza A/PR/8/34 (PR8) strain Nuclear Protein (NP) mRNA and chicken anaemia virus
(CAV) mRNA were designed. These shRNAs contain 19 nt siRNA target sequences with loop
sequences derived from one of three native miRNAs (two chicken and one human) known to express
highly in most cell types. They were compared to the original highly efficient 9 nt spacer sequence
described by Brummelkamp et al, (2002).
Page 19
- 66 -
Methods
shRNA loop design and plasmid constructs
shRNAs targeting chicken anaemia virus (CAV) mRNA were assayed for silencing against peGFP-
CAV and are described elsewhere in this report. To produce pEGFP-NP, a pGEMTeasy plasmid
containing a 180 bp fragment of NP was digested with NotI. The NP fragment was gel purified and
ligated into the similarly digested pEGFP-C. The siRNA sequence targeting NP was obtained from Ge
et al, (2003). NP shRNA molecules were designed to contain either the 9 nt hairpin loop sequence of
Brummelkamp et al, (2002) or the microRNA loop sequences from human miR30a (miRBase ref
MI0000088), chicken miR30a (miRBase ref MI0001204) and chicken miR17 (miRBase ref
MI0001184) obtained from miRBase (http://microrna.sanger.ac.uk/sequences). Complementary
oligonucleotides were annealed and ligated into pchU6-4. The forward oligonucleotide sequences used
are shown in Table 2.2 and were obtained from Geneworks (Australia). The resulting Influenza PR8
NP shRNA constructs have been designated pshNP-OL, pshNP-mir17, pshNP-mir30agga and pshNP-
mir30ahsp. The CAV shRNA constructs have been named pshVP2/3-1-OL, pshVP2/3-1-miR17,
pshVP2/3-1-miR30agga, pshVP2/3-1-miR30ahsp, pshVP2/3-3-OL, pshVP2/3-3-miR17, pshVP2/3-3-
miR30agga and pshVP2/3-3-miR30ahsp. All constructs were sequenced by Micromon DNA
sequencing facility (Monash University, Australia)
Cells and virus
Chicken fibroblast cells (DF1: ATCC No. CRL-12203) were grown in DMEM and Madin-Darby
canine kidney cells (MDCK: ATCC No. CCL-34) were grown in EMEM, both were supplemented
with 10% foetal bovine serum, 2 mM glutamine, 10 mM Hepes, 1.5 g/l sodium bicarbonate, 0.01%
penicillin and 0.01% streptomycin at 37 ºC with 5% CO2 and subcultured twice weekly.
Influenza A/ PR/8/34 (PR8) strain virus stock was produced by limiting dilution passage in the
allantoic cavity of 10 day old embryonated chicken eggs at 34°C for 48–72 h. Virus was passaged
three times.
EGFP-fusion silencing
DF1 cells were seeded at 1.5x10⁵ cells in 24-well tissue culture plates in duplicate and grown
overnight at 37 ºC with 5% CO2. Plasmids were transfected into cells using Lipofectamine 2000
(Invitrogen, USA) as per manufacturer’s instructions. Briefly, 1 µg of pEGFP-NP or pEGFP-CAV and
1 µg of the relevant shRNA plasmid were mixed with 2 µl of Lipofectamine 2000 both diluted in 100
µl OPTI-MEM (Invitrogen, USA) and incubated at room temperature for 20 mins. The DNA:
Page 20
- 67 -
lipofectamine mix was added to cells and incubated for 4 h. Cell media was replaced and incubated for
72 h. Cells were washed twice with PBS, trypsinised and washed twice with FACS wash (PBS with
1% FBS). Cells were subjected to flow cytometry and GFP silencing was analysed as a percentage of
the non-silencing shRNA mean GFP (measured on FITC wavelength) fluorescence.
Influenza A-PR8 silencing
MDCK cells were transfected using Amaxa nucleofector electroporation (Amaxa Biosystems,
Germany). Briefly 1.5x10⁶ MDCK cells were pelleted and resuspended in 100 µl of nucleofector T
solution. Cells were transferred to a cuvette and electroporated with program T20. Cells were diluted
with 500 µl of prewarmed growth media, aliquoted into 6 wells of a 24-well culture plate and
incubated overnight at 37 ºC with 5% CO2. Influenza A PR8 virus was serially diluted in viral growth
media (VGM, with 0.3% BSA, 5 µg/ml trypsin and lacking FCS) and cells were infected at
multiplicities of infection (MOI) of 0.01, 0.001, 0.0001 in duplicate. Cells were incubated at 37 ºC for
1 h, virus was replaced with VGM and incubated for 48 h. Supernatant was taken and used in a
haemagglutination assay according to the OIE Manual. Briefly, virus solutions (50 µl) in serial two-
fold dilutions in PBS were mixed with an equal volume of a 1% chicken erythrocyte suspension. After
1 h incubation at room temperature, the HA titer was estimated by the highest dilution with
hemagglutination.
RNA isolation and Northern Blotting
DF1 cells were seeded and grown until 80% confluency in 25 cm tissue culture flasks (Nunc, USA).
Plasmids were transfected into the DF1 cells using Lipofectamine 2000 as per manufacturers
instructions. Briefly,12 µg of the relevant shRNA plasmid was mixed with 20 µl of Lipofectamine
2000 both diluted in 500 µl OPTI-MEM and incubated at room temperature for 20 mins. The DNA:
lipofectamine mix was added to cells and incubated for 4 h. Cell media was replaced and the cells
were incubated for a further 72 h. RNA of less than 200 nt in length was purified from transfected DF1
cell cultures using mirVanaTM miRNA isolation kits (Ambion, Austin USA) and concentrated using
Millipore microcon centrifugal filters (YM-30; Millipore, USA) as described by the respective
manufacturers. Approximately 1 µg of low molecular weight RNA was resolved on a 7M Urea- 15%
Polyacrylamide gel and transferred to a positively charged membrane (Hybond plus, Amersham
Biosciences, USA) using a Trans-blot semi-dry transfer cell (BioRad, USA). The efficiency of each
hairpin expression and processing was determined using a Locked Nucleic Acid (NP-LNA) probe (5'
CTCCGAAGAAATAAGATCC 3') (Sigma- Proligo, USA) whereby a locked nucleic acid base was
incorporated into every third nucleotide of the probe. The NP-LNA probe was end-labeled with [32γP]
dATP using 10 units of OptiKinase (USB, USA) prior to their addition to a pre-hybridised Northern
Page 21
- 68 -
blot. Hybridization was conducted overnight at 42oC in 50% formamide, 0.5% SDS, 5x SSPE, 5x
Denhardts solution and 100 µg ml-1 denatured herring sperm DNA (Roche, USA). The membrane was
washed 3 times in 2x SSC, 0.1% SDS at 42oC prior to overnight autoradiographic exposure. The size
of the resolved RNA was determined by comparison with AmbionTM Decade markers (Ambion, USA).
Results
Influenza PR8 NP shRNA loop sequences and plasmid c onstructs
The loop sequences used in this study were obtained from either Brummelkamp et al. (2002) or from
miRBase. We chose the human miR30a loop sequence (miR30ahsp) as miR30a based shRNAmirs
express high levels of siRNAs (Boden, et al, 2004). For silencing chicken pathogens, the chicken
miR30a (miRgga30a) loop sequence was also selected, as it contains two nucleotide differences to the
human version. The chicken mir17 (mir17) loop sequence was selected as the native miRNA is
expressed at high levels in all chicken cell types (ICGSC, 2004). A siRNA targeting Influenza NP was
adapted to shRNAs containing one of the four loop sequences (Table 2.2). The resulting plasmids are
referred to as pshNP-OL, pshNP-mir17, pshNP-mir30agga and pshNP-mir30ahsp. Figure 9A shows
the predicted structures and ∆G values of the original shRNA structure of Brummelkamp et al, (2002)
and the native microRNAs, whilst the predicted structures and ∆G values of the NP hairpins are shown
in Figure 2.9B. It should be noted that 4 of the nucleotides in the Brummelkamp shRNA loop
sequence are predicted to base-pair. The mir30a shRNA structure predictions and ∆G values
reasonably accurately match those of the native miRNAs missing one 2 nt bulge, whilst the mir17
shRNA loop matches that predicited for the miRNA, however the stem appears quite different as it
does not contain the multiple bulges. All shRNAs were under the control of the chicken U6-4
promoter (chU6-4), along with the non-silencing (pshNS) and positive (pshEGFP, Table 2.2) control
described previously (Wise et al, 2007).
Chicken miR17 loop sequence decreases the ability o f the shRNA to silence EGFP-
fusion expression, by inhibiting processing of the hairpin to mature siRNAs.
Prior to virus silencing experiments, each NP shRNA vector was assayed for activity against EGFP-
NP fusion mRNA in the chicken fibroblast cell line DF1. pshNP-OL was highly active at silencing
peGFP-NP mRNA (Fig 2.10A). pshNP-miR30agga and pshNP-miR30ahsp showed a marginal
increase in silencing pEGFP-NP compared to pshNP-OL (Fig. 2.10A). Inclusion of the chicken miR17
loop sequence resulted in a 3-fold decrease in GFP-NP mRNA silencing activity (Fig 2.10A).
Page 22
- 69 -
To determine why pshNP-mir17 was less active than other constructs, small RNAs were isolated from
transfected DF1 cells and analysed by Northern Blot (Fig 2.10B). This method detects both the hairpin
structure and the mature siRNA using a locked nucleic acid probe directed at the NP siRNA sequence.
Hairpin and mature siRNA were detected for pshNP-OL and both mir30a constructs (Fig 2.10B). The
NP mir17 hairpin (pshNP-miR17) was detected, but no mature sequence was observed (Fig 2.10B).
The Northern blot also shows a high level of unprocessed hairpin present from all vectors compared to
the level of mature siRNAs observed (Fig 2.10B). A higher concentration of mature siRNA was
present from the mir30a constructs. No bands were observed in the untransfected or non-silencing
control as expected (Fig 2.10B).
shRNA silencing of viral RNA mimics the EGFP-fusion assay
The shRNA constructs were assayed for the ability to silence Influenza A strain PR8 in MDCK cells.
The haemagglutination assay shows consistent results to the GFP reporter assay, highly efficient
knockdown of virus replication was observed in the original loop construct however, the miR30a loop
sequences increase the silencing ability of the NP siRNA at the highest concentration of virus, with the
chicken miR30a loop giving the best knockdown (Fig 2.11). As expected, pshNP-mir17 was unable to
inhibit viral replication efficiently.
Different loop sequences do not improve less effici ent siRNA molecules
To determine if the loop sequence affected the silencing ability of other shRNA sequences, vectors
expressing shRNAs with the four different loop sequences targeting chicken anaemia virus mRNA
were produced. Two shRNA sequences were analysed, one highly active against EGFP-CAV fusion
mRNA (pshVP2/3-1) and another less active sequence (pshVP2/3-3). The resulting constructs are
referred to as pshVP2/3-1-OL, pshVP2/3-1-miR17, pshVP2/3-1-miR30agga, pshVP2/3-1-miR30ahsp,
pshVP2/3-3-OL, pshVP2/3-3-miR17, pshVP2/3-3-miR30agga and pshVP2/3-3-miR30ahsp. The same
non-silencing control (pshNS) and EGFP targeted shRNA (pshGFP) were utilised. Similar silencing
results to that observed with the NP shRNAs sequence were obtained in the DF1 GFP reporter assay
(Fig 2.12). The shRNAs containing the miR17 loop sequence were less active, whilst the chicken
miR30a loop shRNAs was the most efficient (Fig 2.12 A & B). Interestingly, the different loop
sequences were unable to improve the activity of shVP2/3-3, indicating that whilst loop sequences can
impair hairpin processing, they are unable to improve the ability of a siRNA to silence the target gene
(Fig 2.12B).
Page 23
- 70 -
Discussion
shRNAmirs are processed by Drosha into shRNAs. shRNAs are then recognized and processed into
siRNAs by Dicer. Initially shRNAmirs appeared to produce more mature siRNAs resulting in better
silencing. However, McManus et al, (2002) showed that the loop sequence is the most critical region
in recognition of the shRNA for processing, potentially removing the need for the longer shRNAmirs.
To determine if a native miRNA loop sequence could improve shRNA processing and increase
silencing, a comparison of shRNAs containing either the commonly used 9nt loop sequence from
(Brummelkamp et al, 2002) and 3 endogenous miRNA loop sequences was performed.
shRNAs containing the loop sequences from the miR30a miRNAs were highly effective at silencing
the GFP-fusion mRNAs and Influenza PR8. It appeared that this may be due to the presence of more
mature siRNA being processed than seen with shRNAs containing the Brummelkamp et al, (2002)
loop sequence. However the chicken miR17 loop sequence severely inhibited hairpin processing and
silencing. This could be due to decreased Exportin-5 transport, interference with Dicer cleavage, or
other cellular factors impeding maturation.
The mir17 loop sequence used in this study was selected based on the unpaired nucleotides in the
predicted miRNA structure. Subsequent analysis of chicken mir17 revealed 4 additional bases extend
3’ from the loop sequence, two of which are base-paired with the siRNA (miRBase; Fig 2.9A).
Chicken mir17 also contains several bulges in the stem sequence not present in the shRNAs, resulting
in the shRNA structure prediction looking quite different (Fig 2.9B). Little is known about the shRNA
structure requirement for Dicer cleavage. However McManus et al, (2002) demonstrated that the
processing of shRNAmirs was highly sensitive to modifications in structure including bulge position
and loop sequence. The loss of these structures may have resulted in the loss of shRNA processing. It
would be interesting to produce the NP- mir17 based shRNAmir to determine if the incorporation of
the bulges and paired loop sequence restored processing. The miR30a shRNA constructs, despite
missing a 2nt bulge in the stem mimic the endogenous miRNA more accurately resulting in correct
recognition and processing (Fig 2.9B). Therefore it appears important to choose loop sequences that
will result in an shRNA that closely mimics the endogenous miRNA structure for improved silencing.
Although chicken mir17 is highly and ubiquitously expressed in chicken cells, it is transcribed from
the miR17-92 miRNA cluster which contains 6 miRNAs. One of these, mir18 is known to require a
cellular protein, the nucleo-cytoplasmic shuttling protein hnRNP A1, to be processed. No similar
requirement has been determined for mir17, however this could also explain why the mir17 shRNA’s
were not processed. If this is the case the use of a loop sequence from a regulated miRNA could result
Page 24
- 71 -
in tissue specific or cell-cycle specific regulation of the shRNA. This level of regulation of shRNA
expression would be advantageous in many circumstances.
The continuing emergence of zoonotic and highly virulent viruses has placed increased pressure on
developing new vaccines and therapeutics for livestock. An alternative strategy may be to develop
transgenic, disease-resistant animals that express RNAi molecules. This study indicates that
endogenous miRNA loop sequences can increase the efficiency of mature siRNA production and can
be derived from the species of interest, minimising the amount of foreign DNA sequence required. In
the future, understanding the efficiency and specificity of miRNA loop sequences may also prove
useful for delivering tissue targeted gene silencing.
2.2.1.3 In ovo modulation of production traits – myostatin and DMRT1
The work described above details an in depth analysis of development and optimisation of short
hairpin RNAi delivery for applications in chickens. The next stage in the project was to develop
methodologies to undertake proof-of-concept to show that RNAi silencing of the myostatin gene leads
to changes in muscle development and the DMRT1 leads to feminisation of developing male embryos.
As this work progressed the focus was strongly directed towards silencing of the DMRT1 gene and
confirming the putative role of this gene in male sex development in chickens and other birds. The
implications of this work would lead to a valuable commercial application for the egg laying industry.
There are two clear commercial paths to impact. The first is with the breeding companies - they cull
male chicks at hatch and this is both an economic and welfare issue that they would like to see
improved. Even slightly increasing the ratio of females to males is of importance and value to the
breeders. The second path is with the vaccine companies. Pfizer has invested into embrex technology
and would like to get better uptake of embrex delivered vaccines (including new and innovative
vaccines) into the layer industry. Their big problem at the moment is that the industry is reluctant to
adopt the embrex platform because 50% of the injected eggs are male and are therefore culled at hatch.
Pfizer are extremely interested in an approach to sway the sex ratio to females. As an added bonus, we
are currently working towards embrex delivery of our RNAi molecule and Pfizer are extremely keen
to develop more embrex deliverable products.
Methods
DMRT1 shRNA screening
Identification and construction of DMRT1 shRNA expr ession plasmids
Page 25
- 72 -
The shRNA designer website (http://shrnadesigner.med.unc.edu) was used to identify shRNA target sites within
the chicken DMRT1 gene sequence. Four shRNA target sites were identified and named relative to their start
position of the 1038 bp DMRT1 gene sequence; DMRT1-208 (GACTGCCAGTGCAAGAAGT) , DMRT1-343
(GAGCCAGTTGTCAAGAAGA), DMRT1-568 (CTGTATCCTTACTATAACA) and DMRT1-694
(CTCCCAGCAACATACATGT).
Complementary olgionucleotides corresponding to DMRT1-208 (DMRT1-208T and DMRT1-208B), DMRT1-
343 (DMRT1-343T and DMRT1-343B), DMRT1-568 (DMRT1-568T and DMRT1-568B) and DMRT1-694
(DMRT1-694T and DMRT1-694B) were annealed and cloned into pchU6-4 using the PmeI and SalI restriction
sites as previously described (Hinton & Doran 2008). Resulting shRNA expression plasmids were named cU6-
DMRT1-208shRNA, cU6-DMRT1-343shRNA, cU6-DMRT1-568shRNA and cU6-DMRT1-694shRNA.
Analysis of DMRT1 knockdown in DF1 cells
To construct a DMRT1 reporter system, the 1038 bp DMRT1 gene sequence was PCR amplified using
DMRT1-F and DMRT1-R primers. The amplified product was inserted into the BglII – HindIII sites
of pEGFP-C using the BamHI – HindIII primer encoded restriction sites and named pEGFP-DMRT1.
Briefly, the pEGFP-C vector was constructed using the pEGFP-N1 vector (Clontech). The multiple
cloning site (MCS) of pEGFP-N1 was removed by BamHI-BglII digestion and self-ligated.
Oligonucleotide pEGFP-linkerT and pEGFP-linkerB were designed to construct a new MCS
(containing BglII -EcoRI-PstI-EcoRV-HindIII -BamHI) by inserting the linker into the NotI- XbaI sites
downstream (3’) of EGFP. The resulting construct was called pEGFP-C.
DF1 (ATCC CRL-12203, chicken fibroblast) cells were grown in Dulbecco’s Modified Eagle’s
Medium (DMEM), supplemented with 4.5g/L glucose, 1.5g/L sodium bicarbonate, 10% fetal calf
serum (FCS), 2mM L-glutamine and the addition of penicillin (100U/mL) and streptomycin
(100mg/mL), and maintained in 5% CO2 at 37°C . For transfection, cells were grown to 80-90%
confluence, in 24-well plates (Nunc). Co-transfection was achieved using 500ng of plasmid DNA
(shRNA plasmid and/or pEGFP-DMRT1) with Lipofectamine 2000 (Invitrogen) transfection reagent
according to manufacturer’s instructions. Flow cytometry was used to measure EGFP mean
fluorescence intensity (MFI) at 48 hr post-transfection using a FACS calibur (Becton Dickinson)
fluorescent activated cell sorter and CELLQuest software (Becton Dickinson). The MFI was
calculated as a percentage of the non-silencing (NS) control shRNA.
Construction of RCAS-DMRT1shRNA
To facilitate insertion of the DMRT1 shRNA expression cassettes into pSlax13-EGFP (shuttle plasmid
containing EGFP as described for miRNA construction earlier), a linker (annealed oligonucleotides
pSlax-linkerT and pSlax-linkerB) was inserted within the BamHI – PstI sites, adding the restriction
sites EcoRV-NotI-BglII-XhoI. The resulting plasmid was named pSlax-EGFP-link.
Page 26
- 73 -
The cU6-DMRT1-343shRNA plasmid was digested with ZraI - SalI and the cU6-DMRT1-343shRNA
sequence gel purified and inserted into the EcoRV - BglII sites of pSlax-EGFP-link to produce pSlax-
EGFP-cU6-DMRT1-343shRNA.
The pSlax-EGFP-cU6-DMRT1-343shRNA construct was ClaI digested to release the EGFP-cU6-
DMRT1-343shRNA sequence, which was then inserted into the ClaI site of pRCAS.BP.B to produce
pRCAS-DMRT1shRNA. Virus production was achieved as per pRCAS-DMRT1miRNA.
Detection of RCAS expressed DMRT1 shRNAs
An RNase protection assay was performed to detect DMRT1 shRNA expression using the DMRT1
RNA probe. Small RNAs were isolated (mirVana miRNA isolation kit, Ambion) from a pool of nine
pairs of genetic male gonads at embryonic day 10 (E10), that were blastoderm infected at embryonic
day 0 (E0) with RCAS-DMRT1shRNA and shown to be EGFP positive. As controls, small RNAs
were isolated from a pool of ten uninfected genetic male gonads at E10 (negative control), in addition
to small RNAs isolated from RCAS-DMRT1shRNA infected DF1 cells (positive control). RNA
samples were hybridised with the radiolabelled (γ-P32) DMRT1 RNA probe (mirVana Probe & Marker
kit, Ambion) in solution overnight at 42ºC. The DMRT1 shRNA hybridised samples and the +RNase
control were RNase A/T1 treated as recommended. Samples were separated on a 15% (w/v)
polyacrylamide (8M urea) gel and then exposed to HyperfilmTM ECL (Amersham Biosciences) within
an EC-AWU cassette (Fuji) and placed at -80ºC overnight. The film was developed using an X-ray
processor FPM-100A (Fuji).
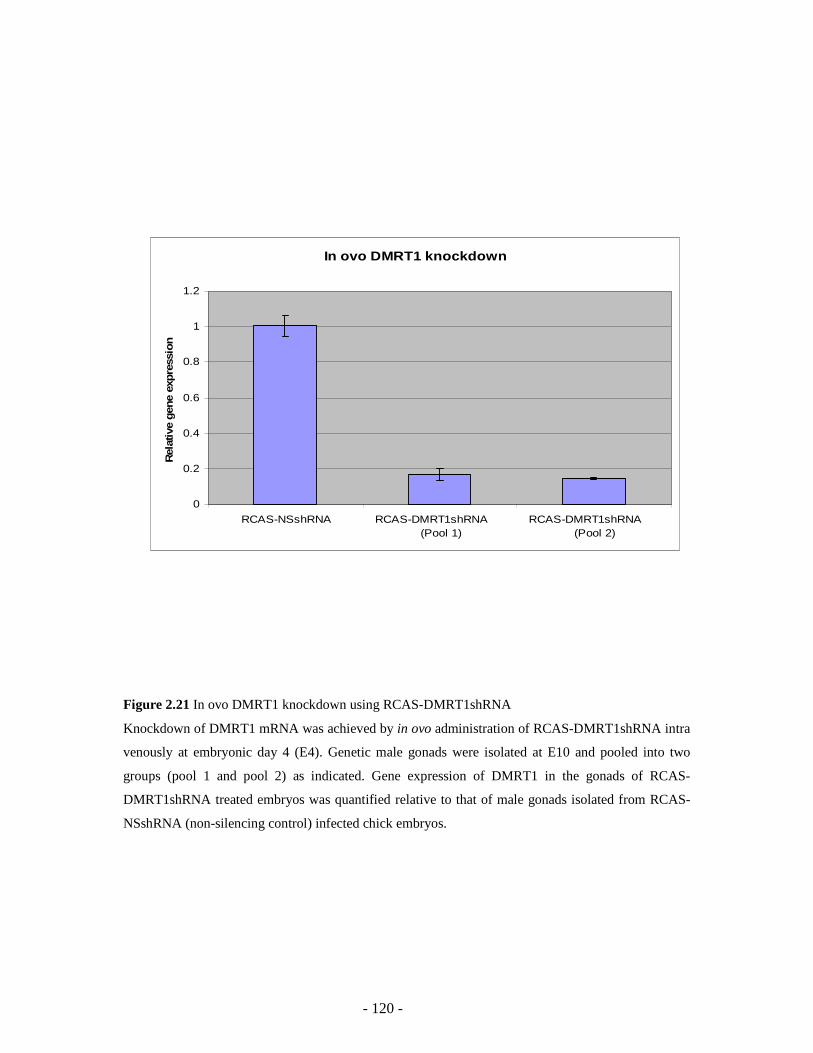
Confirmation of DMRT1 knockdown in ovo by qPCR
Forty fertile chicken eggs (Gallus gallus domesticus) obtained from SPAFAS (Woodend, Victoria)
were injected intra venously at E4 with RCAS-DMRT1shRNA and twenty fertile chicken eggs with
RCAS non-silencing control shRNA (RCAS-NSshRNA). At E10, gonads were individually collected
and embryos genotypically sexed by PCR (as described earlier). Twenty-one genetic male gonads
from RCAS-DMRT1shRNA infected embryos were obtained and divided into two groups (pool 1 (ten
gonads) and pool 2 (eleven gonads)), while four genetic male gonads from RCAS-NSshRNA infected
embryos were collected and pooled. Total RNA was extracted from the three pools using the mirVana
miRNA isolation kit (Ambion). Purified RNA was DNase treated and then reverse-transcribed to
cDNA using a Reverse Transcription Kit (Promega) according to the manufacturer’s
recommendations. To quantify DMRT1 knockdown, primers/probe were designed to the 1038 bp
DMRT1 sequence using the Custom TaqMan Assay Design Tool (Applied Biosystems). The resulting
primers/probe, qDMRT1-F, qDMRT1-probe and qDMRT1-R were used in conjunction with TaqMan
Universal PCR Master Mix (Applied Biosystems) as described by the manufacturer in a 20µL reaction
containing 2µL of neat cDNA. Analysis was performed using the StepOneTM PCR cycler instrument
and software v2 (Applied Biosystems).
Page 27
- 74 -
Results
RNAi molecules were first tested in vitro against myostatin-EGFP fusion constructs so that effective
molecules could be easily screened prior to beginning the more technically challenging in ovo work.
We used the chicken embryo derived DF-1 cell line for the tests. This cell line was chosen because it
was embryo derived and therefore of importance to our provisional patent application as it relates to
the in ovo modulation of traits. We fused the chicken myostatin gene to EGFP in the plasmid pEGFP-
C. The transcriptional fusion still expresses EGFP quite well. In this experiment we used fluorescence
microscopy to visualise silencing as opposed to FACS analysis described below for the DMRT1 gene.
We made 3 shRNA plasmids targeting myostatin and co-transfected these with the fusion construct
into the DF-1 cells. The plasmid expressing the td306 shRNA gave excellent silencing of the EGFP-
myostatin fusion. This is an excellent RNAi molecule.
We have also tested numerous molecules in vitro against DMRT1-EGFP fusion constructs. Again, as
described above, we have used the embryo derived DF1 cell line. For the in vitro test we constructed a
gene fusion of the reporter gene EGFP and chicken DMRT1 gene. The fusion is transcriptional and not
translational and therefore EGFP still expresses quite well in tissue culture. We then made plasmids
that express shRNAs that target the DMRT1 specific part of the fusion. We then co-transfected the
plasmids with the fusion construct into DF-1 cells and measured EGFP fluorescence. If the shRNAs
successfully target the DMRT1 region of the fusion and direct degradation of the fusion transcript then
we would see less EGFP fluorescence. In this experiment we used FACS analysis to measure the mean
fluorescence intensity of the co-transfected cells. The DMRT1 shRNA plasmids gave a range of levels
of silencing. We decided to improve on the levels of in vitro silencing that we observed, so using the
latest computer algorithms, we designed and developed new shRNA molecules that target chicken
DMRT1 and Myostatin genes. We now have a total of 10 shRNAs for DMRT1 and 7 shRNAs for
myostatin that could be studied further both in vitro and in vivo. We constructed pCluck plasmids for
expression of the shRNAs from the chicken U6-4 promoter and validated the shRNAs for target gene
silencing in cultured embryonic fibroblast cells. The results for DMRT1 and Myostatin gene silencing
are shown in Figure 2.19. We have now selected the best shRNAs for the proof-of-concept in ovo
experiments.
The next stage was to assess the myostatin and DMRT1 in vitro tested RNAi molecules in ovo. To
enable us to do this, we developed the avian retroviral vector, RCASBP(B) (Replication Competent
Avian Sarcoma leukosis virus, high titre Bryan Polymerase, strain B) viral vector delivery system for
embryo delivery. Initially we used an EGFP reporter plasmid (pEGFP-N1) to develop skills in this
technique. We do this by injecting intravenously into 4 day old embryos. The embryos are then
incubated until day 10 of embryogenesis and are then screened for expression of the EGFP gene.
Page 28
- 75 -
Figure 2.20 clearly shows EGFP fluorescence during both limb bud and organ development from an
infected embryo. Now that this delivery system was working for us we were ready to deliver shRNAs
to embryos.
Our best shRNA targeting DMRT1 was shRNA343. Viruses carrying shRNA343 were used to infect
day 0 chicken blastoderms, and embryogenesis was allowed to proceed until day 10. Control embryos
were infected with virus carrying GFP and a scrambled non-silencing RNAi sequence. All embryos
were genotypically sexed by PCR. In the chicken embryo, the gonads form on the mesonephric
kidneys around day 3.5 of incubation. Sexual differentiation into testes or ovaries begins at day 6 and
is normally advanced by day 10. Embryos infected with virus at day 0 showed global GFP reporter
expression by day 10, including widespread expression in the urogenital system and in sectioned
gonads. RNase protection assays of these day 10 gonads confirmed expression of the mature DMRT1
knockdown siRNAs (Figure 2.22) and quantitative real time PCR confirmed silencing of the DMRT1
gene in pooled male embryos at E4 and E10 (Figure2.21).
Treatment of genetically male (ZZ) chicken embryos with the DMRT1 knockdown sequence
(shRNA343) resulted in feminisation of the gonads by embryonic day ten. Gonadal development in
embryos treated with scrambled control RNAi was normal, with bilateral testes observed in males and
typical asymmetric ovarian development observed in females (n=40). In all control samples, gonadal
sex matched genotypic sex. At the histological level, control females showed typical ovarian
morphology. The left gonad showed a vacuolated medulla and a thickened outer cortex, where germ
cells were accumulated, while the smaller right gonad showed a vacuolated medulla and no thickened
cortex (Figure 2.23a and b). Control male embryos exhibited bilateral testis development,
characterised by seminiferous cords in the inner medulla, enclosing germ cells, and a thin outer
epithelial cell layer (Figure 2.23c, d and e).
Gonads from embryos were assessed for DMRT1 and marker gene expression. In control embryos
infected with virus carrying the non-silencing scrambled miRNA, DMRT1 protein expression was not
affected and gonadal histology was normal. In these control males, DMRT1 protein was uniformly
expressed in the nuclei of developing Sertoli and germ cells within testis cords (Figure 2.24a).
Expression was strong, bilateral (in both left and right gonads) and indistinguishable from staining in
uninfected male embryos. In contrast, male embryos (ZZ) treated with two different DMRT1
knockdown constructs showed variably reduced DMRT1 protein expression in the left gonad,
disrupted testis cord formation and ectopic female gene expression. The extent of DMRT1 knockdown
and testis cord disruption varied among embryos, but was more pronounced with the shRNA343
construct compared to the control construct. Gonadal DMRT1 protein expression was either greatly
reduced throughout both left and right gonads (Fig.2.24b), or expression was irregular, in embryos
Page 29
- 76 -
treated with shRNA343. Quantitative RT-PCR analysis confirmed that DMRT1 mRNA expression was
reduced by over 60% in both male and female embryos treated with miRNA563 or shRNA343 (Fig.
2.24d).
Genetic male chicken embryos treated with DMRT1 miRNA showed ectopic activation of the robust
female marker, aromatase. Aromatase enzyme is normally expressed only in female gonads, where it
synthesises the oestrogen that is required for ovarian differentiation birds. Aromatase enzyme is never
detected in normal male embryonic gonads. In control and DMRT1 knockdown female embryos
(ZW), aromatase enzyme was strongly expressed in the medulla of both left and right gonads (Fig
2.25a). No expression was seen in male controls treated with scrambled control (Fig. 2.25b). However,
in the twelve feminised males examined by immunofluorescence, aromatase was ectopically activated.
In those males treated with shRNA343, both the left and right gonads showed ectopic aromatase
expression (Fig. 2.25c). This finding indicates that elevated DMRT1 expression in male gonads
normally suppresses aromatase and hence female development.
Overall, these results indicate that DMRT1 plays a key role in chicken testis determination. Treatment
of genetic male chicken embryos with RNAi constructs (shRNA) results in feminisation of the gonads
by day ten of development. Our results support the Z dosage hypothesis for avian sex determination
(Smith et al., 1999; Nanda et al., 2008). Under this hypothesis, a higher dosage of DMRT1 initiates
testicular differentiation in male embryos, activating SOX9 expression and suppressing aromatase,
which is essential for female development. DMRT1 fulfils the requirements expected of an avian
master sex-determining gene. It is sex-linked, conserved on the Z sex chromosome of all birds
examined, including the basal ratites (ostriches, emus, et al.). It is expressed exclusively in the
urogenital system prior to gonadal sex differentiation in chicken embryos, with higher expression in
males, and knockdown leads to feminisation. Our data provides evidence that DMRT1 is the male sex
determinant in birds.
2.2.2 Outcome - RNAi developed as an anti-viral agent (e. g. CAV)
2.2.2.1 Inhibition of chicken anaemia virus replication usi ng multiple short-
hairpin RNA.
Chicken anaemia virus (CAV) is an important worldwide problem in the poultry industry, causing
acute anaemia in young chicks or subclinical infections in adult birds (Adair 2000). The subclinical
infection results in immunosuppression which is particularly troubling as this leaves chickens with
enhanced susceptibility to other avian pathogens and decreases the effectiveness of vaccines reducing
Page 30
- 77 -
production efficiency. Currently vaccination against CAV uses attenuated virus in drinking water,
however reversion to virulence from these strains has been seen
CAV is a member of the gyrovirus genus in the Circoviridae family of viruses that are characterized
by their small, single-stranded, circular DNA genome The genome is 2.3kb from which a single 2.0kb
mRNA transcript encoding the three viral proteins (VP) 1, 2 and 3 in overlapping reading frames is
transcribed. Splice variants of this transcript have recently been identified, however translation of
these transcripts has not been shown. VP1 is the 52kDa structural capsid protein; VP3, is a 13·8 kDa
virulence factor known to induce apoptosis in transformed cell lines; and VP2, is a 28 kDa dual-
specificity protein phosphatase (DSP). CAV with mutations in VP2 or VP1 have been shown to reduce
or stop replication of the virus. CAV is difficult to grow in tissue culture and will only grow in
transformed lymphoblastoid cell lines such as MDCC-MSB1 cells (Marek’s disease transformed
chicken T cell). These suspension cells are difficult to transfect and the best efficiency that has been
observed is approximately 50%.
RNA interference is a naturally occurring mechanism found in both plants and animals that uses short
RNA molecules (21-23 nts) to degrade or sequester mRNA resulting in specific gene suppression
(Hannon 2002; Fire et al. 1998). This mechanism has been taken advantage of by artificially
introducing short interfering (si)RNAs and short hairpin (sh)RNAs into cells to suppress genes of
interest. Introduction of siRNAs and shRNAs targeting viral mRNA has been shown to be effective at
silencing several human and animal viruses in vitro and in vivo including HIV-1, Hepatitis B,
Influenza A, FMDV and BVDV.
This study showed inhibition of CAV mRNA expression in MDCC-MSB1 cells by using single or
multiple shRNAs targeted to various regions of the CAV mRNA.
Methods
Cell culture and virus growth
Chicken lymphoblastoid cells, MDCC-MSB1, transformed by Marek’s disease virus, were cultured at
37ºC with 5%CO2 in a 100mm dish with RPMI1640 medium supplemented with 10% fetal bovine
serum (IBL), 2 mM glutamine, 0.01% penicillin and 0.01% streptomycin. DF1 cells were grown in
DMEM medium supplemented with10% fetal bovine serum (IBL), 2 mM glutamine, 0.01% penicillin
and 0.01% streptomycin at 37ºC with 5%CO2. Both cell types were subcultured twice weekly.
Page 31
- 78 -
The Australian isolate CAV269/7 was obtained from G. Browning ( School of Veterinary Scinece,
The University of Melbourne) and grown in MDCC-MSB1 cells. Virus was prepared by freeze
/thawing the culture three times and then clarifiying by centrifugation at 6000 g for 10 min. Virus was
stored at -80 ºC.
pEGFP-CAV and chicken U6 promoter plasmid construct ion
pCAV269/7 (from Melb Vet School) was digested with PstI and BamHI, the 935bp CAV fragment
was gel purified and ligated into the similarly digested pEGFP-C1. Single chicken U6 promoters 1, 3
and 4 were amplified by PCR from previously reported plasmids (Wise et al. 2007) and ligated into
pGEMTeasy. ChU6#4 was ligated via SphI and SalI sites on primers and plasmid whilst ChU6#1 was
ligated with BfuAI and NdeI. The reverse primers also contained an extra restriction site between the
two cloning sites for removal of parental vector before transforming E.coli cells. Oligonucleotides
used are shown in Table 2.4. All restriction enzymes were obtained from either Promega or New
England Biolabs.
For construction of the multi-promoter vector 3 rounds of overlapping PCR was performed on the
three U6 chicken promoters. Oligonucleotides are shown in Table 2.4. The first round of PCR
amplified ChU6#1, 3 and 4 individually. The second round combined the ChU6#4 and ChU6#3 DNA
templates. A third round of PCR combined the ChU6#4 & 3 template from round two with the
individual ChU6#1 from round 1 to produce a PCR product containing all three promoters. This
product was digested with SphI and NdeI and ligated into a similarly digested pGEMTeasy to produce
pMP. Each reverse primer contained restriction sites for ligation of the shRNAs. All PCRs were
performed with Platinum TaqHiFi as per manufacturers instructions (Invitrogen). All plasmids were
sequenced by Micromon DNA sequencing facility (Moansh).
shRNA design and plasmid construction
Firstly siRNAs were designed based on the CAV 269/7 strain sequence (Genebank. Accession No.
AF227982) using the Dharmacon siRNA Design tool (http://www.dharmacon.com). Sequences were
selected to be in the ORF and contain a GC content between 30% to 64%. The first three criteria of the
Taxman algorithm (Taxman et al. 2006) were then applied to the first 40 siRNAs predicted from the
Dharmacon tool. Any sequences with a score of 3 or 4 then had the free-energy of the central six bases
calculated using free-energy parameters for predictions of RNA duplex stability as published by Freier
et al (1986). Six siRNA sequences that had the best Taxman score and a central duplex closest to a ∆G
> -12.9 kcal/mol were chosen. Complementary DNA oligonucleotides containing the siRNA followed
by the loop sequence TTCAAGAGA, then the anitsense of the siRNA and followed by a PolIII
Page 32
- 79 -
termination sequence were chemically synthesized and annealed. A 5’ blunt end and 3’ SalI site
overhang sequence were included for ligation into PmeI and SalI digested pChU6#4 or a 5’ BfuAI and
3’ NdeI site overhang sequence were included to ligate into BfuAI and NdeI digested pChU6#1. A
non-silencing (shNS) negative control and a positive control shRNA targeting GFP were also used the
sequences have been published previously (Lambeth et al. 2005). All oligonucleotide sequences used
to produce CAV shRNAs are shown in Table 2.4
.
For the multipromoter plasmid, annealed shRNA oligonucleotides were ligated into either PmeI and
SalI digested pMP to be transcribed by ChU6#4, NcoI (nuclease treated to produce a blunt end) and
XhoI digested pMP to be transcribed by ChU6#3, or BfuAI and NdeI digested pMP to be transcribed
by ChU6#1 producing pCAV-shMW. All plasmids were sequenced by Micromon DNA sequencing
facility (Moansh).
Transfection of GFP-CAV and shRNA plasmids into DFI cells
DF1 cells were seeded at 1.5x10⁵ cells in 24 well tissue culture plates and grown overnight at 37ºC
with 5%CO2. Plasmids were transfected into the DF1 cells using Lipofectamine 2000 as per
manufacturers instructions (Invitrogen). Breifly1ug of pEGFP-CAV and 1ug of the relevant shRNA
diluted in 100ul OPTI-MEM (Gibco) were mixed with 2ul of Lipofectamine 2000 diluted in 100ul
OPTI-MEM and incubated at room temperature for 20mins. The DNA; lipofectamine mix were added
to cells and incubated for 4hrs. Cell media was changed to normal growth media and incubated for
72hrs. Cells were then washed twice with PBS, trypsinised and washed twice with FACS wash (PBS
with 1% FBS). Cells were subjected to flow cytometry and analysed as a percentage of the non-
silencing shRNA mean FITC fluorescence.
Transfection of GFP and shRNA plasmids into MDCC-MS B1 cells
MDCC-MSB1 cells were washed twice in RPMI 1640 medium (Sigma–Aldrich), 4x10⁶ cells were
resuspended in 350 µl RPMI 1640 containing 10 µg of pEGFP-N1 and 10 µg of the relevant shRNA
plasmid in a microfuge tube. Transfection was performed in a 0·4 cm gap electroporation cuvette in a
Gene Pulser apparatus (Bio-Rad) set at 400 V, 900 µF, resistance and extension capacitance. The
cells were incubated at room temperature for 5 min, then resuspended in 1 ml warm growth medium
and incubated for 4hrs before infection with CAV.
Page 33
- 80 -
Infection of transfected MDCC-MSB1 cells
Transfected cells were counted and 1x10⁶ cells for each transfection were pelleted and infected with
an MOI of 2 CAV269/7 for 1 hr at 37 ºC or mock infected with 200µl of growth medium. Cells were
then transferred to 3ml warm growth medium and incubated for 72 or 96hrs.
Detection of GFP and CAV VP3 by flow cytometry
Cells for experiments with GFP alone were washed 3x in FACS wash and analysed by flow cytometry
at 72hrs. At 72 or 96hrs transfected and infected cells were counted and 1x10⁶ cells were removed.
Cells were pelleted and fixed in 1ml BD permeablilisation solution 2 for 20mins at room temperature
(Becton Dickinson). Cells were then washed once in PBS with 0.01% Tween 20. Cells were then
stained with 1/1000 mouse antiCAV VP3 and 1/500 goat anti mouse IgG1 APC conjugated antibody
and analyzed by flow cytometry for GFP and APC fluorescence. Dot plots of the cells comparing
FITC and APC channels were analysed and histograms of APC fluorescence of GFP transfected cells
were produced. Mean fluorescence of the histograms were taken and analysed as a percentage of the
non-silencing shRNA mean fluorescence.
Results
shRNA design and plasmid constructs
The single-stranded DNA genome of CAV is transcribed into a single long mRNA molecule encoding
the three overlapping CAV genes. Therefore targeting any region of the coding sequence should
silence the expression of all three proteins. As the genome is a small DNA strand sequence diversity
amongst isolates is low. The Australian CAV269/7 strain used in the study has been shown to have
95% sequence identity to seven other sequenced isolates, whilst the other seven isolates had 98-99%
identity to each other. shRNAs were therefore designed against the more highly conserved regions of
the genome to give cross strain protection. As VP2 is overlapped by the entirety of VP3 and a portion
of VP1 (Fig 2.13) most of the shRNAs designed targeted two of the genes, although two shRNAs
targeted VP1 alone. Each shRNA was inserted into an expression vector individually, the three most
active shRNAs were then cloned into pMP to determine whether individual or multiple shRNAs work
most effectively. This plasmid has previously been shown to express three different shRNA molecules
targeted against influenza by RNase protection assay indicating the plasmid is functional (unpublished
data). The GFP-CAV fusion vector contains 935bp of the CAV genome at the 3’ end of the GFP gene.
This region contains the target sequence for all six of the CAV shRNAs (Fig 2.13) and is expressed as
a single mRNA therefore an active shNA will result in the loss of GFP expression.
Page 34
- 81 -
Silencing of GFP-CAV fusion transcript by single or multiple shRNAs
Each shRNA vector was first tested against the GFP-CAV fusion mRNA in DF1 cells. All of the
shRNAs had some activity with the least active giving only 30% knockdown of GFP expression (Fig
2.14). shRNA VP2/3-3 appeared to be extremely effective with over 80% knockdown of GFP-CAV
expression, considerably more than the shGFP positive control. This indicates that efficient inhibition
of CAV replication should be possible. The three most active shRNAs VP2/3-1, VP2/3-3 and VP1-2
were cloned into pMP to produce pCAV-MW. pCAV-MW contains shVP1-2 under the control of the
U6#4 promoter, shVPVP2/3-3 under the control of the U6#3 promoter and shVPVP2/3-1 under the
control of the U6#1 promoter. A schematic diagram is shown in Fig 2.13. This construct was then
examined for it’s ability to inhibit GFP-CAV mRNA expression compared to the individual shRNAs.
pCAV-MW was less efficient at silencing GFP expression than the single most active shRNA VP2/3-1
(Fig 2.15). However the knockdown was still significant at over 70%. All results are shown as a
percentage of the non-silencing shRNA negative control.
MDCC-MSB1 cells have the RNAi pathway
As MDCC-MSB1 cells have not previously been used in RNA interference work and are highly
transformed, it was necessary to determine whether the cells had retained the RNA interference
pathway. Therefore the GFP expression vector alone or with a non-silencing shRNA or a previously
published, highly active shRNA targeting GFP was electroporated into MSB1 cells. Results from both
fluorescent microscopy and flow cytometry indicate MDCC-MSB1 cells do have RNAi ability (Fig
2.16). The results also indicate that the best silencing is observed at 96hrs post-transfection. This was
therefore used for future experiments.
Silencing of CAV replication using shRNAs
It has been shown that some siRNAs that are highly effective against the GFP-fusion reporter assay
are not effective against the target virus (Lambeth et al. 2007). This is most likely due to different
folding configurations of the native virus mRNA compared to the GFP-fusion mRNA. Therefore to
determine the effectiveness of the chosen shRNAs at inhibiting CAV replication an assay to determine
silencing was required. Although it has been shown that MDCC-MSB1 cells have retained the RNAi
pathway, the best transfection efficiency that has been obtained is approximately 50% of cells (data
not shown). This is relatively low to determine if CAV has been silenced as all cells are infected with
CAV. Therefore a way to distinguish infected and transfected cells was required. This was
Page 35
- 82 -
accomplished by co-transfecting the shRNA with pEGFP-N1 (clontech). Any cells that contain GFP
are expected to also contain the shRNA. A method to detect CAV infection by flow cytometry has
recently been elucidated by the use of a monoclonal antibody targeting VP3 and a secondary anti-
mouse antibody conjugated with APC (personnel communication). Therefore both GFP transfected
and infected cells can be distinguished by flow cytometry by acquiring fluorescence from two
different flourophores (GFP and APC; Fig 2.17). If a higher APC mean fluorescence is detected in
GFP positive cells it indicates that more of those cells have VP3 expression indicating those cells have
a productive CAV infection and therefore CAV is not silenced. Alternatively a lower APC mean
fluorescence detected in GFP positive cells indicates VP3 expression is less and CAV protein
expression is inhibited.
When this assay was used with pCAV-MW and the three individual shRNAs contained within, a
decrease in virus protein expression was observed with all of them (Fig 2.18). Interestingly the most
active was shRNA VP2/3-3 with a 60% knockdown of CAV VP3 expression, this was not the most
active in the GFP-fusion reporter system. The MW was again slightly less active than the best single
shRNA, however it still showed over 50% knockdown. All results are shown as a percentage of the
non-silencing shRNA negative control.
Discussion
CAV is a major problem for the world-wide poultry industry due to its ability to produce sub-clinical
infection and immunosuppression in vaccinated mature birds. The use of RNA interference to silence
virus replication has been shown to be highly effective against many human and animal viruses both in
vitro and in vivo. This study demonstrates the ability to silence CAV protein expression up to 60% in
MDCC-MSB1 cells with single shRNAs targeting various regions of the genome. However, the use of
one shRNA particularly against highly variable RNA viruses such as poliovirus and HIV, has allowed
for the production of escape mutants. Whilst this may not be such a significant problem in the highly
conserved CAV DNA genome, expression of multiple shRNAs would be more appropriate.
The best method for expressing multiple shRNAs has not been shown. Several methods have been
explored including expression from multiple cassettes using the same promoter, from single vectors
containing multiple promoters or as extended or long hairpin RNAs containing two siRNA sequences.
This study used a plasmid construct directing the expression of three shRNA molecules from three
different chicken U6 promoters. These promoters are the most active in chicken cells and therefore
appropriate for use against an avian pathogen (Wise et al. 2007). The vector was shown to reduce viral
protein by 50%, this is a significant decrease as the virus dose in this assay would be considerably
higher than a normal environmental exposure. Interestingly expression of the three different shRNAs
Page 36
- 83 -
from pCAV-MW showed less protection than the most active individual shRNA alone, this has been
observed previously when multiple siRNAs or shRNAs are used. This may be due to pCAV-MW
containing a less active shRNA molecule against the virus decreasing the overall effect. It may also be
possible that the order of either the promoters, as ChU6#1 is weaker than ChU6#4 (Wise et al.
2007),or the shRNAs may have an impact. More work is required on the best delivery vector for
multiple shRNAs.
This is the first time a method to detect both infected and transfected MDCC-MSB1 cells by flow
cytometry has been reported. This method will be useful in the future. It is also the first study that
demonstrates silencing of CAV expression is possible with single or multiple shRNA molecules. As
the CAV genome sequence is highly conserved amongst strains, developing shRNAs targeting this
virus should be highly efficient at cross-strain protection. It will now be interesting to determine
whether these shRNAs are able to protect chickens from CAV infection.
2.2.3 Outcome - Generation of IP and potential comm ercial products identified
via proof-of-concept.
2.2.3.1 Patents
We have two key patent applications that have resulted from our RNAi in ovo modulation work. The
first patent is quite broad and covers claims for a range of production traits including health, muscle
and sex determination. The second patent is focused on modulation of sex determination. This has
become the major emphasis of our RNAi work with the greatest potential for a commercial
application.
Commonwealth Scientific and Industrial Research Organisation, Australian Poultry CRC Pty Ltd
International Patent Application PCT/AU2008/000835
Entitled: "Modulating production traits in avians"
Status: National / Regional phase in selected juristictions.
Commonwealth Scientific and Industrial Research Organisation, Australian Poultry CRC Pty Ltd
United States of America Provisional Patent Application 61/138235
Entitled: "Methods of modulating the sex of avians"
Page 37
- 84 -
Status: Full patent filed 17th December 2009
2.2.3.2 Extension to Project 03-16b: Application of genomics-based technology for
the development of new health products.
In 2009, Supplemental funding was provided to 03-16b in order to provide additional data
supporting the patent applications.
A major outcome of the research in this project is to now apply RNA interference (RNAi) technology
to modulate production traits in poultry. We are of the firm opinion that in ovo modulation of
production traits will happen and will be of commercial value. The production traits that we are
targeting include health, muscling and sex determination. Work so far undertaken in this project has
lead to the two joint Poultry CRC and CSIRO International Patent Applications detailed above.
Discussion with industry has highlighted modulation of sex determination as the major area of focus
for this research (in particular, driving males to females by targeting the DMRT1 gene). There are two
clear commercial paths to impact. The first is with the breeding companies - they cull male chicks at
hatch and this is both an economic and welfare issue that they would like to see improved. Even
slightly increasing the ratio of females to males is of importance and value to the breeders. The second
path is with the vaccine companies. Pfizer has invested into embrex technology and would like to get
better uptake of embrex delivered vaccines (including new and innovative vaccines) into the layer
industry. Their big problem at the moment is that the industry is reluctant to adopt the embrex
platform because 50% of the injected eggs are male and are therefore culled at hatch. Pfizer are
extremely interested in an approach to sway the sex ratio to females. As an added bonus, we are
currently working towards embrex delivery of our RNAi molecule and Pfizer are extremely keen to
develop more embrex deliverable products.
In September 2008, PCT/AU2008/000835 was subjected to an International Search Report and
Written Opinion. Based on the result of this report and subsequent discussions with the Poultry CRC,
CSIRO and the patent firm FB Rice & Co, it was decided that the in ovo delivery of our RNAi
molecules should be narrowed to neat double stranded RNA (dsRNA) formulations. Such
formulations are compatible with embrex injection directly to eggs. Prior art already exists for other
delivery options (e.g. viral vectors) that we were already using to generate data for the filed patent. As
a result of this decision we submitted a new patent entitled “Modifying chicken sex”. The application
was filed on the 17th of December 2008. We undertook this extension project to employ a technician
for 12 months to help us obtain vital new data and file the full patent application. The specific extra
Page 38
- 85 -
work that was approved and carried out was to: (i) Develop neat dsRNA formulations for direct
injection into embryonated eggs; (ii) Assess gene knockdown of targeted sex determination genes in
embryos, in particular the dmrt1 gene; and (iii) Prepare data for inclusion in full patent application.
Results
In ovo modulation of DMRT1 gene expression in chick ens
An siRNA targeted to a conserved exon of the chicken DMRT1 gene was designed using the Ambion
siRNA Target Finder tool (www.ambion.com). The chosen siRNA was designated DMRT1-343-
siRNA (5’-GAGCCAGUUGUCAAGAAGAUU-3’). The siRNA was synthesized and obtained from
Qiagen. All primer and oligo sequences are detailed in Table 2.5.
For in ovo delivery, the siRNA was formulated with lipoefectamine 2000 (Invitrogen) according to the
manufacturer’s instructions. The now complexed siRNA was then delivered in ovo at a dose of either
100 pmol or 200 pmol. The siRNA was injected into embryonated eggs via an intravenous (I.V.) route
or directly into the amnion at embryonic day 4.5 (E4.5). For both I.V. and amnion delivery, a small
opening (1cm x 1cm) was created at the top of the blunt end of the egg so as to avoid the membrane,
veins and arteries, and 100 pmol or 200 pmol in a 4 ul volume was then injected directly into a vein or
into the amnionic cavity using a micro-capillary pipette. Micro-capillaries of 1 mm diameter were
used for injections, and their tips were pulled to a diameter of 40 microns with bevelled tip of 22.5 o.
After injection, the holes in the eggs were sealed with appropriate sized parafilm squares using a
heated scalpel blade. In total, 286 embryonated eggs (E4.5) were used in this experiment; Group 1: 48
eggs were used as controls and were not injected with the DMRT1-343-siRNA formulation; Group 2:
51 eggs were injected I.V. with 100 pmol of siRNA; Group 3: 53 eggs were injected I.V. with 200
pmol of siRNA; Group 4: 81 eggs were injected into the amnion with 100 pmol of siRNA and; Group
5: 53 eggs were injected into the amnion with 200 pmol of siRNA (Table 2.6). All embryos were
incubated until day E10. At E10, all embryos were assessed for viability and then removed from the
egg. Control Group 1 had an embryo viability of 100%; Group 2 had a viability of 76%; Group 3 had a
viability of 94%; Group 4 had a viability of 40% and; Group 5 had a viability of 75%. A single limb
bud from each embryo was removed and used in a sex determination PCR test to determine if the
embryos were of male or female genotype. Lower limb buds from each embryo were collected into 50
ul of PCR digestion buffer (50 mM KCl; 10 mM Tris-HCl, pH8.3; 0.1 mg/ml gelatine; 0.45% Nonidet
P-40; 0.45% Tween-20; 0.2 mg/ml proteinase K; stock stored at -20oC) at room temperature and
digested at 55oC for a minimum of 1 h, then at 95oC for 10 min to release genomic DNA. Sexing was
carried out by PCR using the method of Clinton et al., 2001. The PCR mix consisted of 1 ul of
digestion mix, 10 X RedTaq reaction buffer (Sigma-Aldrich), MgCl2 to 1.5 mM (Promega), 1 unit of
Page 39
- 86 -
RedTaq DNA polymerase (Sigma-Aldrich) and Milli-Q water (Millipore) to a total volume of 20 ul.
Reactions were carried out in a Master cycler S (Eppendorf) PCR machine. Products were run on a
1.5% 1 X Tris-borate (TBE) agarose gels.
Once the sex PCR test was complete and analysed, the embryos were definitively labelled as either
being genotypically male or female. The embryos were then opened via dissection and the gonads
exposed for macroscopic analysis of gonadal development. The gonadal development of all control
embryos was normal as expected. Control female embryo’s showed typical asymmetric development
that was characterised by a large left ovary and smaller regressing right gonad. Control male embryos
all had typical bilateral testes. All female embryos from the siRNA knockdown groups (Groups 2-5)
had normal gonadal development. In contrast, some male embryos from the siRNA knockdown groups
showed varying degrees of female-like asymmetry at the macroscopic level of the gonads. The
feminisation effect of the DMRT1-343-siRNA was characterised by an average or small-sized right
testis and a larger feminised left gonad (Table 2.7). Feminisation was observed in a small number of
male embryos in Groups 2, 3 and 5 and resulted in an increase in the ratio of embryos with female-like
gonads in these groups.
Gonads from both male and female embryos in each treatment groups were assessed for DMRT1 gene
expression using quantitative RT-PCR analysis. Both the female and male gonads were pooled
separately from each group and RNA was extracted for cDNA synthesis and qPCR analysis. The
pooled gonads were added to 1 ml of Trizol and homogenised well by pipetting and vortexing at room
temperature until all gonad tissue had dissolved. 200 ul of chloroform was added and mixed well by
inverting the sample for 15 sec. The sample was then incubated at room temperature for 3 min and
then centrifuged at 12000 g for 15 min at 4oC. The aqueous phase of the sample was then transferred
to a new tube and then 500 ul of isopropanol was added and mixed well by inversion. The mix was
then incubated at room temperature for 10 min and then centrifuged at 12000 g for 10 min at 4oC. The
supernatant was removed from the tube carefully, so as not to disturb the RNA pellet, and the pellet
was then washed with 1 ml of 70% ethanol. The tube was then centrifuged at 7500 g for 5 min at 4oC
and the supernatant again was carefully removed and the RNA pellet was air dried at room
temperature for 10 min. The RNA pellet was then resuspended in 25 ul of RNase-free water and the
final concentration of RNA was determined using a NanoDrop ND-1000 Spectrophotometer (Thermo
Scientific). RNA was reverse transcribed to complimentary DNA (cDNA) using the Promega Reverse
Transcription kit (Promega). The reaction mix contained 1 ug of RNA, random hexamers (1 ul),
dNTPs (2 ul), AMV reverse transcriptase (Promega) (0.5 ul) and nuclease free water added to a total
reaction volume of 20 ul. The mix was incubated at 42oC for 1 hour, followed by a 10 min incubation
at 95oC for enzyme inactivation.
Page 40
- 87 -
cDNA was then used to quantify relative DMRT1 gene expression levels in the pooled male and
female gonad samples from each treatment group. qPCR primers and probes were designed using
Primer Express (Applied Biosystems) software and sequences are shown in Table 2.6. PCR’s were set
up in 20 ul reaction volumes that contained 2 X TaqMan qRT PCR mastermix (Applied Biosystems),
1 ul of primer/probe mix, 1 ul of cDNA sample and made up to final volume with Nuclease free water
(Promega). PCR cycling was performed at 95oC for 1 min, followed by 40 cycles of 95oC for 15 sec;
61oC for 30 sec and; 68oC for 30 sec. Ct values were obtained at a standard threshold value of 0.2 for
all reactions. This threshold value corresponded to the midway point of the logarithmic phase of all
amplification plots. Ct values were exported to Microsoft Excel for analysing relative gene expression
using the comparative Ct method. Relative levels of DMRT1 mRNA were compared with the chicken
house keeping 18S rRNA species across all cDNA samples (Figure 2.26). Quantitative RT-PCR
analysis confirmed that DMRT1 mRNA expression was specifically reduced in all pooled groups of
male embryos when compare to control Group 1. Almost 40% of DMRT1 gene expression knockdown
was observed for Group 3 male embryos treated with the DMRT1-343-siRNA. It is interesting to note
that Group 3 was also the group that resulted in the greatest degree of observed feminisation of male
gonads at the macroscopic level.
Page 41
- 88 -
2.3 References
Adair, B.M., 2000. Immunopathogenesis of Chicken Anemia Virus Infection. Developmental &
Comparative Immunology 24, 247-255.
Boden, D., Pusch, O., Silbermann, R., Lee, F., Tucker, L., and Ramratnam, B. (2004). Enhanced gene
silencing of HIV-1 specific siRNA using microRNA designed hairpins. Nucleic Acids Res 32, 1154-8.
Brummelkamp, T. R., Bernards, R., and Agami, R. (2002). A system for stable expression of short
interfering RNAs in mammalian cells. Science 296 , 550-3.
Clinton, M., Haines, L., Billois, B. and McBride, D. Sexing chick embryo’s: a rapid and simple
protocol. British Poultry Science 2001; 42:134-138.
Ge, Q., McManus, M. T., Nguyen, T., Shen, C. H., Sharp, P. A., Eisen, H. N., and Chen, J. (2003).
RNA interference of influenza virus production by directly targeting mRNA for degradation and
indirectly inhibiting all viral RNA transcription. Proc Natl Acad Sci U S A 100, 2718-23.
Fire A., Xu S., Montgomery M.K., Kostas S.A., Driver S.E. & Mello C.C. (1998) Potent and specific
genetic interference by double-stranded RNA in Caenorhabditis elegans. Nature 391, 806-811.
Fire A. (1999) RNA-triggered gene silencing. Trends in Genetics 15, 358-363.
Freier, S.M., Kierzek, R., Jaeger, J.A., Sugimoto, N., Caruthers, M.H., Neilson, T., Turner, D.H.,
1986. Improved free-energy parameters for predictions of RNA duplex stability. Proc Natl Acad Sci U
S A 83, 9373-7.
Hannon G. J. (2002) RNA interference. Nature 418, 244-251.
Hillier, W. Miller, E. Birney, W. Warren, et.al., Sequence and comparative analysis of the chicken
genome provide unique perspectives on vertebrate evolution, Nature 432 (2004) 695-716.
Kim D.H. & Rossi J.J. (2003) Coupling of RNAi-mediated target downregulation with gene
replacement. Antisense and Nucleic Acid Drug Development 13, 151-155.
Kudo T. & Sutou S. (2005) Usage of putative chicken U6 promoters for vector-based RNA
interference. Journal of Reproduction and Development 51, 411-417.
Lambeth,L.S., T.G. Wise, R.J. Moore, M.S. Muralitharan, T.J. Doran, Comparison of bovine RNA
polymerase III promoters for short hairpin RNA expression., Anim. Genet. 37 (2006) 369-372.
Page 42
- 89 -
Nanda, I., Schlegelmilch, K., Haaf, T., Schartl, M. & Schmid, M. Synteny conservation of the Z chromosome in 14 avian species (11 families) supports a role for Z dosage in avian sex determination. Cytogenet Genome Res 122, 150-6 (2008). Smith, C.A., McClive, P.J., Western, P.S., Reed, K.J. & Sinclair, A.H. Conservation of a sex-determining gene. Nature 402, 601-2 (1999).
Taxman, D.J., Livingstone, L.R., Zhang, J., Conti, B.J., Iocca, H.A., Williams, K.L., Lich, J.D., Ting,
J.P., Reed, W., 2006. Criteria for effective design, construction, and gene knockdown by shRNA
vectors. BMC Biotechnol 6, 7.
Wise, D.J. Schafer, L.S. Lambeth, S.G. Tyack, M.P. Bruce, R.J. Moore, T.J. Doran (2006)
Characterisation and comparison of chicken U6 promoters for the expression of short hairpin RNAs,
Anim. Biotechnol.
Page 43
- 90 -
2.4 Tables
Table 2.1 Synthesized oligonucleotides used in this study
‘r’ prefix to G, A and C represents ribonucleotide, and U indicates ribo-uridine.
Name Sequence Location/Feature TD135 5’- CGAAGAACCGAGCGCTGC -3’ cU6-1 TD139 5’- TATGGAACGCTTCACGAA -3’ Human U6 snRNA TD152 5’- AGTGGAACGGAGCCTGGAGA -3’ cU6-2 TD174 5’-CGCCAAATCCATCGCTGCTC -3’ cU6-2 TD176 5’- CAGACAGACGTCAGGCTTTC -3’ cU6-3 TD72 5’- TTTTAGTATATGTGCTGCCG -3’ Human U6 snRNA TD175 5’- GAATTGTGGGACGGCGGAAG -3’ cU6-4 TD148 5’- CTCGAGTTCCAAAAAAGCTGACCCTGAAGTTCATCTCTCTTGAA
GATGAACTTCAGGGTCAGCGAATATCTCTACCTCCTAGG -3’ cU6-1-shEGFP
TD143 5’- CTCGAGTTCCAAAAAAGCTGACCCTGAAGTTCATCTCTCTTGAA GATGAACTTCAGGGTCAGCGAATACCGCTTCCTCCTGAG -3’
cU6-1v-shEGFP
TD196 5’- CTCGAGTTCCAAAAAAGCTGACCCTGAAGTTCATCTCTCTTGAA GATGAACTTCAGGGTCAGCGACTAAGAGCATCGAGACTG -3’
cU6-3-shEGFP
TD195 5’- CTCGAGTTCCAAAAAAGCTGACCCTGAAGTTCATCTCTCTTGAA GATGAACTTCAGGGTCAGCAAACCCCAGTGTCTCTCGGA -3’
cU6-4-shEGFP
TD149 5’- CTCGAGTTCCAAAAAAATAAGTCGCAGCAGTACAATCTCTTGAA TTGTACTGCTGCGACTTATGAATACCGCTTCCTCCTGAG -3’
cU6-1-shNS
M13 5’- GTTTTCCCAGTCACGAC -3’ Universal Forward primer TD134 5’- CTCGAGTTCCAAAAAAGCTGACCCTGAAGTTCATCTCTCTTGAA
GATGAACTTCAGGGTCAGCCAAACAAGGCTTTTCTCCAA -3’ mU6/shEGFP
LL91 5’-rGrAUrGrArArCUUrCrArGrGrGUrCrArGrC-3’ EGFP probe
Page 44
- 91 -
Table 2.2 Forward shRNA oligonuleotide sequences.
Primer Name Primer sequence
NP-OL GGATCTTATTTCTTCGGAGTTCAAGAGACTCCGAAGAAATAAGATCCTTTTTTGGAAGGATCC
NP-mir17 GGATCTTATTTCTTCGGAGGATATATAGACTCCGAAGAAATAAGATCCTTTTTTGGAAGGATCC
NP-ggamir30a GGATCTTATTTCTTCGGAGCTGTGAAGCAGCAGATGGGGCTCCGAAGAAATAAGATCCTTTTTTGGAAGGATCC
NP-hspmir30a GGATCTTATTTCTTCGGAGCTGTGAAGCCACAGATGGGCTCCGAAGAAATAAGATCCTTTTTTGGAAGGATCC
CAVVP2/3-1-OL ATTCGGAATTACAGTCACTCTATTTCAAGAGAATAGAGTGACTGTAATTCCTTTTTTGGAA
CAVVP2/3-1-mir17 ATTCGGAATTACAGTCACTCTATGATATATAGAATAGAGTGACTGTAATTCCTTTTTTGGAA
CAVVP2/3-1-ggamir30a ATTCGGAATTACAGTCACTCTATCTGTGAAGCAGCAGATGGGGATAGAGTGACTGTAATTCCTTTTTTGGAA
CAVVP2/3-1-hspmir30a ATTCGGAATTACAGTCACTCTACTGTGAAGCCACAGATGGGATAGAGTGACTGTAATTCCTTTTTTGGAA
CAVVP2/3-3-OL GAAGGTGTATAAGACTGTATTCAAGAGATACAGTCTTATACACCTTCTTTTTTGGAA
CAVVP2/3-3-mir17 GAAGGTGTATAAGACTGTAGATATATAGATACAGTCTTATACACCTTCTTTTTTGGAA
CAVVP2/3-3-ggamir30a GAAGGTGTATAAGACTGTACTGTGAAGCAGCAGATGGGGTACAGTCTTATACACCTTCTTTTTTGGAA
CAVVP2/3-3-hspmir30a
shGFP
GAAGGTGTATAAGACTGTACTGTGAAGCCACAGATGGGTACAGTCTTATACACCTTCTTTTTTGGAA
GGTGATGCTACATACGGAATTCAAGAGATTCCGTATGTAGCATCACCTTTTTTGGAA
a Letters in bold indicate PollIII promoter termination signal
Page 45
- 92 -
Table 2.3 Oligonucleotides used to produce Chicken U6 promoter vectors Primer Name Primer sequence ChU6#4F TTTGCATGCGTACCTCCTTCTCGCAG ChU6#4R TTTGTCGACATAAGCTT ATGTTTAAAC CCCAGTGTCTCTCG ChU6#1F CATGCATGCAAACGCTAAGCAGGCACCTAAAG ChU6#1R TTTCATATG ATACTAGT ATACCTGCGCAT GAATATCTCTACCTCCTAGGCGG ChU6#MP1F TTTGCATGCGTACCTCCTTCTCGCAG ChU6#MP1R TTTGTCGACATAAGCTT ATGTTTAAAC CCCAGTGTCTCTCG ChU6#MP2F TATGTCGACAAACTCCAGGAGGTGCATGTTTG
ChU6#MP2R TTTCTCGAGATGAATTC ATCCATGGGACTAAGAGCATCGAGAC
ChU6#MP3F CATCTCGAGAAACGCTAAGCAGGCACCTAAAG
ChU6#MP3R TTTCATATG ATACTAGT ATACCTGCGCAT GAATATCTCTACCTCCTAGGCGG
a Letters in bold indicate restriction sites for ligation of shRNA annealed oligonucleotides
b Letters underlined indicate restriction sites for cloning promoter vectors c Letters in italics indicate plasmid requires nuclease treatment after digestion
Page 46
- 93 -
Table 2.4 Oligonucleotides used to produce shRNA expression vectors
Primer Name
Primer sequence
VP2/3-1F ATTCGGAATTACAGTCACTCTATTTCAAGAGAATAGAGTGACTGTAATTCCTTTTTTGGAA VP2/3-1R TATTCCAAAAAA GGAATTACAGTCACTCTATTCTCTTGAAATAGAGTGACTGTAATTCC VP2/3-2F CAACTGCGGACAATTCAGATTCAAGAGATCTGAATTGTCCGCAGTTGTTTTTTGGAA VP2/3-2R TCGATTCCAAAAAA CAACTGCGGACAATTCAGATCTCTTGAATCTGAATTGTCCGCAGTTG VP2/3-3F GAAGGTGTATAAGACTGTATTCAAGAGATACAGTCTTATACACCTTCTTTTTTGGAA VP2/3-3R TCGATTCCAAAAAA GAAGGTGTATAAGACTGTATCTCTTGAATACAGTCTTATACACCTTC VP1/2-1F CAAGCGACTTCGACGAAGATTCAAGAGATCTTCGTCGAAGTCGCTTGTTTTTTGGAA VP1/2-1R TCGATTCCAAAAAA CAAGCGACTTCGACGAAGATCTCTTGAATCTTCGTCGAAGTCGCTTG VP1-1F ATTCGAAGGACTCATTCTACCTATTCAAGAGATAGGTAGAATGAGTCCTTCTTTTTTGGAA VP1-1R TATTCCAAAAAA GAAGGACTCATTCTACCTATCTCTTGAATAGGTAGAATGAGTCCTTC VP1-2F CATCAATGAACCTGACATATTCAAGAGATATGTCAGGTTCATTGATGTTTTTTGGAA VP1-2R TCGATTCCAAAAAA CATCAATGAACCTGACATATCTCTTGAATATGTCAGGTTCATTGATG NS-F NS-R
a Letters in bold indicate PollIII promoter termination signal b Letters in italics indicate retriction site overhangs for ligation c Letters underlined indicate loop sequence
Page 47
- 94 -
Table 2.5 Primer List Primer Name Sequence (5’-3’) DMRT1-F GAATTCATGCCCGGTGACTCC
DMRT1-R AAGCTTCTACTCGCCCTCGAG
DMRT1-208T GACTGCCAGTGCAAGAAGTTTCAAGAGAACTTCTTGCACTGGCAGTCTTTTTGGAAGGATCC
DMRT1-208B TCGAGGATCCTTCCAAAAAGACTGCCAGTGCAAGAAGTTCTCTTGAAACTTCTTGCACTGGCAGTC
DMRT1-343T GAGCCAGTTGTCAAGAAGATTCAAGAGATCTTCTTGACAACTGGCTCTTTTTGGAAGGATCC
DMRT1-343B TCGAGGATCCTTCCAAAAAGAGCCAGTTGTCAAGAAGATCTCTTGAATCTTCTTGACAACTGGCTC
DMRT1-568T CTGTATCCTTACTATAACATTCAAGAGATGTTATAGTAAGGATACAGTTTTTGGAAGGATCC
DMRT1-568B TCGAGGATCCTTCCAAAAACTGTATCCTTACTATAACATCTCTTGAATGTTATAGTAAGGATACAG
DMRT1-694T CTCCCAGCAACATACATGTTTCAAGAGAACATGTATGTTGCTGGGAGTTTTTGGAAGGATCC
DMRT1-694B TCGAGGATCCTTCCAAAAACTCCCAGCAACATACATGTTCTCTTGAAACATGTATGTTGCTGGGAG
DMRT1 RNA probe UrCU UrCU UrGrA rCrArA rCUrG rGrCU rC
pSlax-linkerT GATCCGATATCGCGGCCGCAGATCTCTCGAGCTGCA
pSlax-linkerB GCTCGAGAGATCTGCGGCCGCGATATCG
pEGFP-linkerT GGCCGCAGATCTGAATTCCTGCAGGATATCAAGCTTGGATCCT
pEGFP-linkerB CTAGAGGATCCAAGCTTGATATCCTGCAGGAATTCAGATCTGC
qDMRT1-F TCAAGCCAGTCAGGAAAACAGT
qDMRT1-R TCATGGCATGGCGGTTCT
qDMRT1-probe FAM-CCATCCCTTTCATCTGCC-NFQ
‘r’ prefix to G, A and C represents ribonucleotide, and U indicates ribo-uridine
Page 48
- 95 -
Table 2.6. Primer and Probe sequences
Sequence Name Sequence 5’ – 3’
DMRT1- 343-siRNA GAGCCAGUUGUCAAGAAGAUU
DMRT1 TaqMan MGB probe CCATCCCTTTCATCTGCC
DMRT1 Forward primer TCAAGCCAGTCAGGAAAACAGT
DMRT1 Reverse primer TCATGGCATGGCGGTTCT
18S rRNA TaqMan MGB probe TGCTGGCACCAGACTTGCCCTC
18S rRNA Forward primer CGGCTACCACATCCAAGGAA
18S rRNA Reverse primer GCTGGAATTACCGCGGCT
Page 49
- 96 -
Table 2.7. DMRT1 embryo injection results
siRNA dose and injection
route
No. embryos
injected
No. viable at
E10
% Male :Female
Genotype
(PCR sex test)
% Male:Female
Macroscopic
Gonad
phenotype
Group 1
No injection control
48 48 (100%) 60:40 60:40
Group 2
I.V. – 100 pmol
51 39 (76%) 59:41 54:46
Group 3
I.V. – 200 pmol
53 50 (94%) 54:46 46:54
Group 4
Amnion – 100 pmol
81 33 (40%) 48:52 48:52
Group 5
Amnion – 200 pmol
53 40 (75%) 33:67 28:72
Page 50
- 97 -
2.5 Figures
Figure 2.1 Promoter element sequences of the mouse U6, cU6-1, cU6-1v, cU6-3 and cU6-4 snRNA
promoters. The distal promoter region containing the OCT sequence and the proximal promoter region
containing the PSE and TATA elements sequence are shown for each promoter. Matches to the
consensus sequence delineated at the top of the OCT, PSE and TATA sequences are shown in upper
case (PSE consensus is from Dahlberg & Lund 1988, and the OCT consensus is from Sturm et al.
1988). Each dash mark between the PSE and TATA represent one nucleotide.
Page 51
- 98 -
Figure 2.2 Schematic representation of the PCR strategy used to produce shRNA expression vectors.
PCR used forward primers paired with reverse primers comprising all shRNA components. All final
PCR products consisted of a chicken or mouse U6 promoter, shRNA sense, loop, shRNA antisense,
termination sequence and XhoI site.
PCR for shRNA expression cassettes
Reverse Primer
Forward primer
Chicken / Mouse U6 promoter
XhoI Loop Sense Antisense Terminator
Genomic DNA template
Page 52
- 99 -
Figure 2.3 Inhibition of EGFP expression and detection of expressed shRNA from chicken and mouse
U6 promoters. (1) cotransfection of pEGFP-N1 and pcU6-1v-irrshRNA; (2) cotransfection of pEGFP-
N1 and pmU6-shEGFP; (3) cotransfection of pEGFP-N1 and pcU6-1v-shRNA; (4) cotransfection of
pEGFP-N1 and pcU6-1-shRNA; (5) cotransfection of pEGFP-N1 and pcU6-3-shRNA; (6)
cotransfection of pEGFP-N1 and pcU6-4-shRNA; (7) transfection of pEGFP-N1. (A): Fluorescence
images of Vero and DF-1 cells transfected with the EGFP/shRNA vectors (Magnification 50x). (B):
Mean fluorescence intensity for each transfection condition expressed relative to pcU6-1v-irrshRNA.
Error bars indicate standard error calculated on each individual experiment completed in triplicate.
(C): Detection of expressed shRNAs targeting EGFP (shEGFP) from Vero cell extracts.
miR-16
shEGFP
1 2 4 5 6 3 7
1 2 3 5 6 7 4
Vero
DF-1
A
B
C
0.00
20.00
40.00
60.00
80.00
100.00
120.00
140.00
1 2 3 4 5 6 7
Vero
DF1
Page 53
- 100 -
Figure 2.4 Promoter element sequence alignment of chicken, bovine and human 7SK promoters.
The enhancer (DSE) of the chicken 7SK promoter contains OCT-1 and SPH motifs but no CACCC
box. The basal promoter region features a PSE and TATA box with homology to consensus. Matches
to the defined consensus sequences indicated at the top of the OCT-1 [21], SPH [12], PSE [20] and
TATA sequences are shown in upper case. Nucleotide positions indicate the location (5’ � 3’) of
each element in the promoter relative to the transcription start site (+1). Each dash mark between the
OCT-1 and CACCC box and PSE and TATA box represents one nucleotide. The underscore in the
human 7SK PSE indicates a shift in the sequence by one nucleotide for alignment. Nucleotide
abbreviations in consensus sequences are according to the International Union of Biochemistry
convention for GENBANK.
Page 54
- 101 -
Figure 2.5 Detection of shEGFP expression from ch7SK-shEGFP expression constructs in DF-1
cells.
DF-1 cells were transfected with shEGFP expression constructs as indicated above each lane. RNA
samples were probed in solution with 32P-labelled shEGFP-specific LL91 RNA probe [14] and treated
with RNAse A/T1. Protected shEGFP fragments were distinguished by comparison to RNA size
markers (Decade™, Ambion).
Page 55
- 102 -
Figure 2.6 EGFP knockdown conferred by chicken 7SK and U6 promoters in DF-1 cells.
(a) Fluorescence microscopy images of DF-1 cells transfected with pEGFP-N1 only, or co-transfected
with pEGFP-N1 and various shEGFP expression plasmids as indicated for each image. TA is
transfection reagent-only control (no-plasmid DNA). Images presented are representative of results
from three independent experiments at 60 hours post-transfection (Magnification 50x). (b) Flow
cytometry results for EGFP knockdown assays in co-transfected DF-1 cells. shEGFP expression
constructs co-transfected with pEGFP-N1 are indicated on the x axis. EGFP knockdown was
measured as % mean fluorescence intensity (MFI %), normalised to the average MFI of the negative
control pch7SK-shIrr cells (100%). Error bars represent standard error of the mean (SEM) calculated
from three independent experiments. Where no bars are visible the MFI and or SEM is less than 1%.
Page 56
- 103 -
Figure 2.7 Construction of ch7SK-shEGFP expression vectors.
(a) pch7SK-shEGFP and pch7SK-shIrr vectors were engineered using one-step PCR. Expression
cassettes were amplified from cloned ch7SK promoter template using a forward primer (right-pointing
grey arrow), to the cloned ch7SK promoter sequence (blue) and reverse primers (left-pointing grey
arrow) overlapping the last 20bp of the promoter. The reverse primers also encoded the sense (black),
loop [5] (light grey) and antisense (white) shRNA sequences, pol III terminator (Black, T6) and XhoI
recognition sequence. (b) Construction of the pch7SK-MCS-shEGFP vector used an annealed
oligonucleotide (oligo) cloning approach [8]. Complementary DNA oligos featuring the sense (black),
loop [5] (grey) antisense (white), pol III terminator (T6), and KpnI and EcoRI overhangs were
annealed and ligated KpnI/EcoRI into the 3’ multi-cloning site (MCS) of the pch7SK-MCS vector
which contained a 315bp synthesised copy of the ch7SK promoter sequence.
Page 57
- 104 -
Figure 2.8 Alignment of the enhancer regions of the chicken 7SK and U4B promoters.
Nucleotide positions of the OCT-1 and SPH element for the ch7SK and cU4B [27] promoters are
given relative to the transcription start site (+1). The underscore indicates a shift in nucleotides for
sequence alignment. Conserved nucleotide sequences are defined in upper-case.
Page 58
- 105 -
Figure 2.9. Schematic representation of influenza H1 NP targeting shRNAs with different microRNA
loops A) Native pre-miRNAs. The red letters are the siRNA sequences, black letters indicate extra
miRA stem sequences, blue letters indicate the loop sequence used and underlined letters indicate loop
bases not present in the shRNA constructs. B) NP targeting shRNAs with microRNA loops predicted
through mFOLD. The red letters are the siRNA sequences and the blue letters indicate the loop
sequences used.
Page 59
- 106 -
Figure 2.10a. Silencing of EGFP-NP fusion mRNA by shRNAs in DF1 cells. DF1 cells were co-
transfected with 1 µg of the relevant vectors for 72 h. Column 1; pshNS control, column 2; pEGFP-NP
alone, column 3; pshGFP control, column 4; pshNP-OL, column 5; shNP-mir17, column 6; shNP-
mir30agga, column 7; shNP-mir30ahsp, column 8; untransfected. Columns 1 and 3-7 were co-
transfected with 1µg of pEGFP-NP. Cells were then assayed by flow cytometry and analysed in
Microsoft Excel. Values are shown as percentages of the negative control shRNA (shNS), as the mean
of three separate experiments in duplicate ± standard deviation.
Figure 2.10b. Verification of loop expression by Northern Blot. Northern Blot of NP targeted shRNA
molecules. Lane 1; uninfected cells: Lane 2; pshNS control: Lane 3; pshNP-OL: Lane 4; pshNP-
mir17: Lane 5; pshNP-mir30agga: Lane 6; pshNP-mir30ahsp.
A B
Unprocessed short hairpin RNAs
Processed mature siRNAs
0
20
40
60
80
100
120
pshN
S
pGFP-N
P
pshG
FP
pshN
P-OL
pshN
P-m
ir17
pshN
P-mir3
0agg
a
pshN
P-mir3
0ahs
p
Untran
sfecte
d% p
shN
S m
ean
flour
esce
nce
Page 60
- 107 -
Figure 2.11. Silencing of influenza A PR8 by shRNAs in MDCK cells. MDCK were electroporated
with 2.5 µg of DNA in nucleofector solution T with Amaxa program T20. Column 1; pshNS control,
column 2; untransfected, column 3; pshNP-OL, column 4; shNP-mir17, column 5; shNP-mir30agga,
column 6; shNP-mir30ahsp. Transfected cells were incubated for 24hrs then infected with influenza A
PR8 virus for 48 h. Supernatants were assayed for influenza A virus by HA assay. Graph depicts two
separate experiments in duplicate ± SEM.
0500
100015002000250030003500400045005000
pshN
S
Untran
sfect
ed
pshN
P-OL
pshN
P-m
ir17
pshN
P-mir3
0agga
pshN
P-mir30
ahsp
HA
titr
e/m
l
MOI 0.01
MOI 0.001
MOI 0.0001
Page 61
- 108 -
Figure 2.12. Silencing of targeted EGFP-CAV fusion mRNA by shRNAs in DF1 cells. A. DF1 cells
were co-transfected with 1 µg of the relevant vectors for 72 h or 96 h. Column 1; pshNS control,
column 2; pEGFP-CAV alone, column 3; pshGFP control, column 4; pshVP2/3-1-OL, column 5;
pshVP2/3-1mir17, column 6; pshVP2/3-1mir30agga, column 7; pshVP2/3-1mir30ahsp, column 8;
untransfected. Columns 1 and 3-7 were co- transfected with 1 µg of pEGFP-NP. B. Column 1; pshNS
control, column 2; pEGFP-NP alone: column 3; pshGFP control, column 4; pshVP2/3-3-OL, column
5; pshVP2/3-3mir17, column 6; pshVP2/3-3mir30agga, column 7; pshVP2/3-3mir30ahsp, column 8;
untransfected. Columns 1 and 3-7 were co- transfected with 1 µg of pEGFP-NP. Cells were then
assayed by flow cytometry and analysed in Microsoft Excel. Values are shown as percentages of the
non-silencing control shRNA (shNS), as the mean of three separate experiments in duplicate ±
standard deviation.
A
B
0
20
40
60
80
100
120
pshN
S
pGFP-C
AV
pshG
FP
pshV
P2/3-3
-OL
pshV
P2/3-3
-mir1
7
pshV
P2/3
-3-m
ir30a
gga
pshV
P2/3
-3-m
ir30a
hsp
Untra
nsfe
cted
% p
shN
S M
ean
Flo
ures
cenc
e
020
4060
80
100120
pshN
S
pGFP-C
AV
pshG
FP
pshV
P2/3-3
-OL
pshV
P2/3-
3-m
ir17
pshV
P2/3
-3-m
ir30a
gga
pshV
P2/3-3
-mir3
0ahs
p
Untran
sfecte
d
% p
shN
S M
ean
Flo
ures
cenc
e
Page 62
- 109 -
Figure 2.13 Schematic representation of vectors. (A) Schematic representation of the linearised CAV
genome. Sequences encoding open reading frames for the three known CAV proteins are indicated.
The transcriptional start site, is indicated by an arrow and +1. The location of the promoter/enhancer
repeat region is shown by two arrow heads. Location of the CAV targeting shRNAs are indicated by
short lines. Not to scale. The region of the CAV genome included in the fusion plasmid is shown. (B)
Schematic representation of the shRNA expression vectors. One vector contains either the ChU6#4 or
ChU6#1 promoter. (C) Schematic representation of pCAV-MW vector.
ChU6#4/1
GFP-CAV fusion vector and location of shRNAs
GFP CAV
Single shRNA expression vector
A
B
C
CMV AAAAAA
Multiple shRNA expression vector
ChU6#4 ChU6# ChU6#1 PolII term PolII term PolII term
PolII term
VP1 VP3
VP2
5’ 3’
+1 PstI BamHI
shVP2/3-1
shVP1-2
shVP2/3-2 shVP2/3-3
shVP1/2
shVP1-1
shVP2/3-1 shVP2/3-3 shVP1-2
sense
loop Anti-sense
Page 63
- 110 -
Figure 2.14. shRNAs targeting the CAV genome silence the GFP-CAV fusion mRNA in DF1 cells.
DF1 cells were co-transfected with 1µg of pEGFP-CAV and 1µg of the relevant shRNA vector for
4hrs. Except for the untransfected which had no DNA and the GFP-CAV alone which had 1µg of the
GFP-CAV vector. Media containing the transfection agent was replaced with normal growth media
and the cells incubated for a further 68hrs. Cells were then assayed by flow cytometry and analysed in
microsoft excel. shRNAs appear in order from 5’ end of the CAV mRNA. Values are shown as
percentages of the negative control shRNA (shNS), as the mean of three replicates ± standard
deviation.
0
20
40
60
80
100
120
Untans
fecte
d
GFP-CAV
GC + sh
GFP cluc
k
GC + sh
NS
GC + sh
VP2/3-1
GC + sh
VP2/3-2
GC + sh
VP2/3-3
GC + sh
VP1/2
GC + sh
VP1-1
GC + sh
VP1-2
% s
hNS
GF
P fl
oure
scen
ce
Page 64
- 111 -
Figure 2.15. Expression of multiple shRNAs targeting the CAV genome from a single plasmid silence
the GFP-CAV fusion mRNA in DF1 cells. DF1 cells were co-transfected with 1µg of pEGFP-CAV
and 1µg of the relevant shRNA vector for 4hrs.Except for the untransfected which had no DNA and
the GFP-CAV alone which had 1µg of the GFP-CAV vector. Media containing the transfection agent
was replaced with normal growth media and the cells incubated for a further 68hrs or 92hrs. Cells
were then assayed by flow cytometry and analysed in microsoft excel. The individual shRNA run are
the ones present in the MW. Values are shown as percentages of the negative control shRNA (shNS),
as the mean of three replicates ± standard deviation.
0
20
40
60
80
100
120
Untans
fecte
d
GFP-CAV
shNS
shVP2/
3-1
shVP2/
3-3
shVP1-
2
CAV-shM
W
% s
hNS
GF
P fl
uore
scen
ce
Page 65
- 112 -
Transfection Day 2 - Fluorescent microscope
DAPI
GFP
Untransfected pEGFP-N1 shNS shGFP
A
Transfection Day 4 - Fluorescent microscope
DAPI
GFP
Untransfected GFP alone
shNS
shGFP
B
Page 66
- 113 -
Figure 2.16. MSB-1 cells have the RNA silencing pathway. MDCC-MSB1 cells were electroporated
with 10µg pEGFP-N1 alone or with 5µg pEGFP-N1 and 5µg of the relevant shRNA and incubated for
48hrs. (A) An aliquot of cells were taken, spun and resuspended in PBS with DAPI, then allowed to
settle onto a microscope slide, images were taken by a fluorescent microscope. The remainder was
incubated for a further 24hrs (B) An aliquot of cells were taken, spun and resuspended in PBS with
DAPI, then allowed to settle onto a microscope slide, images were taken by a fluorescent microscope.
(C) 1x10⁶ cells were removed, washed twice with FACS wash and then analysed for GFP by flow
cytometry. Mean fluorescent intensity were obtained and analysed by microsoft excel. Values are
shown as percentages of the negative control shRNA (shNS).
C
0
20
40
60
80
100
120
140
160
Untransfected pEGFP-N1 shNS shGFP
% s
hN
S M
ean
GF
P F
lour
esce
nce
48hrs
96hrs
Page 67
- 114 -
Figure 2.17. An example of GFP detection and staining for CAV VP3 by FACS. MDCC-MSB1 cells
were electroporated with 10µg of each of the relevant vectors and incubated for 4hrs. 1x10⁶ cells were
then infected for 1hr with CAV269/7 at an MOI of 2. Cells were added to growth media and incubated
for 72 or 96hrs. 1x10⁶ cells were then fixed, stained for CAV VP3 using anti-VP3 and anti-mouse
APC and detected by flow cytometry. Cell quest was used to analyse the results. Cells in the lower left
quarter of the dot plot are negative for both GFP and virus. The upper left quarter contains CAV
infected cells, the lower right quarter contains just GFP transfected cells and the upper right contains
CAV VP3 positive and GFP positive cells. Cells in the right half of the dot plot were gated and the
GFP transfected
GFP & shIrr
GFP & shCAV
VP3 Relative fluorescence intensity
49
21
37
19
Relative cell number
Page 68
- 115 -
APC histogram analysed for mean fluorescence. A decrease in mean fluorescence indicates less virus
present.
Page 69
- 116 -
Figure 2.18. shRNAs targeting the CAV genome can inhibit expression of CAV VP3. MDCC-
MSB1 cells were electroporated with 10µg of each of the relevant vectors and incubated for 4hrs.
1x10⁶ cells were then infected for 1hr with CAV269/7 at an MOI of 2. Cells were added to growth
media and incubated for 72 or 96hrs. 1x10⁶ cells were then fixed, stained for CAV VP3 using anti-
VP3 and anti-mouse APC and detected by flow cytometry. Cell quest was used to obtain the results.
The mean APC fluorescent intensity of GFP positive cells was then analysed in microsoft excel.
Values are shown as percentages of the negative control shRNA (shNS), as the mean of three
replicates ± standard error of the mean.
0
20
40
60
80
100
120
140
Uninfected pEGFP-CAV
shNS shVP2/3-1 shVP2/3-3 shVP1-2 CAV-shMW
%sh
NS
AP
C fl
oure
scen
ce o
f GF
P+
ve c
ells
72hrs
96hrs
Page 70
- 117 -
Figure 2.19. RNAi silencing of chicken DMRT1 and Myostatin in Embryonic Fibroblast cells.
Flow cytometry results for gene knockdown in DF1 cells is shown. DMRT1-shRNA expression
constructs co-transfected with pEGFP-DMRT1 is indicated on the x-axis. DMRT1 knockdown was
measured as percent mean fluorescence intensity (% MFI), normalised to the average MFI of the non-
silencing control (NSsh) construct (100%). Error bars represent the standard error of the mean
calculated from three independent experiments.
Myostatin
0.00
20.00
40.00
60.00
80.00
100.00
120.00
140.00
160.00
Cells Myo Myo+NSsh Myo+13sh Myo+438sh Myo+930sh Myo+1068sh
Constructs (co-transfection)
% E G F P
DMRT1 shRNA screen
0.00
20.00
40.00
60.00
80.00
100.00
120.00
Cells DMRT DMRT+NSsh DMRT+208sh DMRT+343sh DMRT+568sh DMRT+694sh
Constructs (co-transfection)
% E
GF
P
Page 72
- 119 -
Figure 2.20. In ovo RCAS delivery of EGFP to chicken embryos. Day 4 embryos were injected with
virus and incubated until Day 10. Embryos were then removed from the shell and examined for
expression of EGFP with fluorescence microscopy.
Page 73
- 120 -
Figure 2.21 In ovo DMRT1 knockdown using RCAS-DMRT1shRNA
Knockdown of DMRT1 mRNA was achieved by in ovo administration of RCAS-DMRT1shRNA intra
venously at embryonic day 4 (E4). Genetic male gonads were isolated at E10 and pooled into two
groups (pool 1 and pool 2) as indicated. Gene expression of DMRT1 in the gonads of RCAS-
DMRT1shRNA treated embryos was quantified relative to that of male gonads isolated from RCAS-
NSshRNA (non-silencing control) infected chick embryos.
In ovo DMRT1 knockdown
0
0.2
0.4
0.6
0.8
1
1.2
RCAS-NSshRNA RCAS-DMRT1shRNA (Pool 1)
RCAS-DMRT1shRNA (Pool 2)
Rel
ativ
e ge
ne e
xpre
ssio
n
Page 74
- 121 -
Figure 2.22 Detection of RCAS expressed DMRT1 shRNAs
An RNase protection assay was performed to detect DMRT1 shRNA expression on small RNAs
isolated from (1) Genetic male gonads taken from RCAS-DMRT1shRNA infected chicks at
embryonic day 10 (E10), (2) Genetic male gonads taken from uninfected chicks at E10, and (5)
RCAS-DMRT1shRNA infected DF1 cell culture. Size standards are indicated (M). +/- RNAse
controls are shown in lanes 3 and 4 respectively.
Page 76
- 123 -
Figure 2.23 Feminisation of embryonic male (ZZ) chicken gonads following knockdown of DMRT1.
Longitudinalhistological sections of gonads from day 10 chicken embryos treated at day 0 with
scrambled control miRNA or DMRT1 miRNA563. This figure shows gonadal histology from embryos
showing high GFP expression, and hence miRNA delivery. a, Left gonad from a control female (ZW)
treated with scrambled miRNA, showing normal ovarian development (a thickened cortex and
vacuolated medulla.) b, Smaller right gonad of a control female, showing a highly vacuolated medulla
and no cortex. c, Right testis of a control male, showing seminiferous cords in the medulla and
reduced surface epithelium. d, left testis of a control male. e, High magnification view of the boxed
region in d, showing well defined seminiferous cords in control male testis (arrows). f, Feminised
gonads of a male embryo (ZZ) treated with DMRT1 knockdown virus miRNA563, showing a large
ovarian-shaped left (L) and smaller right (R) gonads. g, High magnification view of the right gonad,
showing medullary germ cells but poorly organised cords (compare to e above). H, High
Page 77
- 124 -
magnification view of the left gonad, showing a vacuolated medulla (arrows) and thickened female-
like cortex containing numerous germ cells (arrowheads). No seminiferous cords are apparent.
Page 78
- 125 -
Figure 2.24 Feminisation of genetic male (ZZ) chicken embryos following knockdown of DMRT1.
a, Normal expression of DMRT1 protein in a 10 day old genetic male gonad (ZZ) treated with non-
silencing scrambled control sequence. DMRT1 is strongly expressed in the Sertoli and germ cells of
the organising testis cords throughout the gonad (e.g., arrow). A longitudinal section is shown. b,
Significant reduction of DMRT1 protein in the left gonad of a feminised male (ZZ), treated with
DMRT1 knockdown shRNA343. Some residual DMRT1 protein is present in germ cells (e.g, arrow).
Longitudinal section. d, DMRT1 mRNA expression in control and knockdown gonads (quantitative
RT-PCR). Both male and female gonads treated with knockdown constructs (pooled miRNA563 and
Page 79
- 126 -
shRNA343) show significantly reduced DMRT1 expression (mean +/- SEM; *** p< 0.0001 ; ** p <
0.0025; n =3.
Figure 2.25 Ectopic expression of female markers in embryonic male gonads following DMRT1
knockdown. Immunofluorescence and quantitative RT-PCR. L = left gonad; R = right gonad. a,
Strong bilateral expression of aromatase protein in control female gonads treated with miRNA. b, No
aromatase expression in control male gonads treated with scrambled miRNA. c, Ectopic aromatase
expression in both male gonads following treatment with DMRT1 shRNA343. Note the female-like
size asymmetry between the left and right gonads.
Page 80
- 127 -
Figure 2.26 cDNA was then used to quantify relative DMRT1 gene expression levels in the pooled
male and female gonad samples from each treatment group. Quantitative RT-PCR analysis confirmed
that DMRT1 mRNA expression was specifically reduced in all pooled groups of male embryos when
compare to control Group 1. Almost 40% of DMRT1 gene expression knockdown was observed for
Group 3 male embryos treated with the DMRT1-343-siRNA. It is interesting to note that Group 3 was
also the group that resulted in the greatest degree of observed feminisation of male gonads at the
macroscopic level.
qPCR analysis of DMRT1 gene expression
0
20
40
60
80
100
Contro
l (M)
I.V. 1
00 (M
)
I.V. 2
00 (M
)
Amnio
n 100
(M)
Amnio
n 200
(M)
Contro
l (F)
I.V. 1
00 (F
)
I.V. 2
00 (F
)
Amnio
n 100
(F)
Amnio
n 200
(F)
siRNA delivery route and dose
% le
vel o
f gen
e ex
pres
sion