CHAPTER 2 Energy Sources Omer C. Onar Power Electronics and Electric Machinery Group, National Transportation Research Center, Oak Ridge National Laboratory, Oak Ridge, TN, USA Alireza Khaligh Electrical and Computer Engineering Department, University of Maryland at College Park, College Park, MD, USA Abstract In today’s industrialized world, energy became vital to all human activities including manufacturing, data processing, heating, cooling, lighting, transportation, food processing, etc., yet it is invisible for most of us. Today’s energy generation technologies are undergoing a paradigm shift; the solution to our current dilemma requires more renewable contribution as well as the more efficient utilization of conventional energy sources. Recognizing this importance, this chapter focuses on energy sources and energy generation technologies including, coal, hydroelectric, nuclear, solar, wind, ocean, and several others. Alternative energy technologies received great interest in recent years due to environmental impact, greenhouse gas emissions, national energy security, and increasing cost of fossil fuel‑based sources. With particular emphasis on renewable and alternative energy systems, characteristic features of the renewable energy sources have been reviewed. Since power electronics is a key enabling technology for renewable energy utilization, power electronic converters and interfaces that are used for grid interconnection and stand‑alone operation have been presented. Keywords Energy sources Coal Nuclear Hydroelectric Solar Wind Ocean Power electronics for renewables Inverters DC/DC converters Rectifiers CHAPTER OUTLINE 2.1 Introduction 82 2.2 Available Energy Sources 89 2.2.1 Coal 89 PREV Chapter 1: Power … ⏮ NEXT Chapter 3: Photov… ⏭ Alternative Energy in Power Electronics Recent Topics Tutorials Highlights Settings Feedback(http://community.safa Sign Out Settings 9 days left in your trial. Subscribe. Feedback(http://community.safaribookso Sign Out ⚙
Transcript
C H A P T E R 2
Energy SourcesOmer C. Onar Power Electronics and Electric Machinery Group, National Transportation
Research Center, Oak Ridge National Laboratory, Oak Ridge, TN, USA
Alireza Khaligh Electrical and Computer Engineering Department, University of Maryland
at College Park, College Park, MD, USA
Abstract
In today’s industrialized world, energy became vital to all humanactivities including manufacturing, data processing, heating, cooling,lighting, transportation, food processing, etc., yet it is invisible for most ofus. Today’s energy generation technologies are undergoing a paradigmshift; the solution to our current dilemma requires more renewablecontribution as well as the more efficient utilization of conventionalenergy sources. Recognizing this importance, this chapter focuses onenergy sources and energy generation technologies including, coal,hydroelectric, nuclear, solar, wind, ocean, and several others. Alternativeenergy technologies received great interest in recent years due toenvironmental impact, greenhouse gas emissions, national energysecurity, and increasing cost of fossil fuel‑based sources. With particularemphasis on renewable and alternative energy systems, characteristicfeatures of the renewable energy sources have been reviewed. Sincepower electronics is a key enabling technology for renewable energyutilization, power electronic converters and interfaces that are used forgrid interconnection and stand‑alone operation have been presented.
2.3.3.7 Maximum Power Point Tracking Techniques 104
2.3.3.8 Power Electronic Interfaces for PV Systems 107
2.3.4 Wind Turbines and Wind Energy Conversion Systems 111
2.3.4.1 Wind Turbine Power 113
2.3.4.2 Different Electrical Machines in Wind Turbines 115
2.3.4.3 Energy Storage Applications for Wind Turbines 120
2.3.5 Ocean Energy Harvesting 122
2.3.5.1 Ocean Wave Energy 122
2.3.5.2 Ocean Tidal Energy 129
2.3.5.3 Power Electronic Interfaces for Ocean Energy HarvestingApplications 131
2.3.6 Geothermal Energy Systems 133
2.3.7 Nuclear Power Plants 136
2.3.8 Fuel Cell Power Plants 138
2.4 Other Unconventional Energy Sources and GenerationTechnologies 142
Summary 142
References 143
2.1 IntroductionIn modern societies, development level and economic wellbeing of asociety are directly measured by energy generation and consumption.Energy plays an important role on the economic health of a country that isreflected by the gross national product (GNP). The per capita GNP of acountry is correlated to the per capita energy consumption. There is asteady demand to increase the energy generation capacity in all over theworld since the global energy consumption is rising. The main reasons arethe technological developments, industrial revolution, introduction ofnew loads and appliances, and increase in population. In a modern andindustrialized community, energy is used in every single human activity.Some major examples are;
– Household applications: such as heating, cooking, lighting, waterheating, and air conditioning.
– Transportation: passenger cars, busses, trains, trucks, ships, and
aircrafts.
– Manufacturing heat and electricity as well as userend or industrialproducts.
– Irrigation and fertilizing in agriculture.
The worldwide energy consumption has been growing steadily and rapidlyright after the industrial revolution. Today's global energy consumptionhas reached to more than 532 EJ (Exajoule, 1 EJ = 10 Joule = 277.778TWh, Terawatthours). This amount of energy is consumed with anhourly rate of 16.87 TWh [1]. In other worlds, in the world, 16.87 TWh ofenergy is consumed hourly. Hourly global energy consumption in 1900was ~ 0.7 TWh. From 1973 to 2010, the global annual energyconsumption increased by more than two folds; from 255.687 EJ (6.107Gtoe, Gigatons of oil equivalent) to more than 532 EJ (12.717 Gtoe).
United States is the second largest energy consumer in the world, afterChina surpassed United States as top energy consumer. United Statesranks seventh in energy consumption per capita. The amount of energyconsumed in United States was 91.8 EJoule or 25,500 TWh in 2014, withequivalent hourly rate of 2.91 TW [2,3]. If the hourly consumed power is2.91 TW, 1 year of consumption corresponds to 25,500 TWh, by 2.91 TW× 24 h × 365 days. The energy consumption in the United States reducedby 4.7% as compared to the consumption levels of 2004. This is mostlydue to the advanced manufacturing technologies, more efficient buildingmaterials and technologies, and the 2009 economic crises.
Between 1980 and 2006, the worldwide energy consumption annualgrowth rate was 2%. The total energy consumption in 2012 for the UnitedStates is given in Table 2.1 according to the US Energy InformationAdministration [4]. According to the table,
Table 2.1
Total Energy Consumption
SourceTotal Consumed Energy (quadrillionBtu)
Percentage
Oil 35.87 37.75
Gas 26.20 27.57
Coal 17.34 18.25
Nuclear 8.05 8.47
Hydropower 2.67 2.82
Biomass 2.53 2.66
Renewables 1.97 2.07
Other 0.39 0.41
Total 95.02 quadrillion Btu = 27,847.61 TWh = 100.25 EJ
Wind, PV, solar thermal, grid‑connected electricity from landfill gas andbiowaste.
Nonbiogenic waste, liquid hydrogen, methanol, some domestic inputs to therefineries.
This total consumption is shared among several sectors. Around 10.97%of this 95.02 Btu is consumed by residential sector including lighting,heating, airconditioning, and household appliances. 8.72% is consumedby the commercial sector including heating, cooling, lighting, and officeequipment. Industrial sector, covering manufacturing, construction, andagriculture, consumes about 24.87% of the total energy. By 28.12%,transportation is the most energy consuming sector, including lightdutyvehicles, commercial light trucks and larger freight trucks, and air and railtransportation. The electricity deliveryrelated losses count for 27.32% ofthe total energy consumed, attributed to all residential, commercial,industrial, and transportation sectors [4]. This deliveryrelated lossamount includes the transmission and distribution losses.
The overall energy consumption percentages by sector are shown in Fig.2.1.
18
a
b
a
b
Enjoy Safari? Subscribe Today
You have 9 daysleft in your trial,
Abogdan.Safari is your trusted guide for building aremarkable career. We hope you've been
FIGURE 2.1 Percentage share of sectors onenergy consumption.
According to Fig. 2.1, electricity deliveryrelated losses are considerablyhigh. Almost every 1/3 of the generated energy is lost in electricitygeneration and delivery. This is due to the fact that efficiency of a typicalpower plant is around 38% [5]. Figure 2.1 clearly reveals that more than aquarter of the produced energy is lost in low efficient conventional energyconversion systems and transmission lines. This issue encourages theincreased focus on high efficiency renewable energy systems, which mayalso eliminate or reduce the transmission and/or distribution losses ifthey are built as localized energy generation units. As compared to theefficiency of conventional power plants, new generation of power plantsusing gas turbines or microturbines may reach a substantially higherefficiency of 55%; however, they still rely on another fossil fuel which isnatural gas [6].
After the invention of steam engines, coal began to be the main source ofenergy for the eighteenth and nineteenth centuries. Since the automobileswere invented and electricity usage became more common, coal left itspopularity to the oil during the twentieth century. From 1920s to 1973, oilwas the main resource fueling the industry and transportation and itsprice steadily dropped during these years. Oil kept its expansiveness till1970s. In the oil crises of 1973 and 1979, price per barrel boosted from 5to 45 dollars and oil was not the best and most common source of energyproduction anymore [7]. From these dates, coal and nuclear became themajor sources for electric power generation. In those years, energyconversation and increasing the energy efficiency gained importance.However, the use of fossil fuels has continued over the past 30 years andtheir contribution to overall energy production has increased. During pastdecade, coal has become the fastest growing fossil fuel, since it has largeremaining reserves [7]. On the other hand, renewable energy sources havegained interest due to the depletion of fossil fuels, increased oil prices,national energy security, and climate change concerns related to thecarbon emissions. Therefore, government support on development,deployment, incentives, and commercialization of renewable energies areever increasing. For instance, in March 2007, it is agreed by the EuropeanUnion members that at least 20% of their nations' energy should beproduced from renewable sources by 2020 while United States also has anational renewable energy target of 20%. In Canada, there are nineprovincial renewable energy targets although there is no national targetthat has been set yet. This is also a part of environmental concerns such asglobal warming [8] and building a sustainable energy economy byreducing the nations' dependence on imported fossil fuels. However,although there is a large availability of renewable sources, theircontribution to globally consumed energy is relatively poor.
In developed countries, such as Germany and Japan, gross nationalproduct is 6 kW per person and 11.4 kW per person in the United States.Bangladesh has a relatively lower consumption with 0.2 kW per personwhile it is around 0.7 kW per person for a developing country such asIndia. 25% of overall world's energy is consumed by the United Stateswhile its share of global energy generation is 22% [1]. Energyconsumption in United States is shared by four broad sectors according tothe US Department of Energy and the Energy InformationAdministration. Accordingly, the largest user is the transportation sector,currently consuming 28.12% of the total energy. Next largest amount ofenergy is consumed for industry followed by residential and commercialusers. Energy consumption shares of United States for four major energyconsumption sectors (industrial, transportation, residential, andcommercial) are demonstrated in Table 2.2 [4,9,10].
Table 2.2
US Nation‑Wide Energy Consumption Sectors
Sector Major Use Shares
Transportation: Transportation accounts for the28.12% of the total energy consumption. Thisenergy is shared among light‑duty vehicles,trucks including commercial light trucks andfreight trucks, passenger and freight rail,shipping, and air. “Other” converse military,boats, busses, lubricants, and pipeline fuel
Industrial: This sector mainly consumes 24.87% oftotal energy for the manufacturing, producing,and processing goods such as chemicalrefining, metal production, paper, and cementproduction and several other industrialprocesses
Residential: This sector consumes the 10.97% oftotal energy for household power requirements
Commercial: This sector includes the business,government, and other service providinginstitutions, facilities, and their equipmentscorresponding to 17% of total energyconsumption
Most of the electric power generation of the United States is provided byconventional thermal power plants. Most of these power plants areoperated by coal. However, from 1990 to 2000, the number of natural gasor other types of gasoperated power plants were increased significantly.270 GW of new gasoperated thermoelectric power plants were built inUnited States from 1992 to 2005. Only 14 GW of capacity belonged to newnuclear and coalfired power plants, with 2.315 GW of this amount beingnuclear while the remaining is the coalfired power plants [11]. Thesignificant shift to the gasoperated power plants is due to thederegulation, political, and economic factors; however, nuclear and coalare considerably capital intensive. On the other hand, there is a greatpotential for renewable energies in the United States. For instance, USwind power capacity is close to 20 GW, which is sufficient to supply powerto 4.5 million typical households [12]. Although there is a greatavailability of the solar power, solar power percentage of total capacity isabout 0.11% retrieved by plants that are currently in operation; includingthe new Nevada Solar One plant with 64 MW capacity and the largestsolar thermal power station in the Mojave Desert with a total generationcapacity of 354 MW, which is the world's largest solar plant [13].
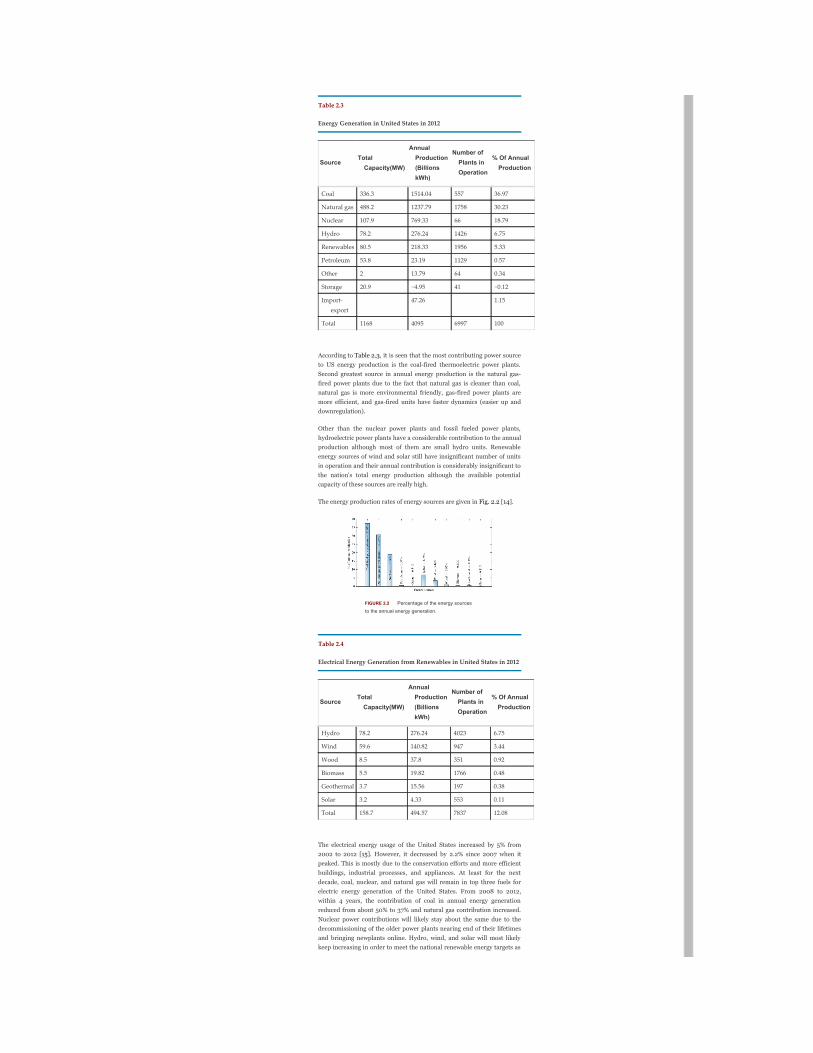
The existing power generation infrastructure in the United States has ageneration capacity of 1.168 GW in total. In 2012, 4047.76 billion kWh ofenergy was generated in the United States. Table 2.3 summarizes the U.S.electric power generation for 2012 in terms of total power capacity (MW),annual production (billion kWh), and number of power plants inoperation [14]. Please note that number of plants refer to the number offacilities and not the number of units; i.e., number of wind farms insteadof number of turbines or number of nuclear power plants instead ofnumber of reactors.
Table 2.3
Energy Generation in United States in 2012
SourceTotalCapacity(MW)
AnnualProduction(BillionskWh)
Number ofPlants inOperation
% Of AnnualProduction
Coal 336.3 1514.04 557 36.97
Natural gas 488.2 1237.79 1758 30.23
Nuclear 107.9 769.33 66 18.79
Hydro 78.2 276.24 1426 6.75
Renewables 80.5 218.33 1956 5.33
Petroleum 53.8 23.19 1129 0.57
Other 2 13.79 64 0.34
Storage 20.9 −4.95 41 −0.12
Import‑export
47.26 1.15
Total 1168 4095 6997 100
According to Table 2.3, it is seen that the most contributing power sourceto US energy production is the coalfired thermoelectric power plants.Second greatest source in annual energy production is the natural gasfired power plants due to the fact that natural gas is cleaner than coal,natural gas is more environmental friendly, gasfired power plants aremore efficient, and gasfired units have faster dynamics (easier up anddownregulation).
Other than the nuclear power plants and fossil fueled power plants,hydroelectric power plants have a considerable contribution to the annualproduction although most of them are small hydro units. Renewableenergy sources of wind and solar still have insignificant number of unitsin operation and their annual contribution is considerably insignificant tothe nation's total energy production although the available potentialcapacity of these sources are really high.
The energy production rates of energy sources are given in Fig. 2.2 [14].
FIGURE 2.2 Percentage of the energy sourcesto the annual energy generation.
Table 2.4
Electrical Energy Generation from Renewables in United States in 2012
SourceTotalCapacity(MW)
AnnualProduction(BillionskWh)
Number ofPlants inOperation
% Of AnnualProduction
Hydro 78.2 276.24 4023 6.75
Wind 59.6 140.82 947 3.44
Wood 8.5 37.8 351 0.92
Biomass 5.5 19.82 1766 0.48
Geothermal 3.7 15.56 197 0.38
Solar 3.2 4.33 553 0.11
Total 158.7 494.57 7837 12.08
The electrical energy usage of the United States increased by 5% from2002 to 2012 [15]. However, it decreased by 2.2% since 2007 when itpeaked. This is mostly due to the conservation efforts and more efficientbuildings, industrial processes, and appliances. At least for the nextdecade, coal, nuclear, and natural gas will remain in top three fuels forelectric energy generation of the United States. From 2008 to 2012,within 4 years, the contribution of coal in annual energy generationreduced from about 50% to 37% and natural gas contribution increased.Nuclear power contributions will likely stay about the same due to thedecommissioning of the older power plants nearing end of their lifetimesand bringing newplants online. Hydro, wind, and solar will most likelykeep increasing in order to meet the national renewable energy targets as
well as the targets set by states. The environmental concerns on globalwarming and sustainability along with the political considerations on thesupplies' security will shift the overall energy consumption away from theimported fuels. Nowadays, many researchers and politicians call forimmediate actions for longterm sustainable energy solutions. Based on agrowing consensus, peak oil may be reached in the near future and thiswill result in severe oil price increases [16]. If a longterm solutionscannot be developed prior to the peak oil scenario, the world economymay face a grinding halt.
This chapter focuses on naturally available energy sources and deals withthe efficient utilization of these sources. Moreover, renewable andsustainable energy generation techniques are discussed in this chapter. Inaddition, the operating principles, efficient utilization, and gridconnection issues as well as power electronic interfaces for theserenewable energy sources are demonstrated. While inventing newmethodologies to maximize the efficient usage of traditional sources suchas coal, oil, and natural gas, it is of great importance to develop newtechnologies to produce emerging sources of energy from renewables.
Consequently, by efficient use of conventional energy sources andutilizing alternate sources of energy, the reserves of the conventionalenergy resources can last for longer, global warming can be slowed down,and environmental pollution can be reduced [17].
2.2 Available energy sourcesPrimary sources of energy are fossil fuels such as oil, natural gas, coal, andother sources such as nuclear, solar, wind, hydroelectricity, or potentialsources available in oceans. The energy that has not been converted ortransformed into another form is known as primary energy source. Moreconvenient form of energy such as electrical energy is obtained bytransforming primary energies in energy conversion processes. Theseconverted forms are called as secondary energy sources.
2.2.1 Coal
Coal is the most abundant fossil fuel of the world with around 948 billionshort tons of reserves. It is expected to sustain for the next 150 years atthe current production rate [4]. Coal is the fastest growing fossil fuel tomeet the energy demand of the global community. However, coal is thedirtiest energy source with numerous pollutants and high emissions [11].The United States has the largest estimated and proven recoverablereserves of coal of the world. More than 81% of the coal in United Stateswas used in power plants to generate electric power.
2.2.2 Oil
It is estimated that there is 57 ZJ of oil reserves on Earth. This amountincludes the available but not necessarily recoverable reserves. Otherestimates vary from 8 ZJ including currently proven and recoverablereserves to a maximum of 110 ZJ including nonrecoverable reserves [18].World's current oil consumption is 85 million barrels per day (mbd) andit is estimated that the peak consumption will be 93 mbd in 2020. Oil andits chemical derivatives are mainly used for transportation and electricpower generation. The total reserves are estimated to be 1,481,526 millionbarrels. If the current demand would remain static, then the remaining oilsupplies would last for about 120 years.
2.2.3 Natural gas
It is estimated that there are 850 trillion cubic meters of estimatedremaining recoverable reserves of natural gas. According to the U.S.Energy Information Administration, there are 5,977,000 millions of cubicmeter natural gas reserves in the United States [19]. Natural gas hasbecome one of the major sources of electric power generation through thesteam turbines and gas turbines due to their higher efficiency. Natural gasis cleaner than any other fossil fuels and produces fewer pollutants pergenerated unit energy. Burning natural gas produces about 30% lesscarbon dioxide than burning petroleum and about 45% less than burningcoal for an equivalent amount of heat [20]. Some of the natural gas powerplants are operated in combined cycle mode to obtain higher efficiencies.In this operation, gas turbines are combined with the steam turbines inorder to get the benefit of waste heat using steam turbines.
2.2.4 Hydropower
Hydroelectric power plants supplies about 16.4% of the world's electricannually [21] and is expected to grow more than 3% every year for thenext 25 years. The hydroelectric power may not be a longterm effectivesolution, since, most of the potential sites are already in use or they arenot feasible to be exploited due to environmental and economicalconcerns. In addition, the life span of hydroelectric power plants islimited, due to the soil erosion and accumulation. Because of theseconcerns, the construction of large hydroelectric power plants hasstagnated. The new trend in all over the world has been building smallerhydro power units called as “microhydro” since they can be as a part ofdistributed generation, opening up many locations for power generationand they have less or negligible environmental effects [22,23]. On theother hand, hydroelectric power plants have no emissions since no fuel isburnt. Hence, hydropower is a clean energy source in compare to fossilfuelbased energy sources. In 2010, the worldwide hydroelectric energygeneration reached to 3427 TWh.
2.2.5 Nuclear power
Nuclear power plants provided about 5.7% of the world's energy andcontributed to the world's electric power generation by 13% in 2012[14,24,25]. Total power capacity of the established nuclear power plantswere about 372 GW by November 2007 [24]. The remaining uraniumresources are estimated to be 2500 ZJ by the International Atomic EnergyAgency [26]. Since there is plenty of available sources and developedtechnology, the contribution of nuclear power to the future's energydemand is not limited. However, there are political and environmentalconstraints, which restrict the growth of nuclear power plants. The cost ofgenerating nuclear power is approximately equal to that of the coal power.Moreover, nuclear power has zero pollutant emissions such as CO, CO ,NO, and SO .
2.2.6 Solar
Earth receives around 174,000 TW of solar energy resource per year. Asan energy source, less than 0.02% of available solar resources are capableof entirely replacing all nuclear power and fossil fuels [27,28]. Although itis still expensive in compare to conventional energy conversiontechniques, the fastest growing energy source in 2007 were gridconnected photovoltaic systems. The total installed capacity reached to8.7 GW by increasing all photovoltaic installations by 83% in 2007 [29].In the United States, from 2013 to 2014, the total power of all installationsincreased from 930 to 2106 MW. High cost of manufacturing solar cells,reliance on weather conditions, storage, and gridconnection problemsare the major barriers of further development of solar generation. On theother hand, efficiency of solar photovoltaic cells continuously increaseswith the developments in material science and technologies. Nowadays,research level solar photovoltaics have reached to about 40% ofefficiencies.
2.2.7 Wind
Wind is one of the greatest available potential energy sources. Theavailable wind power is estimated to be 300 TW [30] to 870 TW [31].Only 5% of the available energy is capable of supplying the currentworldwide energy demands. However, due to the fewer obstacles, most ofthis wind energy is available on the open oceans on which construction ofwind turbines and energy transmission is relatively difficult andexpensive. From 2006 to 2007, the installed wind turbines' capacity wasincreased by 27% to total of 94 GW according to the Global Wind EnergyCouncil [32]. However, the actual generated power is less than thenominal capacity since the nominal capacity represents the peak outputand actual output is around 40% of the nominal capacity due to efficiencyissues and lower wind speeds [33]. In 2010, wind energy productionexceeded 2.5% of the world electric energy generation and it grows about25% per year.
2.2.8 Ocean
Energy of ocean can be categorized in three major methods; ocean wavepower, ocean tidal power, and ocean thermal power. All of these threemethods can be installed as onshore or offshore applications. It isestimated that theoretical potential is equivalent to 418 million tons of oilequivalent.
Wave energy harvesting is a concept that the kinetic energy of waves ofthe deep water or waves hitting the shores is captured and converted toelectrical energy. The kinetic energy of waves is converted to electricalenergy using several different methods. It is estimated that the deep waterwave power resources vary from 1 to 10 TW [34], while the total power ofthe waves hitting the shores may add an additional power of 3 TW [30].Capturing this entire amount of power is not practical and feasible. It isestimated that 2 TW of this power can be usefully captured [35,36].
Ocean tides occur due to the tidal forces of the moon and the sun, incombination with the Earth's rotation. Tidal power has a great potentialfor future energy generation since it is cleaner in compare to fossil fuelsand it is more predictable in compare to other renewable energies such aswind and solar. The kinetic energy of the moving water can be captured bytidal stream or tidal current turbines. Alternatively, the barrages can beused to capture the potential energy created due to the height differencebetween the low and high tides. Various methods can be employed for therealization of these concepts. The total estimated tidal power potential is3.7 TW [37]. However, only around 0.8 TW of this amount is availabledue to the dissipation of tidal fluctuations. The amount of energygenerated from ocean tides was 0.3 GW at the end of 2005 [38], which ismuch less than the available potential.
The other way of generating power from the oceans is the ocean thermalenergy conversion (OTEC). In this method, the temperature differencebetween the warm shallow water and the cold deep water is used to drivea heat engine, which in turn drives an electric generator [39]. Theefficiency of OTEC power plants is relatively low [39,40] due to the powerrequirements of the auxiliary OTEC devices such as water intake anddischarge pumps. Moreover, this technique is expensive since theefficiency is low and greater capacities of installations are required toproduce reasonable amounts of energy [41].
2.2.9 Hydrogen
Hydrogen is an energy carrier [42,43], in other words it is an intermediatemedium for energy storage and carriage. Hydrogen is the most abundantelement of the Earth (approximately corresponding 75% of the elementalmass of the universe) [44] and it is the simplest and lightest element of all
2
2
chemical elements with an atomic number of 1. Hydrogen exists in naturein combination with other elements such as carbon and nitrogen in fossilfuels, biological materials, or with oxygen in water [45]. Hydrogen can becombusted in air or it can react with oxygen using fuel cells to produceenergy. The resultant combustion energy or electrical energy does notcause any CO or CO emissions. However, splitting hydrogen from thecombination of other elements requires additional energy. The mainsource of global hydrogen production is natural gas (48%). Other sourcesof hydrogen production are oil (30%), coal (18%), and water electrolysis(4%) [46]. Currently, most of the hydrogen is produced from gasderivatives such as natural gas, ethane, methane, ethanol, or methanol.Hydrogen production from fossil fuels, known as reformation, containsseveral pollutant emissions. Although electrolysis is clean, this methodhas various challenges and still has very poor efficiencies and highproduction costs. Biological or fermentative reactions can be anothermethod of hydrogen production; however, this method has someobstacles such as the amount of products are not significant [46,47].Using hydrogen in hydrogen combustion engines is several percents moreefficient than the conventional internal combustion engines. On the otherhand, using hydrogen in the fuel cells is twice or three times moreefficient than that of the internal combustion engines. However, there areseveral challenges for the commercialization of fuel cells such as the size,weight, cost, and durability. Other major technical difficulties related tohydrogen are the production, delivery, and storage issues.
2.2.10 Geothermal
Geothermal energy is the utilization of heat stored in the inner layers ofthe Earth or collecting the absorbed heat derived from underground. Thegeothermal energy production has reached to 37.3 GW at the end of 2005[48]. 9.3 GW of this amount is used for electric power generation whilethe rest of it is used for residential or commercial heating purposes.Enhanced geothermal systems (EGS) is a technique that extends thepotential for the use of geothermal energy. In this technique, the heat isextracted by building subsurface fractures to which water can be addedthrough injection wells. Through this technique, the electrical generationcapacity can reach to about 138 GW [49]. The overall EGS capacity of theworld is calculated to be more than 13 YJ, where 200 ZJ of this amount isextractable. By the technological improvements and investments, thisamount is projected to increase over 2 YJ [50]. However, in contrary tothis enormous potential, geothermal supplies less than 1% of the world'senergy demand as of 2008 [21]. The electricity generation potential isestimated to be from 35 to 2000 GW while the current installed capacityis 10.715 GW with the highest capacity is in the United States by morethan 3 GW. Geothermal energy has high availability (average dailyavailabilities more than 90%) and in fact has no pollutant emissions sinceit does not require any fuel or combustion. Furthermore, geothermalpower stations do not rely on weather conditions. In addition, it isconsidered to be a sustainable source of energy since the extracted heat isrelatively small in compare to the heat reservoir's size. In other words,geothermal heat energy is replenished from deeper layers of the Earth,therefore it is not exhaustible.
2.2.11 Biomass
Biomass is a fuel that is also called biofuel, and the bioenergy is theenergy enclosed in the biomass. Today, biomass has a small contributionto the overall energy supply, although it was the major fuel till thenineteenth century. In 2005, electric power from biomass was about44 GW while more than 230 GW biomass power is used for heating [38].As a sustainable energy source, biomass is a developing industry in manycountries such as Brazil, United States, Germany, and many others. As analternative to the fossil fuels, biomass production is significantlyincreasing worldwide. The biodiesel production increased by 85% to1.03 billion gallons in 2005 and biodiesel became the world's fastestgrowing renewable source of energy. Bioethanol production was alsoincreased by 8% and reached 8.72 billion gallons during 2005 [38]. Eventhough it is commonly believed that biomasses may be carbonneutral,their current farming methods cause substantial carbon emissions[51,52]. As of 2012, there are 351 wood and biomass fired electric powerplants in the United States with a total power generation capacity of8.5 GW and annual production of 37.8 billion kWh.
2.3 Electric energy generation technologiesElectric energy generation is a process that the energy sources or energypotential is converted to the electrical energy. Energy generation can bedone in various techniques. Due to the upcoming emerging challenges inthe global energy supply systems, energy from the conventional sourcesneed to be highly efficient. In addition, there should be an increase inutilization of energy generation from alternative and renewable energysources. In following sections, the energy sources and their conversion toelectric energy are described.
2.3.1 Thermoelectric energy
Thermoelectric power plants are mainly coalfired power stations. In athermoelectric power plant, coal or other fuels are burnt in order to heatup the water in the boiler. In this system, the highpressurized steamrotates a steam turbine, which is coupled to an electric generator. Afterthe steam passes through the turbine, it is cooled and condensed back towater in the condenser. This is known as Rankine Cycle [53]. More than80% thermal power plants in all over the world operate based on thiscycle. In the Rankine Cycle, there are four processes in which the working
2
fluid's state is changed as shown in Fig. 2.3 [54]. These processes can bedescribed as follows [55,56]:
FIGURE 2.3 Rankine Cycle block diagram.
Process 12: When the fluid is condensed and converted to liquid form,the liquid is pumped from low to high pressure. The pumping processrequires a small amount of energy.
Process 23: The high pressure liquid that pumped into the boiler isheated at constant pressure until it becomes saturated dry vapor. Theboiler is energized by a heat source such as a coal furnace.
Process 34: During this process, saturated vapor passes through thesteam turbine. The heat energy is converted to mechanical energy. Whilethe steam passes through the turbine, it may partly get condensed sincethis process decreases the pressure and temperature of the vapor.
Process 41: In this process, the vapor is condensed at a constant pressureand temperature, in a condenser. As a result, wet vapor is converted tosaturated liquid. The cooler helps keeping the temperature constant as thevapor changes its phase from steam to liquid.
These four processes of the Rankine Cycle are shown in Fig. 2.3.
Since coal is the most abundant energy source of the world, coalfiredpower plants have been widely used in electric power generation in allover the world [57]. Coal is a cheap energy source and coalfired powerplants have mature technology. Therefore, the generation cost is less andthermoelectric power plants can be constructed anywhere close to fueland water supply. Although the consumption sites might be relatively faraway from the coal mines or water supplies, fuel and water can betransported to the generation plants. Since the coal has been thebackbone of the electric power industry since late 1800s, approximately49% of the electric power generated in the world is supplied by coalfiredthermoelectric power plants [58]. Today, energy generation from coalcorresponds to about 27% of the world's total energy generation.
In a simple form, the operation of a coalfired power plant can be similarto Rankine Cycle. In this form, the plant consists of a boiler, a steamturbine driving an electric generator, a condenser, and a feedwaterpump. Coal is first pulverized and burnt in the steam generation furnaces.The water in the boiler tubes is heated and steam is generated in this wayat high pressures. The steam generation process is composed of three subprocesses which are economizing, boiling, and superheating. In theeconomizer, the water is heated to a point that it is close to the boilingpoint. Then, the steam is raised in the boiler. Finally, the steam is furtherheated and dried at the superheater. The steam at its final form is thenconveyed to the steam turbine. The mechanical force pushing the turbineblades yields the steam turbine to rotate which in turn drives the electricgenerator producing electricity. The cooler steam with lower pressure isreleased from the turbine. This steam is conveyed to the condenser to beliquefied. This water is pumped back to the steam generator and theclosed loop system is completed [55]. Considering the other auxiliarydevices and peripheral components such as cooling tower, coal conveyor,ash&waste management units, and many others, the schematic of a coalfired thermoelectric power plant can be presented as Fig. 2.4.
FIGURE 2.4 Schematic diagram of thethermoelectric power plant.
The components of the thermoelectric power plant are described in Table2.5.
Table 2.5
Thermoelectric Power Plant Components
1. Coal conveyor 10. Air intake pipe 19. Low pressureturbine
5. Ash hopper 14. High pressure turbine 23. Cooling waterpump
6. Superheater 15. Deaerator 24. Powertransformer
7. Forceddraught fan
16. Intermediate pressureturbine
25. Cooling tower
8. Reheater 17. Precipitator 26. Chimney stack
9. Economizer 18. Boiler feed pump fromcondenser
27. Transmissionnetwork
The operation of the coalfired power plant begins with the coal conveyor.From an exterior stack, coal is conveyed through a coal hopper to thepulverizing fuel mill where it is grounded and converted to a fine powder.The pulverized coal is mixed preheated air. The air is taken by an airintake pipe and pumped to be mixed with pulverized coal. This preheatedair is supplied by the forced draught fan. In the boiler, where the airfuelmixture is ignited at high pressure, generated heat increases thetemperature of the water. The water is then changes its phase to steamwhere it flows vertically up the boiler tubes. This steam is passed to theboiler drum where its remaining water content is separated. This drysteam is then passed through a manifold from the drum into thesuperheater. In the superheater, further pressure and temperatureincreases, steam reaches about 200 bar and 570 °C. The turbine processof the power plant comprises three stages; high pressure turbine,intermediate pressure turbine, and low pressure turbine. First, the steampasses to the high pressure turbine through the pipes. Both the manualturbine control and the automatic setpoint following can be provided bya steam governor valve. The temperature and the pressure of the steamdecrease when it is exhausted from the high pressure turbine. This steamis returned to the boiler reheater for further use. The reheated steampasses to the intermediate pressure turbine. The steam released from theintermediate pressure turbine is passed directly to the low pressureturbine. Now the steam is cooler and just above its boiling point. Thissteam is then condensed in the condenser by contacting thermally withthe cold water tubes of the condenser. As a result, the steam is convertedback into water and the condensation causes a vacuum effect inside thecondenser chest. The condensed water is prewarmed by the feedheaterusing the heat of the steam released from the high pressure turbine andthen in the economizer. Then, this prewarmed water is deaerated andpassed by a feedwater pump, which completes the closed cycle. Thecooling tower cools down the water from the condenser creating anintense and visible plume. Finally, the water is pumped back to thecooling water cycle. The induced draft fan draws the exhaust gas of theboiler. Here, an electrostatic precipitator is used. Finally, this exhaust gasis vented through the chimneys of the power plant.
In the thermoelectric power plants; load following capability, efficiency,fuel and water management, and emissions are important issues. Inaddition, the active and reactive outputs of the power plant's generatorsand frequency and voltage regulations have impact on the power plantoperation.
2.3.2 Hydroelectric energy
Hydroelectric energy is generated by the kinetic and potential energy offlowing or falling water under the effect of gravitational force.Hydroelectric is the most mature and widest utilized form of renewableenergies. Hydroelectric energy has approximately 17% contribution to theoverall world energy generation [59]. No fuel is burnt at hydroelectricpower plants; therefore they do not have greenhouse gas emissions. Theoperating cost is relatively low since the water running the plant issupplied free by the nature. It is a renewable source of energy since therainfall naturally replenishes and enriches the water reservoirs.
Hydroelectric energy is generally obtained from the potential energy ofdammed or reservoired water. When the water falls from a certain heightof the reservoir output, it looses its potential energy and gains kineticenergy. The water flow drives a water turbine that is coupled to an electricgenerator which in turn generates electricity. This generated energy is afunction of the water volume and the difference between the source andoutflow of the water [60]. This height difference between the water outputand turbine is called as “head.” The potential energy of the water isproportional to the head. In order to generate greater amounts of energy,the head can be increased by running the water for hydraulic turbinethrough a large and long pipe called as penstock [61]. The crosssectionalview of a hydraulic dam and the hydroelectric power plant components
(2.1)
are represented in Fig. 2.5.
FIGURE 2.5 A hydroelectric dam and powerplant components [61].
In Table 2.6, these components are explained.
Table 2.6
Hydroelectric Power Plant Components
A. Reservoir E. Water intake
B. Intake F. Penstock
C. Water turbine G. Transformer and transmission lines
D. Electric generator H. River (or lower reservoir)
Electric power generation in a hydroelectric power plant can beapproximately calculated as [62],
where P is the generated power (kW), h is the height (m), r is the waterflow rate (m /s), and g is the gravitational acceleration (m/s ). In Eq. 2.1,the term hrg represents the potential energy of the water. η and ηrepresent the efficiency of the water turbine and the generator,respectively. These efficiency rates are required for the water potentialenergy conversion into the electrical energy.
The other methods of electric generation by hydroelectricity are thepumped storage hydroelectric power plants and runoftheriver plants.In pumped storage method, the water is pumped into higher elevations byusing the excess generation capacity during the periods when electricaldemand and cost are relatively lower. The water is released back intolower elevations through a turbine when the electric power demand andcost are relatively higher. In this method, water acts as an energy carrierin order to compensate the generationconsumption difference in acommercial device by improving the daily load factor [60–62]. In runoftheriver plants, water reservoirs are not used and the kinetic energy ofthe flowing water through a river is captured using waterwheels.
2.3.3 Solar energy conversion and photovoltaic systems
Solar energy is one of the fastest growing renewable energy sources,which is plentiful and has the greatest availability among other energysources. The amount of solar energy supplied from solar to the Earth in1 h is capable of satisfying the total energy requirements of the Earth for 1year [63]. Furthermore, solar energy does not produce pollutants orharmful byproducts, it is free of emissions. Solar energy is applicable tomany fields such as vehicular, residential, space, and naval applications.
2.3.3.1 Photovoltaic effect and semiconductor structure of PVs
Photovoltaic (PV) effect is known as a physical process in which that a PVcell converts the sunlight into electricity. When a PV cell is subject to thesunlight, the absorbed amount of light generates electric energy whileremaining sunlight can be reflected or passed through. The electrons inthe atoms of the PV cell are energized by the energy of the absorbed light.With this energy, these electrons move from their normal positions in thesemiconductor PV material and they create an electrical flow, i.e., electriccurrent through an external electric circuit connected to the PV cellterminals. The builtin electric field which is a specific electric feature ofthe PV cells provides the voltage potential difference that drives thecurrent through an external load [64]. Two layers of differentsemiconductor materials are placed in contact with each other in order toinduce the builtin electric field within a PV cell. The first layer which is ntype has abundance of electrons and it is negatively charged. The otherlayer which is ptype has abundance of holes and it is positively charged.Since the ntype silicon has excess electrons and ptype silicon has excessholes, contacting these layers together creates a p/n junction at theirinterface, thereby creating an electric field. In this contact, excesselectrons move from the ntype side to the ptype side. As a result, apositive charge is builtup along the ntype side of the interface andnegative charge along the ptype side. Thus an electric field is created atthe surface where the layers meet, called the p/n junction. This electricfield is due to the flow of electrons and holes. This electric field causes the
g g
3 2
electrons to move from the semiconductor toward the negative surface tocarry current. At the same time, the holes move in the opposite direction,toward the positive surface, where they wait for incoming electrons [64].The basic structure of a pn junction in a PV cell is illustrated in Fig. 2.6.
FIGURE 2.6 pn junction structure and currentflow in a PV cell.
2.3.3.2 PV Cell/module/array structures
A photovoltaic (PV) or solar cell is the basic building block of a PV (orsolar electric) system. An individual PV cell is usually quite small,typically producing about 1 or 2 W of power [65]. PV cells can beconnected together to form a larger unit called modules in order toincrease the power output of PV cells. Modules can be connected togetherand form larger units that are called arrays to generate more electricpower. The output voltage of a PV system can be boosted by connectingthe cells or modules in series. On the other hand, the output current canreach higher values by connecting them in parallel.
2.3.3.3 Active and passive solar energy systems
Based on the solar tracking capability, solar energy systems can becategorized in two types, passive and active systems [66,67]. In passivesolar energy systems there are not any moving mechanisms for the panels.In this technique, the energy is absorbed and retained and spaces aredesigned that naturally circulate air to transfer energy and referencing theposition of a building to the sun to enhance energy capture. On the otherhand, in active solar energy systems, typically there are electrical andmechanical components such as tracking mechanisms, sensors, motors,pumps, heat exchangers, and fans to capture sunlight and process it intousable forms such as heating, lighting, and electricity. The panel positionsare controlled in order to maximize exposure to the sun.
2.3.3.4 Components of a complete solar electrical energy system
In Fig. 2.7, the block diagram of a solar energy system is demonstrated. Inthis system, the sunlight is captured by the PV array. The photodiode orphotosensor signals determine the sun tracking motor positions. This suntracking control helps following the daily and seasonal solar positionchanges to face the sun directly and capture the most available sunlight. ADC/DC converter is employed at the PV panels' output in order to operateat the maximum power point (MPP) based on the currentvoltage (IV)characteristics of the PV array [68]. This DC/DC converter is controlled tooperate at the desired current and voltage output of the PV array. ADC/AC inverter is usually connected to the output of this MPPT DC/DCconverter in order to feed the AC loads for grid interconnection. A batterypack can be connected to the DC bus of the system to provide extra powerthat might not be available from the PV module during night and cloudyperiods. The battery pack can also store energy when the PV modulegenerates more power than the demanded. A grid connection is alsouseful to draw/inject power from/to the utility network to take theadvantage of excess power or to recharge the batteries using grid powerduring the peakoff periods of the utility network.
FIGURE 2.7 A solar energy system.
2.3.3.5 I-V Characteristics of photovoltaic (PV) systems, PV models, and equivalentPV circuit
PV systems have a special currentvoltage characteristic. As more currentis drawn from the PV system, the system output voltage decreases. Thesecharacteristic curves differ at different solar insulation and temperatureconditions hence the curves can be obtained by varying the loadresistance (varying the output current) and measuring the output voltagefor many different current values. IV curve passes through two points forzero voltage and zero current.
• The shortcircuit current (I ): I is the current produced when thepositive and negative terminals of the cell are shortcircuited, and thevoltage between the terminals is zero, which corresponds to zero loadresistance.
• The opencircuit voltage (V ): V is the voltage across the positive andnegative terminals under opencircuit conditions, when the current is
SC SC
OC OC
(2.2)
(2.3)
(2.4)
(2.5)
zero, which corresponds to infinite load resistance.
In order to extract maximum power from a PV system, for a constantambient condition there is only one currentvoltage pair. On the IVcurve, the maximumpower point (P ) occurs when the product of currentand voltage is the maximum. Although the current is maximum, no poweris produced at the shortcircuit current due to zero voltage. In addition,no power is produced at the opencircuit voltage due to zero current. TheMPP is somewhere between these two points. Maximum power isgenerated at about the “knee” of the curve. This point represents themaximum efficiency of the solar device in converting sunlight intoelectricity [69]. A typical IV curve characteristic of a PV system is givenin Fig. 2.8.
FIGURE 2.8 A typical IV curve characteristic ofa PV system.
PV systems exhibit nonlinear IV characteristics [70]. There are variousmodels available to mathematically model the IV characteristics of thePV systems. An equivalent circuit expressing the PV model characteristicsis shown in Fig. 2.9. This model is known as singlediode model and isone of the most common equivalent circuits representing PV systembehaviors.
FIGURE 2.9 Singlediode model of solar cellequivalent circuit.
In this model, opencircuit voltage and shortcircuit current are the keyparameters. Illumination or solar radiation affects the shortcircuitcurrent, while the opencircuit voltage is affected by the material andtemperature. In this model, I is the shortcircuit current, I is the diodereverse saturation current, m is the diode ideality factor (generally variousbetween 1 and 5), and V is the temperature voltage expressed as V =kT/q, which is 25.7 mV at 25 °C. The equations defining this model are,
and
The IV characteristic of the solar cell can be alternatively defined by [71],
where V is the PV output voltage (V), I is the PV output current (A), I isthe photocurrent (A), I is the diode current (A), I is the saturationcurrent (A), A is the ideality factor, q is the electronic charge (C), k is theBoltzmann's constant (J K ), T is the junction temperature (K), R is theseries resistance (Ω), and R is the shunt resistance (Ω).
2.3.3.6 Sun tracking systems
Incident solar radiation is the most important parameter for the power
m
SC s
T T
ph
D 0
B
s
sh
−1
(2.6)
generated by solar energy systems. sun changes its position during theday from morning to night. Moreover, the sun orbit differs from oneseason to another. By properly following the sun, through utilizing suntracking systems, the incident solar irradiance can be effectively increased[72]. A sun tracker is an electromechanic component used for orienting asolar photovoltaic panel, concentrating solar reflector, or lens toward thesun. Solar panels require a high degree of accuracy to ensure that theconcentrated sunlight is directed precisely to the photovoltaic device.solar tracking systems can substantially improve the amount of powerproduced by a system by enhancing morning and afternoon performance.For instance, the orientation of PV panels can increase the solarelectricenergy conversion efficiency between 20% and 50% [73–77]. A fixedsystem oriented to a fixed sun facing direction will have a relatively lowannual production because they do not move to track the sun which yieldssignificant increase of incident irradiation. An efficient sun trackingsystem should be capable of movement from north to south and from eastto west as shown in Fig. 2.10.
FIGURE 2.10 Rotations of a sun trackingsystem.
2.3.3.7 Maximum power point tracking techniques
The conditions of radiation and temperature affect the currentvoltage (IV) characteristics of solar cells. The voltage and current should becontrolled to track the maximum power of the PV systems in order tooperate the PV systems at the point of (V , I ). Maximum power pointtracking (MPPT) techniques are used to extract maximum available powerfrom the solar cells by controlling the voltage and current. systemscomposed of various PV modules located at different positions shouldhave individual power conditioning systems to ensure the MPPT for eachmodule [78]. In this section, most common and applicable MPPTtechniques are described.
The incremental conductance (INC) technique is the most commonly usedMPPT for PV systems [71] (79–81). The technique is based on the fact thatthe sum of the instantaneous conductance I/V and the INC ΔI/ΔV is zeroat the MPP, negative on the right side of the MPP, and positive on the leftside of the MPP.
If the change of current and change of voltage is zero at the same time, noincrement or decrement is required for the reference current. If there isno change for the current, while the voltage change is positive, referencecurrent should be increased. similarly, if there is no change for the currentwhile the voltage change is negative, reference current should bedecreased. Contrarily, the change of the current might not be zero. If thecurrent change is not zero, while ΔV/ΔI = −V/I, the PV is operating atMPP. If the current change is not zero and ΔV/ΔI ≠ −V/I, then ΔV/ΔI >−V/I. If ΔV/ΔI ≠ −V/I and ΔV/ΔI > −V/I, the reference current should bedecreased. However, if ΔV/ΔI ≠ −V/I and ΔV/ΔI < −V/I, the referencecurrent should be increased in order to track the MPP.
Practically, due to the noise and errors, satisfying the condition of ΔI/ΔV= −I/V may be very difficult [82]. Therefore, this condition can besatisfied with good approximation by,
where ε is a positive small value. Based on this algorithm, the operatingpoint is either located in BC interval or it is oscillating among the AB andCD intervals as shown in Fig. 2.11.
FIGURE 2.11 Operating point trajectory ofincremental conductancebased MPPT.
Selecting the step size (ΔV ), shown in Fig. 2.11, is a tradeoff of accuratesteady tracking and dynamic response. If larger step sizes are used forquicker dynamic responses, the tracking accuracy decreases and thetracking point oscillates around the MPP. On the other hand, when smallstep sizes are selected, the tracking accuracy will increase. In the meantime, the time duration required to reach the MPP will increase [83].
The normalized IV, PV (powervoltage), and absolute derivative of PVcharacteristics of a PV array are shown in Fig. 2.12.
FIGURE 2.12 Normalized IV, PV, and |dP/dV|characteristics of a PV array.
From these characteristics, it is seen that the |dP/dV| decreases as theMPP is approached and it gets greater when the operating point gets awayfrom the MPP. This relation can be given by,
max max
ref
(2.7)
(2.8)
In order to obtain the operating MPP, dP/dV should be calculated. ThedP/dV can be obtained by only measuring the incremental andinstantaneous conductance of the PV array, i.e., ΔI/ΔV and I/V [79].
2.3.3.7.2 Other MPPT techniques
In the Perturb and Observe technique, the current drawn from the PVarray is perturbed in a given direction and if the power drawn from the PVarray increases, the operating point gets closer to the MPP and, thus, theoperating current should be further perturbed in the same direction [84].If the current is perturbed and this results in a decrease in the powerdrawn from the PV array, this means that the point of operation is movingaway from the MPP and, therefore, the perturbation of the operatingcurrent should be reversed.
The PV and IV characteristics of a roofmounted PV array aremonotonously increasing or decreasing under a stable insulationconditions. The IV characteristic is a function of voltage, insulation level,and temperature. From these characteristics, MPPT controllers can bedeveloped based on the linearized IV characteristics [85–87].
Fractional opencircuit voltagebased method [88–95], fractional shortcircuitbased method [95,96], fuzzy logic controllerbased method[97–106], neural networkbased method [107–112], ripple correlationbased method [113], current sweepbased method [114], and DClinkcapacitor droop controlbased method [115,116] are the other applicablemethods for MPPT.
2.3.3.8 Power electronic interfaces for PV systems
Power electronic interfaces are either used to convert the DC energy to ACenergy to supply AC loads or connection to the grid or to control theterminal conditions of the PV module to track the MPP for maximizingthe extracted energy. They also provide wide operating range, capabilityof operation over different daily and seasonal conditions, and reaching thehighest possible efficiency [117]. There are various ways to categorizepower electronic interfaces for solar systems. In this book, powerelectronic interfaces are categorized as power electronic interfaces forgridconnected PV systems and standalone PV systems.
2.3.3.8.1 Power electronic interfaces for grid-connected PV systems
The power electronic interfaces for gridconnected PV systems can beclassified into two main criteria: classification based on inverterutilization and classification based on converter stage and moduleconfigurations.
2.3.3.8.1.1 Topologies based on inverter utilization
The centralized inverter system is illustrated in Fig. 2.13.
FIGURE 2.13 Conventional PV systemtechnology using centralized inverter systemtopology.
In this topology, PV modules are connected in series and parallel toachieve the required current and voltage levels. Only one inverter is usedin this topology at the common DC bus. In this topology, the inverter'spower losses are higher than string inverter or multiinverter topologiesdue to the mismatch between the modules and necessity of string diodesthat are connected in series. In this topology, voltage boost may not berequired since the voltage of series connected string voltages is highenough [118].
In string inverters topology, the single string of modules connected to theseparate inverters for each string [119]. In this topology, voltage boostingmay not be required if enough number of components are connected inseries in each string.
In the multistring invert topology, several strings are interfaced withtheir own integrated DC/DC converter to a common DC/AC inverter[120,121] as shown in Fig. 2.14.
FIGURE 2.14 Multistring inverters topology.
Therefore, this is a flexible design with high efficiency. In this topologyeach PV module has its integrated power electronic interface with utility.The power loss of the system is relatively lower due to the reducedmismatch among the modules, but the constant losses in the inverter maybe the same as for the string inverter. In addition, this configurationsupports optimal operation of each module, which leads to an overalloptimal performance [118]. This is due to the fact that each PV panel hasits individual DC/DC converter and maximum power levels can be
achieved separately for each panel.
2.3.3.8.1.2 Topologies based on module and stage configurations
The power electronic conditioning circuits for solar energy systems can betransformerless, or they can utilize highfrequency transformersembedded in a DC/DC converter, which avoids bulky lowfrequencytransformers. The number of stages in the presented topologies refers tothe number of cascaded converters/inverters in the system.
Isolated DC/DC converters consist of a transformer between the DC/ACand AC/DC conversion stages [122]. This transformer provides isolationbetween the PV source and load. A typical topology is depicted in Fig.2.15.
FIGURE 2.15 Isolated DC/DC convertertopology.
In the topology shown in Fig. 2.15, the outputs of the PV panel andDC/DC converter are DC voltages. The two stage DC/DC converterconsists of a DC/AC inverter, a highfrequency transformer, and arectifier. In this topology, a capacitor can be used between the bottom legof the highfrequency inverter and the transformer, forming an LCresonant circuit with the equivalent inductance of the transformer. Thisresonance circuit reduces the switching losses of the inverter.Alternatively, only two switches are enough if a pushpull converter isused; however, this topology requires a middle terminal outputtedtransformer [118].
The topologies shown in Fig. 2.16(a) and (b) are two stage singlemoduletopologies, in which a DC/DC converter is connected to a DC/ACconverter for grid connection. The DC/DC converter deals with the MPPtracking and the DC/AC inverter is employed to convert the DC output toAC voltage for grid connection. These are nonisolated converters sincethey are transformerless.
FIGURE 2.16 (a) Boost converter with fullbridge inverter and (b) buck converter with fullbridge inverter.
Instead of using a fullbridge inverter for the DC/AC conversion stage, ahalfbridge inverter can also be used. In this way, number of switchingelements can be reduced and controller can be simplified, however, forthe DC bus, two series connected capacitor is required to obtain themidpoint. This midpoint of two series connected capacitors will be used asthe negative terminal of the AC network of the halfbridge configuration.
The singlestage inverter for multiple modules is depicted in Fig. 2.17,which is the simplest gridconnection topology [123]. The inverter is astandard voltage source PWM inverter, connected to the utility throughan LCL filter. The input voltage, generated by the PV modules, should behigher than the peak voltage of the utility. The efficiency is about 97%. Onthe other hand, all the modules are connected to the same MPPT device.This may cause severe power losses during partial shadowing. In addition,a large capacitor is required for power decoupling between PV modulesand the utility [124].
FIGURE 2.17 Singlestage inverter for multiplemodules.
A topology for multimodule multistring interfaces is shown in Fig. 2.18[121,125]. The inverter in Fig. 2.18 consists of up to three boostconverters, one for each PV string, and a common halfbridge PWMinverter. The circuit can also be constructed with an isolated current orvoltagefed pushpull or fullbridge converter [126], and a fullbridgeinverter toward the utility. The voltage across each string can becontrolled individually [121,126].
FIGURE 2.18 Topology of the power electronicsof the multistring inverter.
As an alternative to the topology shown in Fig. 2.18, other types of DC/DCconverter can be employed to the first stage, such as isolated DC/DCconverters.
2.3.3.8.2 Power electronic interfaces for stand-alone PV systems
The standalone PV systems composed of a storage device and itscontroller for sustainable satisfaction of the load power demands [127].The storage device with the controller should provide the powerdifference when the available power from the PV panel is smaller than therequired power at the load bus [128]. When the available power from thePV panel is more than the required power, the PV panel should supply theload power and the excess power should be used to charge the storagedevice. A simple PV panel/battery connection topology is shown in Fig.2.19.
(2.9)
(2.10)
FIGURE 2.19 PV/battery connection for standalone applications.
In this simple topology, the DC/DC converter between the battery and thePV panel is used to capture the all available power from the PV panel. Inthis system, battery pack acts as an energy buffer, charged from the PVpanel and discharged through the DC/AC inverter to the load side. Thecharging controller determines the charging current of the battery,depending on the MPP of the PV panels at a certain time. When there isno solar insulation available, the DC/DC converter disables and the storedenergy within the battery supplies the load demands. The battery sizeshould be selected so that it can supply all the power demands during apossible noinsulation period. In addition, it could be fully charged duringthe insulated periods to store the energy for future use. Since thecombined model produces AC electrical energy, it should be converted toAC electrical energy for domestic electrical loads. The combined systemrequires a DC/AC inverter, which also used to match the differentdynamics of the combined energy system and various loads. The properresponse of the PV/battery system to the overall load dynamics can beachieved by generating appropriate switching signals to the inverter whilemodulating for both active and reactive powers. The load bus voltage canbe controlled by the modulation index control of the inverter; while theload control can be achieved by the phase angle control of the inverter.
2.3.4 Wind turbines and wind energy conversion systems
Wind turbines are devices that are capable of capturing the kinetic energyof winds. This kinetic energy is converted to the mechanical energy torotate the turbine which is coupled to an electric generator. In this way,kinetic energy of the wind can be converted into a usable form of energy,i.e., electrical energy. Wind turbines can be installed standalone to powerremote or isolated locations, or they can be grid connected, to supplypower to the utility grid. Wind power is renewable, widely distributed,plentiful, and it is a clean way of energy conversion. Additionally, itcontributes in reducing the greenhouse gas emissions; since it can be usedas an alternative to fossil fuelbased power generation [129]. Althoughwind energy has a great potential to significantly contribute the world'spower generation, only 3% of worldwide power requirement is suppliedby wind turbines [130].
Several key parameters, such as air density, area of the blades, windspeed, and rotor area, need to be considered in order to efficiently capturewind energy. Wind force is converted into a torque that rotates the bladesof wind turbine. The wind force is stronger in higher air densities. Inother words, kinetic energy of the wind depends on airdensity andheavier winds carry more kinetic energy. At normal atmospheric pressureand at 15 °C the weight of the air is 1.225 kg/m , but if the humidityincreases, the density decreases slightly. The other fact, which determinesthe air density is whether the air is warm or cold. Warmer winds are lessdense than cold ones, so at high altitudes the air is less dense [131].Besides, the area of the blades (air swept area), the diameter of the blade,plays important role in captured wind energy. Under the same conditionsmore wind can be captured with longer blades and bigger rotor area ofwind turbine [130,131]. The other parameter is the wind speed. It isexpected that wind kinetic energy arises as wind speed increases [131].
Kinetic energy of the wind can be expressed as
where E represents kinetic energy of the wind, m stands for the mass ofthe wind, v is wind speed, ρ is air density, A is rotor area, R is bladelength, while d stands for thickness of the “air disc” shown in Fig. 2.20.
FIGURE 2.20 Kinetic energy of wind.
Hence, the overall wind power (P) is [131]:
From Eq. 2.10 it can be seen that the power content ofthe wind varies with the cube (the third power) of the average wind speedas shown in Fig. 2.21.
FIGURE 2.21 Specific wind power due to windspeed variation.
2.3.4.1 Wind turbine power
2.3.4.1.1 Betz's law
The theoretical maximum power that can be extracted from the wind is
k
3
(2.11)
(2.12)
(2.13)
(2.14)
demonstrated by the Betz's law [132,133]. The wind turbines extract thekinetic energy of the wind. Higher wind speeds results in higher extractedenergy. It should be noted that the wind speed after turbine (after passesthrough turbine) is much lower than before it comes to turbine (beforeenergy is extracted) since the wind looses its speed by transferring itskinetic energy to the wind turbine. That means wind speed before windapproaches (in front of) the turbine, and its speed after (behind) turbineare different. Figure 2.22 shows both speeds. The wind after the turbinehas less amount of energy due to decreased speed of wind.
FIGURE 2.22 Wind speed before and afterturbine.
The decreased wind speed, after turbine, provides information on amountof possible extracted energy from the wind. The extracted power from thewind can be calculated using Eq. 2.7.
where P shows maximum extracted power from the wind, v and vare wind speeds after and before passing through the turbine. ρ is the airdensity and R demonstrates the radius of the blades.
The relation of total amount of power P to the extracted power Pcan be calculated as
For the maximum power extraction, the ratio of the wind speed after andbefore the turbine can be calculated using
.
Solving Eq. (2.12) for v /v , yields,
As a result, Eq. (2.12) reaches its maximum value for .
Equation (2.14) shows that the maximum extracted power from the windis 59.3% of the total available power. In other words, it is not possible toextract all 100% of wind energy since the wind speed after turbine cannotbe 0.
Betz's law indicates that the maximum theoretical extracted wind power is59%. However, in practice, the real efficiency of wind turbine is slightlydifferent (lower) due to the other nonideal properties.
2.3.4.2 Different electrical machines in wind turbines
There are many types of electrical machines that are used in windturbines. There is no clear criterion for choosing particular machine towork as wind generator. Based on the installed power, site of turbine, loadtype, and simplicity of control the wind generator can be chosen. Squirrelcage induction or Brushless DC (BLDC) generators are usually used forsmall wind turbines in household applications. Doubly fed inductiongenerators (DFIGs) are usually used for megawatt size turbines.Synchronous machines and permanent magnet synchronous machines(PMSM) can also be used for wind turbine applications.
2.3.4.2.1 Brushless DC machines
BLDC machines are very popular in many applications due to the recentadvances in their development. In addition, the development of fastsemiconductor switches, costeffective DSP processors, and othermicrocontrollers have influenced the development of the motor/generatordrives. BLDC machines are widely used because of their simple control,efficiency, compactness, lightweight, ease of cooling, less noise, and lowmaintenance [134,135]. Usually BLDC machines are used in small windturbines (up to 15 kW).
The simplified equivalent circuit of the BLDC generator connected to adiode rectifier is shown in Fig. 2.23. This is the simplest way of usingBLDC machine for wind applications, because there is no switch tocontrol the phase current. The full bridge rectifies the induced voltages ofvariable frequency (because of variable wind speeds). Basically, thewaveform of the induced EMF (electromotive force) is converted to DCvoltage regardless of the input waveform. Usually these types of windturbines are connected to batteries; therefore rectified electrical power isused to charge the battery.
Threephase active synchronous rectifiers can be used with BLDCgenerators. In this case, the controlled rectifier is used for BLDCphasecurrent control. Usually hysteresis regulators are used to control current.In synchronous rectifiers, active switching devices such as IGBTs orMOSFETs are used. By employing a PWM control strategy for thesynchronous rectifier, MPPT of the wind turbine can be achieved. Aninverter can be placed at the DC bus for grid interconnection or poweringthe AC loads.
2.3.4.2.2 Permanent magnet synchronous machines
For both fixed and variable speed applications PMSM can be used. Thepermanent magnet synchronous generator (PMSG) is very efficient andsuitable for wind turbine applications. PMSGs allow directdrive energyconversion for wind applications. Directdrive energy conversion helpseliminating the gearbox between the turbine and generator; thus, thesesystems are less expensive and less maintenance is required [136,137].However, lower speed determined by the turbine shaft is the operatingspeed for the generator.
A wind power system (WPS) where a PMSG is connected to a fullbridgerectifier followed by a boost converter is shown in Fig. 2.24. In this case,the boost converter controls the electromagnetic torque. The supply sideconverter regulates the DClink voltage and controls the input powerfactor. One drawback of this configuration is the use of diode rectifier thatincreases the current amplitude and losses. The gridside converter can beused to control active and reactive power being supplied to the grid.Automatic voltage regulator (AVR) obtains the information of speed ofturbine, DClink voltage, current, and gridside voltage and current. Itcalculates PWM pattern (control scheme) for converter. Thisconfiguration has been considered for small size (less than 50 kW) WPS[138].
FIGURE 2.24 PMSG with rectifier/inverter.
Instead of using a diode rectifier cascaded by a DC/DC converter, bothrectifier and inverter can be controllable. A PMSG where the PWMrectifier is placed between the generator and the DC link, and PWMinverter is connected to the utility is shown in Fig. 2.25. In this case, thebacktoback converter can be used as the interface between the grid andthe stator windings of the PMSG [139]. The turbine can be operated at itsmaximum efficiency and the variable speed operation of PMSG can becontrolled by using a power converter which is utilized to regulate themaximum power flow. The stator terminal voltage can be controlled inseveral ways [140]. In this system, utilizing the field oriented control(FOC) allows the generator to operate near its optimal working point inorder to minimize the losses in the generator and power electronic circuit.However, the performance depends on the knowledge of the generatorparameter that varies with temperature and frequency. The maindrawbacks are the cost of permanent magnets that increases the price ofthe machine; and demagnetization of the permanent magnets. Inaddition, it is not possible to control the power factor of the machine[134].
FIGURE 2.25 PMSG with backtoback inverter.
2.3.4.2.3 Squirrel cage induction machines
The threephase induction machines are commonly used in industrialmotor applications. However, they can also be effectively used asgenerators in electrical power systems. The main issue with inductionmachines as electric power generators is the need for an external reactivepower source that will excite the induction machine, which is certainly notrequired for synchronous machines in similar applications. If inductionmachine is connected to the grid, required reactive power can be providedby the power system. Induction machine may be used in cogenerationwith other synchronous generators or the excitation might be suppliedfrom capacitor banks (only for standalone selfexcited generatorsapplication) [141–146]. The reactive power required for excitation can besupplied using static VAr compensators [147,148] or static compensators(STATCOMs) [149].
Due to its low cost, brushless rotor construction does not need a separatesource for excitation. No maintenance and self protection against severeover loads, short circuits, and selfexcited induction generators are usedin wind turbine applications [142–146]. The only drawback of these typesof generators can be their inherent generated voltage and frequencyregulation under varied loads [150].
Common structure of a squirrel cage induction generator with backbackconverters is shown in Fig. 2.26. In this structure, stator winding isconnected to utility through a fourquadrant power converter. Two PWMVSI are connected backtoback through a DC link. The statorsideconverter regulates the electromagnetic torque and supplies reactive
power, while the gridside converter controls the real and reactive powerdelivered from the system to the utility and regulates the DC link. Thistopology has several practical advantages, and one of them is possibility offast transient response for speed variations. In addition, the inverter canoperate as a VAR/harmonic compensator [151].
On the other hand, main drawback is the complex control system. UsuallyFOC is used to control this topology, where its performance relies on thegenerator parameters, which vary with temperature and frequency.Hence, in order to supply the magnetizing power requirements, i.e., tomagnetize the machine, the statorside converter must be oversized 3050% with respect to rated power.
2.3.4.2.4 Doubly fed induction generator
Figure 2.27 presents a topology consists of a DFIG with AC/DC andDC/AC converters; i.e., a fourquadrant AC/AC converter using IGBTsconnected to the rotor windings. In the DFIG topology, the inductiongenerator is not a squirrel cage machine and the rotor windings are notshort circuited. Instead they are used as the secondary terminals of thegenerator which provides the capability of controlling the machine power,torque, speed, and reactive power. To control the active and reactivepower flow of the DFIG topology, rotor and gridside converters should becontrolled separately [152–155].
FIGURE 2.27 Doubly fed induction machinetopology.
Wounded rotor induction machines can be supplied from both rotor andstator sides. The speed and the torque of the wounded rotor inductionmachine can be controlled by regulating voltages from both rotor andstator sides of machine. The DFIG can be considered as asynchronous/asynchronous hybrid machine. In the DFIG, similar to thesynchronous generator, the real power depends on the rotor voltagemagnitude and angle. In addition, the induction machine slip is also afunction of the real power [156]. DFIG topology offers several advantagesin compare to systems using directinline converters [157,158]. Thesebenefits are;
– The main power is transferred through the stator windings of thegenerator which is directly connected to the grid. Around 6575% of thetotal power is transmitted through stator windings. The remaining poweris transmitted using the rotor windings, i.e., through the converters,which is about 25% of the total power. Since the inverter rating is 25% oftotal system power the inverter cost and size can considerably be reduced.
– While the generator losses are the same in both topologies (directinline and DFIG), the inverter losses can be reduced from around 3% to0.75%, because the inverter is supposed to only transfer 25% of the totalpower. Therefore, approximately 23% efficiency improvement can beobtained.
– DFIG topology offers a decoupled control of generator active andreactive powers [159,160].
– Cost and size of the inverter and EMI filters can be reduced since theinverter size is reduced. In addition, the inverter harmonics are loweredbecause the inverter is not connected to the main stator windings.
In the rotor circuit, two voltagefed PWM converters are connected backtoback while the stator windings are directly connected to the AC gridside as shown in Fig. 2.27. The direction and magnitude of power betweenthe rotor windings and stator windings can be controlled by adjusting theswitching of the PWM signals of the inverters [161–163]. This is verysimilar to connecting a controllable voltage source to the rotor circuit[164]. This can also be considered as a conventional induction generatorwithout a zero rotor voltage.
To take the benefits of variable speed operation, the optimum operatingpoint of the torquespeed curve should be tracked precisely [165]. Bycontrolling the torque of the machine, speed can be adjusted. Thus, usingthe instantaneous rotor speed value and by controlling the rotor currenti in stator fluxoriented reference frame, the desired active power can beobtained. Operation at the desired active power results in the desiredspeed and torque [153]. On the other hand, the gridside converter iscontrolled to keep the DClink voltage fixed, independent of the directionof rotor power flow. By using supply voltage vectororiented control, thedecoupled control of active and reactive power flow between rotor andgrid can be obtained.
Using DFIG, the oversizing problem can be solved. Still speed range ofturbine is wide enough, thus a power converter, which is rated for muchlower powers, can be placed in rotor side only and stator is connected togrid directly. Since power flowing through rotor is usually around 2530%of power going through stator, the power electronic interface is designedfor only 2530% of total power. This is the most important advantage ofDFIG.
ry
2.3.4.2.5 Synchronous generators
Synchronous generators are commonly used for variable speed windturbine applications, due to their low rotational synchronous speeds thatproduce the voltage at grid frequency. Synchronous generators can be anappropriate selection for variable speed operation of wind turbines[166,167]. They do not need a pitch control mechanism. The pitch controlmechanism increases the cost of the turbine and causes stress on turbineand generator [168]. Synchronous generators in variable speed operationwill generate variable voltage and variable frequency power. Using anAVR for the excitation of the field voltage, the output voltage of thesynchronous generator can be controlled. However, induction generatorsrequire controlled capacitors for voltage control. In addition, theiroperating speed should be over synchronous speed in order to operate ingenerating mode [169].
Multipole synchronous generators can be used more efficiently since thegear can be eliminated and direct drive of the turbine and generator canbe achieved [170,171]. However, synchronous generators withoutmultipoles require gearboxes in order to produce the required frequencyfor grid connection. On the other hand, a DC voltage source or an AC/DCconverter is required for synchronous generators in wind applications inorder to produce the required excitation voltage for the field windings.The synchronous generator connection with wind turbine is shown in Fig.2.28.
2.3.4.3 Energy storage applications for wind turbines
The batteries and other DC energy storage devices can be connected to theDC links of any topologies. The main purpose of batteries is to assists thegenerator to meet the load demand. When the load current is smaller thangenerator current, the extra current is used to charge the battery energystorage. On the other hand, when the load current is larger than generatorcurrent, the current is supplied from the battery to the load. With thisstrategy, the voltage and frequency of the generator can be controlled forvarious load conditions. Energy storage decreases system inertia,improves the behavior of the system in the case of disturbances,compensates transients, and therefore, improves the efficiency [172].However, it brings an initial cost to the system and requires periodicalmaintenance depending on the storage devices. Therefore, the voltage andfrequency control can be modified by using batteries as the controllableload of the VSI as presented in Fig. 2.29. In this way, the load can beregulated by controlling the power flow to the batteries. A bidirectionalinverter/converter can be used for power flow from/to the batteries. Asanother alternative, the battery voltage can be converted to AC voltagewith another individual inverter to provide power to AC loads. Althoughan induction generator is shown in Fig. 2.29, these energy storage systemsare applicable to any other topologies.
FIGURE 2.29 Voltage and frequency controlusing energy storage.
Storage systems can be connected in various forms to the wind turbinesystems [173–177]. Generally, a bidirectional DC/DC converter is requiredfor the integration of the storage system to the DFIG system [178]. In thistopology, one of the converters regulates the storage power; whereas theother is responsible for DC bus voltage control. The bidirectional energystorage topology for DFIGs in wind applications is shown in Fig. 2.30.
FIGURE 2.30 Energy storage with bidirectionalconverter in DFIG systems.
2.3.5 Ocean energy harvesting
2.3.5.1 Ocean wave energy
Ocean waves are a plentiful, clean, and renewable source of energy. Thetotal power of waves breaking around the world's coastlines is estimatedat 23 million MW. The west coasts of the United States and Europe andthe coasts of Japan and New Zealand are good sites for harnessing waveenergy [179]. Wave energy conversion is one of the feasible future energytechnologies; however, it is not mature enough. Therefore, constructioncost of wave power plants is considerably high. These energy systems arenot developed and maturated commercially due to the problems ofdealing with sea conditions, complexity, and difficulty of interconnectionand transmission of electricity.
A wave power absorber, a turbine, a generator, and power electronicinterfaces are the main components of a typical ocean wave energyharvesting technique. The kinetic energy of the ocean waves are capturedby absorbers. The absorbed kinetic energy of the waves is either conveyedto turbines or the absorber directly drives the generator. The shaft of theelectric generator is driven by the turbine. Turbines are generally usedwithin the systems including rotational generators. Linear motion
(2.15)
(2.16)
(2.17)
(2.18)
(2.19)
generators are used in systems without turbines, which can be directlydriven by the power absorber or movement of the device. Due to thevarying amplitude and period of the ocean waves, both linear androtational generators generate variable frequency—variable amplitude ACvoltage. This AC voltage can be rectified to DC voltage to take the benefitof DC energy transmission through the salty ocean water. DCtransmission in salty water does not require an additional cable for thenegative polarity. Thus, it will be more cost effective than transmitting thepower in AC form, which requires threephase cables. Transmission cablelength varies depending on the location of the application, which is eithernearshore or offshore. However, the main idea and the principles aresame for both types of applications. After the DC power is transmittedfrom ocean to the land, a DC/DC converter or a tapchanging transformercan be used for voltage regulation. Depending on the utilized voltageregulation system, a DC/AC inverter is used before or after the voltageregulator. The voltage synchronization is provided by the inverter and theoutput terminals of the inverter can be connected to the grid.
In Fig. 2.31, a system level diagram of the ocean wave energy harvestingtechnology is shown. At an inwater substation, wave energy conversiondevices (including the absorber, turbine, and generator) areinterconnected. The substation consists of the connection equipments andcontrollers for individual devices. The outputs of the generators areconnected to a common DC bus using DC/AC converters for transformingpower before transmission to the shore. A transmission line connects thecluster to shore. An onshore inverter converts the DC voltage to a 50 or60 Hz AC voltage for grid connection. An optional shore transformer withtap changer or a DC/DC converter compensates the voltage variations. Agroup of absorber, turbine, and generators could be used in a farmstructure thus the captured energy can be increased.
FIGURE 2.31 System level diagram of oceanwave energy harvesting.
Alternatively, the land converters might be moved offshore to come upwith space limitations that may occur in land stations. This brings somecomplexity to the system and may require more maintenance, which isharder to deal, in compare to landside converters. Moreover, thetransformer can be installed offshore. This would increase the powertransmission capability, since the higher voltage transmission will resultin less transmission losses. However, in this case the advantage of DCtransmission will not exist. As a different option, boost DC/DC converterscan be used after the AC/DC converter of the generator. This allows a highvoltage DC transmission link. In this case, both transmission losses will bekept at minimum and only singleline DC transmission through the oceanwater will be required.
2.3.5.1.1 Energy of ocean waves
The total potential and kinetic energy of an ocean wave can be expressedas,
where g is the acceleration of gravity (9.8 m/s ), ρ is the density of water(1000 kg/m ), and A is the wave amplitude (m).
The power of a wave in a period is equal to the energy E multiplied by thespeed of wave propagation, v , for deep water
where T is the wave period (s) and L is the wave length (m) [180].
The dispersion relationship describes the connection between the waveperiod T and the wave length L as,
If Eq. 2.18 is substituted in Eq. 2.17, the power or energy flux of an oceanwave can be calculated as
Instead of using the wave amplitude, wave power can also be rewritten asa function of wave height, H (m). Considering that the wave amplitude isthe half of the wave height, the wave power becomes:
g
2
3
(2.20)
2.3.5.1.2 Ocean wave energy harvesting technologies
In general, ocean wave energy harvesting technologies can be classified intwo types with respect to their distance from the shore; OffShore OceanWave Energy Harvesting Technologies and OnShore Ocean Wave EnergyHarvesting Technologies. These are discussed in details in followingsubsections.
2.3.5.1.2.1 Off-shore ocean wave energy harvesting technologies
Offshore applications are located away from the shore and they generallyuse a floating body as wave power absorber and another body that is fixedto the ocean bottom. Generally, linear generators with buoys are used inoffshore applications. Linear generators are directly driven by themovement of a floating body on the ocean. Salter cam and buoys with airdriven turbines are the only applications involving rotational generatorsin offshore applications.
In airdriven turbine systems for offshore applications, the primaryconversion is from wave to the pressurized air. Secondary conversionstage is the conversion to mechanical energy by rotating shaft of theturbine. The last stage is converting mechanical rotation into electricpower by electric generators.
The operating principle of an offshore application which consists of afloating buoy with an air chamber and an airdriven generator is shown inFig. 2.32. In this system, the water level inside channel of the buoyincreases when the waves hit the body. This increase in water level,applies a pressure to the air in the air chamber. When the air ispressurized, it applies a force to the ventilator turbine and rotates it. Thisturbine drives the electric generator and electricity is generated at theoutput terminals of this generator. When the waves are pulled back to theocean, the air in the air chamber is also pulled back since the water levelin the buoy channel decreases. Due to the syringe effect, this time turbineshaft rotates in the contrary direction but produces electricity. Thereshould be very good mechanical insulation through the air chamber andthe ventilating generator to achieve higher efficiencies. However, thisbrings design complexity and additional cost to the system.
FIGURE 2.32 Spinning the airdriven turbinesusing wave power [181].
In another method, water level increases and air is taken out from theupper outlets while spinning the turbines as shown in Fig. 2.33(a).Contrarily, when the waves are pulled back to the sea, water leveldecreases. This results in sucking the air back from the upper inlets whilespinning the turbines as shown in Fig. 2.33(b).
FIGURE 2.33 Air pressure ring buoy. (a)Waterlevel increases and air is taken out from theupper outlets and (b) water level decreases andair is pulled back from upper inlets.
2.3.5.1.2.1.2 Directdrive permanent magnet linear generatorbased buoy applications
The height differences of the wave top and bottom levels yields an up anddown motion for the piston which is the transaxle of the linear generator.When the wave is floating on the ocean surface, the buoy follows themotion of the wave. Buoy can move vertically on a pillar, which isconnected to a hull. On the surface of the hull, permanent magnets aremounted, while outside of the hull contains the coil windings. The pillarand stator are connected together on a concentrate foundation standingon the seabed of the ocean. The hull and mounted magnets, called rotor orpiston, are the moving parts of the generator. Since the motion is linear,this generator is called a linear generator.
In Fig. 2.34, the linear generator in the floating buoy and fixed pillar areshown.
FIGURE 2.34 Linear generatorbased buoytype wave energy harvesting method.
When the wave rises, the buoy will drive the generator piston through astiff rope. When the wave subsides, the generator will be driven by thespring that stores the mechanical energy in the first case. Thus, electricgeneration is provided during both up and down motion. Due to theexistence of variable frequency in the current and voltage from the stator,an AC/DC rectifier followed by a DC/AC converter is required to make thegrid connection possible. Instead of placing moving parts to the oceanbottom, the permanent magnets and the stator windings can be placed atthe sea level [182]. Fig. 2.35 shows the xy plane of the crosssection view
of one pole of the longitudinal flux surface mounted linear permanentmagnet generator.
FIGURE 2.35 Schematic of a longitudinal fluxpermanent magnet generator used for waveenergy conversion.
2.3.5.1.2.1.3 Salter cam method
Salter cam method implementation is shown in Fig. 2.36. Salter cam rollsaround a fixed inner cylinder by activation of an incoming wave. Throughthe differential rotation between the cylinder and the cam, power can becaptured. The motion of the cam is converted from wave to a hydraulicfluid. Then hydraulic motor is used to convert the pressurized hydraulicfluid to rotational mechanical energy. Finally, rotational mechanicalenergy is converted to electricity by utilizing electric generators. Flywheelsor pressurized liquids can be used as an intermediate step in order toreduce the intermittencies of the wave power.
FIGURE 2.36 A schematic illustrating thefixation of Salter cam wave energy conversiondevice.
2.3.5.1.2.2 Near-shore ocean wave energy harvesting technologies
Nearshore topologies are applied within the surfing zone of the ocean orright on the shore. Nearshore applications have some advantages anddisadvantages in compare to the offshore applications.
Wave currents can be tapered into a narrow channel to increase theirpower and size in order to harness the wave energy. As shown in Fig. 2.37,waves can be channeled into a catch basin and used directly to rotate theturbines. Since this method requires building a reservoir to collect thewater coming with the waves to drive the turbine, it is more expensive incompare to the other buoyshaped offshore applications. However, itrequires less maintenance in compare to the offshore applications, sinceall components of the wave energy conversion system are located on land.Additionally, since a reservoir collects the ocean water, theintermittencies can be eliminated. This will create a convenient platformfor voltage and frequency regulation. Building these types of plants in thelocations, where they have regular and sustaining wave regimes, is moreadvantageous.
FIGURE 2.37 Channeled ocean wave to areservoir to spin the turbines.
Using oscillating water columns that generates electricity from the wavedriven rise and fall of water in a cylindrical shaft or pipe is another way toharness the wave energy. The air is driven into and out of the top of theshaft due to the rising and falling water, powering an airdriven turbinewhich is shown in Fig. 2.38.
FIGURE 2.38 Airdriven turbines using thewave power. (a) Upcoming wave starts filling thechamber, (b) air is compressed by rising water,and (c) air is pulled back by retreating waves[181].
The general structure of the near shore airdriven turbine is shown in Fig.2.38(a). Waves push the air through the ventilator which drives theelectrical machine as shown in Fig. 2.38(b). The wave retreats from thewave chamber inside the channel which decreases the pressure as shownin Fig. 2.38(c). This method is advantageous because of the capability ofusing not only wave power but also the power from the tidal motions.However, mechanical isolation should be provided within the wave andair chambers in order to obtain better efficiencies. This will also bringsome more cost and design complexity to the system.
2.3.5.2 Ocean tidal energy
The generation of electrical power from ocean tides is similar to thetraditional hydroelectric generation. A dam, known as a barrage, acrossan inlet is required for the simplest tidal power plants. In a tidal powerplant, usually a tidal pond created by a dam and a powerhouse, whichcontains a turbo generator, and a sluice gate to allow the bidirectionaltidal flow. During the flood tide, the rising tidal waters fill the tidal basinafter opening the gate of the dam. When the dam is filled to capacity, thegates are closed. The tidal basin is released through a turbo generatorafter the ocean waters have receded. Power can be generated during ebb
tide, flood tide, or both. When the water is pulled back ebb tide occurs,and when the water level increases near the shore flood tide happens[183]. Tidal power can be economical at sites where mean tidal rangeexceeds 16 ft. [183,184].
Tidal current is not affected by climate change, lack of rain, or snowmelt.Therefore, tidal energy harvesting is practical since the tidal current isregular and predictable. Moreover, environmental and physical impactsand pollution issues are negligible. Tidal power can additionally be usedfor water electrolysis for hydrogen production applications anddesalination. However, tidal power generation is an immature technology,which needs further investigations and developments.
Tidal turbines can be used for tidal energy harvesting, similar to the windturbines. Tidal turbines can be located where there is a strong tidal flow.These turbines have to be much stronger than wind turbines since thewater is about 800 times as dense as air. They will be heavier and moreexpensive; however, they will be able to capture more energy at muchhigher densities [181]. In Fig. 2.39, a typical tidal turbine is shown.
FIGURE 2.39 Tidal turbine.
Usually, tidal fences having multiple turbines are mounted in the entranceof channels which are affected by ocean tides. Tidal water is forced to passthrough a fence structure, which is called caisson in this fence application.Unlike barrage stations, basins are not required for fence applications andthey can be used in a channel between the mainland and a nearby offshore island, or between two islands. Tidal fences can be mounted at theentrance of channels that ocean water gets inside the land via a bay (Fig.2.40(a)), or between the main land and an island (Fig. 2.40(b)), or simplybetween two islands (as shown in Fig. 2.40(c)). Since they do not requireflooding the basin, tidal fences have much less impact on theenvironment. In addition, they are significantly cheaper to install;however, the caisson may disrupt the movement of large marine animalsand shipping [184].
FIGURE 2.40 Tidal fences can be mounted (a)at the entrance of bays, (b) between the mainland and an island, and (c) between two islands.
2.3.5.3 Power electronic interfaces for ocean energy harvesting applications
Both in ocean wave and ocean tidal energy harvesting applications, thegenerators may produce alternating currents and voltages that havevarying magnitude and frequency. Therefore, output power of the oceanenergy converters need further conditioning prior to the grid connection.In addition, the frequency of the output voltage should be regulated to bethe same as grid frequency. Output power conditioning, amplitude, phase,and frequency of the conversion system can be regulated by utilizingpower electronic converters.
Block diagram of a typical power conditioning system for a gridconnected ocean energy conversion system is shown in Fig. 2.41. Oceanwave or ocean tide potential and kinetic energies rotate the water turbineor a power absorber directly drives a linear generator with up and downmotions. The varying wave and tides result in variable frequency andamplitude of the generator output. The AC power produced by thegenerator is converted into DC power via threephase bridge rectifiersfollowed by a DC/AC inverter. The output of the DC/AC inverter generallycontains harmonics, which should be filtered. Finally, output power canbe connected to grid and transmitted to consumers after its voltage isincreased and isolated by a power transformer.
FIGURE 2.41 Grid connection and controls oftidal current power conditioning system.
During the intermittencies, power cannot be generated. Therefore, anenergy storage system should be connected to the generator output oroutput of a conversion stage in the power conditioning system. Storedenergy can be supplied to the grid during the intermittency periods.Hence, it is ensured that continual power is supplied to the grid.
2.3.6 Geothermal energy systems
Geothermal energy is the thermal energy that is stored in the inner layersof the Earth composed of rocks and fluids. The temperature of the innerlayers of the Earth gets hotter as the depth increases. In deeper layers it iseven extremely hotter due to the hot molten rock called magma [185,186].
Geothermal energy can be utilized by several methods. It can be used asdirect heat for electric power generation. In the direct heat utilization,applications can be categorized as hydrothermal, agricultural, orindustrial [187]. Hydrothermal resources have low to moderatetemperatures between 20 and 150 °C. These resources can be utilized toprovide direct heating for residential, industrial, and commercial sectors[188]. These applications include but not limited to water and space
heating, greenhouse and agricultural heating, cleaning, textile processes,and food dehydration. Agricultural production is one of the utilizationmethods of direct use of geothermal energy. It is used to warm thegreenhouses in order to provide cultivation. Industrial utilizationexamples can be food and cloth processing, manufacturing paper,pasteurizing milk, drying fish, vegetables and fruits, and even forrefrigeration and air conditioning.
Other than the direct use of geothermal energy, it can be used as the heatand steam source for electric power plants. Instead of burning fossil fuelsand generating heat for water boiling, geothermal power plants use thereadily obtained heat or steam. Natural hot water and/or steam from theinner layers of the Earth are used to drive the turbines and generators toproduce electricity. Absolutely, no fuel firing is required for heating orsteam generation for geothermal power plants. Therefore, geothermalpower plants do not have emissions and they are environmentally clean.Moreover, since the extracted heat is replaced by the thermal energy ofthe Earth's inner layers, geothermal energy is sustainable and renewable.
Schematic of a geothermal power plant is presented in Fig. 2.42.
FIGURE 2.42 A geothermal power plant.
The components of the geothermal power plant are described in Table 2.7.
Table 2.7
Geothermal Power Plant Components
1. Production well 7. Power transformer
2. Water‑steam mix 8. High voltage transmission lines
3. Separator 9. Condenser
4. Steam 10. Cooling tower
5. Steam turbine 11. Injection well
6. Generator 12. Water flow cycle
The operating principle of a geothermal power plant is very similar to thatof a coalfired power plant. However, in geothermal power plants hotsteam and/or water is obtained from the deeper Earth layers instead ofburning any fuel. Production well is used to draw hot water and/or steamfrom deeper layers. This mixture is separated by the separator in order toget the dry steam. Through a steam governor, a steam turbine is rotatedby this high pressure and high temperature steam. Since the steamturbine is coupled to an electric generator, the mechanical steam power isconverted into electric power. The output voltage of the generator isincreased by a power transformer. The high voltage output of the powertransformer can then be connected to the high voltage transmissionnetwork. The steam looses its temperature and pressure after it goesthrough the steam turbine. Thus, the output flow of the steam turbine iscondensed in the condensers. Condensed water is cooled down throughthe cooling tower and cool water helps condense the lowpressure/temperature steam in the condenser. The cooled water is theninjected back to the inner Earth layers to get hot again. If the geothermalfield is rich of hot water reservoirs, this cooled but still relatively warmwater can be used for other heating purposes.
Geothermal energy is abundant, secure, reliable, and a renewable sourceof energy. It has high availability and capacity factor in compare to otherrenewables. It is not a source of pollution for the environment, i.e., theirCO emissions are less than 0.2% of the cleanest fossil fuelfired powerplant, SO emissions are less than 1%, and particulate emissions are lessthan 0.1%. It has an inherent energy storage capability and requires verysmall land area for establishment [186].
Geothermal power plants can be classified into three main generationtechnologies; dry stream power plant, flash stream power plant, andbinary cycle power plant.
Dry steam power plants are the most common geothermal power plantssince they are simple and cost effective. These power plants are applicableto the geothermal fields where the geothermal steam is not mixed withwater. In this method, production wells are drilled down to the aquifer toget superheated and pressurized steam. This steam is brought to thesurface at high speeds. When the expanding steam passes through theturbine, the generator generates electricity [189,190]. The low pressuresteam output from the turbine is ventilated to the atmosphere in simplepower plants. However, exhaust steam from the turbine is condensed inmore complex power plants. The condensate can be reinjected to thereservoir by the injection wells and/or it can be used as makeup coolingwater.
Flash steam power plants use a flash steam technology where thehydrothermal source is in liquid form. This fluid is sprayed into a flashtank which is at a much lower pressure than the fluid. Therefore, the fluidimmediately vaporizes rapidly into steam [189,191]. This generated steamis used to rotate the steam turbines that are coupled to electric generators.
2
2
The production well is kept under high pressure in order to prevent thegeothermal fluid flashing inside the well [186]. Instead of using a singleflashing system, dualflashing systems are also used. The brine from thehigh pressure steam is piped into a lowpressure separator/flash tankwhere the pressure is additionally reduced to generate lower pressuresteam in the dualflash systems. In order to generate additional electricpower, this lower pressure steam is piped into a lower pressure stage ofthe turbine. The steam exhaust from the high and low pressure turbines iscondensed. Just like the dry steam plants, the condensate is then used asmakeup cooling water or reinjected to the reservoir.
Although the dualflash power plants have higher capital cost, they havehigher thermoelectric efficiency. Resource characteristics, power plantoutput, thermodynamic and economic factors, and equipment availabilityare the factors affecting the decision to build and operate a singleflash ordualflash geothermal power plants [192]. Generally, dualflash system ispreferred if the fluid temperature is between 175 and 260 °C, while singleflash systems are efficient enough for the fluid temperatures higher than260 °C.
Binary cycle power plants are preferred when the geothermal resource isinsufficiently hot to produce steam. Sometimes the resource may haveother chemical components causing impurities and flashing may notbecome possible [186,193]. In these cases binary cycle power plants arepreferred. In binary cycle geothermal power plants, isobutene,isopentane, or pentane is used as the secondary fluid which has a lowerboiling point than water. Since a separate working fluid is used, the cyclecalled “binary.” The geothermal fluid (water) is passed through a heatexchanger in order to heat up the secondary fluid. Secondary fluidvaporizes and expands through the turbines that are coupled to electricgenerators. After passing through the turbines, the working fluid iscondensed and recycled for the next cycle. Moreover, the fluid remainingin the tank of flash steam plants can be reutilized in binary cycle plants. Ina closedcycle system, all of the geothermal fluid is injected back to theground. Usually, binary cycle plants are more efficient than the flashplants in low to moderate temperatures of geothermal fluids.Furthermore, corrosion problems are avoided since a pure working fluidis used.
2.3.7 Nuclear power plants
In nuclear power plants, energy is extracted from atomic nuclei by thecontrolled nuclear reactions. There are several available methods such asnuclear fission, nuclear fusion, and radioactive decay. The most commonmethod is the nuclear fission. Similar to the conventional fossil fuelfiredpower plants, nuclear reactors generate heat in order to produce steam.However, unlike many conventional thermal power plants, nuclear powerplants convert the energy released from the atoms' nucleus generally vianuclear fission, instead of burning fossil fuels. This energy is used forsteam production which is utilized to operate the turbines that arecoupled to electric generators. In this way, the mechanical work of thehigh pressure steam is converted into electricity [194,195].
The fission of an atom occurs when a relatively large fissile atomic nucleussuch as uranium235 or plutonium239 absorbs a neutron. The atom isthen splitted by the fission into two or more smaller nuclei with kineticenergy, gamma radiation, and free neutrons [194]. Other fissile atomsmay absorb a portion of these neutrons and create more fission, whichrelease more neutrons, and so on [195]. By using neutron moderators andneutron poisons, this nuclear chain reaction can be controlled in order toadjust the potion of neutrons that will cause more fission. Manual orautomatic control systems are used for this purpose or to shut down thereactor if unsafe conditions are detected [196].
Heat generation by the reactor core from fission involves several stages.The kinetic energy of the fission products is converted into thermal energywhen a collision happens between the nuclei and nearby atoms. Thereactor absorbs some of the gamma radiation produced during fission inthe form of heat. Neutron absorption activates some materials and theradioactive decay of fission products produces heat. Even after the reactoris shut down, this decay heat source may remain for some time. A nuclearreaction can generate heat power that is 1,000,000 times that of the equalmass of coal.
After the fission process, the heat released from the reactor is removed bya cooling system. This heat is conveyed to another part of the power plant,in which the thermal energy is utilized to generate electricity. The hotcoolant in general is used as the heat source for a boiler. The boilergenerates the pressurized steam which mechanically drives the steamturbines. The steam turbines rotate the electrical generators [197]. Asimple operating schematic of a nuclear power plant is depicted in Fig.2.43.
FIGURE 2.43 A typical nuclear power plant.
By utilizing different coolants and fuels and integrating different controlmethodologies, many different reactor designs can be accomplished. Inorder to meet a specific need, some of these designs can be employed forvarious applications. Space and naval applications are some of thesespecific applications. In these applications, generally highly enricheduranium is used as the fuel which increases the reactors power density
(2.21)
and efficiency [198]. Currently, researchers are investigating new nuclearpower generation techniques, known as the Generation IV reactors. Thesenew designs will have the possibility to offer cleaner and more securefission reactors with less risk of the proliferation of nuclear weapons. Newdesigns such as ESBWR offer passively safe plants and other designs arebelieved to be almost foolproof are being pursued or are available to bebuilt [199]. In near future, it is expected that the fusion reactors will beviable, which will reduce or eliminate many safety risks associated withnuclear fission [200].
2.3.8 Fuel cell power plants
Since the beginning of twentyfirst century, fuel cell technology has beenrapidly developed and has shown an invasive improvement for theapplications ranging from portable electronic devices to vehicular powersystems andMW size power plants [201–203]. Fuel cells are promisingfuture energy conversion devices due to their high efficiency, excellentperformance, low or zero emissions, and wide application area.
Fuel cell power plants are electrochemical devices that produce electricalenergy directly from a chemical reaction. Fuel cells use fuel on the anodeside and oxidant on the cathode side. The chemical reaction occurs on theelectrolyte. The reactants, i.e., fuel and oxidant flow into the cell while thereaction product (water) flows out of the cell. Many fuel and oxidant typescan be used for fuel cells. Generally, hydrogen as the fuel and oxygen asthe oxidant, from the air, can be used. On the other hand, alcohols andhydrocarbons can be other fuel types for different fuel cells, while otheroxidants may be chlorine and chlorine dioxide [204–206].
Just like a battery, a fuel cell is composed of an electrolyte and a pair ofelectrodes. However, unlike the batteries the reactants are continuouslyreplenished during the operation, therefore, the cell is not required to berecharged. Ideally, fuel cells operate and continue to produce energy aslong as the reactants are appropriately supplied to the anode and cathodesides.
There are many kinds of fuel cells categorized by their electrolyte type.Most common fuel cell types are:
– Proton exchange membrane fuel cells (PEMFCs),
– Phosphoric acid fuel cells (PAFCs),
– Direct methanol fuel cells (DMFCs),
– Solid oxide fuel cells (SOFCs), and
– Molten carbonate fuel cells (MCFCs).
PEMFCs are generally used for residential, vehicular, and portableapplications. Solid electrolyte structure reduces the corrosion, they canoperate at low temperature and they have quick startup and fasterresponse times. PAFCs are typically used for transportation, heating, andelectric utility applications. They may reach high efficiency points inelectric cogeneration applications [207,208]. Currently, DMFCs areconsidered as a replacement alternative for batteries for small portabledevices' power requirements. DMFC can be considered advantageoussince methanol can be used directly without any reformer or fuelprocessor. However, they have relatively low efficiencies and slowresponse times since the reaction rate for the methanol is slow onpresently available catalysts. On the other hand, DMFCs can becompetitive with batteries since the simplicity, high storage density, andliquid methanol portability may compensate the relatively low efficiency[207]. MCFCs and SOFCs are generally used as large power plants forelectric utility applications. Both of these two technologies have higherefficiencies, fuel flexibility, and inexpensive catalysts [208]. However,they operate at really high temperatures generally between 600 and1000 °C. This high temperature issue avoids these two fuel celltechnologies to be best candidates for portable or vehicular applications.
Especially PEMFCs are considered to be one of the most promising fuelcell technologies among these nextgeneration fuel cell power plants. Thisis due to their high efficiency and compact structure [209,210]. Theoperating principle of PEMFCs is focused in this section.
The operating principle along with the basic components of a PEMFC ispresented in Fig. 2.44.
FIGURE 2.44 Components of a PEM fuel celland its operating principle.
After the fuel is supplied to the anode side, the fuel is oxidized resulting inreleasing electrons. The anode reaction for a fuel cell can be expressed as:
These released electrons are transported to the cathode side through anexternal circuit. The hydrogen protons are traveled through the protonexchange membrane to the cathode side. The oxidant (i.e., oxygen) isreduced at the cathode side, using the electrons coming from the external
(2.22)
(2.23)
circuit. Therefore, the cathode reaction is,
The hydrogen protons travel through the membrane, balance the flow ofelectrons through the external circuit. Therefore, the overall reactionequation becomes,
A typical singlefuel cell has a theoretical output voltage of 1.2 V. Theygenerate ideally 0.6 Å/cm . In order to reach higher voltage outputs froma fuel cell system, cells are connected in series in the form of a string. Forhigher current outputs the cells or the cell strings should be connected inparallel. Unfortunately, the output voltage of a fuel cell or a fuel cellsystem decreases as the current drawn from the fuel cell is increased. Thisvoltage drop at the fuel cell output is due to the ohmic, activation, andconcentration losses [211].
A typical currentvoltage characteristic curve of a fuel cell is shown in Fig.2.45, which is also known as the polarization curve.
The output voltage of a fuel cell is less then its theoretical value even inthe opencircuit conditions. This is due to the fact that the opencircuitvoltage is calculated based on the ideal burning enthalpy of the hydrogen.The activation loss is generally effective at the low current densities.Activation loss is due to the electrode kinetics in which theelectrochemical reaction of hydrogen and oxygen is slow. Activation losscauses a nonlinear voltage drop as the current starts to be drawn from thefuel cell. Ohmic losses are due to the electron flow through the electrolyteand electrodes and the equivalent resistance of the external circuit. Ohmiclosses are directly proportional to the current density and they increaselinearly as the current increases. Concentration losses are due to theinability of maintaining the initial fuel concentration on the electrodes.Fuel and oxidant should be supplied sufficiently and continuously inorder to meet sustained load demands. If the current is more than acertain value, fuel cell fails to meet the new power demand and the outputvoltage dramatically decreases. Therefore, this loss is quite severe at thehigh current densities.
Due to the polarization and currentvoltage characteristics of the fuelcells, power conditioning devices such as DC/DC and/or DC/ACconverters are required to maintain a fixed and stable DC voltage for theload bus. The power conditioning is also useful for converting the fuel celloutput to an appropriate magnitude and type. Power conditioning unit(PCU) not only controls the fuel cell output voltage but also it delivers ahigh power factor in gridconnected applications. PCU can reduce oreliminate the harmonics and help operating effectively under allconditions. A fuel cell power plant operating together with a PCU ispresented in Fig. 2.46.
FIGURE 2.46 A fuel cell power plant operationwith PCU.
In the stationary or vehicular applications, fuel cell power plant may notbe sufficient to satisfy all of the load demands [210]. Especially duringtransient load changes or peak demand periods, fuel cell needs to beoperated with an auxiliary power device such as battery packs or ultracapacitors. By operating fuel cell cascaded with batteries and/or ultracapacitors, steadystate, peak power demands, and transient load changescan be controlled more efficiently. In the topology of Fig. 2.47, the fuel cellpower plant is operated with auxiliary power devices.
FIGURE 2.47 Fuel cell power plant operationwith auxiliary power devices.
2.4 Other unconventional energy sources and generationtechnologiesThermal depolymerization is used to convert various waste products,usually, plastic and biomass, into light crude oil by using hydrouspyrolysis. Longchain polymers of oxygen, hydrogen, and carbondecompose into shortchain petroleum hydrocarbons once pressure andheat applied [212].
Oil sands can be in form of loose sand or partially consolidated sandstonecontaining naturally occurring mixtures of sand, clay, and water, andbitumen. The natural or crude bitumen is a highly viscous, sticky mixture,
2
and very thick that it will not flow unless heated of diluted with otherhydrocarbons such as condensed natural gas or light crude oil. Withadvanced techniques, the profitable extraction and processing can beenabled [213].
Syngas or synthetic gas is a fuel gas mixture that is composed of carbonmonoxide, carbon dioxide, and hydrogen. This mixture is used asintermediates in producing synthetic natural gas, methanol, or ammonia[214]. With the FischerTropsch process or with the Mobil methanol togasoline process, syngas is also used as intermediate in producingsynthetic petroleum for use as fuel or lubricant [215]. Syngas iscombustible and can be used in internal combustion engines as a fuel.However, the energy density is relatively lower.
Synthetic fuel, also known as synfuel, is a liquid fuel that is obtained fromsyngas [216]. By using FischerTropsch, synfuel can be produced throughmethanol or direct coal liquefaction.
Downdraft, also known as “energy tower” is a device that generateselectric power by spraying water on hot air at the top of the tower, makingthe cooled air fall through the tower and rotate a turbine at the tower'sbottom [217].
Magnetohydrodynamics is a technique that can harvest the energy ofelectrical currents that are induced as a result of moving conductive fluid.These induced currents also create electromagnetic forces on the fluid andalso changes the magnetic field itself [218].
Piezoelectricity is the electric charge that is induced in certain materialsin response to applied mechanical stress such as straining, squeezing,applying pressure, or flexing [219].
Other alternative energy generation techniques include sulfuriodinecycle, pyrolysis, osmotic power, vibration energy harvesting, andelectromagnetic energy harvesting. Some of the other alternative energycarriers include liquid nitrogen, ethanol, methanol, peat, and hydrogen.
SummaryIn order to meet the future energy requirements, the energy should begenerated and utilized wisely. Increasing the demand for energy,decreasing conventional fossil fuel energy sources, and environmentalconcerns are driving forces toward renewable energy sources. However,the conventional sources will be utilized until modern, clean, andrenewable technologies replace them. Therefore, a comprehensivestrategy that supports a diversity of resources over the next centuryshould be developed. Sustainable and longterm energy solutions innumerous forms are required to restructure the future's increasing energydemand.
References
[1] Key World Energy Statistics 2012, Report of Energy InformationAdministration, International Energy Annual 2012, Available online:http://www.iea.org/publications/freepublications/publication/kwes.pdf(http://www.iea.org/publications/freepublications/publication/kwes.pdf).
[2] Energy Consumption: Consumption per Capita, Technical Report bythe World Resources Institute, Available online:http://www.wri.org/(http://www.wri.org/).
[3] World per Capita Total Primary Energy Consumption, 1980‑2008,Report of Energy Information Administration, International EnergyAnnual 2014.
[4] International Energy Outlook 2008, Technical Report by the EnergyInformation Administration, Official Energy Statistics from the USGovernment, Available online:http://www.eia.doe.gov/(http://www.eia.doe.gov/).
[5] Energy Efficiency Measures and Technological Improvements, e Continuumof Action, Annual Activity Report 2007 to 2008 (e is an “EnergyOrganization” comprising 9 leading electricity companies from the G8countries). 2010.
[6] Coal Facts 2006 Edition with 2005 Data, Technical Annual Report ofWorld Coal Institute, 2006
[7] Yergin D. The Prize: The Epic Quest for Oil, Money, and Power. NewYork: Free Press; 1993.
[8] Official European Parliament Resolution on the Road Map for RenewableEnergy in Europe. 2007. September Available online:http://www.europarl.europa.eu(http://www.europarl.europa.eu).
[9] 2008 Buildings Energy Data Book. Prepared for the BuildingsTechnologies Program Energy Efficiency and Renewable Energy of USDepartment of Energy. D&R International Ltd.; 2008 Under Contract toNational Energy Technology Laboratory, November.
[10] Manufacturing Trend Data 1998 and 2002, Technical Report by theEnergy Information Administration, Official Energy Statistics from theUS Government, Available online:
[11] The WNA Market Report. The Global Nuclear Fuel Market: Supply andDemand 2007‑2030. World Nuclear Association (WNA); 2007 TechnicalReport by the.
[12] de Auza CR. Installed U.S. Wind Power Capacity Surged 45% in 2007.American Wind Energy Association Market Report; 2007 January.
[13] SEGS III, IV, V, VI, VII, VIII & IX, NEXTera Energy Sources,Available online:http://www.nexteraenergyresources.com/content/where/portfolio/contents/segs_viii.shtml(http://www.nexteraenergyresources.com/content/where/portfolio/contents/segs_viii.shtml)
[14] National Energy Survey of 2012, Technical Report by the EnergyInformation Administration, Official Energy Statistics from the USGovernment, Available online:http://www.eia.doe.gov/(http://www.eia.doe.gov/).
[15] 2008‑2017 Regional & National Peak Demand and Energy ForecastBandwidths. North American Electric Reliability Corporation (NERC);2008 Technical Report by the Load Forecasting Working Group of theReliability Assessment Subcommittee August.
[16] Russel G, Ann D. Oil officials see limit looming in production. WallStr. J. 2007 November 19.
[17] Devgan SS. Impact of environmental factors on the economic evaluation ofrenewable energy alternative generation. In: Proceedings of the 33rdSoutheastern Symposium on System Theory; 2001:123–126 March.
[18] World Consumption of Primary Energy by Energy Type and SelectedCountry Groups, 1980‑2004. Energy Information Administration, USDepartment of Energy; 2006 July.
[19] Natural Gas Reserves Summary as of December 31, 2007, TechnicalReport by the Energy Information Administration, Official EnergyStatistics from the US Government.
[20] Natural Gas and the Environment, Available online:http://www.naturalgas.org(http://www.naturalgas.org).
[21] Key World Energy Statistics 2012, Annual Technical Report of theInternational Energy Agency.
[22] Brower M. Cool Energy: Renewable Solutions to Environmental Problems.Cambridge, MA: The MIT Press; 1992 revised ed.
[23] Environmental Impacts of Renewable Energy Technologies. 2005 Briefingpaper of the Union of Concerned Scientists, August.
[24] World Nuclear Power Reactors. Uranium Information Center; 2007Technical Report of the.
[25] Nuclear Power in the World Today. Uranium Information Center; 2003Briefing Paper 7.
[26] Global Uranium Resources to Meet Projected Demand. InternationalAtomic Energy Agency; 2006 Latest Edition of ‘Red Book’ PredictsConsistent Supply up to 2025 June.
[27] International Energy Annual 2006. World Energy Reserves. OfficialEnergy Statistics from the US Government; 2008 Technical Report by theEnergy Information Administration Report released June‑December.
[28] International Energy Annual 2006. World Energy Consumption inStandard U.S. Physical Units. Official Energy Statistics from the USGovernment; 2008 Technical Report by the Energy InformationAdministration Report released June‑December.
[29] 2007 World PV Industry Reports. Annual World Solar PV IndustryReport by Marketbuzz™. 2008.
[30] Tester JW, Drake EM, Driscoll MJ, Golay MW, Peters WA. SustainableEnergy: Choosing Among Options. Cambridge, MA: The MIT Press; 2005.
[31] Hermann WA. Quantifying global exergy resources. J. Energy.2006;31(12):1685–1702.
[32] Global Wind Energy Markets. Global Wind Energy Council; 2008Technical Report by the February.
[33] Inoue A, Ali MH, Takahashi R, Murata T, Tamura J. A calculationmethod of the total efficiency of wind generator. 1595–1600. Proceedings ofthe Power Electronics and Drives Systems (PEDS). 2005;vol. 2 November.
[34] Brooke J. Engineering Committee on Oceanic Resources Working Group onWave Energy Conversion, Wave Energy Conversion. London: Elsevier; 2003.
[35] Thorpe TW. An overview of wave energy technologies, status,performance, and costs. In: Proceedings of the Wave Power: Moving TowardsCommercial Viability. 1999 London, November.
[36] Cruz J, Gunnar M, Barstow S, Mollison D, Cruz J. Green Energy andTechnology, Ocean Wave Energy. Berlin: Springer Science and BusinessMedia; 2008.
[37] Munk W, Wunsch C. Abyssal recipes II: energetics of tidal and windmixing. Deap Sea Res. 1998;45:1977–2010.
[38] Renewables, Global Status Report 2006. Technical Report by the REN21,Renewable Energy Policy Network for the 21st Century. 2006.
[39] Lennard DE. Ocean thermal energy conversion—past progress andfuture prospects. In: Management and Education Reviews; 381–391. IEEEProceedings on Physical Science, Measurement and Instrumentation. 1987;vol.134 May.
[40] Berger LR, Berger JA. Countermeasures to microbiofouling insimulated ocean thermal energy conversion with surface and deep oceanwaters in Hawaii. Appl. Environ. Microbiol. 1986;51(6):1186–1198.
[41] Meegahapola L, Udawatta L, Witharana S. The ocean thermal energyconversion strategies and analysis of current challenges. In: Proceedings of theInternational Conference on Industrial and Information Systems;2007:123–128 August.
[42] The Hydrogen Economy. Opportunities, Costs, Barriers, and R&DNeeds, Committee on Alternatives and Strategies for Future HydrogenProduction and Use. Washington, DC: National Research Council, andNational Academy of Engineering, National Academies Press; 2004.
[43] McCarthy J. Hydrogen. Stanford University; 1995. Available online:http://www‑formal.stanford.edu/jmc/progress/hydrogen.html(http://www‑
formal.stanford.edu/jmc/progress/hydrogen.html).
[44] Palmer D. Hydrogen in the Universe. NASA; 1997. Available online:http://imagine.gsfc.nasa.gov/(http://imagine.gsfc.nasa.gov/).
[45] Hydrogen as an Energy Carrier. Royal Belgian Academy Council ofApplied Science; 2006 Technical Report by the April.
[46] Lau F, Padro CEG. Advances in Hydrogen Energy. New Orleans:Springer; 2000.
[47] Rand DAJ, Dell RM. Hydrogen Energy: Challenges and Prospects.Cambridge, UK: Royal Society of Chemistry; 2008.
[48] World Energy Intensity. Total Primary Energy Consumption per Dollarof Gross Domestic Product using Purchasing Power Parities: 1980‑2004.Energy Information Administration; 2008 Technical Report by the Reportreleased December.
[49] All About Geothermal Energy. Washington, DC: Geothermal EnergyAssociation; 2007 February.
[50] The Future of Geothermal Energy. Impact of Enhanced GeothermalSystems (EGS) on the United States in the 21st Century. MassachusettsInstitute of Technology; 2006 Technical Report by the.
[51] Farigone J, Hill J, Tillman D, Polasky S, Hawthome P. Land clearingand biofuel carbon debt. Science. 2008;319:1235–1238.
[52] Searchinger T, Heimlich R, Houghton RA, Dong F, Amani A, FabiosaJ, Tokgaz S, Hayes D. Use of U.S. croplands for biofuels increasesgreenhouse gases through emission from land‑use change. Science.2008;319:1238–1240.
[53] Sonntag RE, Borgnakke C, Van Wylen GJ. Fundamentals ofThermodynamics. sixth ed. Haboken, NJ: Wiley; 2002.
[55] Wicks F, Maleszweski J, Wright C, Zarbnicky J. , Thermodynamicanalysis of an enhanced gas and steam cycle. In: Proceedings of the 37thIntersociety Energy Conversion Engineering Conference; 2004:456–459July.
[56] Beltracchi L. A direct manipulation for water‑based Rankine cycleheat engines. IEEE Trans. Syst. Man Cybern. 1987;17(3):478–487.
[57] Ratajczak TJ, Shahidehpour M. Emerging technologies for coal‑firedgeneration. In: Proceedings of the Power Engineering Society GeneralMeeting, Quebec, Canada; 2006:1–9 October.
[58] Net Generation by Energy Source by Type of Producer. US Department ofEnergy; 2008 Annual Electric Power Report of the Energy InformationAdministration December.
[59] Renewables, Global Status Report 2006 Update. Technical Report by theRenewable Energy Policy Network for the 21st Century. 2007 REN21.
[60] 21st Century Complete guide to Hydropower. Hydroelectric Power,
[64] US Department of Energy, Energy Efficiency and Renewable Energy,Solar Energy Technologies Program, PV Physics, Available online:http://www1.eere.energy.gov/solar(http://www1.eere.energy.gov/solar).
[65] US Department of Energy, Energy Efficiency and Renewable Energy,Solar Energy Technologies Program, PV Systems, Available online:http://www1.eere.energy.gov/solar(http://www1.eere.energy.gov/solar).
[66] Missouri Department of Natural Resources, Missouriʹs Solar EnergyResource, Available online: http://www.dnr.mo.gov(http://www.dnr.mo.gov).
[67] US Department of Energy, Energy Efficiency and Renewable Energy,Solar Energy Technologies Program, Concentrating solar power,Available online: http://www1.eere.energy.gov(http://www1.eere.energy.gov).
[68] Lasnier A, Ang TG. Photovoltaic Engineering Handbook. In: Bristol andNew York: Adam Hilger; 1990:69–97.
[69] US Department of Energy, Energy Efficiency and Renewable Energy,Solar Energy Technologies Program, Current‑voltage Measurements,Available online:http://www1.eere.energy.gov/solar(http://www1.eere.energy.gov/solar).
[70] Masoum MAS, Dehbonei H, Fuchs EF. Theoretical and experimentalanalyses of photovoltaic systems with voltage and current‑basedmaximum power‑point tracking. IEEE Trans. Energy Convers.2002;17(4):514–522.
[71] Koizumi H, Kurokawa K. A novel maximum power point trackingmethod for PV module integrated converter. In: IEEE 36th Power ElectronicsSpecialists Conference; 2005:2081–2086.
[72] Goswami Y, Kreith F, Kreder J. Principles of Solar EngineeringFundamentals of Solar Engineering. Philadelphia: Taylor&Francis; 1999.
[73] Canova A, Giaccone L, Spertino F. , Sun tracking for captureimprovement. In: Proceedings 22nd European Photovoltaic Solar EnergyConference (EUPVSEC); Milano: WIP Renewable Energies; 2007:3053–3058 September.
[74] Mohring HD, Klotz F, Gabler H. Energy yield of PV tracking systems.In: Proceedings of the 21st European Photovoltaic Solar EnergyConference (EUPVSEC); Dresden: WIP Renewable Energies; 2006:2691–2694 September.
[75] Aracil C, Quero JM, Castañer L, Osuna R, Franquelo LG. Trackingsystem for solar power plants. In: Proceedings of the IEEE 32nd AnnualConference in Industrial Electronics; 2006:3024–3029 November.
[76] M. Dominguez, I. Ameijeiras, L. Castaner, J.M. Wuero, A. Guerrero,L.G. Franquelo, A novel light source position sensor, Patent NumberP9901375.
[77] Pritchard DA. Sun tracking by peak power positioning forphotovoltaic concentrator arrays. IEEE Control Syst. Mag. 2003;3(3):2–8.
[78] Hohm DP, Ropp ME. Comparative study of maximum power pointtracking algorithms using an experimental, programmable, maximum powerpoint tracking test bed. In: Proceedings of the 28th IEEE PhotovoltaicSpecialists Conference; 2000:1699–1702.
[79] Hussein KH. Maximum photovoltaic power tracking: an algorithmfor rapidly changing atmospheric conditions. IEEE Proc. Transm. Distrib.1995;142(1):59–64.
[80] OʹSullivan D, Spruyt H, Crausaz A. PWM conductance control. In:Proceedings of the IEEE 19th Annual Power Electronics SpecialistsConference; 1988:351–359 vol. 1.
[81] Bangyin L, Shanxu D, Fei L, Pengwei X. Analysis and improvement ofmaximum power point tracking algorithm based on incremental conductancemethod for photovoltaic array. In: Proceedings of the IEEE 7th InternationalConference on Power Electronics and Drive Systems; 2007:637–641November.
[82] Hohm DP, Ropp ME. Comparative study of maximum power point
tracking algorithm. In: Proceedings of the 28th IEEE PhotovoltaicSpecialists Conference; 2000:1699–1702 September.
[83] Esram T, Chapman PL. Comparison of photovoltaic array maximumpower point tracking techniques. IEEE Trans. Energy Convers.2007;22(2):439–449.
[84] Femia N, Petrone G, Spagnuolo G, Vitelli M. Optimization of perturband observe maximum power point tracking method. IEEE Trans. PowerElectron. 2005;20(4):963–973.
[85] Enslin JHR, Snyman DB. Simplified feed‑forward control of the maximumpower point in PV installations. In: IEEE Industrial Electronics Conference;1992:548–553 vol. 1.
[86] Kislovski AS, Redl R. Maximum‑power‑tracking using positive feedback.In: IEEE 25th Power Electronics Specialists Conference; 1994:1065–1068vol. 2.
[87] Won CY, Kim DH, Kim SC, Kim WS, Kim HS. A new maximum powerpoint tracker of photovoltaic arrays using fuzzy controller. In: IEEE PowerElectronics Specialists Conference; 1994:396–403.
[88] Schoeman JJ, van Wyk JD. A simplified maximal power controller forterrestrial photovoltaic panel arrays. In: Proceedings of the 13th Annual IEEEPower Electronics Specialists Conference; 1982:361–367.
[89] Buresch M. Photovoltaic Energy Systems. New York: McGraw‑Hill;1983.
[90] Hart GW, Branz HM, Cox CH. Experimental tests of open loopmaximum power‑point tracking techniques. Sol. Cells. 1984;13:185–195.
[91] Patterson DJ. Electrical system design for a solar powered vehicle. In:Proceedings of the 21st Annual IEEE Power Electronics SpecialistsConference; 1990:618–622.
[92] Xiao W, Dunford WG. A modified adaptive hill climbing MPPT methodfor photovoltaic power systems. In: Proceedings of the 35th Annual IEEEPower Electronics Specialists Conference; 2004:1957–1963.
[93] Noh H‑J, Lee D‑Y, Hyun D‑S. An improved MPPT converter withcurrent compensation method for small scaled PV applications. In: Proceedingsof the 28th Annual Conference on Industrial Electronics Society;2002:1113–1118.
[94] Kobayashi K, Matsuo H, Sekine Y. A novel optimum operating pointtracker of the solar cell power supply system. In: Proceedings of the 35thAnnual IEEE Power Electronics Specialists Conference; 2004:2147–2151.
[95] Bekker B, Beukes HJ. Finding an optimal PV panel maximum power pointtracking method. In: Proceedings of the 7th AFRICON Conference inAfrica; 2004:1125–1129.
[96] Yuvarajan S, Xu S. Photo‑voltaic power converter with a simple maximum‑power‑point‑tracker. In: Proceedings of the 2003 International Symposiumon Circuits and Systems; 2003:III‑399–III‑402.
[97] Hilloowala RM, Sharaf AM. A rule‑based fuzzy logic controller for aPWM inverter in photo‑voltaic energy conversion scheme. In: Proceedings ofthe IEEE Industrial Application Society Annual Meeting; 1992:762–769.
[98] Won C‑Y, Kim D‑H, Kim S‑C, Kim W‑S, Kim H‑S. A new maximumpower point tracker of photovoltaic arrays using fuzzy controller. In:Proceedings of the 25th Annual IEEE Power Electronics SpecialistsConference; 1994:396–403.
[99] Senjyu T, Uezato K. Maximum power point tracker using fuzzy control forphotovoltaic arrays. In: Proceedings of the IEEE International Conferenceon Industrial Technologies; 1994:143–147.
[100] Yu G‑J, Jung M‑W, Song J, Cha I‑S, Hwang I‑H. Maximum powerpoint tracking with temperature compensation of photovoltaic for airconditioning system with fuzzy controller. In: Proceedings of the IEEEPhotovoltaic Specialists Conference; 1996:1429–1432.
[101] Simoes MG, Franceschetti NN, Friedhofer M. A fuzzy logic basedphotovoltaic peak power tracking control. In: Proceedings of the IEEEInternational Symposium on Industrial Electronics; 1998:300–305.
[102] Mahmoud AMA, Mashaly HM, Kandil SA, El Khashab H, NashedMNF. Fuzzy logic implementation for photovoltaic maximum power tracking.In: Proceedings of the 9th IEEE International Workshop on Robot HumanInteractive Communications; 2000:155–160.
[103] Patcharaprakiti N, Premrudeepreechacharn S. Maximum power pointtracking using adaptive fuzzy logic control for grid connected photovoltaicsystem. In: IEEE Power Engineering Society Winter Meeting; 2002:372–377.
[104] Wilamowski BM, Li X. Fuzzy system based maximum power point
tracking for PV system. In: Proceedings of the 28th Annual Conference inIEEE Industrial Electronics Society; 2002:3280–3284.
[105] Veerachary M, Senjyu T, Uezato K. Neural‑network‑basedmaximum‑power‑point tracking of coupled‑inductor interleaved‑boostconverter‑supplied PV system using fuzzy controller. IEEE Trans. Ind.Electron. 2003;50(4):749–758.
[106] Khaehintung N, Pramotung K, Tuvirat B, Sirisuk P. RISC‑microcontroller built‑in fuzzy logic controller of maximum power point trackingfor solar‑powered light‑flasher applications. In: Proceedings of the 30thAnnual Conference of the IEEE Industrial Electronics Society; 2004:2673–2678.
[107] Hiyama T, Kouzuma S, Imakubo T. Identification of optimaloperating point of PV modules using neural network for real timemaximum power tracking control. IEEE Trans. Energy Convers.1995;10(2):360–367.
[108] Ro K, Rahman S. Two‑loop controller for maximizing performanceof a grid‑connected photovoltaic‑fuel cell hybrid power plant. IEEE Trans.Energy Convers. 1998;13(3):276–281.
[109] Hussein A, Hirasawa K, Hu J, Murata J. The dynamic performance ofphotovoltaic supplied dc motor fed from DC‑DC converter and controlled byneural networks. In: Proceedings of the International Joint Conference onNeural Networks; 2002:607–612.
[110] Sun X, Wu W, Li X, Zhao Q. A research on photovoltaic energycontrolling system with maximum power point tracking. In: Proceedings of thePower Conversion Conference; 2002:822–826.
[111] Samangkool K, Premrudeepreechacharn S. Maximum power pointtracking using neural networks for grid‑connected system. In: Proceedings ofthe International Conference on Future Power Systems; 2005:1–4November.
[112] Zhang L, Bai Y, Al‑Amoudi A. GA‑RBF neural network basedmaximum power point tracking for grid‑connected photovoltaic systems. In:Proceedings of the International Conference on Power Electronics,Machines and Drives; 2002:18–23.
[113] Midya P, Krein PT, Turnbull RJ, Reppa R, Kimball J. Dynamicmaximum power point tracker for photovoltaic applications. In: Proceedings ofthe 27th Annual IEEE Power Electronics Specialists Conference;1996:1710–1716.
[114] Bodur M, Ermis M. Maximum power point tracking for low powerphotovoltaic solar panels. In: Proceedings of the 7th MediterraneanElectrotechnical Conference; 1994:758–761.
[115] Kitano T, Matsui M, Xu D‑H. Power sensor‑less MPPT control schemeutilizing power balance at DC link‑system design to ensure stability andresponse. In: Proceedings of the 7th Annual Conference of IEEE IndustrialElectronics Society; 2001:1309–1314.
[116] Matsui M, Kitano T, Xu D‑H, Yang Z‑Q. A new maximum photovoltaicpower tracking control scheme based on power equilibrium at DC link. In:Conference Record of the 1999 IEEE Industry Applications Conference;1999:804–809.
[117] Kjaer SB, Pedersen JK, Blaabjerg F. Power inverter topologies forphotovoltaic modules—a review. In: Proceedings of the IASʹ02 Conference;2002:782–788 vol. 2.
[118] Blaabjerg F, Chen Z, Kjaer SB. Power electronics as efficient interfacein dispersed power generation systems. IEEE Trans. Power Electron.2004;19(5):1184–1194.
[119] Meinhardt M, Cramer G. Past, present and future of grid connectedphotovoltaic‑ and hybrid‑power‑systems. In: Proceedings of the IEEE PowerEngineering Society Summer Meeting; 2000:1283–1288 vol. 2.
[120] Shimizu T, Hirakata M, Kamezawa T, Watanabe H. Generationcontrol circuit for photovoltaic modules. IEEE Trans. Power Electron.2001;16(3):293–300.
[121] Meinhardt M, Wimmer D. Multistring‑converter: the next step inevolution of string‑converter technology. In: Proceedings of the EPEʹ01Conference, Graz, Austria; 2001.
[122] Bose BK, Szczeny PM, Steigerwald RL. Microcomputer control of aresidential photovoltaic power conditioning system. IEEE Trans. Ind.Appl. 1985;21(5):1182–1191.
[123] Lindgren B. Topology for decentralized solar energy inverters with a lowvoltage ac‑bus. In: Proceedings of the European Conference on PowerElectronics and Applications; 1999.
[124] Kjaer SB, Blaabjerg F. A novel single‑stage inverter for AC‑module with
reduced low‑frequency ripple penetration. In: Proceedings of the 10thEuropean Conference on Power Electronics and Applications; 2003:2–4.
[125] Lohner A, Meyer T, Nagel A. A new panel‑integratable inverter conceptfor grid‑connected photovoltaic systems. In: Proceedings of the ISIEʹ96Conference; 1996:827–831 vol. 2.
[126] Dorofte C. Comparative Analysis of Four dc/dc Converters forPhotovoltaic Grid Interconnection & Design of a dc/dc Converter forPhotovoltaic Grid Interconnection. Aalborg, Denmark: Aalborg University;2001 Technical Report.
[127] Chiang SJ. Design and Implementation of Multi‑Functional BatteryEnergy Storage Systems. Hsin‑Chu, Taiwan: National Tsing HuaUniversity; 1994 Ph.D. Dissertation, Dep. Elect. Eng. ROC.
[128] Liaw CM, Chen TH, Chiang SJ, Lee CM, Wang CT. Small batteryenergy storage system. IEEE Proc. Electr. Power Appl. 1993;140(1):7–17.
[129] Holttinen H, Meibom P, Orths A, Van Hulle F, Ensslin C, HofmannL, McCann J, Pierik J, Tande JO, Estanquerio A, Soder L, Strbac G,Parsons B, Smith JC, Lemstrom B. Design and operation of power systemswith large amounts of wind power, first results of IEA collaboration. In:Proceedings of the Global Wind Power Conference, Adelaide, Australia;2006 September 18‑21.
[130] World Wind Energy Association. Germany: Bonn; 2008 Press Release,February 21.
[131] Danish Wind Power Association, Available online:http://www.windpower.org/en(http://www.windpower.org/en).
[132] Betz A. Introduction to the Theory of Machines. Oxford, UK: Oxford‑Pergamon Press; 1966.
[133] Ahmed NA, Miyateke MA. A Stand‑alone hybrid generation systemcombining solar photovoltaic and wind turbine with simple maximum powerpoint tracking control. In: Proceedings of the 5th International PowerElectronics and Motion Control Conference; 2006:1–7 vol. 1, August.
[134] Hendershot JR, Miller TJE. Design of Brushless Permanent‑MagnetMotors. England: Oxford Magna Physics Publications; 1994.
[135] Woo Lee H. Advanced Control for Power Density Maximization of theBrushless DC generator. Texas: University of Arlington; 2003 Ph.D.Dissertation.
[136] Khan MA, Pillay P, Malengret M. Impact of direct‑drive WEC systemson the design of a small PM wind generator. In: Proceedings of the IEEEBologna Power Tech Conference; 2003:7 vol. 2, June.
[137] Soderlund L, Eriksson J‑T, Salonen J, Vihriala H, Perala R. Apermanent‑magnet generator for wind power applications. IEEE Trans.Magn. 1996;32:2389–2392.
[138] Tog Inge Reigstad. Direct Driven Permanent Magnet SynchronousGenerators with Diode Rectifiers for Use in Offshore Wind Turbines.Norwegian University of Science and Technology Department ofElectrical Power Engineering; 2007 Ph.D. Dissertation June.
[139] Li H, Chen Z. Optimal direct‑drive permanent magnet wind generatorsystems for different rated wind speeds. In: Proceedings of the EuropeanConference on Power Electronics and Applications; 2007:1–10 September.
[140] Grauers A. Design of Direct‑Driven Permanent‑Magnet Generators forWind Turbines. Goteburg: Chalmers University of Technology; 1996 Ph.D.Dissertation.
[141] Marques J, Pinheiro H, Gründling HA, Pinherio JR, Hey HL. Asurvey on variable‑speed wind turbine system. In: Cientifico Greater Forum ofBrazilian Electronics of Power, COBEPʹ03, Cortaleza; 2003:732–738.
[142] Neam MM, El‑Sousy FFM, Ghazy MA, Abo‑Adma MA. The dynamicperformance of an isolated self‑excited induction generator driven by a variable‑speed wind turbine. In: Proceedings of the International Conference onClean Electric Power; 2007:536–543 May.
[143] Kumar GS, Kishore A. Dynamic analysis and control of output voltage ofa wind turbine driven isolated induction generator. In: Proceedings of theIEEE International Conference on Industrial Technology; 2006:494–499December.
[144] Orabi M, Youssef MZ, Jain PK. Investigation of self‑excited inductiongenerators for wind turbine applications. In: Proceedings of the CanadianConference on Electrical and Computer Engineering; 2004:1853–1856 vol.4, May.
[145] Seyoum D, Rahman MF, Grantham C. Inverter supplied voltage controlsystem for an isolated induction generator driven by a wind turbine. In:Proceedings of the Industry Applications Conference (38th IAS AnnualMeeting); 2003:568–575 vol. 1, October.
[146] Muljadi E, Sallan J, Sanz M, Butterfield CP. Investigation of self‑excitedinduction generators for wind turbine applications. In: Proceedings of theIEEE Industry Applications Conference (34th IAS Annual Meeting);1999:509–515 vol. 1, October.
[147] Ahmed T, Noro O, Matsuo K, Shindo Y, Nakaoka M. Wind turbinecoupled three‑phase self‑excited induction generator voltage regulation schemewith static VAR compensator controlled by PI controller. In: Proceedings ofthe International Conference on Electrical Machines and Systems;2003:293–296 vol. 1, November.
[148] Ahmed T, Noro O, Hiraki E, Nakaoka M. Terminal voltageregulation characteristics by static Var compensator for a three‑phase self‑excited induction generator. IEEE Trans. Ind. Appl. 2004;40:978–988.
[149] Qiao W, Veneyagamoorthy GK, Harley RG. Real‑time implementationof a STATCOM on a wind farm equipped with doubly fed induction generators.In: Proceedings of the IEEE Industry Applications Conference (41st IASAnnual Meeting); 2006:1073–1080 vol. 2, October.
[150] Elder JM, Boys JT, Woodward JL. The process of self‑excitation ininduction generators. IEEE Proc. B. 1983;130:103–108.
[151] Chan TF, Nigim KA, Lai LL. Voltage and frequency control of self‑excited slip‑ring induction generators. IEEE Trans. Energy Convers.2004;19:81–87.
[152] Abolhassani MT, Toloyat HA, Enjeti P. Stator flux‑oriented control ofan integrated alternator/active filter for wind. In: Proceedings of the IEEEInternational Electric Machines and Drives Conference; 2003:461–467 vol.1, June.
[153] Kim E‑H, Oh S‑B, Kim Y‑H, Kim C‑S. Power control of a doubly fedinduction machine without rotational transducers. In: Proceedings of thePower Electronics and Motion Control Conference; 2000:951–955 vol. 2,August.
[154] Azaza H, Masmoudi A. On the dynamics and steady state performanceof a vector controlled DFM drive systems. In: Proceedings of the IEEEInternational Conference on Man and Cybernetics; 2002:6 vol. 6, October.
[155] Tapia A, Tapia G, Ostolaza JX, Saenz JR. Modeling and control of awind turbine driven DFIG. IEEE Trans. Energy Convers. 2003;18:194–204.
[156] Jiao L, Ooi B‑T, Joos G, Zhou F. Doubly‑fed induction generator(DFIG) as a hybrid of asynchronous and synchronous machines. Electr.Power Syst. Res. 2005;76:33–37.
[157] Muller S, Diecke M, De Doncker RW. Doubly fed inductiongenerator systems for wind turbines. IEEE Ind. Appl. Mag. 2002;8:26–33.
[158] Pena R, Clare JC, Asher GM. A doubly fed induction generatorusing back‑to‑back PWM converters supplying an isolated load from avariable speed wind turbine. IEEE Proc. Electr. Power Appl. 1996;143:380–387.
[159] Xu L, Tang Y. Stator field oriented control of doubly‑excited inductionmachine in wind power generation system. In: Proceedings of the 25th MidWest Symposium on Circuit and Systems; 1992:1449–1466 August.
[160] Xu L, Cheng W. Torque and reactive power control of a doubly fedinduction machine by position sensorless scheme. IEEE Trans. Ind. Appl.1995;31:636–642.
[161] Doradla S, Chakrovorty S, Hole K. Anew slip power recoveryscheme with improved supply power factor. IEEE Trans. Power Electron.1988;3:200–207.
[162] Pena R, Clare J, Asher G. Doubly fed induction generator usingback‑to‑back PWM converters and its application to variable‑speed wind‑energy conversion. IEEE Proc. Electr. Power Appl. 1996;143:231–241.
[163] Tang Y, Xu L. A flexible active and reactive power control strategyfor a variable speed constant frequency generating systems. IEEE Trans.Power Electron. 1995;10:472–478.
[164] Feijo A, Cidrs J, Carrillo C. Third order model for the doubly‑fedinduction machine. Electr. Power Syst. Res. 2000;56:121–127.
[165] Chowdhury BH, Chellapilla S. Double‑fed induction generatorcontrol for variable speed wind power generation. Electr. Power Syst. Res.2006;76:786–800.
[166] Sanchez JA, Veganzones C, Martinez S, Blazquez F, Herrero N,Wilhelmi JR. Dynamic model of wind energy conversion systems withvariable speed synchronous generator and full‑size power converter forlarge‑scale power system stability studies. Renew. Energ. 2008;33:1186–1198.
[167] Bouscayrol A, Delarue P, Guillaud X. Power strategies formaximum control structure of a wind energy conversion system with a
[168] Raina G, Malik OP. Variable speed wind energy conversion usingsynchronous machine. IEEE Trans. Aerosp. Electron. Syst. 1985;21:100–105.
[169] Raina G, Malik OP. Wind energy conversion using a self‑excitedinduction generator. IEEE Trans. Power App. Syst. 1983;102:3933–3936.
[170] Borowy B, Salameh Z. Dynamic response of a stand alone windenergy conversion system with battery energy storage to a wind gust.IEEE Trans. Energy Convers. 1997;12:73–78.
[171] Chen Z, Spooner E. Grid power quality with variable speed windturbine. IEEE Trans. Energy Convers. 2001;16:148–154.
[172] Baroudi JA, Dinavahi V, Knight AM. A review of power convertertopologies for wind generators. In: IEEE International Conference on ElectricMachines and Drives; 2005:458–465 May.
[173] Enslin JHR, Knijp J, Jansen CPJ, Bauer P. Integrated approach tonetwork stability and wind energy technology for on‑shore and offshoreapplications. In: Power Quality Conference; 2003:185–192 May.
[174] Ran L, Bumby JR, Tavner PJ. Use of turbine inertia for power smoothingof wind turbines with a DFIG. In: Proceedings of the 11th InternationalConference on Harmonics and Quality Power; 2004:106–111 September.
[175] Strunz K, Brock EK. Hybrid plant of renewable stochastic source andmultilevel storage for emission‑free deterministic power generation. In:Proceedings of the Quality and Security Electric Power Delivery SystemsCIGRE/IEEE PES International Symposium; 2003:214–218 October 8‑10.
[176] Barton JP, Infield DG. Energy storage and its use with intermittentrenewable energy. IEEE Trans. Energy Convers. 2004;19:441–448.
[177] Cardenas R, Pena R, Asher G, Clare J. Power smoothing in windgeneration systems using a sensorless vector controlled inductionmachine driving a flywheel. IEEE Trans. Energy Convers. 2004;19:206–216.
[178] Abbey C, Joos G. Supercapacitor energy storage for wind energyapplications. IEEE Trans. Ind. Appl. 2007;43:769–776.
[179] Ocean Energy: Technology Overview, Renewable DevelopmentInitiative, Available online:http://ebrdrenewables.com/sites/renew/ocean.aspx(http://ebrdrenewables.com/sites/renew/ocean.aspx).
[180] Jones WJ, Ruane M. Alternative Electrical Energy Sources for Maine.MIT Energy Laboratory; 1977 Appendix I, Wave Energy Conversion by J.Mays, Report No. MIT‑E1 77‑010 July.
[181] Ocean Energy. Report of the US Department of Interior MineralsManagement Service. 2007.
[182] Wolfbrandt A. Automated design of a linear generator for waveenergy converters—a simplified model. IEEE Trans. Magn.2007;42(7):1812–1819.
[183] Ocean Energy: Technology Overview, Renewable DevelopmentInitiative, Available online:http://ebrdrenewables.com(http://ebrdrenewables.com).
[184] Dixon DA. Fish and the Energy Industry, EPRI (Electric Power ResearchInstitute). ASMFC Energy Development Workshop; 2006 Research ReportOctober.
[185] Geothermal Energy. Power from the Depths. US Department ofEnergy; 1997 Technical Report by NREL for DOE/Gp‑10097‑518 FS18,December 8.
[186] Sheth S, Shahidehpour M. Geothermal energy in power systems. In:Proceedings of the IEEE Power Engineering Society General Meeting;2004 vol. 2, June.
[187] Renewable Energy into the Mainstream, International Energy Agency(IEA). Netherlands: Renewable Energy Working Party; 2002 October.
[188] M.H. Dickson, M. Fanelli, Instituto di Geoscienze e Georisorse, Pisa,Italy, Available online:http://iga.igg.cnr.it/geothermal.php(http://iga.igg.cnr.it/geothermal.php).
[189] Braun GW, McCluer HK. Geothermal power generation in UnitedStates. Proc. IEEE. 1993;81(3):434–448.
[190] Geothermal Energy Assessment, The World Bank Group, Availableonline:http://www.worldbank.org/html/fpd/energy/geothermal/assessment(http://www.worldbank.org/html/fpd/energy/geothermal/assessment).
[191] Clean Energy Basics: Introduction to Geothermal EnergyProduction, NREL, http://www.nrel.gov/energy(http://www.nrel.gov/energy).
[192] Short WP. Trends in the American geothermal energy industry.
[193] Geothermal Energy Facts, Advanced Level, Geothermal EducationOffice, Available online:http://www.geothermal.marin.org/geoenergy(http://www.geothermal.marin.org/geoenergy).
[194] DoE Fundamentals Handbook. Nuclear Physics and Reactor Theory.US Department of Energy; 1993 vol. 1‑2 FSC‑6010, January.
[195] Bodansky D. Nuclear Energy: Principles, Practices, and Prospects.second ed. Berlin: Springer; 2008.
[197] Hore‑Lacy I. Nuclear Energy in the 21st Century: World NuclearUniversity Press. first ed. London, UK: Academic Press; 2006.
[198] Ma C, von Hippel F. Ending the production of highly enriched uraniumfor naval reactors. James Martin Center for Nonproliferation; 2001 TheNonproliferation Review.
[199] Hinds D, Maslak C. Next‑Generation Nuclear Technology: The ESBWR.In: American Nuclear Society, Nuclear News; 2006:35–40 January.
[200] Perkins J. Fusion Energy: The Agony, the Ecstasy, and Alternatives.1997. November http://PhysicsWorld.com(http://PhysicsWorld.com) Available
[202] Fuel Cell Handbook. fifth ed. Morgantown, WV: US Department ofEnergy, Office of Fossil Energy, National Energy Technology Laboratory;2000.
[203] Anahara R, Yokokawa S, Sakurai M. Present status and future‑prospects for fuel‑cell power‑systems. Proc. IEEE. 1993;81:399–408.
[204] Meibuhr SG. Electrochim Acta. 1966;11:1301.
[205] Larminie J. Fuel Cell Systems Explained. second ed. West Sussex,England: SAE International; 2003.
[206] Appleby AJ. Fuel cell. In: McGraw‑Hill Encyclopedia of Science &Technology. ninth ed. New York: McGraw‑Hill; 2002:549–552 v. 7.
[207] Ellis MW, Von Spakovsky MR, Nelson DJ. Fuel cell systems:efficient, flexible energy conversion for the 21st century. Proc. IEEE.2001;89(12):1808–1818.
[208] Rahman S. Fuel cell as a distributed generation technology. In:Proceedings of the IEEE Power Engineering Society Meeting; 2001:551–552 vol. 1, June.
[209] Gao L, Jiang Z, Dougal RA. An actively controlled fuel cell/batteryhybrid to meet pulsed power demands. J. Power Sources. 2004;130(1‑2):202–207.
[210] Uzunoglu M, Alam MS. Dynamic modeling, design, and simulationof a combined PEM fuel cell and ultracapacitor systems for stand‑aloneresidential applications. IEEE Trans. Energy Convers. 2006;21(3):767–775.
[211] Yu X, Starke MR, Tolbert LM, Ozpineci B. Fuel cell powerconditioning for electric power applications: a summary. IET Electr. PowerAppl. 2007;1(5):643–656.
[212] Midgett J. Assessing a Hydrothermal Liquefaction Process using BiomassFeedstocks. Department of Biological and Agricultural Engineering,Louisiana State University; 2008. M.Sc. Thesis May Available online:http://etd.lsu.edu/docs/available/etd‑01162008‑150910/unrestricted/jasonmidgettthesis.pdf(http://etd.lsu.edu/docs/available/etd‑
[213] Attanasi ED, Meyer RF. Natural Bitumen and Extra‑Heavy Oil, Surveyof Energy Resources. 22nd ed. London, UK: World Energy Council; 2010.
[214] Beychok MR. Process and Environmental Technology for Producing SNGand Liquid Fuels. 1975 U.S. EPA Report, EPA‑660/2‑75‑011, May.
[215] Kaneko T, Derbyshire F, Makino E, Gray D, Tamura M. CoalLiquefaction, Ullmannʹs Encyclopedia of Industrial Chemistry. Berlin: Wiley‑VCH; 2001.
[216] Patel P. A comparison of coal and biomass as feedstocks forsynthetic fuel production. Alternative Energy Sources: An InternationalCompendium. MIT Technology Review; 2007.
[217] Carlson PR. Power Generation Through Controlled Convection