Chapter 2 Literature Review 46 Page Numbers 2.1 Dental fluorosis 2.1.1 History of dental fluorosis 47-48 2.1.2 Mechanism of dental fluorosis 48-50 2.1.3 Clinical features of dental fluorosis 50-52 2.1.4 Classification of dental fluorosis 52-53 2.1.5 Endemic areas of the world 54 2.2 Diagnosis of Dental fluorosis 2. 2.1 Indices used to diagnose dental fluorosis 55 2.2.2 Dean’s Index 56-58 2.2.3 Thylstrup and Fejerskov Index 58-61 2.3 Magnitude of fluorosis problem in Karnataka and India 61-63 2.4 Studies on dental fluorosis and fluoride in drinking water 64-66 2.4.1 Studies on dental fluorosis prevalence in low fluoride levels 67-69 2.5 Dental fluorosis and urinary fluoride levels 70-71 2.6 Studies on j owar and fluorosis 71-75 2.6.1 Effect of different cereals on fluoride deposition in bone 75-76 2.7 Fluoride interactions with molybdenum 76-79 2.8 Justification of Study 79
Transcript
Chapter 2 Literature Review
46
Page Numbers
2.1 Dental fluorosis
2.1.1 History of dental fluorosis 47-48
2.1.2 Mechanism of dental fluorosis 48-50
2.1.3 Clinical features of dental fluorosis 50-52
2.1.4 Classification of dental fluorosis 52-53
2.1.5 Endemic areas of the world 54
2.2 Diagnosis of Dental fluorosis
2. 2.1 Indices used to diagnose dental fluorosis 55
2.2.2 Dean’s Index 56-58
2.2.3 Thylstrup and Fejerskov Index 58-61
2.3 Magnitude of fluorosis problem in Karnataka and India 61-63
2.4 Studies on dental fluorosis and fluoride in drinking water 64-66
2.4.1 Studies on dental fluorosis prevalence in low fluoride levels 67-69
2.5 Dental fluorosis and urinary fluoride levels 70-71
2.6 Studies on jowar and fluorosis 71-75
2.6.1 Effect of different cereals on fluoride deposition in bone 75-76
2.7 Fluoride interactions with molybdenum 76-79
2.8 Justification of Study 79
Chapter 2 Literature Review
47
2.1 Dental fluorosis
Dental fluorosis is a disturbance in the tooth formation caused by the
excessive ingestion of fluoride during the formative period of the dentition (62).
The dental fluorosis has been classified by World Health Organization under
nomenclature of International classification of diseases in the Chapter XI: Diseases
of the digestive system, sub-chapter: Diseases of oral cavity, salivary glands and
jaws (K00-K14)
(K00.3) Mottled teeth
Dental fluorosis
Mottling of enamel
2.1.1 HISTORY OF DENTAL FLUOROSIS
The history of dental fluorosis can be divided into three distinct periods. The
first period is from 1901-1933 which was concerned with the cause of a
developmental enamel defect, described in the United States initially by Frederick
McKay and was called “Colorado Brown Stain”. This defect was later identified as
“mottled enamel” or more specifically, chronic endemic enamel fluorosis (63).
The second period from 1933-1945, encompassing, the classical
epidemiological studies of H T Dean, focused on the relationship between
naturally occurring fluoride concentration in drinking water, enamel fluorosis and
dental caries. Later, on considering the preventive benefits achieved by fluoride
and risks of dental fluorosis, the limits of optimal fluoridation were set between 0.7
and 1.2 ppm fluoride in drinking. The third period, designated as the “moment of
truth in fluoridation history” by Frank McClure began on January 25th, 1945, till
Chapter 2 Literature Review
48
date, when Grand Rapids, Michigan, USA, became the first city in the world to
adjust its water fluoride concentration to a level expected to promote dental
health (63).
2.1.2 MECHANISM OF DENTAL FLUOROSIS
It has been established that the hypo mineralized alterations of fluorotic
enamel are not due to general effects of fluoride on the calcium metabolism, or
due to the poisoning effects that depress the fluoride metabolism, but are primarily
due to in-situ effects of the fluoride in the local environment (tooth bud). The
fluoresced enamel retains a relatively high proportion of immature matrix proteins
(high proline contents) (3, 4). An incomplete removal of amelogenin proteins
under influence of fluoride during tooth development leads to fluorosis. Whitford
(64-70) stated that "although several other fluoride-induced effects might be
involved in the etiology of fluorosis, it now appears that inhibition of enzymatic
degradation of amelogenins, which delays, their removal from the developing
enamel, is the most accepted reason.
Proposed molecular mechanism involved in formation of fluorotic enamel
Effect of fluoride on enamel crystals
Enamel apatite is primarily consists of hydroxyapatite crystals, which is formed from
This change in pH could cause amelogenins to aggregate and prevents the
diffusion of the protein out of the maturing enamel (enamel proteins are more
soluble in acidic conditions but form insoluble aggregates in neutral solutions). The
second effect of fluoride on enamel is the promotion of hydroxyapatite crystal
growth having more thickness than height to trap matrix protein and hence
prevent their efficient removal during maturation (64-70).
Figure 2.1 Schematic illustrations of the events relevant to early enamel mineralization. (70)
Chapter 2 Literature Review
50
Effect of fluoride on enamel proteinases
In mature enamel, crystals replace the enamel matrix. Proteolytic enzymes
are believed to be important in removal of enamel matrix protein. Enzymes such
as metallo and serine proteinases are responsible for degradation of enamel
proteins. Fluoride inhibits these enzymes, which are active only in mature enamel.
Effect of fluoride on ameloblast and its metabolism
The significant proportions of enamel proteins are removed by endocytosis
involving lysosomal enzyme. These enzymes (dipeptidase) are inhibited by
fluoride, thereby causing the amelogenins to accumulate in the extracellular
spaces of enamel matrix. Fluoride also acts by stimulating the secreting
ameloblast, resulting in an excess production of enamel matrix protein, which is
then retained in the mature enamel.
2.1.3 CLINICAL FEATURES OF DENTAL FLUOROSIS
The most critical period for the development of fluorosis in permanent
dentition is during the latter stages of pre-eruptive tooth development. Ishil and
Suckling (9) have observed that the critical exposure period for the development
of permanent dentition is between 11 months and seven years of age. Excessive
ingestion of fluoride after seven years will not cause dental fluorosis.
Fluoride has been assigned as the single most factor for causing enamel
mottling (71). Thus, the differential diagnosis of enamel fluorosis from non-fluorotic
enamel defects is critical for accurate assessment of the prevalence of dental
fluorosis (72-76). The clinical appearance of milder forms of the enamel fluorosis is
characterized by narrow white lines following the perikymata, cuspal snow-
Chapter 2 Literature Review
51
capping, and a snow flaking appearance that lack a clear border with
unaffected enamel (73, 77).
The corresponding enamel lesion is featured histopathologically as a
subsurface hypo mineralized lesion covered by a well-mineralized outer enamel
layer (78-79). Electron microscopy further confirmed that the structural
arrangement of the crystals appears normal; however widening gaps between
the enamel rods and enlarged inter-crystalline spaces are noticed, leading to
porosity in the enamel structure (78).
With increasing severity, the subsurface enamel, all along the tooth
becomes more porous. As the fluoride content increases the lesion extends
towards the inner enamel. After eruption, the opaque areas may become stained
yellow to dark brown, and the more severe forms are subjected to extensive
mechanical breakdown (attrition of the surface) (80-82). It is now widely
accepted that pitting and larger surface destructions of enamel, are post-eruptive
features, and not true hypoplasia of the teeth (75, 77, 83-87).
It has been shown that there are individual variations in fluorosis
manifestation for similar water fluoride intake between and within the populations
(88). The manifestations of dental fluorosis depend upon the amount ingested, the
duration of exposure and the age of the subject (62, 88). The teeth which form
and mineralize early in life are those that are least affected especially mandibular
incisors, permanent first molars and deciduous teeth, whereas the teeth which
mineralize later in life are the most severely affected.
Chapter 2 Literature Review
52
Post eruptive changes of fluorosis
In milder forms of dental fluorosis, mechanical attrition will occur over time
which causes an apparent “remissions” of the lesions. These lesions occur most
likely, due to the surface enamel demineralization (89). This may give the
impression that incisal area is more affected than the remaining surfaces, which in
reality is equally porous. Hence, this incisal/cuspal tip part is more susceptible to
attrition and has a strong tendency to absorb stains (90). The uptake of stain will
depend on the degree of porosity and this discoloration in itself, is not an
appropriate measure of severity. This post eruptive damage may increase over
the time depending on the degree of severity at the time of eruption.
2.1.4 CLASSIFICATION OF DENTAL FLUOROSIS
Dean (91) described the grades of endemic mottled enamel, which were
associated with varying levels of fluoride in the drinking water. The classification
was based upon the degree of severity of the defects.
Chapter 2 Literature Review
53
1. Normal enamel: The enamel is translucent,
smooth and presents a glossy appearance.
2. Questionable mottling: Normal enamel, but
translucency is varied by a few white flecks
or white spots.
3. Very mild mottling: Small, opaque, paper-
white areas are scattered over the teeth,
involving less than 25 percent of the tooth
surface. Summits of the cusps of bicuspids
and second molars are commonly affected.
4. Mild mottling: The white opaque areas are
more extensive but do not involve more than
50 percent of the surface and faint brown
stains are sometimes apparent.
5. Moderate mottling: All enamel surfaces are
affected and those which are subjected to
attrition, show marked wear. Brown stain is a
frequent disfiguring feature.
6. Severe mottling: Severe hypoplasia affects
the form of the tooth. Stains are wide spread
and vary in intensity from deep brown to black
and the teeth often present a corroded
appearance.
Figure 2.2 Different grades of dental
fluorosis
Chapter 2 Literature Review
54
2.1.5 Endemic Areas of World
Endemic dental fluorosis is prevalent in areas where the drinking water
contains elevated levels of fluoride, seen in most parts of Africa and Asia (92). It is
extremely difficult to state exactly how many people are affected, but an
approximate estimate would be about 100 million, worldwide. However,
concentrations as high as 95 ppm have been recorded in Tanzania and the
highest natural fluoride concentration in water ever found was in Lake Nakuru in
the Rift Valley in Kenya at 2800 ppm. The soil at the Lake shore contained up to
5600 ppm and the dust in the huts of local inhabitants contained 150 ppm.
Figure 2.3 World map showing endemic areas of fluorosis (92)
From the original igneous rocks, fluoride is leached in high amount in ground water
and soils. The fluoride finds its way to the human body through drinking water,
cereals and vegetables. The geographical endemic belt extends from :- (5-6)
Turkey via Syria, Jordan, Egypt, Libya, Algeria to Morocco and from Egypt and
Sudan through the Rift valley to Kenya, Tanzania, Mozambique and South
Africa.
Another belt is the one stretching from Turkey through Iran, Iraq, and
Afghanistan to India, Northern Thailand, China and Japan.
Chapter 2 Literature Review
55
In the Americas, a similar belt stretches from USA (Texas, New Mexico). Mexico
and Central America along the foothills of the Andes to Northern Chile and
Argentina.
2.2 DIAGNOSIS OF DENTAL FLUOROSIS
2. 2.1 INDICES USED TO DIAGNOSE DENTAL FLUOROSIS
Fluoride opacities are distinct and there is little epidemiologic evidence
that opacity characteristic of dental fluorosis, can be caused by other factors.
Trace elements other than fluoride, like strontium (93) and zinc (94) have shown
an association with fluorosis like opacities, but these associations were found to be
weak (87).
The accuracy of fluorosis diagnosis may be as high as 95%, for the
experienced examiners using proper attention to examination method, and the
use of differential diagnostic criteria. Two distinct groups of indexes have been
proposed for measuring dental fluorosis (87).
a) Specific fluorosis indexes - specifically measures the fluoride induced enamel
changes in order to reflect increasing severity of fluorosis of lesions (79, 89).
b) Descriptive indexes - including all types of defects. These indexes includes all
defects of enamel are recorded based solely on descriptive criteria, regardless of
causative factors. It is based on the principle that examiner should record what
he sees and do not presume the etiology (93).
Chapter 2 Literature Review
56
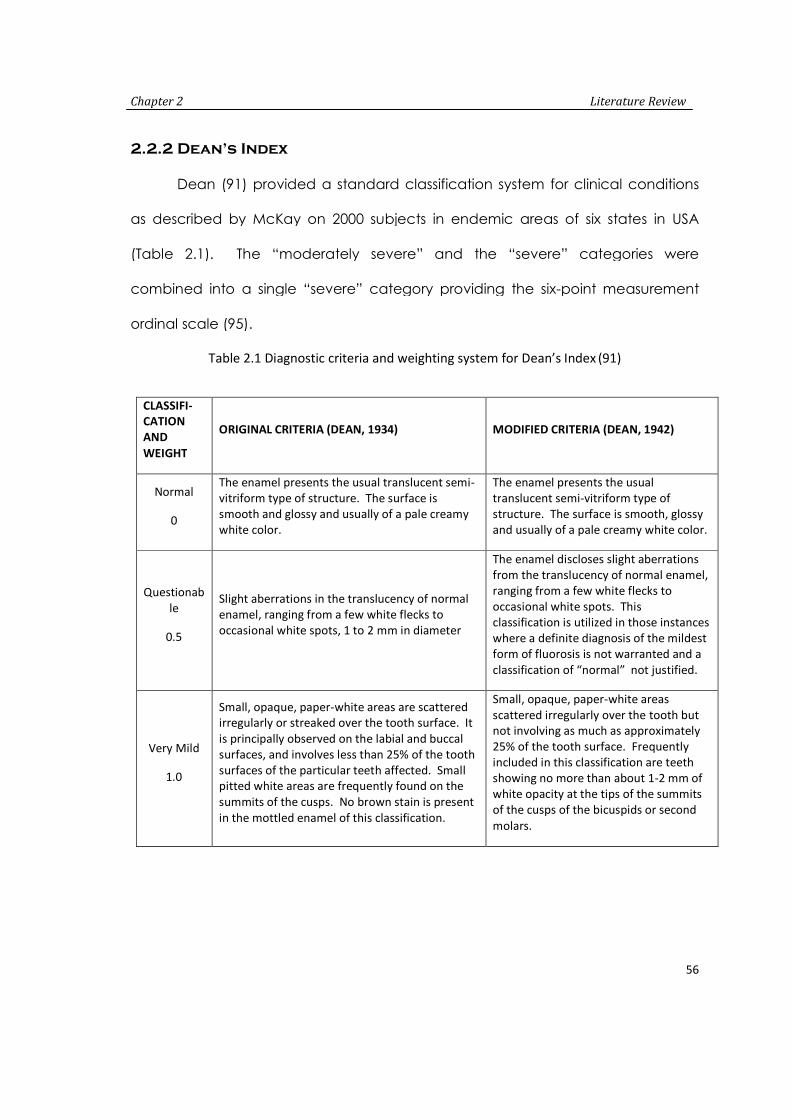
2.2.2 Dean’s Index
Dean (91) provided a standard classification system for clinical conditions
as described by McKay on 2000 subjects in endemic areas of six states in USA
(Table 2.1). The “moderately severe” and the “severe” categories were
combined into a single “severe” category providing the six-point measurement
ordinal scale (95).
Table 2.1 Diagnostic criteria and weighting system for Dean’s Index (91)
CLASSIFI-CATIONAND
WEIGHT
ORIGINAL CRITERIA (DEAN, 1934) MODIFIED CRITERIA (DEAN, 1942)
Normal
0
The enamel presents the usual translucent semi-vitriform type of structure. The surface issmooth and glossy and usually of a pale creamywhite color.
The enamel presents the usualtranslucent semi-vitriform type ofstructure. The surface is smooth, glossyand usually of a pale creamy white color.
Questionable
0.5
Slight aberrations in the translucency of normalenamel, ranging from a few white flecks tooccasional white spots, 1 to 2 mm in diameter
The enamel discloses slight aberrationsfrom the translucency of normal enamel,ranging from a few white flecks tooccasional white spots. Thisclassification is utilized in those instanceswhere a definite diagnosis of the mildestform of fluorosis is not warranted and aclassification of “normal” not justified.
Very Mild
1.0
Small, opaque, paper-white areas are scatteredirregularly or streaked over the tooth surface. Itis principally observed on the labial and buccalsurfaces, and involves less than 25% of the toothsurfaces of the particular teeth affected. Smallpitted white areas are frequently found on thesummits of the cusps. No brown stain is presentin the mottled enamel of this classification.
Small, opaque, paper-white areasscattered irregularly over the tooth butnot involving as much as approximately25% of the tooth surface. Frequentlyincluded in this classification are teethshowing no more than about 1-2 mm ofwhite opacity at the tips of the summitsof the cusps of the bicuspids or second
molars.
Chapter 2 Literature Review
57
Mild
2.0
The white, opaque areas on the surfaces of theteeth involve at least half of the tooth surface.The surfaces of molars, bicuspids, and cuspidssubject to attrition show thin white layers wornoff and the bluish shades of underlying normalenamel. Faint brown stains are sometimes
apparent, generally on the upper incisors.
The white opaque areas in the enamel ofthe teeth are more extensive but do notinvolve as much as 50% of the tooth.
Moderate
3.0
No change is observed in the form of the tooth,but generally all of the tooth surfaces areinvolved. Surfaces subject to attrition aredefinitely marked. Minute pitting is oftenpresent, generally on the labial and buccalsurfaces. Brown stain is frequently a disfiguringcomplication. It must be remembered that theincidence of brown stain varies greatly indifferent endemic areas, and many cases ofwhite opaque mottled enamel, without brownstain, are classified as “moderate” and listed n
this category.
All enamel surfaces of the teeth areaffected, and surfaces subject to attritionshow marked wear. Brown stain isfrequently a disfiguring feature.
Moderately
Severe
Macroscopically, a greater depth of enamelappears to be involved. A smoky whiteappearance is often noted. Pitting is morefrequent and generally observed on all the toothsurfaces. Brown stain, if present, is generallydeeper in hue and involves more of the affectedtooth surfaces.
Severe
4.0
The hypoplasia is so marked that the form of theteeth is at times affected, the condition oftenbeing manifest in older children as a mildpathologic incisal occlusal abrasion. The pits aredeeper and often confluent. Stains arewidespread and range from a chocolate brownto almost black in some cases.
It Includes teeth formerly classified as“moderately severe” and “severe”. Allenamel surfaces are affected, andhypoplasia is so marked that the generalform of the tooth maybe affected. Themajor diagnostic sign of this classificationis the discrete or confluent pitting.Brown stains are widespread and teethoften present a corroded likeappearance.
Shortcoming of Dean’s Index
- Single score is given to a tooth rather than, a separate score to each tooth
surface. Hence differences in the severity of fluorosis in different tooth surfaces
cannot be ascertained.
Chapter 2 Literature Review
58
- An individual has been classified according to the tooth most affected by
fluorosis which may be located in the mouth that has little cosmetic value.
- Questionable diagnostic category (score 0.5) in Dean’s Index is difficult to
define and interpret precisely.
- The distinctions between some of the diagnostic categories in Dean’s system
are unclear, imprecise or lack sensitivity.
2.2.3 Thylstrup and Fejerskov Index (TFI)
The Thylstrup and Fejerskov developed an index in order to refine, modify,
and extend the original concepts established by Dean (91). The primary aim was
to develop a more sensitive classification system for recording enamel changes
associated, with increasing level of fluoride in water. The basis of TFI is the
classification scale, closely to the histological changes that occur (79) and fluoride
content found in the enamel (81). A 10-point ordinal scale is used to classify
enamel changes associated with increasing fluoride exposure (Table 2.2). As
originally proposed, facial and occlusal surfaces were scored with different
criteria. From 1988, onwards the scoring of facial surface was recommended for
TFI.
Enamel stains are ignored in assignment of scores throughout the entire
scale. Teeth are to be cleaned and dried before examination. The histological
and clinical basis is used for scoring fluorosis with this index, have clarified the way
in which, fluorosis is distributed over the tooth surface. This scoring also estimates
the continuous exposure of fluoride during tooth development and loss of enamel
in fluorosis. The approach used in formulating scoring criteria has little scope for
subjectivity. Further, cleaning and drying of teeth accentuates the appearance of
Chapter 2 Literature Review
59
fluorotic change, making diagnosis easier in questionable cases. Using TFI, the
following methods are used to provide prevalence and severity estimates:
(1) Percent distributions of scores for all teeth
(2) Percent distributions of scores by tooth type
(3) Cumulative percent distributions of subjects indicated by percent of
teeth affected at a given TFI score (or greater) per subject.
Table 2.2 Diagnostic criteria and weighing system for T F Index
ScoreScore Original Criteria (Thylstrup and
Fejerskov, 1978)Modified Criteria (Fejerskov et al. 1988)
0Normal translucency of enamel remainsafter Prolonged air-drying.
The normal translucency of the glossy,creamy-white enamel remains after wipingand drying of the surface.
1Narrow white lines located correspondingto the perikymata.
Thin white opaque lines are seen runningacross the tooth surface. The linescorrespond to the position of theperikymata. In some cases, a slight"Snowcapping" of cusps/incisal edges mayalso be seen.
2
Smooth surfacesMore pronounced lines of opacity whichfollow the perikymata. Occasionallyconfluence of adjacent lines.Occlusal surfacesScattered areas of opacity < 2 mm indiameter and pronounced opacity ofcuspal ridges.
The opaque white lines are morepronounced and frequently merge to formsmall cloudy areas scattered over thewhole surface. "Snowcapping" of incisaledges and cusp tips is common.
3
Smooth surfacesMerging and irregular cloudy areas ofopacity. Accentuated drawing ofperikymata often visible betweenopacities.Occlusal surfacesConfluent areas of marked opacity wornareas appear almost normal but usuallycircumscribed by a rim of opaque enamel
Merging of the white lines occurs, andcloudy areas of opacity occur spread overmany parts of the surface. In between thecloudy areas, white lines can also be seen
4Smooth surfacesThe entire surface exhibits marked opacityor appears chalky white. Parts of surface
The entire surface exhibits a markedopacity or appears chalky white. Parts ofthe surface exposed to attrition or wear
Chapter 2 Literature Review
60
Critics of TFI
The TFI has received widespread use for both descriptive and analytical
studies, with 18 studies (77, 81, 80, 96-98) (more than 30 different populations and
275 subjects per study), reporting percent agreement scores for examiner
reliability were in the range from 65% to 100%. The prevalence and severity
exposed to attrition appear less affected.Occlusal surfacesEntire surface exhibits marked opacity.Attrition is often pronounced shortly aftereruption.
may appear to be less affected.
5
Smooth and occlusal surfacesEntire surface displays marked opacitywith focal loss of outermost enamel (pits)< 2 mm in diameter
The entire surface is opaque, and there areround pits (focal loss of the outermostenamel) that are less than 2 mm indiameter.
6
Smooth surfacesPits are regularly arranged in horizontalbands < 2 mm in vertical extension.Occlusal surfacesConfluent areas < 3 mm in diameterexhibit loss of enamel. Marked attrition
The small pits may frequently be seenmerging in the opaque enamel to formbands that are less than 2 mm in verticalheight. In this class are also includedsurfaces where the cuspal rim of facialenamel has been chipped off, and thevertical dimension of the resulting damageis less than 2 mm
7
Smooth surfacesLoss of outermost enamel in irregularareas involving < 1/2 of entire surface.Occlusal surfacesChanges in the morphology caused bymerging pits and marked attrition.
There is a loss of the outermost enamel inirregular areas, and less than half thesurface is so involved. The remaining intactenamel is opaque.
8Smooth and occlusal surfacesLoss of outermost enamel involving >1/2of surface.
The loss of the outermost enamel involvesmore than half the enamel. The remainingintact enamel is opaque.
9
Smooth and occlusal surfacesLoss of main part of enamel with changein anatomical appearance of surface.Cervical rim of almost unaffected enamelis often noted.
The loss of the major part of the outerenamel results in a change of theanatomical shape of the surface/tooth. Acervical rim of opaque enamel is oftennoted.
Chapter 2 Literature Review
61
estimates are generally reported at the individual or tooth level, typically, a
frequency distribution of scores (82, 98- 99).
The TFI seems more appropriate than Dean's Index for use in clinical trials or
analytical epidemiologic studies, primarily because teeth are dried and fluorosis
can be identified in its milder forms. The resulting increased sensitivity provides
statistical and practical advantages from the possible detection of effects with
smaller samples. This feature of the TFI is a particular advantage when potential
fluoride effects are small, or when the exposure may be widespread.
Granath et al (99) on comparing the Dean and TF indexes, concluded that
the latter was more detailed and sensitive, because it was based on biological
aspects. Thylstrup and Fejerskov (80) considered that the Dean’s index was not
capable of distinguishing the different aspects of the severity of dental fluorosis in
areas of high fluoride concentrations in the water (above three ppm) and
presented difficulties in evaluating questionable and very mild categories (100-
103).
2.3 Magnitude of fluorosis in India and Karnataka
Fluorosis history in India
Fluorosis has been prevalent in India for seven decades. It was first noticed
in early 1930s, among cattles by the farmers of Andhra Pradesh. They noticed
inability of the bullocks to walk due to painful and stiff joints (5, 6). The episode
was repeated within six months when new pairs of bullocks were acquired. It was
during the year later, the same disease was detected in human beings and Short
et al published the first report on endemic fluorosis in India. During the period from
1960 to 1986, nine states in India had been identified as endemic fluorosis areas.
Chapter 2 Literature Review
62
Presently, the 17 states India have been classified as endemic fluorosis areas. The
abnormal high natural concentration of fluoride bearing minerals are found in the
rocks which are irregularly distributed in India, is responsible for endemic fluorosis
(5-6). These natural fluoride bearing minerals identified in India are;
A) Fluoride : Fluoride (CaF2) and Cryolite (Na3 AIF6)
B) Phosphates : Fluorapatite Ca5 (PO4), 3F
C) Silicates : Topaz Al (F.OH) 2 Sio4
D) Mica Group : Magnesium mica and lithium mica
Figure 2.4 Fluorosis statuses in India (5,6)
Chapter 2 Literature Review
63
Figure 2.5 Fluorosis prevalence in India
Endemic areas in Karnataka
The Rajiv Gandhi National Drinking Water Mission (RGNDWM) (5, 6) survey
identified many parts of Karnataka as fluoride affected areas. The population in
over eight districts continues to drink water with excess fluoride. Many parts of the
state reportedly have alarmingly high levels of fluoride ranging from 1.3 to 8 ppm
(5, 6). According to studies conducted by (D.R.D.W.S.S.P) DANIDA Assisted Rural
Drinking Water Supply Sanitation Programme and Central Ground Water Board
(CGWB), have identified Dharwad, Kolar, Raichur, Gulbarga, Davangere,
Chitradurga, Gadag, Baglkot and Bijapur in North Karnataka to be endemic
fluoride areas (5, 6).
Chapter 2 Literature Review
64
2.4 STUDIES ON DENTAL FLUOROSIS AND FLUORIDE IN DRINKING WATER
Dean (104) conducted an investigation on caries and dental fluorosis on
7,257, 12 to 14 year children from 21 cities in four states. This study showed with
startling clarity, the association between increasing fluoride concentration in the
drinking water and decreasing caries experience in the population. They stated
that, near maximal reduction in caries experience occurred with a concentration
of 1 ppm fluoride in the drinking water. At this concentration, fluoride caused only
sporadic instances of the mildest forms of dental fluorosis of no aesthetic
significance. They further stated that between 0.5 and 1 ppm fluoride levels, five
to 10 percent of the children showed mild fluorosis, characterized by small
opaque white areas scattered irregularly over the tooth. With intake of two ppm,
about 10 percent were graded moderate dental fluorosis in which, the whole
enamel surface showed either the opaqueness or the brown stain. Fewer than 25
percent of the teeth were free from some defect. With four ppm, only five
percent of the teeth were normal and about 25 percent showed moderate
fluorosis. About 12 percent were graded “severe”, in which all the enamel
surfaces were affected either by opacity or brown stain, in addition to pitting. At
about six ppm, no teeth were free of dental fluorosis and above 50 percent
showed severe response. Higher levels upto 14 ppm did not make the condition
appreciably more than what was observed at six ppm.
Nanda (105) conducted an investigation to evaluate the prevalence of
dental fluorosis in Lucknow, India, and the factors responsible for the unusually
high degrees of fluorosis. 16,565 school children in the age group of six to 17 years
from Lucknow city and from 23 villages of Lucknow district were examined for
Chapter 2 Literature Review
65
dental fluorosis using Dean’s Index (1942). The fluoride concentration in drinking
water was in the range of 0.0 to 1.21 ppm and 54% showed no fluorosis, 28% had
questionable fluorosis, 18% had definite fluorosis. In 0.4 to 0.8 ppm of fluoride
definite fluorosis was seen in 24% of children. To determine the factors responsible
for the unusually high degree of fluorosis a complete dietary history on 444
children were collected at three distinct times during the year. Drinking water was
the principle source of fluoride intake and constituted for more than half of total
fluoride, as compared to ingested foods and other fluids. They concluded that
high intake of fluoride and deficient nutrition plays the most important role in the
unusually high degree of dental fluorosis in areas within low concentration of
fluoride in the drinking water.
Chandra (106) conducted a study to determine optimum fluoride
concentration in drinking water in fluorotic zone of western India. The area under
study was divided into four parts depending upon the fluoride level in drinking
water 0 to 1 ppm, 1.1 to 5 ppm, 5.1 to 10 ppm and 10.1 and above. 1320 school
children in the age group of 15-19 years were examined for dental fluorosis using
Dean’s Index (1942). They found significant increase in the prevalence of dental
fluorosis from 3.8% to 65.4%, with the rise in fluoride level in drinking water. A
significant positive correlation was found between fluoride in drinking water and
Community Fluorosis Index (CFI). They concluded that 0.8 ppm would be
optimum for the fluoride zone of Western India.
Subba Reddy and Tewari (107) investigated enamel mottling at various
levels of fluoride drinking water in an endemic area in Bathinda district Punjab,
India. 1759 school children in the age group of 12-17 years, who are permanent
Chapter 2 Literature Review
66
residents, were examined for dental fluorosis by Dean’s index. The fluoride level in
drinking water in six selected areas were (Manimajra) 0.30 ppm, (Sardulgarh) 1.70