Deer Flat National Wildlife Refuge Comprehensive Conservation Plan
Chapter 3. Physical Environment 3-1
Chapter 3 Physical Environment
This chapter describes the existing conditions of the physical environment in the Deer Flat Refuge planning area. The planning area consists of both the Lake Lowell Unit and the Snake River Islands Unit of the Refuge.
3.1 Climate
3.1.1 General Climate
The Deer Flat NWR planning area is situated in a dry climate region characterized by hot and dry summer months and cold and wet mild winters (IDEQ 2010). Climate in Idaho is largely governed by two influences: the Continental Divide and the Pacific Ocean. Even though the Refuge is located more than 300 miles from the Pacific Ocean, its climate is nevertheless affected by the air that is borne eastward on the prevailing westerly winds from the coast (WRCC 2011a). Additional information about wind is presented below. The growing season in the Deer Flat NWR region, including the central Snake and lower Boise, Payette, and Weiser river basins, averages 150 days or more (WRCC 2011a).
Climate influenced by the Pacific Ocean includes variability that is strongly shaped by two large-scale patterns: the El Niño/Southern Oscillation (ENSO) and the Pacific Decadal Oscillation (PDO). Each ENSO phase typically lasts six to 18 months, and, during the twentieth century, each PDO phase typically lasted for 20 to 30 years (Climate Impacts Group [CIG] 2011). These climate drivers can act separately and in concert in creating patterns of warm/dry or cool/wet winters (CIG 2011). With their influence over both winter temperature and winter precipitation, these natural climate patterns exert significant influence on snowpack and hydrology.
3.1.1.1 Temperature
It is rare that Idaho experiences periods of extreme heat or cold that last more than a week at a time, because the normal ongoing progression of weather systems moving across the state usually results in weather changes at rather frequent intervals (WRCC 2011a). Figure 3-1 illustrates the distribution of historical monthly temperatures and precipitation at Nampa, Idaho from 1981 to 2010. The climate station at Nampa is located about 4 miles northeast of the Refuge. The Nampa climate station is within the U.S. Historical Climatology Network (USHCN), a high-quality data set of daily and monthly records of basic meteorological variables from 1,218 observing stations across the conterminous United States (Menne et al. 2011). The USHCN data have been corrected to remove biases or heterogeneities from nonclimatic effects such as urbanization or other landscape changes, station moves, and instrument and time of observation changes. The network has been developed over the years at the National Oceanic and Atmospheric Administration’s (NOAA) National Climatic Data Center (NCDC) to assist in the detection of regional climate change and for monitoring temperature and precipitation across the United States. Data are accessible at http://cdiac.ornl.gov/epubs/ndp/ushcn/monthly_doc.html.
The average annual temperature at Nampa is 52°F. The highest monthly temperatures tend to occur in July and August and average 74°F to 75°F. The lowest monthly temperatures occur in December and January and average 30°F to 31°F.
Deer Flat National Wildlife Refuge Comprehensive Conservation Plan
3-2 Chapter 3. Physical Environment
Figure 3-1. Mean and Distribution of Monthly Temperature (top plot) and Precipitation (bottom plot) for the Nampa, Idaho USHCN Station for the Period 1981 to 2010
Source: Menne et al. (2011).
3.1.1.2 Precipitation
The primary source of moisture for precipitation in Idaho is the Pacific Ocean (WRCC 2011a). In winter, air masses moving inland from the Pacific Ocean to the continent pick up unlimited moisture from the ocean. The Cascade Range, some 200 miles west of the Refuge, forces this moisture-laden marine air from the Pacific Ocean to rise as it moves eastward. The resultant cooling and condensation produces heavy winter moisture on the western side of the Cascades and a rain shadow effect that extends across eastern Oregon and western Idaho.
Annual precipitation averages 10.9 inches per year at the USHCN station in Nampa, Idaho, for the period 1981 to 2010 (Figure 3-1). Summers are typically quite dry; July, August, and September all average less than 0.5 inch of precipitation per month. In portions of the Boise, Payette, and Weiser river drainages, less than 30 percent of the annual precipitation falls between the months of April and September (WRCC 2011a). The dry season in southern Idaho tends to end by October (IDEQ 2010). Snowfall occurs at the Refuge but rarely accumulates. However, snowmelt is an important contributing factor to the Snake River drainage.
Mo
nth
ly P
reci
pit
atio
n (
in)
0
2
4
6Mean for 1981 to 2010
Mean annual precipitation: 10.9"
Mo
nth
ly T
emp
erat
ure
(F
)
20
40
60
80
Mean for 1981 to 2010
Jan Feb Mar Apr May Jun Jul Aug Sep Oct Nov Dec
Mean annual temperature: 51.9F
Deer Flat National Wildlife Refuge Comprehensive Conservation Plan
Chapter 3. Physical Environment 3-3
3.1.1.3 Wind
Windstorms are not uncommon events, but there is an extremely small incidence of tornadoes and no history of destructive storms such as hurricanes (WRCC 2011a). Windstorms that are strong enough to cause minor damage to trees or disrupt power and communication facilities can occur at any time from October into July (WRCC 2011a). On average, prevailing winds in the Lake Lowell area are from the west-northwest from April through October and from the south-southeast the remainder of the year (WRCC 2011b). Monthly wind data as reported at Caldwell Airport (the nearest reporting station) are presented in Table 3-1.
Table 3-1. Average Prevailing Wind Speed and Direction at Caldwell Airport Parameter (Period of Record)
Mean Monthly Data Jan Feb Mar Apr May Jun Jul Aug Sep Oct Nov Dec
Wind speed (mph) (1997-2006)
5.8 7.5 7.9 7.7 6.7 6.6 5.6 5.3 5.0 5.3 5.8 6.1
Wind direction (1992-2002)
SSE WNW SSE SE
Source: WRCC (2011b, 2011c).
3.1.2 Climate Change
As stated in Department of the Interior Secretarial Order 3226, issued in 2001, and the Service’s Climate Change Strategic Plan, the Service considers and analyzes climate change in long-range planning and other activities.
3.1.2.1 Potential Effects from Climate Change
Global Greenhouse Gases: The greenhouse effect is a natural phenomenon that assists in regulating and warming the temperature of our planet. Just as a glass ceiling traps heat inside a greenhouse, certain gases in the atmosphere, called greenhouse gases (GHGs), absorb heat from sunlight. The primary GHGs occurring in the atmosphere include carbon dioxide (CO2), water vapor, methane, and nitrous oxide. CO2 is produced in the largest quantities, accounting for more than half of the current impact on the Earth’s climate.
A growing body of scientific evidence from basic theory, climate model simulations, and observations has emerged to support the idea that humans are changing the Earth’s climate (Intergovernmental Panel on Climate Change [IPCC] 2007; National Academy of Sciences 2008; U.S. Global Climate Change Research Program [USGCRP] 2009). The concentrations of heat-trapping GHGs have increased significantly over the last several hundred years due to human activities such as deforestation and the burning of fossil fuels.
Although climate variations are well documented in the Earth’s history, even in relatively recent geologic time (for example, the Ice Age of 10,000 years ago), the current warming trend differs from shifts earlier in geologic time in two ways. First, this climate change appears to be driven primarily by human activity, particularly the burning of fossil fuels, which results in a higher concentration of atmospheric GHGs. Second, atmospheric CO2 and other GHGs, levels of which are strongly correlated with the Earth’s temperature, are now higher than at any time during the last 800,000 years (USGCRP 2009). Prior to the start of the Industrial Revolution in 1750, the amount of CO2 in the atmosphere was about 280 parts per million (ppm). Current levels are about 390 ppm and are
Deer Flat National Wildlife Refuge Comprehensive Conservation Plan
3-4 Chapter 3. Physical Environment
increasing at a rate of about 2 ppm per year. The current concentration of CO2 and other GHGs and the rapid rate of increase in recent decades are unprecedented in the prehistoric record.
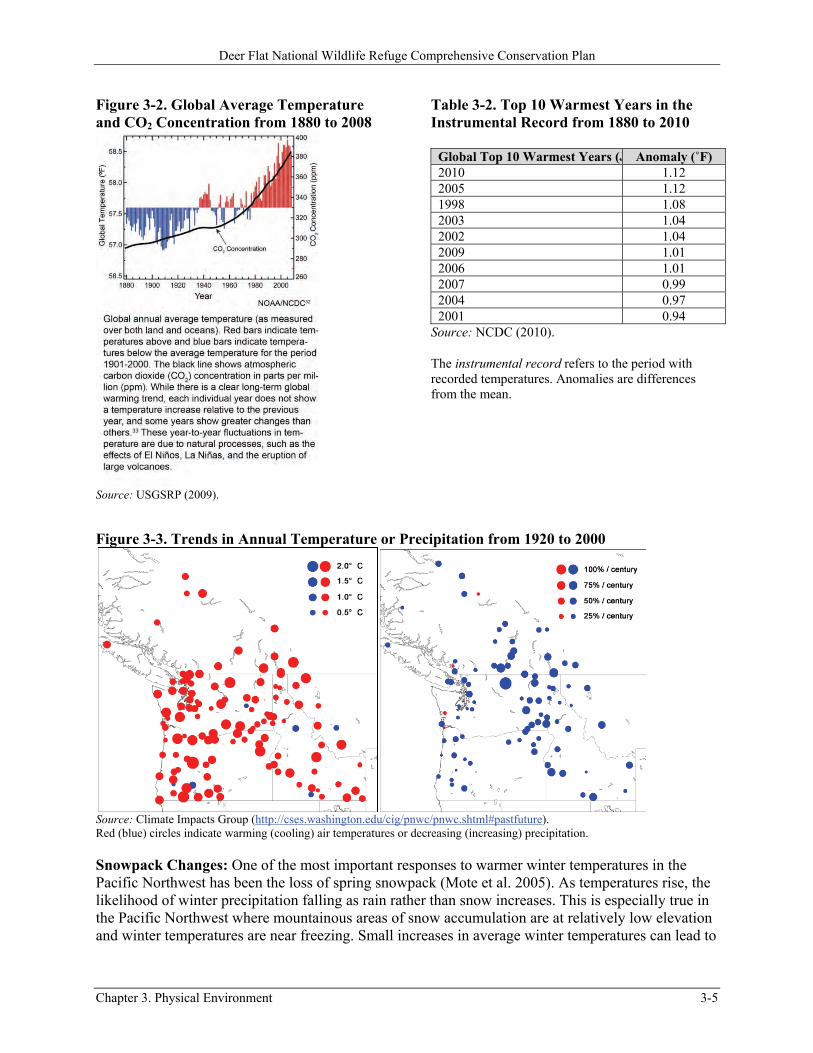
Temperature and Precipitation: There is a direct correlation between GHG concentrations and the temperature of the Earth’s surface. Global surface temperatures have increased about 1.3°F since the late nineteenth century (USGCRP 2009), and the rate of temperature increase has risen in more recent years (Figure 3-2). The IPCC, a large group of scientists convened by the United Nations to evaluate the risk of climate change caused by human activities, reported in 2007 that “warming of the climate system is unequivocal, as is now evident from observations of increases in global average air and ocean temperatures, widespread melting of snow and ice and rising global average sea level” (IPCC 2007).
In the Northern Hemisphere, recent decades appear to be the warmest since at least about A.D. 1000, and the warming since the late nineteenth century is unprecedented over the last 1,000 years. Globally, 2010 and 2005 are tied as the warmest years in the instrumental record from 1880 to the present. 1998, 2002, 2003, 2006, 2007, and 2009 are all tied for the second warmest on record, according to independent analyses by NOAA and the National Aeronautics and Space Administration (NASA; Table 3-2). The new 2010 record is particularly noteworthy because it occurred in the presence of a La Niña (a period of unusually cold ocean temperatures in the Equatorial Pacific) and a period of low solar activity, two factors that have a cooling influence on the planet. However, in general, decadal trends are far more important than any particular year’s ranking.
Trends in global precipitation are more difficult to detect than changes in temperature because precipitation is generally more variable. Over the last century, there have been increases in annual precipitation in the higher latitudes of both hemispheres and decreases in the tropical regions of Africa and southern Asia (USGCRP 2009). Most of the increases have occurred in the first half of the twentieth century, and it is not clear that this trend is due to increasing GHG concentrations.
Just as important as precipitation totals are changes in the intensity, frequency, and type of precipitation. Warmer climates, owing to increased water vapor, lead to more intense precipitation events, including more snowstorms and possibly more flooding, even with no change in total precipitation. The prevalence of extreme single-day precipitation events over time has increased, especially in the last two decades. On the other hand, more droughts and heat waves have occurred because of hotter, longer-lasting high pressure systems that dry out the land.
3.1.2.2 Pacific Northwest Climate Indicators and Trends
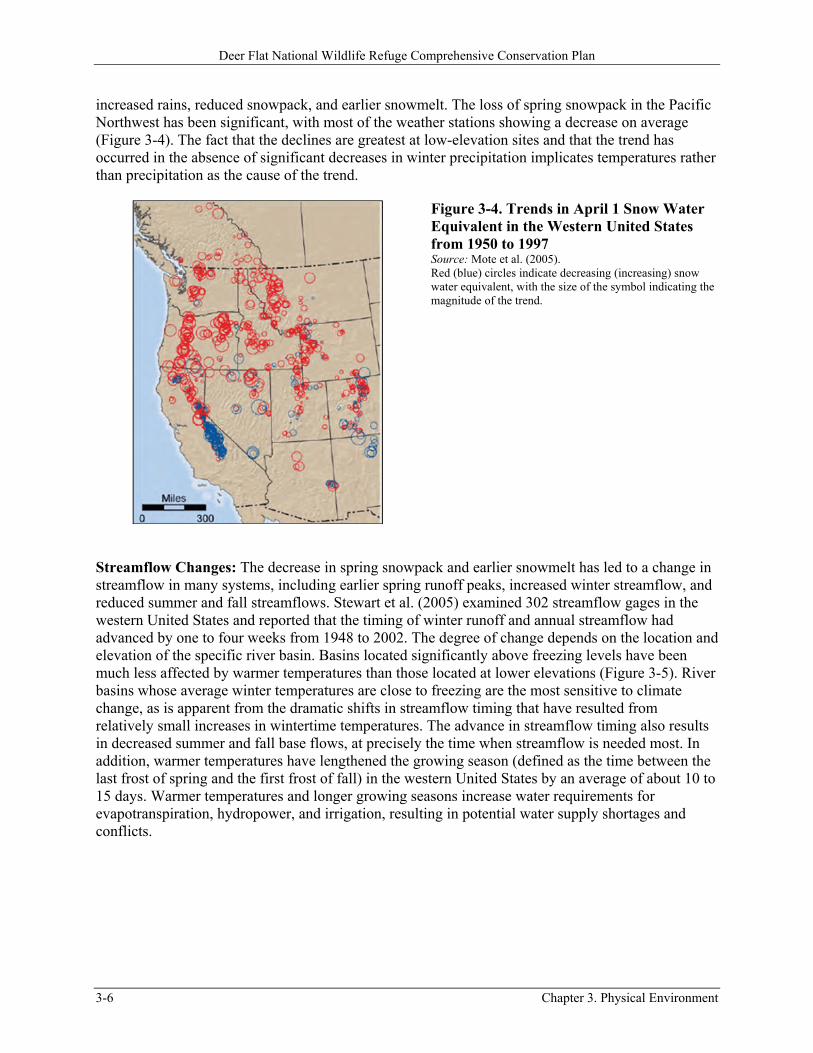
Temperature and Precipitation: In the Pacific Northwest, regionally averaged temperature rose 1.5°F between 1920 and 2000 (Figure 3-3), slightly more than the global average. Warming was largest for the winter months of January through March. Minimum daily temperatures have increased faster than maximum daily temperatures. Longer-term precipitation trends in the Pacific Northwest are more variable and vary with the period of record analyzed (Mote et al. 2005). Looking at the period 1920 to 2000, precipitation has increased almost everywhere in the region. Most of that increase occurred during the first part of the record.
In the Pacific Northwest, increased GHGs and warmer temperatures have resulted in a number of physical and chemical impacts to the region. These include changes in snowpack, streamflow timing and volume, flooding and landslides, sea levels, ocean temperatures and acidity, and disturbance regimes like wildfires, insect, and disease outbreaks (USGCRP 2009).
Deer Flat National Wildlife Refuge Comprehensive Conservation Plan
Chapter 3. Physical Environment 3-5
Figure 3-2. Global Average Temperature and CO2 Concentration from 1880 to 2008
Source: USGSRP (2009).
Table 3-2. Top 10 Warmest Years in the Instrumental Record from 1880 to 2010
Source: NCDC (2010).
The instrumental record refers to the period with recorded temperatures. Anomalies are differences from the mean.
Figure 3-3. Trends in Annual Temperature or Precipitation from 1920 to 2000
Source: Climate Impacts Group (http://cses.washington.edu/cig/pnwc/pnwc.shtml#pastfuture). Red (blue) circles indicate warming (cooling) air temperatures or decreasing (increasing) precipitation.
Snowpack Changes: One of the most important responses to warmer winter temperatures in the Pacific Northwest has been the loss of spring snowpack (Mote et al. 2005). As temperatures rise, the likelihood of winter precipitation falling as rain rather than snow increases. This is especially true in the Pacific Northwest where mountainous areas of snow accumulation are at relatively low elevation and winter temperatures are near freezing. Small increases in average winter temperatures can lead to
Global Top 10 Warmest Years (J Anomaly (˚F) 2010 1.12 2005 1.12 1998 1.08 2003 1.04 2002 1.04 2009 1.01 2006 1.01 2007 0.99 2004 0.97 2001 0.94
Deer Flat National Wildlife Refuge Comprehensive Conservation Plan
3-6 Chapter 3. Physical Environment
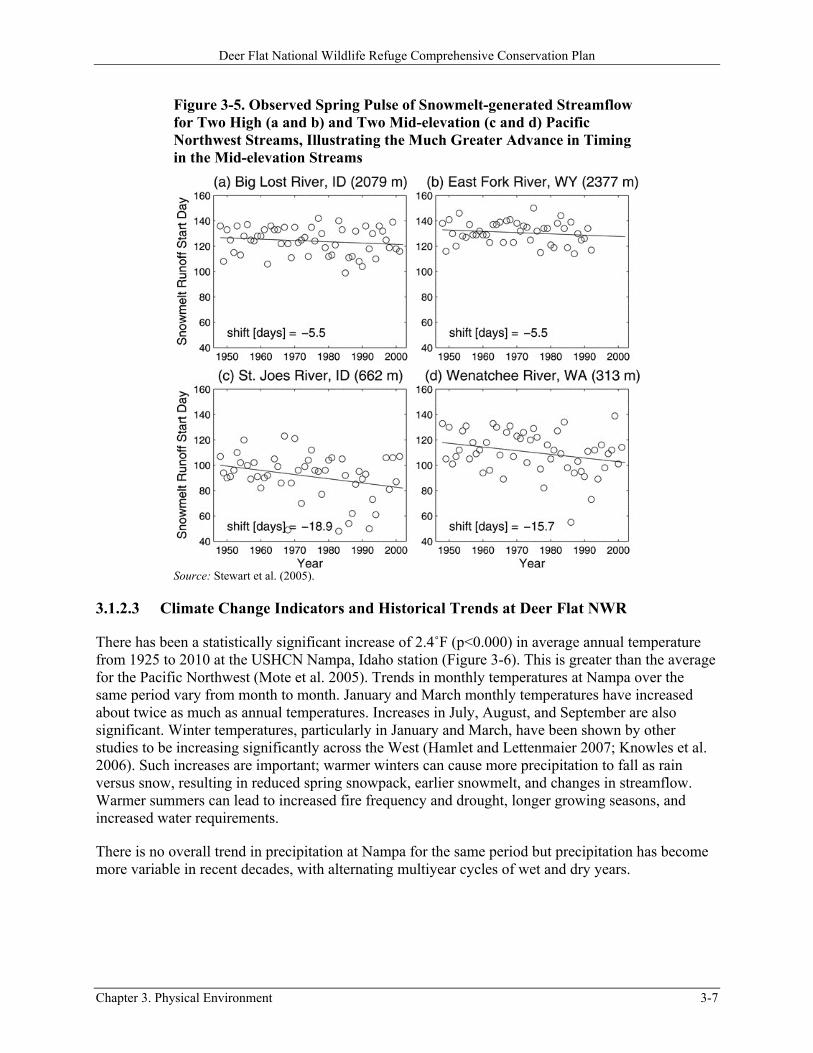
increased rains, reduced snowpack, and earlier snowmelt. The loss of spring snowpack in the Pacific Northwest has been significant, with most of the weather stations showing a decrease on average (Figure 3-4). The fact that the declines are greatest at low-elevation sites and that the trend has occurred in the absence of significant decreases in winter precipitation implicates temperatures rather than precipitation as the cause of the trend.
Figure 3-4. Trends in April 1 Snow Water Equivalent in the Western United States from 1950 to 1997 Source: Mote et al. (2005). Red (blue) circles indicate decreasing (increasing) snow water equivalent, with the size of the symbol indicating the magnitude of the trend.
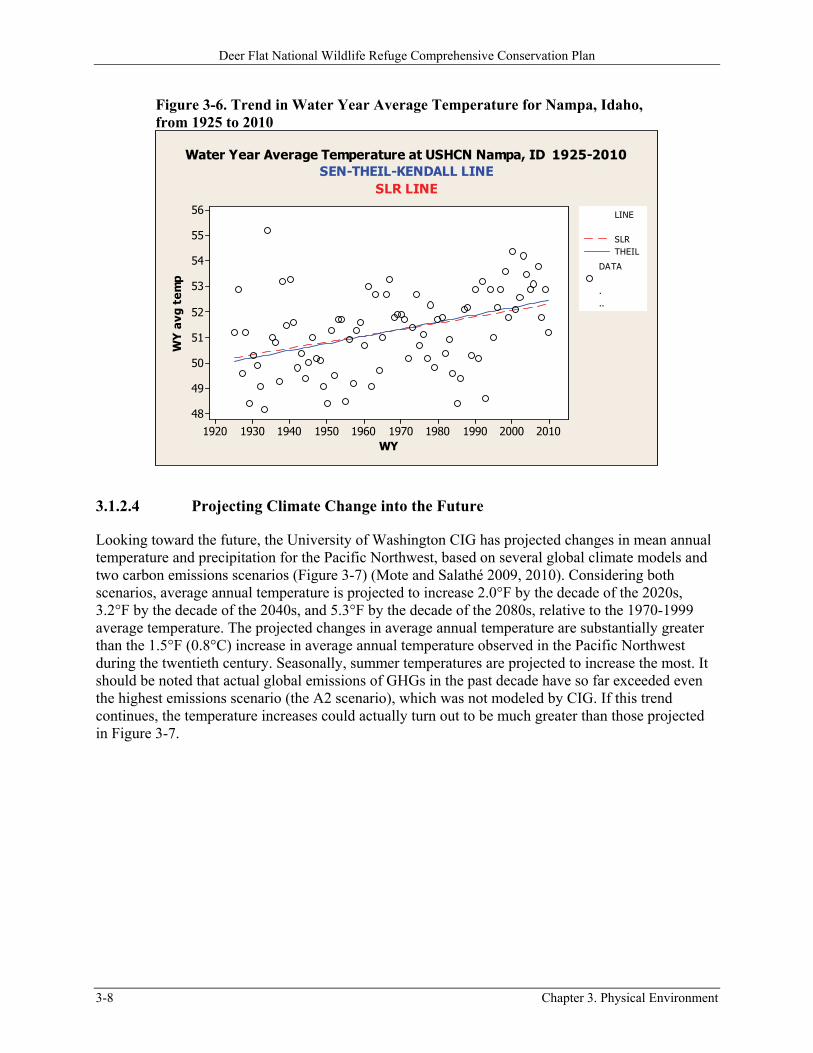
Streamflow Changes: The decrease in spring snowpack and earlier snowmelt has led to a change in streamflow in many systems, including earlier spring runoff peaks, increased winter streamflow, and reduced summer and fall streamflows. Stewart et al. (2005) examined 302 streamflow gages in the western United States and reported that the timing of winter runoff and annual streamflow had advanced by one to four weeks from 1948 to 2002. The degree of change depends on the location and elevation of the specific river basin. Basins located significantly above freezing levels have been much less affected by warmer temperatures than those located at lower elevations (Figure 3-5). River basins whose average winter temperatures are close to freezing are the most sensitive to climate change, as is apparent from the dramatic shifts in streamflow timing that have resulted from relatively small increases in wintertime temperatures. The advance in streamflow timing also results in decreased summer and fall base flows, at precisely the time when streamflow is needed most. In addition, warmer temperatures have lengthened the growing season (defined as the time between the last frost of spring and the first frost of fall) in the western United States by an average of about 10 to 15 days. Warmer temperatures and longer growing seasons increase water requirements for evapotranspiration, hydropower, and irrigation, resulting in potential water supply shortages and conflicts.
Deer Flat National Wildlife Refuge Comprehensive Conservation Plan
Chapter 3. Physical Environment 3-7
Figure 3-5. Observed Spring Pulse of Snowmelt-generated Streamflow for Two High (a and b) and Two Mid-elevation (c and d) Pacific Northwest Streams, Illustrating the Much Greater Advance in Timing in the Mid-elevation Streams
Source: Stewart et al. (2005).
3.1.2.3 Climate Change Indicators and Historical Trends at Deer Flat NWR
There has been a statistically significant increase of 2.4˚F (p<0.000) in average annual temperature from 1925 to 2010 at the USHCN Nampa, Idaho station (Figure 3-6). This is greater than the average for the Pacific Northwest (Mote et al. 2005). Trends in monthly temperatures at Nampa over the same period vary from month to month. January and March monthly temperatures have increased about twice as much as annual temperatures. Increases in July, August, and September are also significant. Winter temperatures, particularly in January and March, have been shown by other studies to be increasing significantly across the West (Hamlet and Lettenmaier 2007; Knowles et al. 2006). Such increases are important; warmer winters can cause more precipitation to fall as rain versus snow, resulting in reduced spring snowpack, earlier snowmelt, and changes in streamflow. Warmer summers can lead to increased fire frequency and drought, longer growing seasons, and increased water requirements.
There is no overall trend in precipitation at Nampa for the same period but precipitation has become more variable in recent decades, with alternating multiyear cycles of wet and dry years.
Deer Flat National Wildlife Refuge Comprehensive Conservation Plan
3-8 Chapter 3. Physical Environment
Figure 3-6. Trend in Water Year Average Temperature for Nampa, Idaho, from 1925 to 2010
WY
WY
avg
tem
p
2010200019901980197019601950194019301920
56
55
54
53
52
51
50
49
48
SLRTHEIL
LINE
.
..
DATA
Water Year Average Temperature at USHCN Nampa, ID 1925-2010SEN-THEIL-KENDALL LINE
SLR LINE
3.1.2.4 Projecting Climate Change into the Future
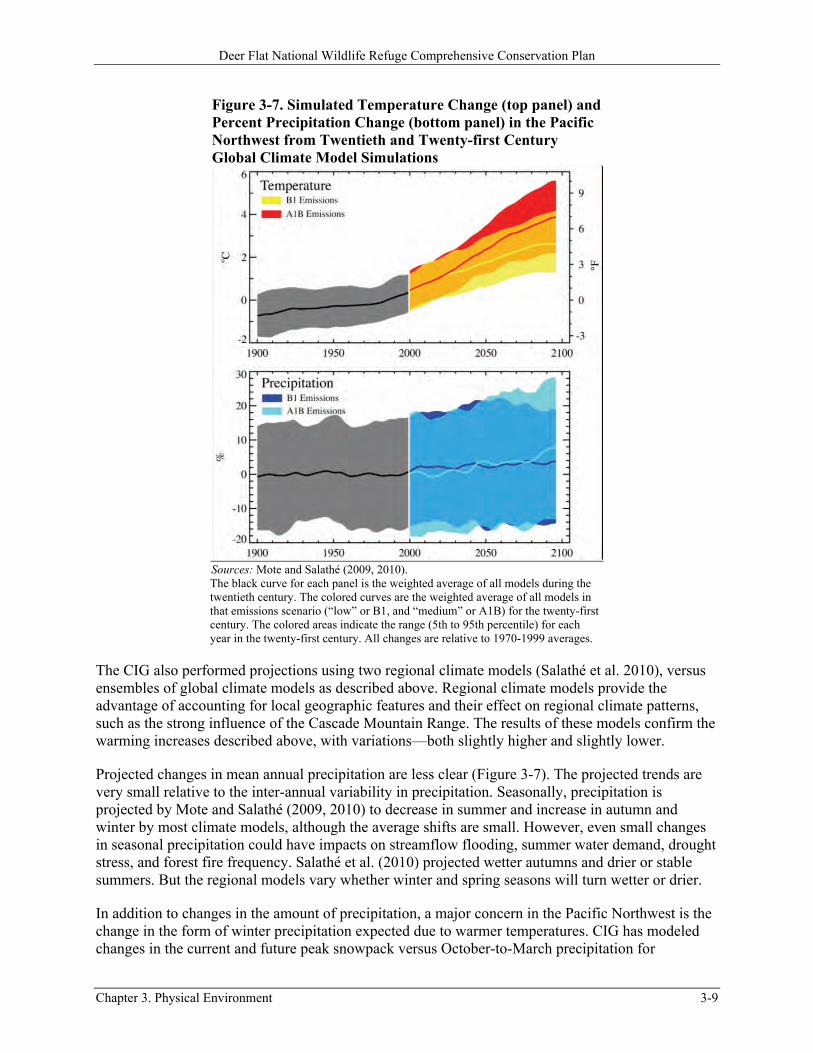
Looking toward the future, the University of Washington CIG has projected changes in mean annual temperature and precipitation for the Pacific Northwest, based on several global climate models and two carbon emissions scenarios (Figure 3-7) (Mote and Salathé 2009, 2010). Considering both scenarios, average annual temperature is projected to increase 2.0°F by the decade of the 2020s, 3.2°F by the decade of the 2040s, and 5.3°F by the decade of the 2080s, relative to the 1970-1999 average temperature. The projected changes in average annual temperature are substantially greater than the 1.5°F (0.8°C) increase in average annual temperature observed in the Pacific Northwest during the twentieth century. Seasonally, summer temperatures are projected to increase the most. It should be noted that actual global emissions of GHGs in the past decade have so far exceeded even the highest emissions scenario (the A2 scenario), which was not modeled by CIG. If this trend continues, the temperature increases could actually turn out to be much greater than those projected in Figure 3-7.
Deer Flat National Wildlife Refuge Comprehensive Conservation Plan
Chapter 3. Physical Environment 3-9
Figure 3-7. Simulated Temperature Change (top panel) and Percent Precipitation Change (bottom panel) in the Pacific Northwest from Twentieth and Twenty-first Century Global Climate Model Simulations
Sources: Mote and Salathé (2009, 2010). The black curve for each panel is the weighted average of all models during the twentieth century. The colored curves are the weighted average of all models in that emissions scenario (“low” or B1, and “medium” or A1B) for the twenty-first century. The colored areas indicate the range (5th to 95th percentile) for each year in the twenty-first century. All changes are relative to 1970-1999 averages.
The CIG also performed projections using two regional climate models (Salathé et al. 2010), versus ensembles of global climate models as described above. Regional climate models provide the advantage of accounting for local geographic features and their effect on regional climate patterns, such as the strong influence of the Cascade Mountain Range. The results of these models confirm the warming increases described above, with variations—both slightly higher and slightly lower.
Projected changes in mean annual precipitation are less clear (Figure 3-7). The projected trends are very small relative to the inter-annual variability in precipitation. Seasonally, precipitation is projected by Mote and Salathé (2009, 2010) to decrease in summer and increase in autumn and winter by most climate models, although the average shifts are small. However, even small changes in seasonal precipitation could have impacts on streamflow flooding, summer water demand, drought stress, and forest fire frequency. Salathé et al. (2010) projected wetter autumns and drier or stable summers. But the regional models vary whether winter and spring seasons will turn wetter or drier.
In addition to changes in the amount of precipitation, a major concern in the Pacific Northwest is the change in the form of winter precipitation expected due to warmer temperatures. CIG has modeled changes in the current and future peak snowpack versus October-to-March precipitation for
Deer Flat National Wildlife Refuge Comprehensive Conservation Plan
3-10 Chapter 3. Physical Environment
watersheds in the Columbia Basin area, including basins surrounding the Snake River Plain. Generally, there is a large shift in the form of winter precipitation from snow to rain, with basins in the Lower Snake River Plain affected before those in the Upper Snake River Plain, because of the lower basin elevations in this area. As these changes occur, there will likely be a tendency for higher winter flows and possible increased flooding risk, earlier snowmelt and runoff peaks, and lower summer streamflows.
Casola et al. (2009) evaluated the impact of global warming upon Pacific Northwest snowpack using the Cascades portion of the Puget Sound drainage basin as an example that can be extrapolated for the region. They evaluated four analytical and modeling methods to determine the temperature sensitivity of snowpack: (1) simple geometric considerations, (2) regression of April 1 snow water equivalent measurements upon seasonal mean temperature, (3) a hydrological model forced with historical daily temperature and precipitation data, and (4) a simple analysis of inferred accumulated snowfall. The researchers concluded that a 20 percent reduction in snowpack (mean April 1 snow water equivalent) occurs for each degree Celsius of warming (1.8°F) in the absence of indirect effects, and a 16 percent reduction occurs taking into account a projected warming-induced increase in precipitation.
Considering projected warming scenarios (as described above [Mote and Salathé 2009, 2010]), Table 3-3 shows the decrease in snowpack using the analysis by Casola et al. (2009).
Table 3-3. Projected Decrease in Snowpack Average Annual Temperature Projected Increase (relative to the 1970-1999 average temperature)
Projected Decrease in Snowpack (taking into account a projected warming-induced increase in precipitation)
2.0°F by the decade of the 2020s 18% decrease in snowpack by 2020s 3.2°F by the decade of the 2040s 28% decrease in snowpack by 2020s 5.3°F by the decade of the 2080s 47% decrease in snowpack by 2020s
This loss of snowpack is especially the case for the most vulnerable, lower-elevation snowfields. Spring snowpack is a good indicator for summertime flows in most watersheds, and these snowpack loss projections therefore foretell strong negative impacts to the region’s overall water resources. In many watersheds in the Pacific Northwest, snowfields act as reservoirs that collect fresh water during the wetter winter months and release this water during the drier summer months, effectively distributing water more equitably across the seasons. Loss of snowpack would disrupt this cycle, vastly altering streams with hydrologies that are largely determined by snowpack runoff and/or groundwater input.
3.2 Hydrology
The major surface waters within the Deer Flat NWR planning area are Lake Lowell and the Snake River. The entire upland area of the Lake Lowell Unit drains into the lake, and all of the Refuge islands drain directly to the river. The two surface-water features are described below.
3.2.1 Lake Lowell
Lake Lowell is an off-stream storage reservoir within Reclamation’s Boise Project Arrowrock Division (Ferrari 1995; IDEQ 2010; Reclamation 2011). It is formed by three earth-fill embankments and one dike that hold water in a natural topographic depression: Deer Flat Upper Dam, Deer Flat
Deer Flat National Wildlife Refuge Comprehensive Conservation Plan
Chapter 3. Physical Environment 3-11
Middle Dam, Deer Flat Lower Dam, and Deer Flat East Dike (Ferrari 1995; IDEQ 2010; Reclamation 2011; Simonds 1997). Construction of these embankments took place from 1906 through 1911(Ferrari 1995), with closure and first storage occurring in 1909 (pers. comm., S. Dunn 2012). IDEQ (2010) describes the tributaries contributing to the lake as consisting of: New York Canal, Ridenbaugh Canal, Highline Canal, two canal wasteways, six named agricultural drains, and many unnamed drains that discharge to the lake (IDEQ 2010). However, Ridenbaugh Canal and Garland Drain actually flow into New York Canal before it enters Lake Lowell, and Highline Canal flows into the lake through the two canal wasteways. Table 3-4 describes the average annual inflows to Lake Lowell.
Table 3-4. Average Annual Measured Inflows to Lake Lowell Lake Lowell Tributary Average Annual Inflow (acre-feet) New York Canal (including Ridenbaugh Canal and Garland Drain) 180,000 Deer Flat Highline Wasteway #1 1,800 Deer Flat Highline Wasteway #3 20,000 Coulee Drain 1,900 Bernard Drain 1,200 Garner Drain 400 Donaldson Drain 900 Farner Drain 1,800 Other minor unmonitored drains 5,900 Total 213,900 Source: IDEQ (2010).
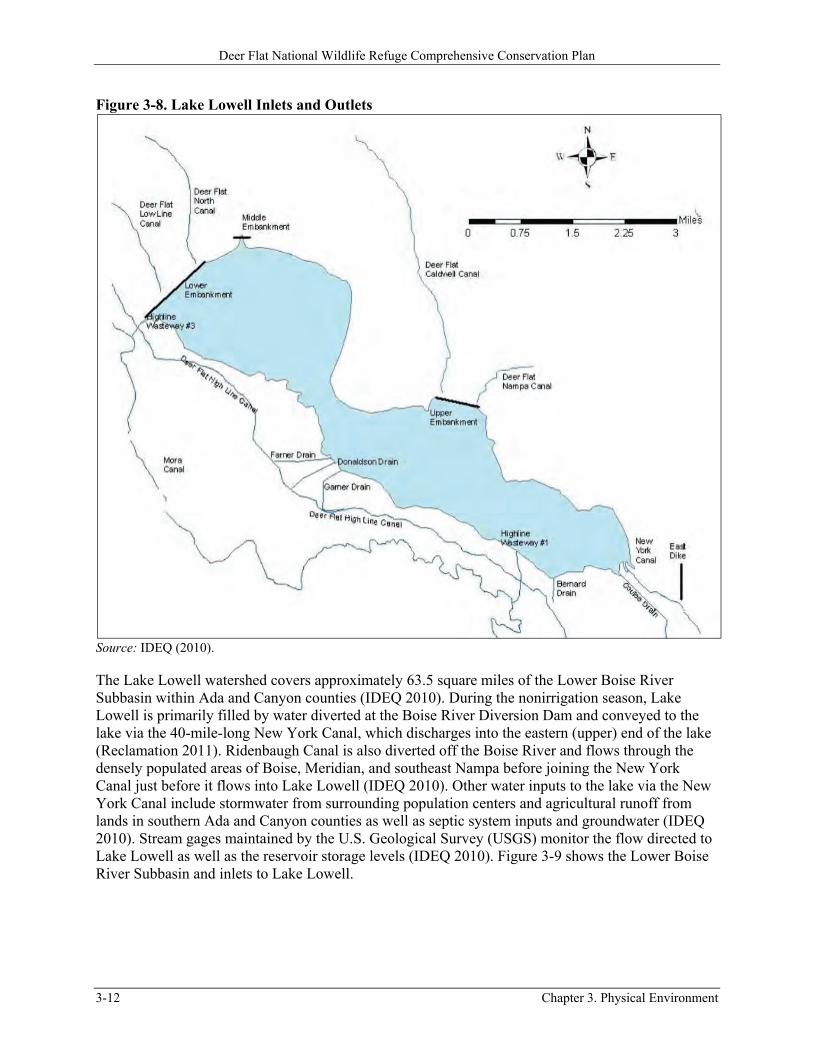
Outlets from the lake at the Deer Flat Lower Dam feed the Deer Flat North Canal and the Deer Flat Lowline Canal and outlets from the Deer Flat Upper Dam feed the Deer Flat Caldwell Canal and Deer Flat Nampa Canal (IDEQ 2010). The Blinkenstaff pumps, located near Deer Flat Highline Wasteway Number 3, lift lake water to the Mora Canal (IDEQ 2010). Approximately 3,200 acre-feet of water is also lost from the lake through evaporation and groundwater infiltration. Table 3-5 describes the average annual outflows from the lake. Lake Lowell inlets and outlets are shown in Figure 3-8.
Table 3-5. Average Annual Measured Outflows from Lake Lowell Lake Lowell Tributary Average Annual Inflow (acre-feet) Deer Flat Lowline Canal 203,000 Deer Flat Caldwell Canal 2,900 Deer Flat Nampa Canal 3,600 Blinkenstaff pumps 1,200 Total 210,700 Source: IDEQ (2010).
Deer Flat National Wildlife Refuge Comprehensive Conservation Plan
3-12 Chapter 3. Physical Environment
Figure 3-8. Lake Lowell Inlets and Outlets
Source: IDEQ (2010).
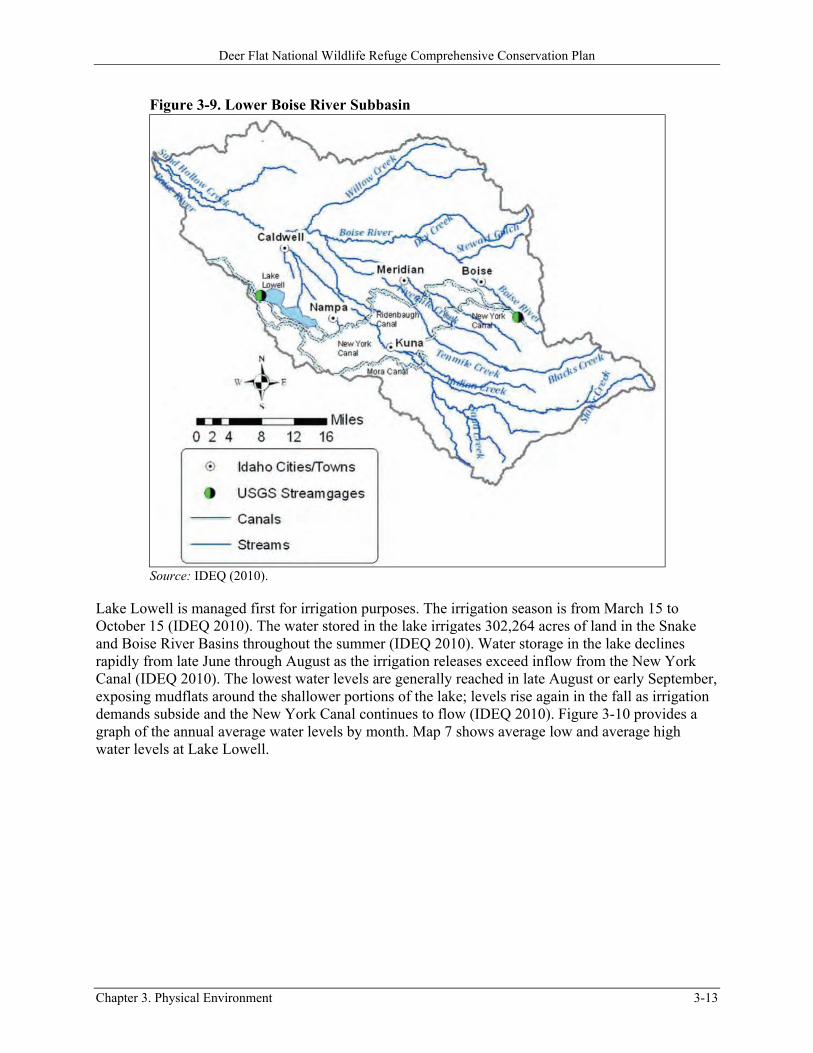
The Lake Lowell watershed covers approximately 63.5 square miles of the Lower Boise River Subbasin within Ada and Canyon counties (IDEQ 2010). During the nonirrigation season, Lake Lowell is primarily filled by water diverted at the Boise River Diversion Dam and conveyed to the lake via the 40-mile-long New York Canal, which discharges into the eastern (upper) end of the lake (Reclamation 2011). Ridenbaugh Canal is also diverted off the Boise River and flows through the densely populated areas of Boise, Meridian, and southeast Nampa before joining the New York Canal just before it flows into Lake Lowell (IDEQ 2010). Other water inputs to the lake via the New York Canal include stormwater from surrounding population centers and agricultural runoff from lands in southern Ada and Canyon counties as well as septic system inputs and groundwater (IDEQ 2010). Stream gages maintained by the U.S. Geological Survey (USGS) monitor the flow directed to Lake Lowell as well as the reservoir storage levels (IDEQ 2010). Figure 3-9 shows the Lower Boise River Subbasin and inlets to Lake Lowell.
Deer Flat National Wildlife Refuge Comprehensive Conservation Plan
Chapter 3. Physical Environment 3-13
Figure 3-9. Lower Boise River Subbasin
Source: IDEQ (2010).
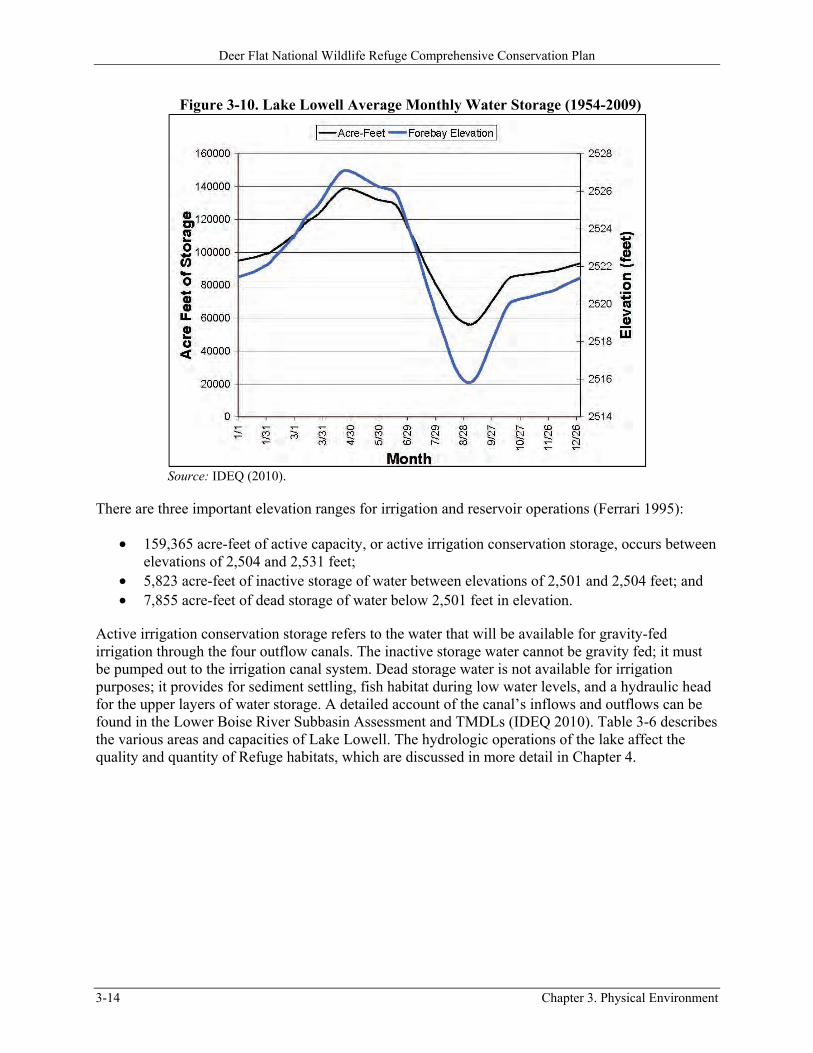
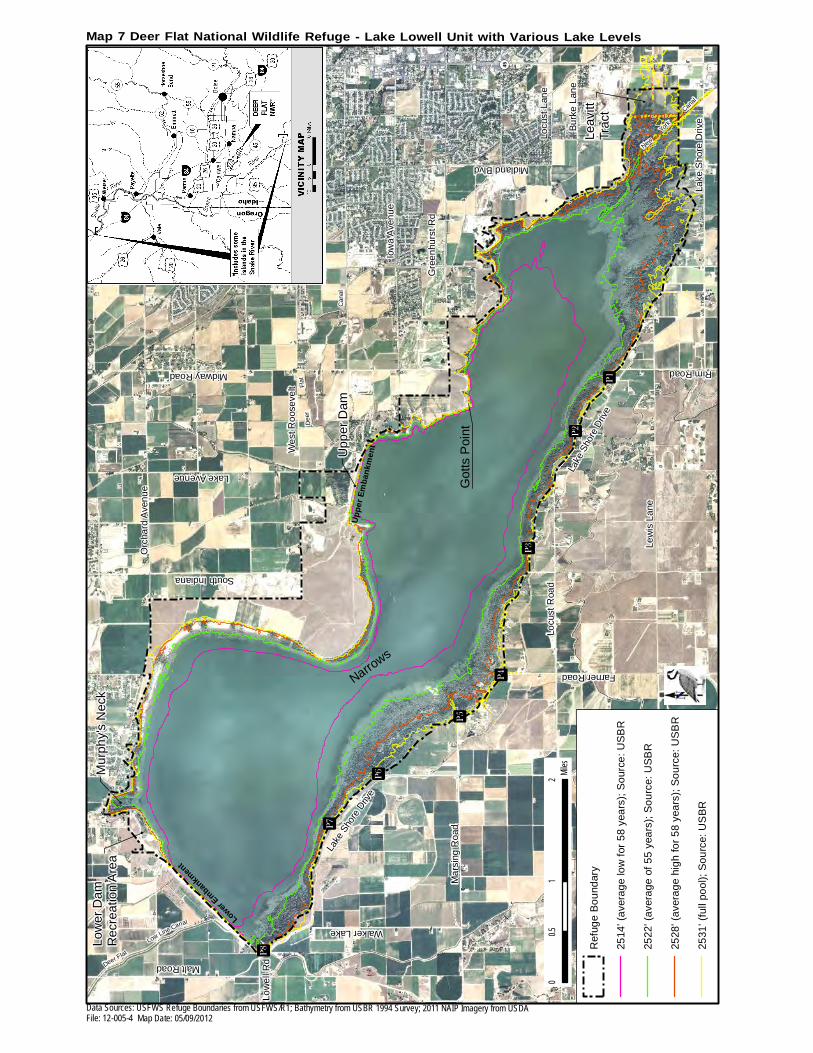
Lake Lowell is managed first for irrigation purposes. The irrigation season is from March 15 to October 15 (IDEQ 2010). The water stored in the lake irrigates 302,264 acres of land in the Snake and Boise River Basins throughout the summer (IDEQ 2010). Water storage in the lake declines rapidly from late June through August as the irrigation releases exceed inflow from the New York Canal (IDEQ 2010). The lowest water levels are generally reached in late August or early September, exposing mudflats around the shallower portions of the lake; levels rise again in the fall as irrigation demands subside and the New York Canal continues to flow (IDEQ 2010). Figure 3-10 provides a graph of the annual average water levels by month. Map 7 shows average low and average high water levels at Lake Lowell.
Deer Flat National Wildlife Refuge Comprehensive Conservation Plan
3-14 Chapter 3. Physical Environment
Figure 3-10. Lake Lowell Average Monthly Water Storage (1954-2009)
Source: IDEQ (2010).
There are three important elevation ranges for irrigation and reservoir operations (Ferrari 1995):
159,365 acre-feet of active capacity, or active irrigation conservation storage, occurs between elevations of 2,504 and 2,531 feet;
5,823 acre-feet of inactive storage of water between elevations of 2,501 and 2,504 feet; and 7,855 acre-feet of dead storage of water below 2,501 feet in elevation.
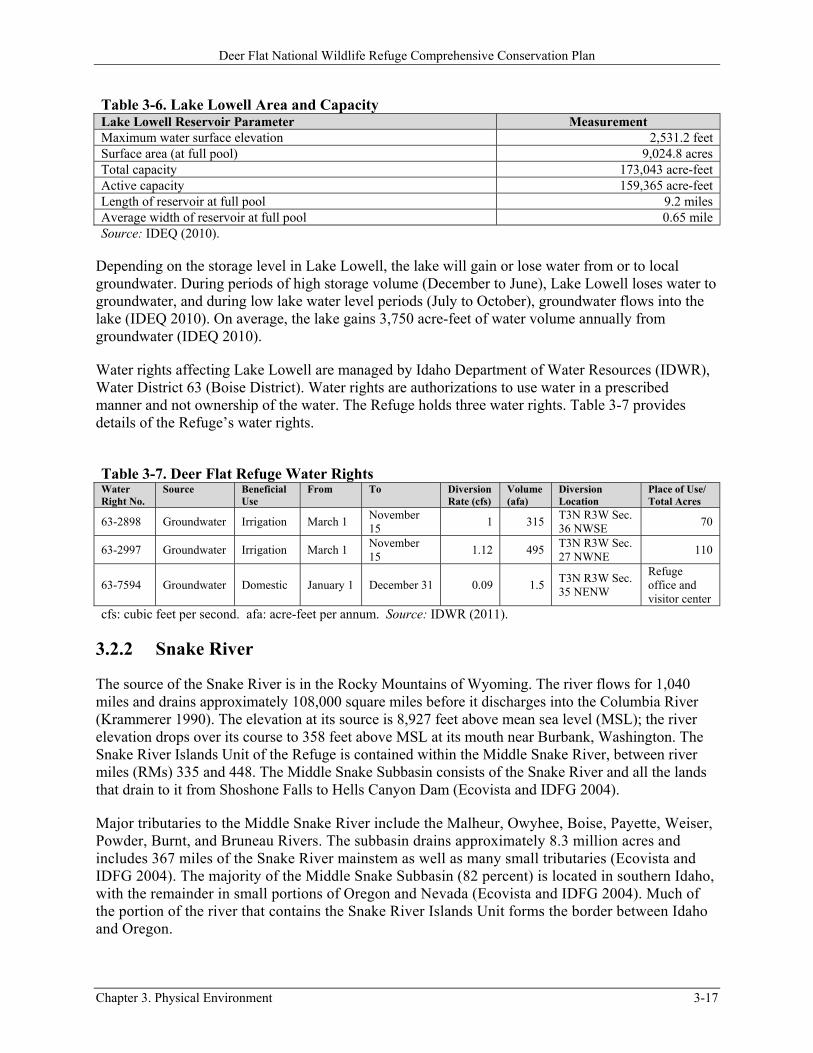
Active irrigation conservation storage refers to the water that will be available for gravity-fed irrigation through the four outflow canals. The inactive storage water cannot be gravity fed; it must be pumped out to the irrigation canal system. Dead storage water is not available for irrigation purposes; it provides for sediment settling, fish habitat during low water levels, and a hydraulic head for the upper layers of water storage. A detailed account of the canal’s inflows and outflows can be found in the Lower Boise River Subbasin Assessment and TMDLs (IDEQ 2010). Table 3-6 describes the various areas and capacities of Lake Lowell. The hydrologic operations of the lake affect the quality and quantity of Refuge habitats, which are discussed in more detail in Chapter 4.
Gre
en
hurs
t R
d
Low
er D
am
Rec
reat
ion
Are
a
Upp
er D
am
Got
ts P
oint
Leav
itt
Trac
tP1
Mur
phy'
s N
eck
P2
P3
P4
P5
P6
P7
P8
Orc
hard
Ave
nu
e
We
st R
oos
eve
lt
Iow
a A
ven
ue
Locu
st L
ane
Bu
rke
Lan
e
Locu
st R
oad
Lew
is L
ane
Ma
rsin
g R
oad
Low
ell
RdMalt Road
South Indiana
Lake Avenue
Midway Road
Walker Lake
Farner Road
Lake
Sho
re D
rive
Lake
Sho
re D
rive
Lake
Sho
re D
rive
Rim Road
Midland Blvd
Narrows
Low Line Canal
Deer Flat
New
York
Canal
Dee
rF
lat
Can
al
¬«45¬«55¥84
Lower Embankm
ent
Uppe
r Emb
ankm
ent
01
20.5
Mile
s
Map 7 Deer Flat National Wildlife Refuge - Lake Lowell Unit with Various Lake Levels
NAM
PA
Ref
uge
Bo
und
ary
2514
' (a
vera
ge
low
for
58
yea
rs);
So
urce
: U
SB
R
2522
' (a
vera
ge
of 5
5 ye
ars
); S
ou
rce:
US
BR
2528
' (a
vera
ge
hig
h fo
r 5
8 ye
ars
); S
ou
rce:
US
BR
2531
' (fu
ll po
ol);
So
urc
e: U
SB
R
Data Sources: U SFW S Re fuge Boundaries from U SFW S/R1 ; Bathym etry from USBR 1994 Survey; 2011 NAIP Im agery from USDAFile: 12 -005 -4 M ap Da te: 05/09/2012
kkierhaggenjos
Typewritten Text
3-15
Deer Flat National Wildlife Refuge Comprehensive Conservation Plan
3-16 Chapter 3. Physical Environment
Document continues on next page.
Deer Flat National Wildlife Refuge Comprehensive Conservation Plan
Chapter 3. Physical Environment 3-17
Table 3-6. Lake Lowell Area and Capacity Lake Lowell Reservoir Parameter Measurement Maximum water surface elevation 2,531.2 feet Surface area (at full pool) 9,024.8 acres Total capacity 173,043 acre-feet Active capacity 159,365 acre-feet Length of reservoir at full pool 9.2 miles Average width of reservoir at full pool 0.65 mile Source: IDEQ (2010).
Depending on the storage level in Lake Lowell, the lake will gain or lose water from or to local groundwater. During periods of high storage volume (December to June), Lake Lowell loses water to groundwater, and during low lake water level periods (July to October), groundwater flows into the lake (IDEQ 2010). On average, the lake gains 3,750 acre-feet of water volume annually from groundwater (IDEQ 2010).
Water rights affecting Lake Lowell are managed by Idaho Department of Water Resources (IDWR), Water District 63 (Boise District). Water rights are authorizations to use water in a prescribed manner and not ownership of the water. The Refuge holds three water rights. Table 3-7 provides details of the Refuge’s water rights.
Table 3-7. Deer Flat Refuge Water Rights Water Right No.
Source Beneficial Use
From To Diversion Rate (cfs)
Volume (afa)
Diversion Location
Place of Use/ Total Acres
63-2898 Groundwater Irrigation March 1 November 15
1 315 T3N R3W Sec. 36 NWSE
70
63-2997 Groundwater Irrigation March 1 November 15
1.12 495 T3N R3W Sec. 27 NWNE
110
63-7594 Groundwater Domestic January 1 December 31 0.09 1.5 T3N R3W Sec. 35 NENW
Refuge office and visitor center
cfs: cubic feet per second. afa: acre-feet per annum. Source: IDWR (2011).
3.2.2 Snake River
The source of the Snake River is in the Rocky Mountains of Wyoming. The river flows for 1,040 miles and drains approximately 108,000 square miles before it discharges into the Columbia River (Krammerer 1990). The elevation at its source is 8,927 feet above mean sea level (MSL); the river elevation drops over its course to 358 feet above MSL at its mouth near Burbank, Washington. The Snake River Islands Unit of the Refuge is contained within the Middle Snake River, between river miles (RMs) 335 and 448. The Middle Snake Subbasin consists of the Snake River and all the lands that drain to it from Shoshone Falls to Hells Canyon Dam (Ecovista and IDFG 2004).
Major tributaries to the Middle Snake River include the Malheur, Owyhee, Boise, Payette, Weiser, Powder, Burnt, and Bruneau Rivers. The subbasin drains approximately 8.3 million acres and includes 367 miles of the Snake River mainstem as well as many small tributaries (Ecovista and IDFG 2004). The majority of the Middle Snake Subbasin (82 percent) is located in southern Idaho, with the remainder in small portions of Oregon and Nevada (Ecovista and IDFG 2004). Much of the portion of the river that contains the Snake River Islands Unit forms the border between Idaho and Oregon.
Deer Flat National Wildlife Refuge Comprehensive Conservation Plan
3-18 Chapter 3. Physical Environment
Streamflows in the spring and early summer in the Snake River are driven by snowmelt and runoff from areas where precipitation falls in the form of snow (Ecovista and IDFG 2004). The Middle Snake River is one of the most regulated portions of the Snake River, with much of the annual flow diverted for irrigation. There are many storage and run-of-the-river dam facilities located along the Middle Snake River, but there are no facilities within the portion of the river containing the Refuge islands (U.S. Army Corps of Engineers 2010). The first facility upstream of the Refuge islands is the Swan Falls Dam, a hydroelectric dam, and the first facility downstream of the Refuge islands is the Brownlee Dam, a storage and hydroelectric dam (Ecovista and IDFG 2004). With such a high degree of water regulation, it has been estimated that the late summer and early fall flows downstream of the Snake River Islands Unit are typically greater than they were before flow regulation began (IDEQ and Oregon Department of Environmental Quality [ODEQ] 2004).
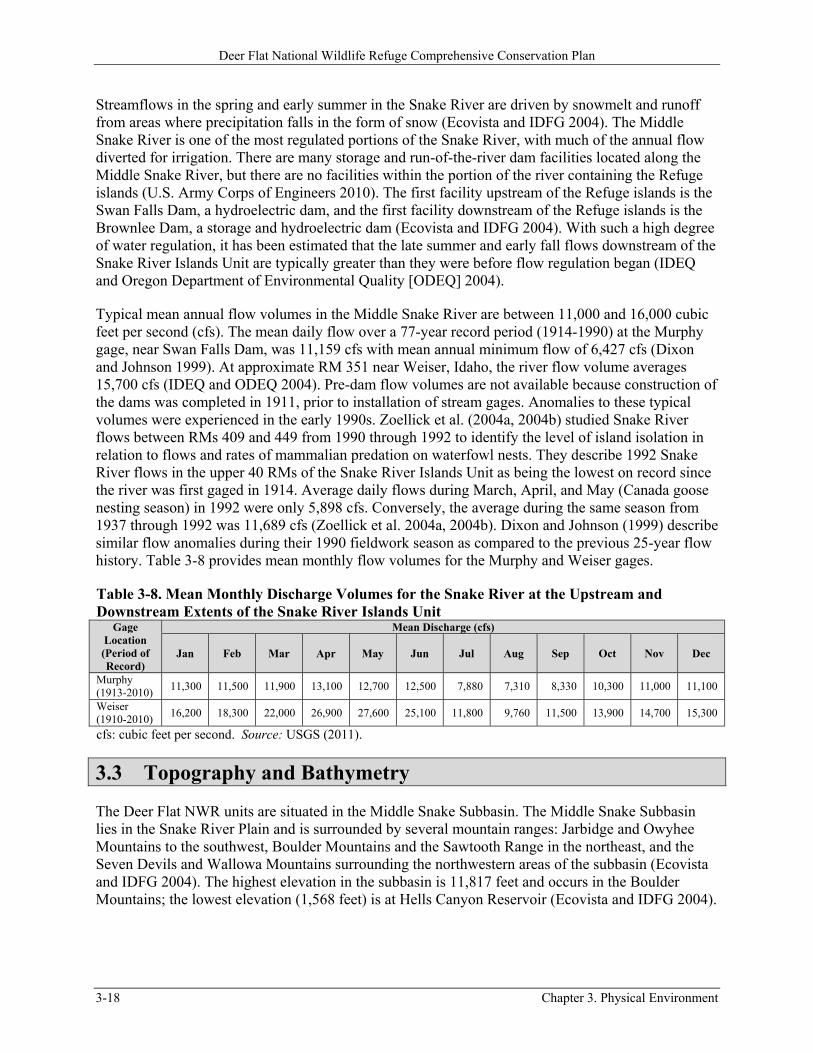
Typical mean annual flow volumes in the Middle Snake River are between 11,000 and 16,000 cubic feet per second (cfs). The mean daily flow over a 77-year record period (1914-1990) at the Murphy gage, near Swan Falls Dam, was 11,159 cfs with mean annual minimum flow of 6,427 cfs (Dixon and Johnson 1999). At approximate RM 351 near Weiser, Idaho, the river flow volume averages 15,700 cfs (IDEQ and ODEQ 2004). Pre-dam flow volumes are not available because construction of the dams was completed in 1911, prior to installation of stream gages. Anomalies to these typical volumes were experienced in the early 1990s. Zoellick et al. (2004a, 2004b) studied Snake River flows between RMs 409 and 449 from 1990 through 1992 to identify the level of island isolation in relation to flows and rates of mammalian predation on waterfowl nests. They describe 1992 Snake River flows in the upper 40 RMs of the Snake River Islands Unit as being the lowest on record since the river was first gaged in 1914. Average daily flows during March, April, and May (Canada goose nesting season) in 1992 were only 5,898 cfs. Conversely, the average during the same season from 1937 through 1992 was 11,689 cfs (Zoellick et al. 2004a, 2004b). Dixon and Johnson (1999) describe similar flow anomalies during their 1990 fieldwork season as compared to the previous 25-year flow history. Table 3-8 provides mean monthly flow volumes for the Murphy and Weiser gages.
Table 3-8. Mean Monthly Discharge Volumes for the Snake River at the Upstream and Downstream Extents of the Snake River Islands Unit
The Deer Flat NWR units are situated in the Middle Snake Subbasin. The Middle Snake Subbasin lies in the Snake River Plain and is surrounded by several mountain ranges: Jarbidge and Owyhee Mountains to the southwest, Boulder Mountains and the Sawtooth Range in the northeast, and the Seven Devils and Wallowa Mountains surrounding the northwestern areas of the subbasin (Ecovista and IDFG 2004). The highest elevation in the subbasin is 11,817 feet and occurs in the Boulder Mountains; the lowest elevation (1,568 feet) is at Hells Canyon Reservoir (Ecovista and IDFG 2004).
Deer Flat National Wildlife Refuge Comprehensive Conservation Plan
Chapter 3. Physical Environment 3-19
3.3.1 Lake Lowell Unit
The Lake Lowell Unit of Deer Flat NWR is situated on a plateau between the Snake River and Boise River (IDEQ 2010). The lake itself was constructed in a natural depression in the Lower Boise River Valley (IDEQ 2010). Its shoreline sits at 2,531 feet above MSL at full pool, 300 feet lower in elevation than the origin of the New York Canal (IDEQ 2010). The Deer Flat Upper Dam is 74 feet high with a crest elevation of 2,539.2 feet (±0.2 feet). The Deer Flat Lower Dam is 46 feet high with a crest elevation of 2,539.3 feet (±1.6 feet). The Deer Flat Middle Dam is 16 feet high with a crest elevation of 2,536.0 feet (±0.1 feet) (Ferrari 1995). The crest of the Middle Dam is lower than that of the Upper and Lower Embankments and serves as an emergency spillway (IDEQ 2010). The highest upland areas within the Refuge boundary at Lake Lowell sit at approximately 2,640 feet above MSL (USGS 1971a).
Lake Lowell is 14.5 square miles in surface area, has 28 miles of shoreline, and covers approximately 9,000 surface acres at full pool (IDEQ 2010). Much of the lake is fringed with riparian habitat and mudflats that are pronounced at low-pool elevation levels (IDEQ 2010). The maximum water surface elevation of the lake is 2,531 feet above MSL (IDEQ 2010). The deepest part of the lake is 2,483.6 feet above MSL, just in front of the Upper Dam headwall (Ferrari 1995). The other deep spot of the lake is just in front of the Lower Dam headwall, at 2,501 feet above MSL (Ferrari 1995). At full pool, these areas are approximately 47 and 30 feet deep, respectively.
In general, the bathymetric map created as a result of the 1994 reservoir survey effort (Ferrari 1995) shows that the banks along the northern portion of the lake are more steeply sloped than those along the southern shoreline. The east end of the lakebed is shallow with a broad, gentle slope (Ferrari 1995). The large pool at the western end of the lake, in front of the Lower Dam, has a deeper lakebed that is also broad and relatively flat (Ferrari 1995).
3.3.2 Snake River Islands Unit
A review of the USGS 7.5-minute series of topographic maps in which the Refuge islands are located indicates the topographic relief of the Refuge islands above the waterline varies from just a few feet to as much as 20 feet; the vast majority of the islands have 10 feet or less of relief (USGS 1951, 1952, 1967, 1968, 1971b, 1971c, 1971d, 1974a, 1974b, 1974c, 1975, 1992a, 1992b, 1992c, 1992d). Although the Snake River falls 7,000 feet over its entire length (IDEQ and ODEQ 2004), it only loses 140 feet of elevation over the course of its flow within the Snake River Islands Unit. The topography of the river path drops from approximately 2,260 feet above MSL at RM 448 (USGS 1992d) to approximately 2,120 feet above MSL at RM 335 (USGS 1974a).
3.4 Geology and Geomorphology
3.4.1 Lake Lowell Unit
The Lake Lowell Unit is located within a large alluvial-filled basin that is underlain by hundreds of meters of unconsolidated to slightly consolidated sediments (IDEQ 2010). The majority of the sediments are fluvial but some are lacustrine in origin (IDEQ 2010). Outcropping in some areas near the lake are composed of the Ten-Mile Gravel formation, described as being as much as a 152-m (500-foot) layer of poorly consolidated silt, sand, gravel, and cobbles; scattered, thin deposits of sand, gravel, and windblown silt cover the thick layer of sediments (IDEQ 2010). Geologically, the
Deer Flat National Wildlife Refuge Comprehensive Conservation Plan
3-20 Chapter 3. Physical Environment
vast majority of the area draining to Lake Lowell consists of detritus deposited by the action of water during the Pleistocene epoch (1.8 million to 10,000 years ago). The soils types that dominate the area draining to Lake Lowell are moderately erosive. Soils are discussed in detail in the following section.
3.4.2 Snake River Islands Unit
The Snake River Islands Unit is located within the western Snake River Plain. The river flows through a major hydrologic and topographic transition between the eastern and western Snake River Plains, which are divided near King Hill, Idaho (Ecovista and IDFG 2004). Groundwater permeability and transmissivity are quite high in the eastern plain and fairly low in the western plain (Ecovista and IDFG 2004). The western plain is 30 to 43 miles wide and trends northwest; it is far lower in elevation than is the eastern plain (Ecovista and IDFG 2004). The Snake River Islands Unit sits within a fault-bound basin with the land surface and rock layers dipping toward the axis of the plain (Ecovista and IDFG 2004). The western plain is filled with lacustrine and fluviatile sedimentary deposits that are interbedded with basalt (Ecovista and IDFG 2004). For most of its course in the Snake River Plain, the river is deeply incised in the sedimentary deposits (O’Connor 1993). Two significant geologic flood events that have made marked impacts on the geomorphology of the Snake River and the Snake River Plain are described below. The Lake Idaho and the Lake Bonneville geologic flood events are not only responsible for the course and character of the Snake River itself but also for features such as the depression in which Lake Lowell was developed.
3.4.2.1 Lake Idaho
The present course and character of the Snake River in the Snake River Plain are the result of the integration of the Snake River and Columbia River drainages (O’Connor 1993). Until about 1.5 million years ago, the Snake River Plain was isolated from the Columbia River Basin. At that time, Lake Idaho sat behind a lava flow that dammed the Snake River at the narrows of Hells Canyon and backed up the river to Twin Falls, Idaho (Orr and Orr 1996). Lake Idaho eventually cut through the lava flow dam at what is now Hells Canyon and eventually drained Lake Idaho, creating a free-flowing river; once the Snake and Columbia River Basins were connected, the Snake River and its tributaries began to cut their current valleys (Malde 1991; Wood and Clemens 2002). Prior to the integration of these two river drainages, the western Snake River Plain was a depositional center characterized by low-energy fluvial and lacustrine environments (Malde 1991). The remnants of Lake Idaho are evident in the lake sediment and playa lithologies above Hells Canyon Dam (Ecovista and IDFG 2004).
3.4.2.2 Lake Bonneville Flood
More recently, approximately 14,500 years ago, the Lake Bonneville Flood resulted from nearly 1,200 cubic miles of water spilling out of the Great Basin and into the Snake River drainage (O’Connor and Costa 2004). This basin-breach flood occurred when Lake Bonneville (the ice-age predecessor to the Great Salt Lake) overtopped its basin rim at Red Rock Pass, and the spillover caused rapid erosion that further released huge volumes of flow into the Snake River Plain (O’Connor 1993; O’Connor and Costa 2004). The flood entered the Snake River Plain north of Pocatello and followed the vast volcanic plain westward for about 370 miles before turning north and entering Hells Canyon (O’Connor 1993). The Snake River is the primary topographic feature on the plain, and its canyons and valleys were the major conduit for the floodwaters (O’Connor 1993). The sustained peak discharge of about 1 million cfs filled a canyon that was 328 feet deep and overflowed onto the basalt uplands of the Snake River Plain (O’Connor and Costa 2004).
Deer Flat National Wildlife Refuge Comprehensive Conservation Plan
Chapter 3. Physical Environment 3-21
3.5 Soils
3.5.1 Lake Lowell Unit
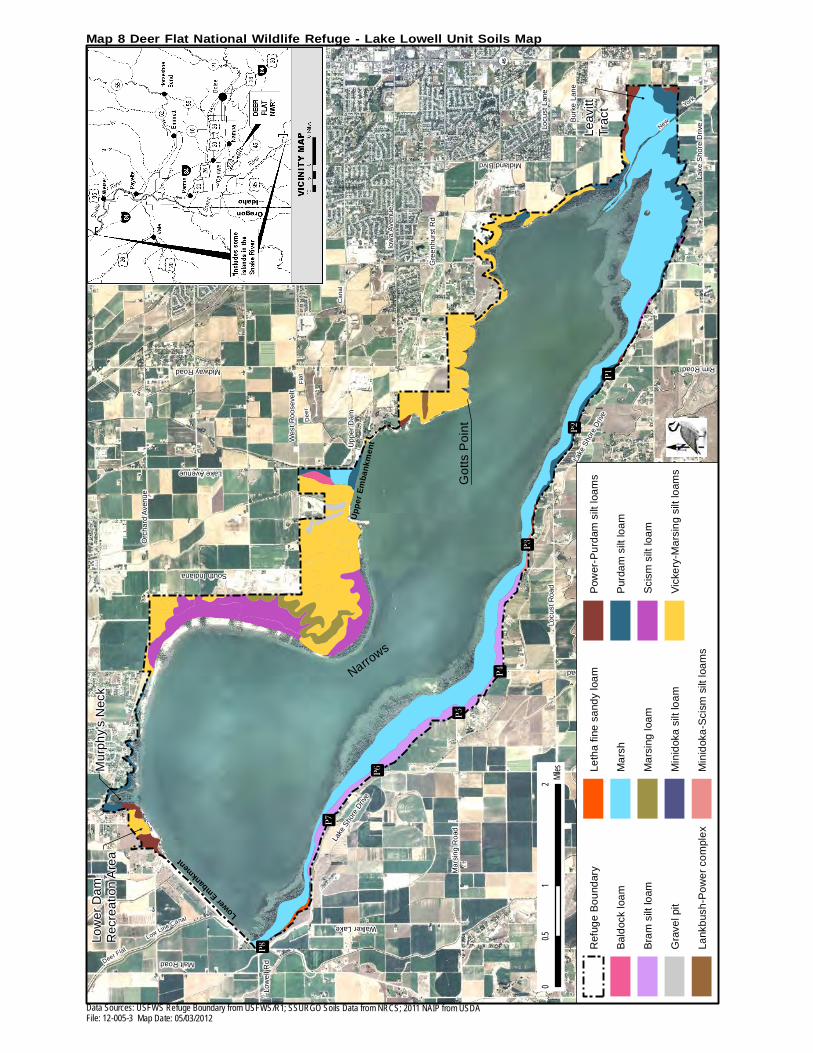
The Soil Survey of Canyon Area, Idaho (Priest et al. 1972) describes the soils surrounding Lake Lowell as primarily consisting of a mix of Vickery and Marsing soils with lesser areas of Scism, Purdam, Power-Purdam, and Bram soils (Map 8). Some of the areas on the Refuge lands immediately surrounding Lake Lowell are mapped as Marsh and the lake itself, of course, is mapped as Water. With the exception of the Bram soils, which are somewhat poorly drained, the soils mapped on the Lake Lowell Unit are well drained. According to the soil survey, typical vegetation in the Canyon County area consists mainly of big sagebrush, bluebunch wheatgrass, Sandberg’s bluegrass, giant wildrye, and cheatgrass. About 85 percent of the county is used for irrigated crops or improved pasture, and the principal crops are irrigated small grains, corn, sugar beets, and alfalfa (Priest et al. 1972). The soils surrounding the Refuge, and to a lesser extent, on the Refuge, have been affected by agriculture. They have been irrigated under artificial hydrology patterns and altered through the typical soil-turning activities associated with agriculture.
The area surrounding upper Lake Lowell (the east pool) consists primarily of soils in the Vickery and Marsing series: Vickery-Marsing silt loams, 1 to 3 percent slopes (Map Unit VmB) and Vickery-Marsing silt loams, 3 to 7 percent slopes (Map Unit VmC) (Priest et al. 1972). Small areas of Purdam silt loam, 1 to 3 percent slope (Map Unit PrB), which occurs in old stream terraces, are also mapped in the upper lake area (Priest et al. 1972). In addition to areas of Vickery-Marsing silt loams, the Refuge uplands north of middle Lake Lowell are also characterized by areas of Scism silt loam (Map Units ScB [1 to 3 percent slopes] and ScC [3 to 7 percent slopes]). The erosion hazard from irrigation water in the 1 to 3 percent slope unit is slight to moderate, and in the 3 to 7 percent slope unit it is severe (Priest et al. 1972). Lower Lake Lowell (the west pool) is also surrounded by a great deal of Vickery-Marsing silt loam, especially to the immediate northeast. In addition, there is a mix of Power-Purdam silt loams (Map Units PpA and PpB), Purdam (Map Unit PrB), and Purdam-Sebree silt loam (Map Unit PtB) to the north and a small area of Bram silt loam (Map Unit BrA) in the most northwestern area of the Refuge surrounding the lake.
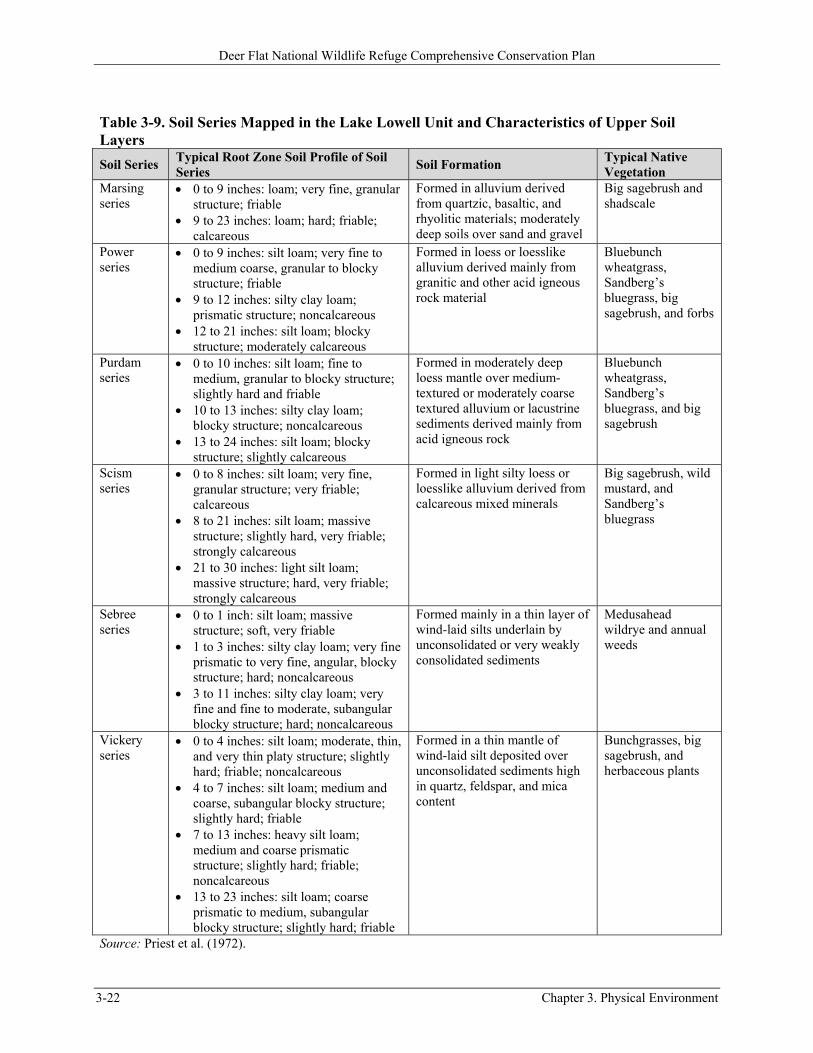
Table 3-9 lists the soil types mapped in the Lake Lowell Unit and the characteristics of the upper layers (i.e., the root zone for vegetation growth).
Deer Flat National Wildlife Refuge Comprehensive Conservation Plan
3-22 Chapter 3. Physical Environment
Table 3-9. Soil Series Mapped in the Lake Lowell Unit and Characteristics of Upper Soil Layers
Soil Series Typical Root Zone Soil Profile of Soil Series
Soil Formation Typical Native Vegetation
Marsing series
0 to 9 inches: loam; very fine, granular structure; friable
9 to 23 inches: loam; hard; friable; calcareous
Formed in alluvium derived from quartzic, basaltic, and rhyolitic materials; moderately deep soils over sand and gravel
Big sagebrush and shadscale
Power series
0 to 9 inches: silt loam; very fine to medium coarse, granular to blocky structure; friable
9 to 12 inches: silty clay loam; prismatic structure; noncalcareous
12 to 21 inches: silt loam; blocky structure; moderately calcareous
Formed in loess or loesslike alluvium derived mainly from granitic and other acid igneous rock material
Bluebunch wheatgrass, Sandberg’s bluegrass, big sagebrush, and forbs
Purdam series
0 to 10 inches: silt loam; fine to medium, granular to blocky structure; slightly hard and friable
10 to 13 inches: silty clay loam; blocky structure; noncalcareous
13 to 24 inches: silt loam; blocky structure; slightly calcareous
Formed in moderately deep loess mantle over medium-textured or moderately coarse textured alluvium or lacustrine sediments derived mainly from acid igneous rock
Bluebunch wheatgrass, Sandberg’s bluegrass, and big sagebrush
Scism series
0 to 8 inches: silt loam; very fine, granular structure; very friable; calcareous
8 to 21 inches: silt loam; massive structure; slightly hard, very friable; strongly calcareous
21 to 30 inches: light silt loam; massive structure; hard, very friable; strongly calcareous
Formed in light silty loess or loesslike alluvium derived from calcareous mixed minerals
Big sagebrush, wild mustard, and Sandberg’s bluegrass
Sebree series
0 to 1 inch: silt loam; massive structure; soft, very friable
1 to 3 inches: silty clay loam; very fine prismatic to very fine, angular, blocky structure; hard; noncalcareous
3 to 11 inches: silty clay loam; very fine and fine to moderate, subangular blocky structure; hard; noncalcareous
Formed mainly in a thin layer of wind-laid silts underlain by unconsolidated or very weakly consolidated sediments
Medusahead wildrye and annual weeds
Vickery series
0 to 4 inches: silt loam; moderate, thin, and very thin platy structure; slightly hard; friable; noncalcareous
4 to 7 inches: silt loam; medium and coarse, subangular blocky structure; slightly hard; friable
7 to 13 inches: heavy silt loam; medium and coarse prismatic structure; slightly hard; friable; noncalcareous
13 to 23 inches: silt loam; coarse prismatic to medium, subangular blocky structure; slightly hard; friable
Formed in a thin mantle of wind-laid silt deposited over unconsolidated sediments high in quartz, feldspar, and mica content
Bunchgrasses, big sagebrush, and herbaceous plants
Source: Priest et al. (1972).
Gre
en
hu
rst
Rd
Lo
we
r D
am
R
ecr
ea
tion
Are
a
Up
pe
r D
am
Go
tts
Po
int
Le
avi
tt
Tra
ctP1
Mu
rph
y's
Ne
ck
P2
P3
P4
P5
P6
P7
P8
Orc
ha
rd A
ven
ue
We
st R
oo
seve
lt
Iow
a A
venu
e
Locu
st L
ane
Bu
rke
La
ne
Locu
st R
oa
d
Lew
is L
an
e
Ma
rsin
g R
oad
Low
ell
RdMalt Road
South Indiana
Lake Avenue
Midway Road
Walker Lake
Farner Road
Lake
Sh
ore
Dri
ve
Lake
Sho
re D
rive
Lake
Sho
re D
rive
Rim Road
Midland Blvd
Narrows
Low Line Canal
Deer Flat
New
York
Canal
De
er
Fla
t
Ca
na
l
¬«45¬«55¥84
Lower Embankm
ent
Uppe
r Emb
ankm
ent
01
20.5
Mile
s
Map 8 Deer Flat National Wildlife Refuge - Lake Lowell Unit Soils Map
NAM
PA
Ref
uge
Bo
und
ary
Bal
doc
k lo
am
Bra
m s
ilt lo
am
Gra
vel p
it
Lank
bus
h-P
ow
er
com
ple
x
Leth
a fin
e s
and
y lo
am
Ma
rsh
Ma
rsin
g lo
am
Min
idok
a s
ilt lo
am
Min
idok
a-S
cism
silt
loa
ms
Pow
er-P
urd
am s
ilt lo
am
s
Pur
dam
silt
loa
m
Sci
sm s
ilt lo
am
Vic
kery
-Ma
rsin
g s
ilt lo
ams
Data Sources: U SFW S Re fuge Boundary from USFWS/R1; SSUR GO So ils Data from NR CS; 2011 NAIP from USD AFile: 12 -005 -3 M ap Da te: 05/03/2012
kkierhaggenjos
Typewritten Text
3-23
Deer Flat National Wildlife Refuge Comprehensive Conservation Plan
3-24 Chapter 3. Physical Environment
Document continues on next page.
Deer Flat National Wildlife Refuge Comprehensive Conservation Plan
Chapter 3. Physical Environment 3-25
3.5.2 Snake River Islands Unit
Soil types are mapped for the majority of islands in the Snake River Islands Unit, and of the mapped islands, the majority are mapped as Riverwash (Map Unit Re). Riverwash is loose water-washed sand, gravel, cobblestones, and stones and occurs mostly as gravel bars along the Snake River (Lovell 1980; Rasmussen 1976). According to the Canyon County soil survey, Riverwash soils in general support very little plant growth, but when plants are present they typically consist of weeds, willows, sagebrush, and annual grasses; it is generally only suitable as wildlife habitat (Lovell 1980; Rasmussen 1976). The vegetation on Refuge islands differs from the soil survey’s characterization of vegetation found on Riverwash soils. Refuge islands contain trees and thick stands of vegetation in many areas, and there are also islands, on which vegetation has been altered by past farming and grazing.
A baseline study conducted along the reach of the middle Snake River containing the Snake River Islands Unit summarizes island vegetation as consisting of approximately 44 percent riparian habitats, 48 percent upland vegetation, and 9 percent agriculture (Dixon and Johnson 1999). The baseline study further concluded that the islands’ riparian vegetation is composed of 65 percent riparian shrub, 23 percent dense woodland, and 3 percent herbaceous riparian. Approximately two-thirds of the trees were exotic species, principally Russian olive and tamarisk. Regionally, native species included peachleaf willow and netleaf hackberry (Dixon and Johnson 1999). There are also several other soil types represented among the islands. Table 3-10 lists the soils types and the survey areas in which they are described as well as the drainage class for each. Although the majority of the unit’s islands were mapped for soil types in various surveys, none of the islands in Owyhee and Washington counties were mapped for soil types; therefore, other soil types may occur in addition to those included in Table 3-10.
Table 3-10. Soil Types Mapped for the Snake River Islands Unit of Deer Flat NWR Map Unit Code Soil Name Drainage Class Canyon Area, Idaho BdA Baldock loam, 0 to 1 percent slopes Somewhat poorly drained BdB Baldock loam, 1 to 3 percent slopes Somewhat poorly drained BhA Baldock loam, high water table, 0 to 1 percent slopes Somewhat poorly drained BsA Bram silt loam, saline-alkali, 0 to 1 percent slopes Somewhat poorly drained Cu Cruickshank fine sandy loam Somewhat poorly drained FeB Feltham loamy fine sand, 0 to 3 percent slopes Somewhat excessively drained GaB Garbutt silt loam, 1 to 3 percent slopes Well drained MtB Moulton fine sandy loam, 1 to 3 percent slopes Somewhat poorly drained OgA Oliaga loam, 0 to 1 percent slopes Somewhat poorly drained Re Riverwash NA TuB Turbyfill fine sandy loam, 1 to 3 percent slopes Well drained Malheur County, Oregon 7 Falk variant fine sandy loam Moderately well drained 8A Feltham loamy fine sand, 0 to 2 percent slopes Excessively drained 12A Garbutt silt loam, 0 to 2 percent slopes Well drained 20 Notus-Falk variant complex Moderately well drained 29 Riverwash NA 33A Turbyfill fine sandy loam, 0 to 2 percent slopes Well drained 34 Umapine silt loam Somewhat poorly drained Payette County, Idaho No Notus coarse sandy loam Somewhat poorly drained Rh Riverwash NA Source: Lovell (1980); Priest et al. (1972); Rasmussen (1976).
Deer Flat National Wildlife Refuge Comprehensive Conservation Plan
3-26 Chapter 3. Physical Environment
3.6 Fire
The Refuge has an approved fire management plan, and much of the information described in this section is captured from that plan. A copy of the complete approved plan can be found in Appendix K. Despite the inclusion of prescribed fire in the approved plan, this method has not been used as a management tool for at least a dozen years because of smoke management concerns, proximity to urban interfaces, and lack of available fire personnel (USFWS 2009a). Mechanical fire suppression treatments have been completed on 1,002 acres of the Lake Lowell Unit during the decade prior to 2009. Treatments included reduction of fire fuels (i.e., invasive tree removal and riparian understory mastication) and fireline discing. No treatments have been implemented on the Snake River Islands Unit during that period.
Because of the arid conditions of this area, fires can occur during almost any month of the year. Most fires on the Refuge occur from June through August; most fires are caused by humans and result from high visitor use. From 1997 to 2007 the Refuge experienced 30 wildfires that burned a total of 320 acres (USFWS 2009a). The majority of the fires occurred in the sagebrush-steppe habitat with a few occurring in the dense riparian area next to Lake Lowell. The two largest fires, CC Lightning and Sage Fires, occurred in 2003 and 2006 and burned 100 and 105 acres, respectively, of sagebrush-steppe habitat (USFWS 2009a). The vast majority of the individual fires recorded during the 10-year reporting period burned less than 10 acres each. Fire frequency on the Refuge has ranged from 16 fires in one year (1977) to a five-year period (from 1951 to 1956) with no fires. The fire management plan in Appendix K includes the complete fire history for the Refuge.
Refuge habitats are heavily infested with cheatgrass, which has greatly increased the natural fire frequency of this sage-steppe community. Invasion by cheatgrass leads to a grass-fire cycle in which cheatgrass promotes large fires that allow further increases in cheatgrass (Baker 2006). Additional discussion of cheatgrass and habitat is contained in Chapter 4, Biological Environment.
3.7 Air Quality
The EPA has established national standards for six “criteria” pollutants: carbon monoxide, ozone, nitrogen dioxide, lead, particulate matter, and sulfur dioxide. The State of Idaho has adopted the EPA standards as state rules. The standards are for the protection of human, plant, and animal welfare and to prevent damage to the natural and built environment. IDEQ is responsible for supervising and administering the state air quality program. EPA and IDEQ also identify and regulate toxic or hazardous air pollution.
The mission of the Service’s Air Quality Program is to protect and enhance air quality in support of ecosystem management in the NWRS. The program’s vision is a Refuge System free of impacts from human-caused air pollution that is consistent with the Refuge System Improvement Act (Public Law 105-57), which requires that “the biological integrity, diversity, and environmental health of the [Refuge] System are maintained” (USFWS 2011b). Contributions to air quality on the Refuge, as well as to the larger Boise region, are likely negligible. Management activities such as prescribed fire are not currently being implemented on the Refuge, and sources of pollutant emissions due to heavy machinery use for habitat management and farming activities are limited.
Deer Flat Refuge is located in the IDEQ Boise Region, which encompasses 10 southwestern Idaho counties, including those in which the Refuge lands are located: Canyon, Owyhee, Payette, and
Deer Flat National Wildlife Refuge Comprehensive Conservation Plan
Chapter 3. Physical Environment 3-27
Washington. Most of the air quality focus in this region is centered on the Treasure Valley, in which much of the Refuge lands are located. The majority of the valley’s population and emission sources are concentrated in Ada and Canyon counties; other counties in the region are sparsely populated and have few emission sources (IDEQ 2011a). It is likely that emission sources in eastern Oregon and northern Nevada contribute to the air quality of the Treasure Valley as well.
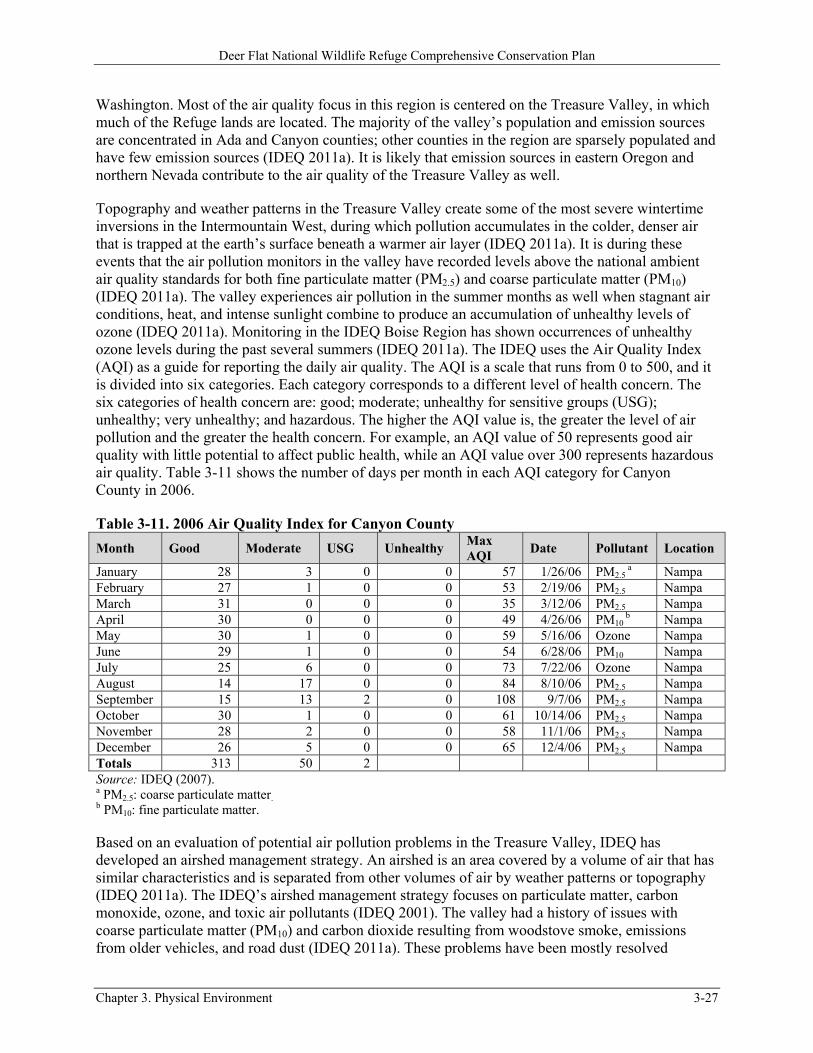
Topography and weather patterns in the Treasure Valley create some of the most severe wintertime inversions in the Intermountain West, during which pollution accumulates in the colder, denser air that is trapped at the earth’s surface beneath a warmer air layer (IDEQ 2011a). It is during these events that the air pollution monitors in the valley have recorded levels above the national ambient air quality standards for both fine particulate matter (PM2.5) and coarse particulate matter (PM10) (IDEQ 2011a). The valley experiences air pollution in the summer months as well when stagnant air conditions, heat, and intense sunlight combine to produce an accumulation of unhealthy levels of ozone (IDEQ 2011a). Monitoring in the IDEQ Boise Region has shown occurrences of unhealthy ozone levels during the past several summers (IDEQ 2011a). The IDEQ uses the Air Quality Index (AQI) as a guide for reporting the daily air quality. The AQI is a scale that runs from 0 to 500, and it is divided into six categories. Each category corresponds to a different level of health concern. The six categories of health concern are: good; moderate; unhealthy for sensitive groups (USG); unhealthy; very unhealthy; and hazardous. The higher the AQI value is, the greater the level of air pollution and the greater the health concern. For example, an AQI value of 50 represents good air quality with little potential to affect public health, while an AQI value over 300 represents hazardous air quality. Table 3-11 shows the number of days per month in each AQI category for Canyon County in 2006.
Table 3-11. 2006 Air Quality Index for Canyon County
Month Good Moderate USG Unhealthy Max AQI
Date Pollutant Location
January 28 3 0 0 57 1/26/06 PM2.5 a Nampa
February 27 1 0 0 53 2/19/06 PM2.5 Nampa March 31 0 0 0 35 3/12/06 PM2.5 Nampa April 30 0 0 0 49 4/26/06 PM10
b Nampa May 30 1 0 0 59 5/16/06 Ozone Nampa June 29 1 0 0 54 6/28/06 PM10 Nampa July 25 6 0 0 73 7/22/06 Ozone Nampa August 14 17 0 0 84 8/10/06 PM2.5 Nampa September 15 13 2 0 108 9/7/06 PM2.5 Nampa October 30 1 0 0 61 10/14/06 PM2.5 Nampa November 28 2 0 0 58 11/1/06 PM2.5 Nampa December 26 5 0 0 65 12/4/06 PM2.5 Nampa Totals 313 50 2 Source: IDEQ (2007). a PM2.5: coarse particulate matter. b PM10: fine particulate matter.
Based on an evaluation of potential air pollution problems in the Treasure Valley, IDEQ has developed an airshed management strategy. An airshed is an area covered by a volume of air that has similar characteristics and is separated from other volumes of air by weather patterns or topography (IDEQ 2011a). The IDEQ’s airshed management strategy focuses on particulate matter, carbon monoxide, ozone, and toxic air pollutants (IDEQ 2001). The valley had a history of issues with coarse particulate matter (PM10) and carbon dioxide resulting from woodstove smoke, emissions from older vehicles, and road dust (IDEQ 2011a). These problems have been mostly resolved
Deer Flat National Wildlife Refuge Comprehensive Conservation Plan
3-28 Chapter 3. Physical Environment
through Federal regulations, technological changes, and implementation of comprehensive air quality management plans. However, IDEQ continues to monitor PM10 and carbon monoxide levels in Ada and Canyon counties (IDEQ 2011a).
3.8 Visual Quality
The quality of a viewshed is generally defined on a spectrum from the most natural state of the landscape to the degree in which it is altered with regard to basic elements of form, line, color, and texture found in the predominant natural features of the characteristic landscape. A viewshed is an area that is visible from a specific location. It may be considered as the viewshed toward or from a particular area or point.
The Service has not classified the Refuge’s viewsheds nor is the undertaking of a key observation point analysis part of this planning effort. On a broad landscape level and as part of the effort to develop resource management plans, the BLM has classified much of the land surrounding the Refuge units based on BLM’s Visual Resource Management (VRM) classification system (classes 1 through 4). VRM classifications are based on measures of scenic quality, sensitivity levels, and distance zones. Scenic quality is a measure of visual appeal and visual sensitivity is a measure of public concern for scenic quality. Distance zones are based on relative visibility from travel routes or observation points (BLM 2008).
The broad landscape surrounding the Lake Lowell Unit is classified as VRM 4. This classification level is reserved for areas with the most alteration or disturbance in the viewshed. For example, the BLM’s management objectives for VRM 4 areas describe activities that may require major modification of the existing character of the landscape (BLM 2008). Because of the high level of agricultural practices and urban interface in the Lake Lowell area, as well as continuing urban development, VRM 4 is an appropriate classification for the surrounding area. In contrast, the Refuge itself is mostly undeveloped; however, the landscape of the Refuge has been altered to some extent by past human development. The Refuge contains human-made structures including dams, roads, and recreational facilities surrounding Lake Lowell, the Visitor Center, and Maintenance Area.
The BLM Four Rivers Field Office Resource Management Plan (RMP) and EIS defines the Snake River corridor from approximately RM 352 to approximate RM 447 as VRM 3 (BLM 2008). The BLM’s management objectives for VRM 3 areas are to partially retain the existing character of the landscape. Management activities may attract attention but should not dominate the view of the casual observer (BLM 2008). The same RMP/EIS defines the Snake River downstream to approximate RM 266 as VRM 2 (BLM 2008). BLM describes that overall Snake River corridor as providing high-quality scenery with diverse vegetation, water features, rock formations, and potential for wildlife viewing (BLM 2008). BLM further defines the characteristics of high-quality scenery as providing color variations from the more muted upland hues; incorporating seasonal variations in color that are more dynamic along the river relative to the uplands; and including water that moves through the corridor, draws the eye, and dominates the foreground views (BLM 2008). The Owyhee RMP also defines the Snake River corridor from approximate RM 407 to approximate RM 446 as VRM 3 (BLM 1999). The Owyhee RMP planning area borders the Four Rivers planning area at the Snake River in Idaho. The portion of the Snake River corridor bordering the Four Rivers planning area in Oregon is not classified for VRM (BLM 2001).
Deer Flat National Wildlife Refuge Comprehensive Conservation Plan
Chapter 3. Physical Environment 3-29
3.9 Water Quality
The Idaho water quality standards program is a joint effort between IDEQ and EPA. IDEQ develops and enforces water-quality standards that protect beneficial uses. According to the Idaho Administrative Code, beneficial use is defined as “any of the various uses which may be made of the water of Idaho, including, but not limited to, domestic water supplies, industrial water supplies, agricultural water supplies, navigation, recreation in and on the water, wildlife habitat, and aesthetics. The beneficial use is dependent upon actual use, the ability of the water to support a nonexisting use either now or in the future, and its likelihood of being used in a given manner (Idaho Administrative Procedure Act [IDAPA] 58.01.02.010 [08]).” Lake Lowell has three designated beneficial uses: support of warm water aquatic life, use for primary contact recreation, and a special resource water (IDEQ 2010). Lake Lowell is designated as a special resource water (for wildlife habitat) because it is within the Refuge and is of prime importance to the mission of the Refuge.
The Clean Water Act (CWA; 33 U.S.C. 1251) requires states to adopt water quality standards for each of the possible designated uses they assign to their waters. Section 303(d) of the CWA establishes requirements for states to identify and prioritize water bodies that are water quality-limited (i.e., water bodies that do not meet water quality standards). States must periodically publish a priority list (a “303(d) list”) of impaired waters. Currently, this list must be published every two years. For waters identified on this list, states must develop a TMDL for the pollutants resulting in the impaired water quality. A TMDL is a calculation of the maximum amount, or load, of a pollutant that a water body can receive from human-caused sources and still meet water quality standards (IDEQ 2011b). Data collected for development of the Lake Lowell TMDL indicate that the beneficial uses of Lake Lowell are not met due to excessive algal and macrophyte growth (IDEQ 2010).
The EPA develops regulations, policies, and guidance, to help the State of Idaho implement its water quality program and to ensure that Idaho’s adopted standards are consistent with the requirements of the CWA. The State has adopted both numeric and narrative water quality standards to protect beneficial uses. Numeric criteria have been adopted for pollutants such as bacteria, dissolved oxygen (DO), pH, ammonia, temperature, and turbidity, and narrative criteria have been adopted for pollutants such as sediment and nutrients (IDAPA 58.01.02.250). Examples of narrative criteria include the following:
“Sediment shall not exceed quantities specified in Sections 250 and 252 or, in the absence of specific sediment criteria, quantities which impair designated beneficial uses. Determinations of impairment shall be based on water quality monitoring and surveillance and the information utilized as described in Subsection 350” (IDAPA 58.01.02.200.08).
“Surface waters of the state shall be free from excess nutrients that can cause visible slime growths or other nuisance aquatic growths impairing designated beneficial uses” (IDAPA 58.01.02.200.06).
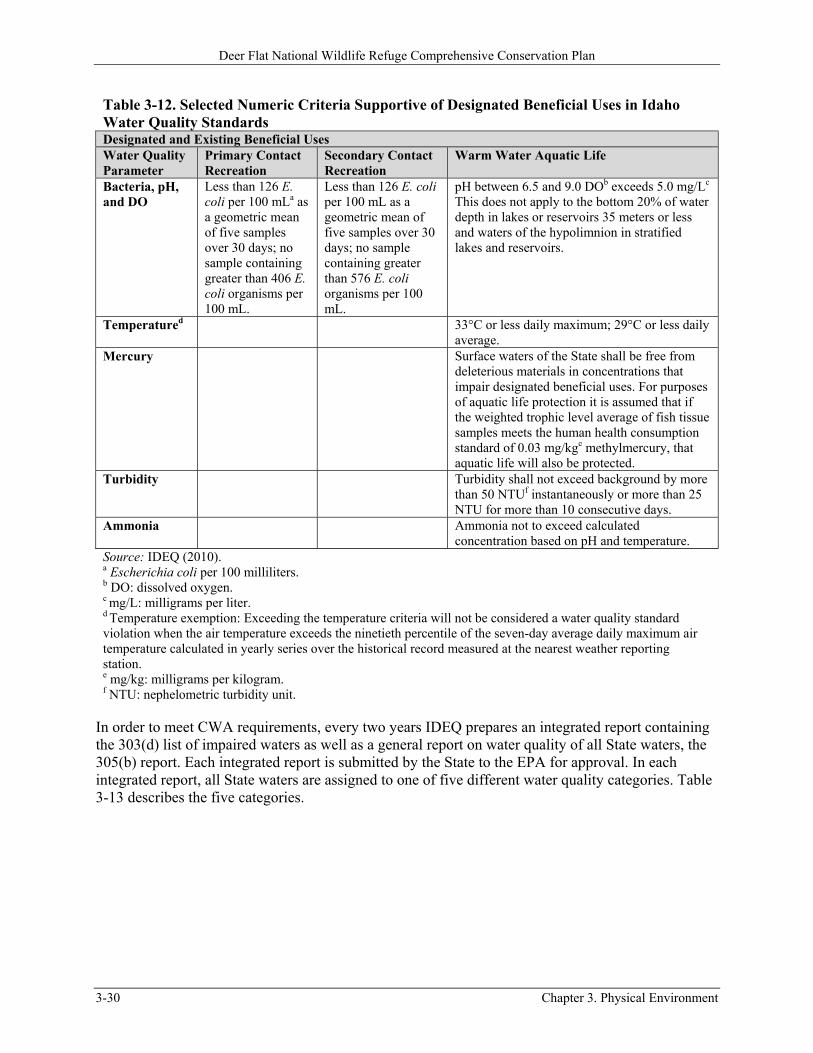
Table 3-12 includes the numeric criteria commonly used in TMDLs in Idaho’s water quality standards.
Deer Flat National Wildlife Refuge Comprehensive Conservation Plan
3-30 Chapter 3. Physical Environment
Table 3-12. Selected Numeric Criteria Supportive of Designated Beneficial Uses in Idaho Water Quality Standards Designated and Existing Beneficial Uses Water Quality Parameter
Primary Contact Recreation
Secondary Contact Recreation
Warm Water Aquatic Life
Bacteria, pH, and DO
Less than 126 E. coli per 100 mLa as a geometric mean of five samples over 30 days; no sample containing greater than 406 E. coli organisms per 100 mL.
Less than 126 E. coli per 100 mL as a geometric mean of five samples over 30 days; no sample containing greater than 576 E. coli organisms per 100 mL.
pH between 6.5 and 9.0 DOb exceeds 5.0 mg/Lc
This does not apply to the bottom 20% of water depth in lakes or reservoirs 35 meters or less and waters of the hypolimnion in stratified lakes and reservoirs.
Temperatured 33°C or less daily maximum; 29°C or less daily average.
Mercury Surface waters of the State shall be free from deleterious materials in concentrations that impair designated beneficial uses. For purposes of aquatic life protection it is assumed that if the weighted trophic level average of fish tissue samples meets the human health consumption standard of 0.03 mg/kge methylmercury, that aquatic life will also be protected.
Turbidity Turbidity shall not exceed background by more than 50 NTUf instantaneously or more than 25 NTU for more than 10 consecutive days.
Ammonia Ammonia not to exceed calculated concentration based on pH and temperature.
Source: IDEQ (2010). a Escherichia coli per 100 milliliters. b DO: dissolved oxygen. c mg/L: milligrams per liter. d Temperature exemption: Exceeding the temperature criteria will not be considered a water quality standard violation when the air temperature exceeds the ninetieth percentile of the seven-day average daily maximum air temperature calculated in yearly series over the historical record measured at the nearest weather reporting station. e mg/kg: milligrams per kilogram. f NTU: nephelometric turbidity unit.
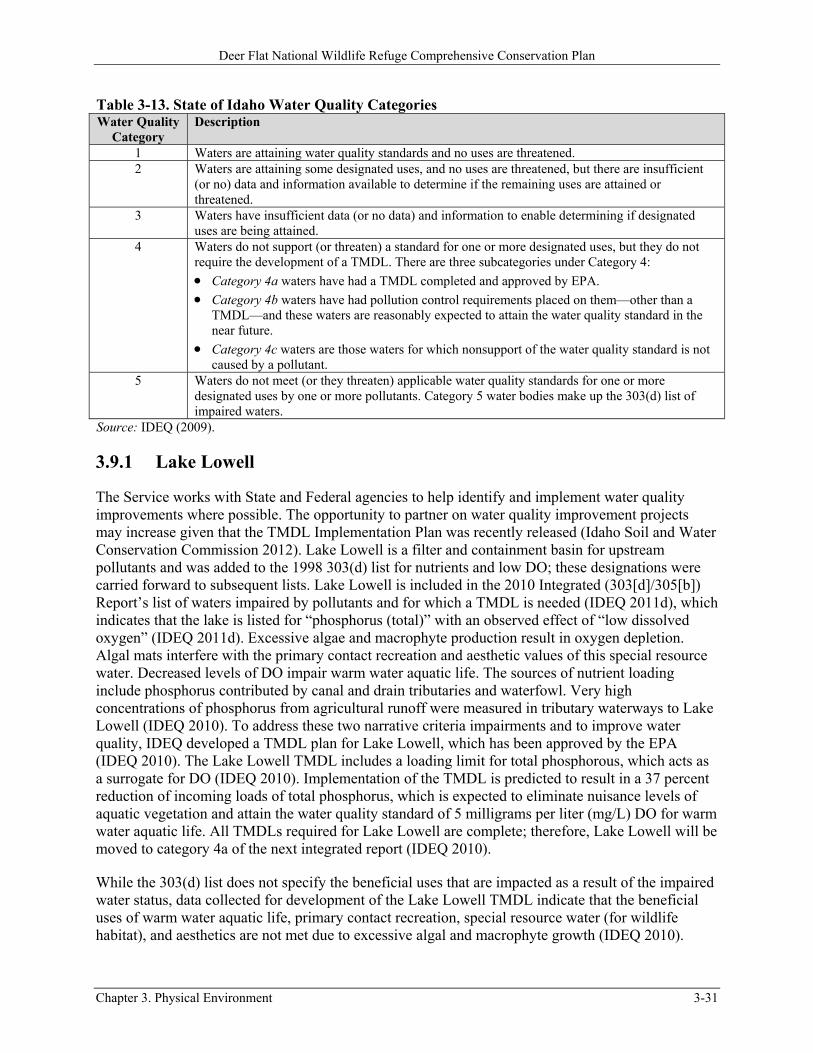
In order to meet CWA requirements, every two years IDEQ prepares an integrated report containing the 303(d) list of impaired waters as well as a general report on water quality of all State waters, the 305(b) report. Each integrated report is submitted by the State to the EPA for approval. In each integrated report, all State waters are assigned to one of five different water quality categories. Table 3-13 describes the five categories.
Deer Flat National Wildlife Refuge Comprehensive Conservation Plan
Chapter 3. Physical Environment 3-31
Table 3-13. State of Idaho Water Quality Categories Water Quality
Category Description
1 Waters are attaining water quality standards and no uses are threatened. 2 Waters are attaining some designated uses, and no uses are threatened, but there are insufficient
(or no) data and information available to determine if the remaining uses are attained or threatened.
3 Waters have insufficient data (or no data) and information to enable determining if designated uses are being attained.
4 Waters do not support (or threaten) a standard for one or more designated uses, but they do not require the development of a TMDL. There are three subcategories under Category 4:
Category 4a waters have had a TMDL completed and approved by EPA. Category 4b waters have had pollution control requirements placed on them—other than a
TMDL—and these waters are reasonably expected to attain the water quality standard in the near future.
Category 4c waters are those waters for which nonsupport of the water quality standard is not caused by a pollutant.
5 Waters do not meet (or they threaten) applicable water quality standards for one or more designated uses by one or more pollutants. Category 5 water bodies make up the 303(d) list of impaired waters.
Source: IDEQ (2009).
3.9.1 Lake Lowell
The Service works with State and Federal agencies to help identify and implement water quality improvements where possible. The opportunity to partner on water quality improvement projects may increase given that the TMDL Implementation Plan was recently released (Idaho Soil and Water Conservation Commission 2012). Lake Lowell is a filter and containment basin for upstream pollutants and was added to the 1998 303(d) list for nutrients and low DO; these designations were carried forward to subsequent lists. Lake Lowell is included in the 2010 Integrated (303[d]/305[b]) Report’s list of waters impaired by pollutants and for which a TMDL is needed (IDEQ 2011d), which indicates that the lake is listed for “phosphorus (total)” with an observed effect of “low dissolved oxygen” (IDEQ 2011d). Excessive algae and macrophyte production result in oxygen depletion. Algal mats interfere with the primary contact recreation and aesthetic values of this special resource water. Decreased levels of DO impair warm water aquatic life. The sources of nutrient loading include phosphorus contributed by canal and drain tributaries and waterfowl. Very high concentrations of phosphorus from agricultural runoff were measured in tributary waterways to Lake Lowell (IDEQ 2010). To address these two narrative criteria impairments and to improve water quality, IDEQ developed a TMDL plan for Lake Lowell, which has been approved by the EPA (IDEQ 2010). The Lake Lowell TMDL includes a loading limit for total phosphorous, which acts as a surrogate for DO (IDEQ 2010). Implementation of the TMDL is predicted to result in a 37 percent reduction of incoming loads of total phosphorus, which is expected to eliminate nuisance levels of aquatic vegetation and attain the water quality standard of 5 milligrams per liter (mg/L) DO for warm water aquatic life. All TMDLs required for Lake Lowell are complete; therefore, Lake Lowell will be moved to category 4a of the next integrated report (IDEQ 2010).
While the 303(d) list does not specify the beneficial uses that are impacted as a result of the impaired water status, data collected for development of the Lake Lowell TMDL indicate that the beneficial uses of warm water aquatic life, primary contact recreation, special resource water (for wildlife habitat), and aesthetics are not met due to excessive algal and macrophyte growth (IDEQ 2010).
Deer Flat National Wildlife Refuge Comprehensive Conservation Plan
3-32 Chapter 3. Physical Environment
Table 3-14 provides a description of all beneficial use designations used by the State and identifies those that apply to Lake Lowell as well as those that are recognized as impaired.
Table 3-14. Beneficial Uses of Waters within Idaho and Lake Lowell Designations Idaho Surface Water Use Designations
Description Lake Lowell Designated Beneficial Uses
Impaired Designated Beneficial Use
Aquatic life support Bull trout Species-specific use. Cold water Water quality appropriate for the protection and maintenance
of a viable aquatic life community for cold water species.
Salmonid spawning Waters that provide or could provide a habitat for active self-propagating populations of salmonid fishes.
Seasonal cold water Water quality appropriate for the protection and maintenance of a viable aquatic life community of cool and cold water species, where cold water aquatic life may be absent during, or tolerant of, seasonally warm temperatures.
Warm water Water quality appropriate for the protection and maintenance of a viable aquatic life community for warm water species.
X X
Modified Water quality appropriate for an aquatic life community that is limited due to one or more conditions that preclude attainment of reference streams or conditions.
Contact recreation Primary (swimming) Applies to waters where people engage in activities that
involve immersion in, and likely ingestion of, water, such as swimming, waterskiing, and skin diving.
X X
Secondary (boating) Applies to waters where people engage in activities where ingestion of water may occasionally occur, such as fishing, boating, and wading; also where swimming is infrequent.
Water supply Domestic Water quality appropriate for drinking water supplies. Agricultural Water quality appropriate for the irrigation of crops or as
drinking water for livestock. This use applies to all surface waters of the State.
Industrial Water quality appropriate for industrial processes. This use applies to all surface waters of the State.
X
Wildlife habitats Protect water quality appropriate for wildlife habitat. This use applies to all surface waters of the State.
X X
Aesthetics Applies to all surface waters of the State. X X Source: IDEQ (2011c).
Sources of nutrient loading in Lake Lowell include high concentrations of phosphorus contributed through the canal and drain tributaries flowing into the lake from the surrounding agricultural lands. The New York Canal brings the largest phosphorus load into Lake Lowell; it averages almost 158 pounds per day (IDEQ 2010). By comparison, the second-largest phosphorus conveyance into the lake is Deer Flat Wasteway Number 3, which carries a load of approximately 48 pounds per day (IDEQ 2010). Monitoring conducted by the Idaho State Department of Agriculture indicated that irrigation drains were major contributors of phosphorus to the lake (10.8 tons) during the irrigation season (Campbell 2003). Based on analysis of total suspended solids at the sampling sites, 88 percent of the phosphorus entering Lake Lowell was in particulate form (Campbell 2003). It should be noted that monitoring sites in the Campbell study were all located along the southern shoreline of the lake. The monitoring report stated that the bulk of the total suspended solids entering from one sample site
Deer Flat National Wildlife Refuge Comprehensive Conservation Plan
Chapter 3. Physical Environment 3-33
was due to high discharge rates and not high concentrations; however, the high load quantities recorded at the other two sample sites were due to high concentrations of total suspended solids. Sediment loads from the drains that enter along the south side of Lake Lowell appear to settle out in the shallow bay areas along the shoreline, where the bulk of aquatic plant (macrophyte) growth occurs (Campbell 2003). These excessive loads of sediment and nutrients may lead to human-induced eutrophication consisting of increases in phytoplankton biomass, macrophyte biomass, nuisance algae blooms, loss of water clarity, and loss of oxygen in bottom waters (Campbell 2003). The amount of nutrient-rich sediment recycled or flushed from the system likely depends upon the speed of drawdown during the irrigation season (Campbell 2003).
Lake Lowell has a history of green and blue-green algal blooms associated with increased levels of phosphorus (Reclamation 1977, Reclamation 1980, IDFG 1965, and USFWS 2000 as cited in IDEQ 2010). In addition to algae being a nuisance for recreation, blue-green algae (cyanobacteria) can pose a health hazard; under certain conditions, blue-green algae can release toxins that are harmful to humans, pets, and livestock (IDEQ 2010). For example, in July 2009, an incident of blue-green algae on Lake Lowell prompted Southwest District Health to issue advisories for Lake Lowell and outlet canals, warning recreationists to avoid swimming in areas with algae blooms and to restrict pet access to the water (IDEQ 2010). Blooms typically form in late summer and dissipate in mid- to late fall when water temperatures cool (IDEQ 2010).
Additional water quality concerns for Lake Lowell include mercury and pesticides. As mentioned above, the lake is designated to support beneficial uses of warm water aquatic life and special resource water. The special resource water designation is applied here because of the importance of migratory waterfowl and other habitat within Deer Flat NWR. Mercury and contaminants that are present and/or bioaccumulate in fish can have a detrimental effect on wildlife, particularly on fish-eating birds. In October 2006, IDEQ collected fish from Lake Lowell for fish tissue methylmercury analysis. The goal was to determine the mean methylmercury fish tissue concentration across fish trophic levels in the reservoir. The data were used to determine whether methylmercury concentrations exceed water quality standards in Lake Lowell. The trophic-level weighted average concentration of mercury for fish sampled in 2006 is 0.241 mg/kg, which is 0.059 mg/kg less than the water quality standard (WQS) of 0.3 mg/kg. Sucker and carp are used in Lake Lowell trophic level weighted averages as a conservative measure, because the average fish tissue mercury concentration is relatively high in comparison to bass and bluegill tissue concentrations. In 2007, IDEQ developed a monitoring plan to identify and quantify methylmercury concentrations in fish in Idaho surface waters, including Lake Lowell, and fish samples were collected for analysis. The calculated trophic level weighted average of mercury from fish collected in 2007 is 0.277 mg/kg, which is 0.023 mg/kg below the WQS. Two separate data collection events document that the WQS for mercury is not exceeded and so a TMDL is not required (IDEQ 2010). Although the mercury level in fish tissue samples did not exceed water quality standards when last tested in 2007, it has been increasing over time (IDEQ 2010). Additional discussion of mercury and pesticide presence is provided below in Section 3.11.
3.9.2 Snake River
Several segments of the Snake River within the Snake River Islands Unit are listed on the Idaho and Oregon 303(d) lists of impaired waters. Those segments, as well as their designated beneficial uses and listed pollutants, are listed in Table 3-15. TMDLs have been approved for the Snake River–Hells Canyon Subbasin, which includes the river portion containing the Refuge islands. TMDL implementation and management here is a joint effort between Idaho and Oregon.
Deer Flat National Wildlife Refuge Comprehensive Conservation Plan
3-34 Chapter 3. Physical Environment
Table 3-15. Snake River Islands Unit–Specific 303(d) Listings for the Snake River (RM 335-449) Segment (from upstream to downstream)
State 303(d) Listed Pollutants
State-designated Beneficial Uses
Idaho segments RM 409 to 396.4 (Oregon-Idaho border near Homedale to Boise River inflow)
Bacteria Dissolved oxygen Nutrients pH Sediment
Cold water aquatic life Primary contact recreation Domestic water supply
RM 396.4 to 351.6 (Boise River inflow to Weiser River inflow)
Bacteria Nutrients pH Sediment
Cold water aquatic life Primary contact recreation Domestic water supply
RM 351.6 to 347 (Weiser River inflow to Scott Creek inflow)
Bacteria Nutrients pH Sediment
Cold water aquatic life Primary contact recreation Domestic water supply
RM 347 to 285 (Scott Creek inflow to Brownlee Dam)
Dissolved oxygen Mercury Nutrients pH Sediment
Cold water aquatic life Primary contact recreation Domestic water supply Special resource water
Oregon segments RM 409 to 395 Mercury
Temperature Public/private domestic water supply Industrial water supply Irrigation water Livestock watering Salmonid rearing and spawning (trout) Resident fish (warm water) and aquatic
life Water contact recreation Wildlife and hunting Fishing Boating Aesthetics
RM 395 to 335 (Malheur Basin)
Mercury Temperature
Public/private domestic water supply Industrial water supply Irrigation water Livestock watering Salmonid rearing and spawning (trout) Resident fish (warm water) and aquatic
life Water contact recreation Wildlife and hunting Fishing Boating Aesthetics
Source: IDEQ (2010).
Deer Flat National Wildlife Refuge Comprehensive Conservation Plan
Chapter 3. Physical Environment 3-35
3.10 Surrounding Land Uses
3.10.1 Lake Lowell Unit
The Lake Lowell Unit of Deer Flat NWR sits just outside the southwestern boundary of the Nampa comprehensive planning boundary (City of Nampa 2004) and just south of the Caldwell comprehensive planning boundary (City of Caldwell 2010). The remainder of the unit is surrounded by the Canyon County comprehensive planning area (Canyon County 2011a, 2011b). The Refuge is surrounded by developed and agricultural lands. As such, the Refuge is isolated from large, contiguous blocks of significant wildlife habitat areas.
The Nampa comprehensive plan recognizes there are conflicts associated with the agricultural/urban interface in the region such as the noise and dust created during the day and evening in the harvest season, and the difficulty of having to move tractors through subdivisions to change fields (City of Nampa 2004). The plan also acknowledges that the Lake Lowell Unit of the Refuge does not have adequate lands to support the existing diverse wildlife population and that the existing agricultural areas surrounding the Refuge provide food and cover for wildlife as well as protection for wetlands and watersheds (City of Nampa 2004). Therefore, the future land use map for the City of Nampa designates areas along Lake Lowell within the comprehensive plan impact area as agricultural with an open space overlay (City of Nampa 2004).
The City of Nampa Comprehensive Plan (2004) maps existing land uses north of the east pool as mostly agricultural land with a mix of rural residential (less than 1.45 dwelling units per acre) and low-density residential (1.46-4.00 dwelling units per acre). The plan’s future land use map indicates a conversion of the agricultural lands bordering the Refuge to rural and low-density residential (City of Nampa 2004). A narrow band of rural residential lands will surround a larger core area of low-density residential lands. Table 3-16 illustrates the differences between existing and future land use inventory acreages. The plan states that the future land use inventory acreages represent a long-range vision of community development; however, a time frame for this future land use is not provided. These changes in land use patterns are driven by population growth forecasts and future housing need projections (City of Nampa 2004).
Table 3-16. City of Nampa Land Use Inventories
Land Use Existing (2004)
Acres per Land Use Existing (2004) Percentage
of Land Use Type Future Predicted Acres
per Land Use Agriculture 39,781 67.2% 13,902 Rural residential 4,199 7.1% 10,940 Low-density residential 7,339 12.4% 19,955 Medium-density residential 677 1.1% 2,407 High-density residential 539 0.9% 937 Office - - 63 Commercial 1,896 3.2% 2,880 Industrial 3,290 5.6% 6,219 Public 696 1.2% 813 Parks 803 1.3% 1,104 Total 59,220 100% 59,220 Source: City of Nampa (2004).
The City of Caldwell adopted its current comprehensive plan in 2010. Although the Caldwell plan does not itemize a land use inventory like the Nampa plan, it does project similar population growth
Deer Flat National Wildlife Refuge Comprehensive Conservation Plan
3-36 Chapter 3. Physical Environment
rates and housing needs. The City of Caldwell Official Comprehensive Plan Map (City of Caldwell 2010) identifies the area surrounding the north end of the west pool (Lower Lake Lowell) as residential estate land use. It also illustrates a narrow band of land immediately adjacent to the shoreline as environmentally sensitive and as public open space (City of Caldwell 2010). Residential estate land use is characterized by similar qualities as rural residential and low-density residential with a semirural character (City of Caldwell 2010). The public open space areas are suitable for active and passive recreation; environmentally sensitive areas include lands preserved for open space or that are undevelopable, such as wetlands and floodways (City of Caldwell 2010).
The vast majority of the land surrounding the Lake Lowell Unit is in unincorporated Canyon County and is zoned for agriculture (Canyon County 2011b). In addition to acknowledging Lake Lowell as an important natural resource in the county, the Canyon County 2020 Comprehensive Plan (2011a) recognizes the importance of Deer Flat NWR as a special area in the county and encourages land use patterns around the Refuge that promote the integrity and purpose of the Refuge. The plan also acknowledges that the County needs to preserve its natural resources while allowing for the expansion of cities and growth of the unincorporated areas (Canyon County 2011a). The Canyon County future land use map (Canyon County 2011a) categorizes the County lands south of Lake Lowell as residential, which indicates that the land use of Lake Lowell is converting from agriculture to some form of residential use.
3.10.2 Snake River Islands Unit
The lands surrounding the Snake River Islands Unit are predominantly private and used for agriculture (Ecovista and IDFG 2004). In Canyon County, with the exception of a few small sections with rural residential zoning designations, the lands adjacent to the Refuge islands are zoned for agricultural uses (Canyon County 2011b). Similar uses exist on the lands across the river in Owyhee County (Owyhee County 2002). Surrounding land uses along the Snake River Islands Unit in Payette County and Washington County are similar (Payette County 2006; Washington County 2010).
3.11 Environmental Contaminants
3.11.1 Lake Lowell Unit
There is an abandoned Canyon County landfill site within the Refuge boundary. The former landfill is located northwest of the westernmost portion of the Deer Flat Upper Dam, near the Visitor Center. It is positioned approximately 40 feet above lake elevation. The 40-acre site served as a landfill for Canyon County from the late 1950s through approximately 1973 (GeoEngineers 2006). The site was seeded in 1976 and is now covered in soil and grass (GeoEngineers 2006). The majority of the waste is covered by 0 to 2 feet of nonengineered cap/fill, and the depth of waste is greater than 15 feet in certain areas; the waste primarily consists of ordinary household items (GeoEngineers 2006). Although minimal elevated levels of some chemicals of concern were detected in soil, groundwater, and surface water samples, none appeared to be at concentrations that could pose an unacceptable risk or hazard to human or ecological site receptors (GeoEngineers 2006).
Thomas and Burch (2005) conducted contaminant sampling at the Refuge by examining sediment, invertebrate tissue, whole-body bullfrogs, whole-body fish tissue, bird eggs, and bird feather samples. Detailed observations of nesting birds conducted in 2001 as part of this study indicated that all prey were being collected from Lake Lowell. Samples were analyzed for organochlorines and
Deer Flat National Wildlife Refuge Comprehensive Conservation Plan
Chapter 3. Physical Environment 3-37
inorganics, including trace scans for 26 compounds. They concluded that concentrations of inorganic contaminants were generally low in sediment from the Refuge and, for the most part, were below levels associated with adverse effects. One exception was the mercury concentrations in bald eagle feathers. The concentrations were within the range associated with impaired reproduction, suggesting that concentrations in the food chain may adversely impact bald eagles (Thomas and Burch 2005). The other exception was that although selenium concentrations in fish species were below the threshold for general toxic effects for whole-body fish samples (4 micrograms per gram), concentrations exceeded levels associated with mortality in species of fish known to be more sensitive to selenium exposure such as salmonids. This suggests that some fish species and sensitive life stages present in Lake Lowell may be adversely affected by current selenium concentrations (Thomas and Burch 2005). In the same study, Thomas and Burch concluded that organochlorine pesticide concentrations in sediment, fish, and invertebrates did not appear to be at levels harmful to aquatic resources with the exception of DDE levels in certain individual egg samples from grebe and heron species. On the whole, mean concentrations of DDE in grebe and heron eggs were below levels associated with adverse effects (Thomas and Burch 2005).
More recent recommendations in the Lake Lowell TMDL (IDEQ 2010) include additional sampling of reproductive success and mercury concentrations in bald eagles and continued monitoring of piscivorous water birds in order to reduce uncertainty regarding whether mercury is bioaccumulating in eagles and piscivorous water birds and resulting in population level impacts due to effects on reproduction, and to monitor trends in chemical concentrations.
3.11.2 Snake River Islands Unit
Contaminants in the Middle Snake River are the result of surrounding land uses in the subbasin, and nutrient loading to the Middle Snake River also comes from the upstream segment of the Snake River. The highest concentrations of nitrates in the river are driven by the agricultural and urban land uses (Ecovista and IDFG 2004; IDEQ and ODEQ 2004). Historical use and discharge of mercury to surface waters in mining operations has resulted in increased mercury concentrations in the rivers of the subbasin, including the Snake River (Ecovista and IDFG 2004; IDEQ and ODEQ 2004). Current mining operations are predominantly focused on sand and gravel extraction and are concentrated around the town of Ontario, Oregon (Ecovista and IDFG 2004). The highly regulated flow regimes resulting from dams and irrigation diversions influence pollutant transport and processing within the Middle Snake River Subbasin. Pollutants such as sediment, mercury, and nutrients tend to accumulate behind these structures. Concentrations of nutrient and organic loads in impoundments may result in nuisance algae growth and dissolved oxygen depletion (Ecovista and IDFG 2004).
Deer Flat National Wildlife Refuge Comprehensive Conservation Plan