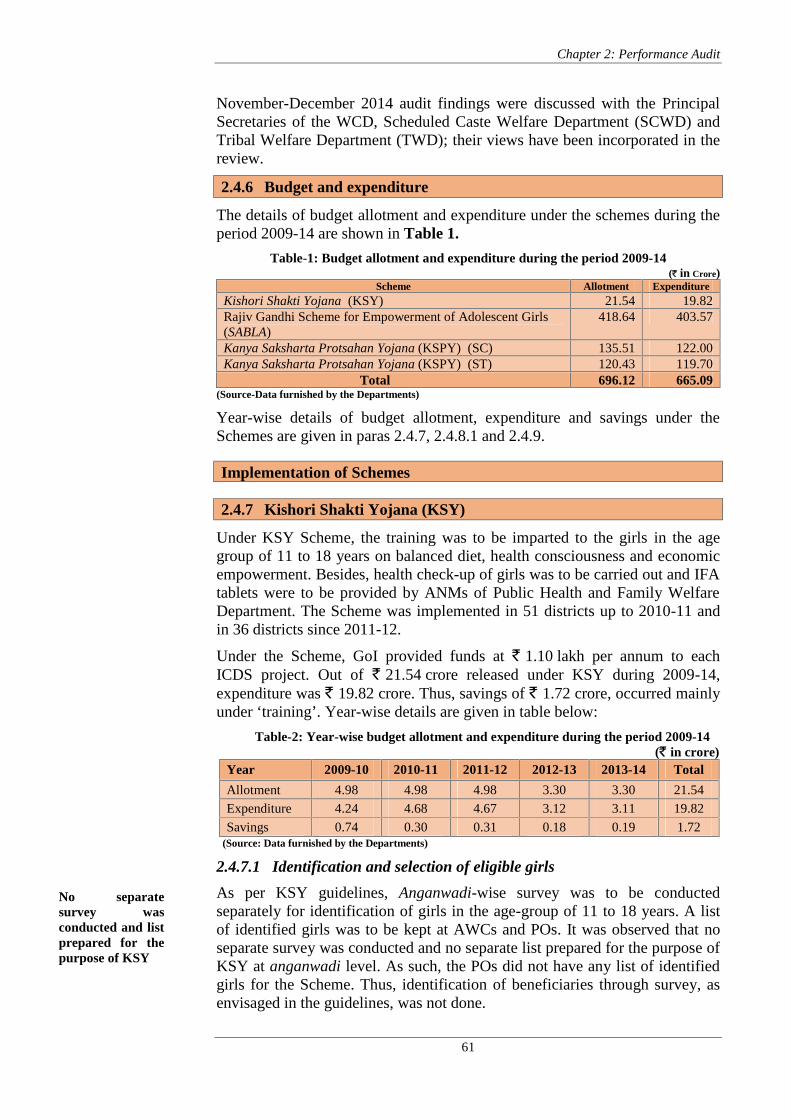
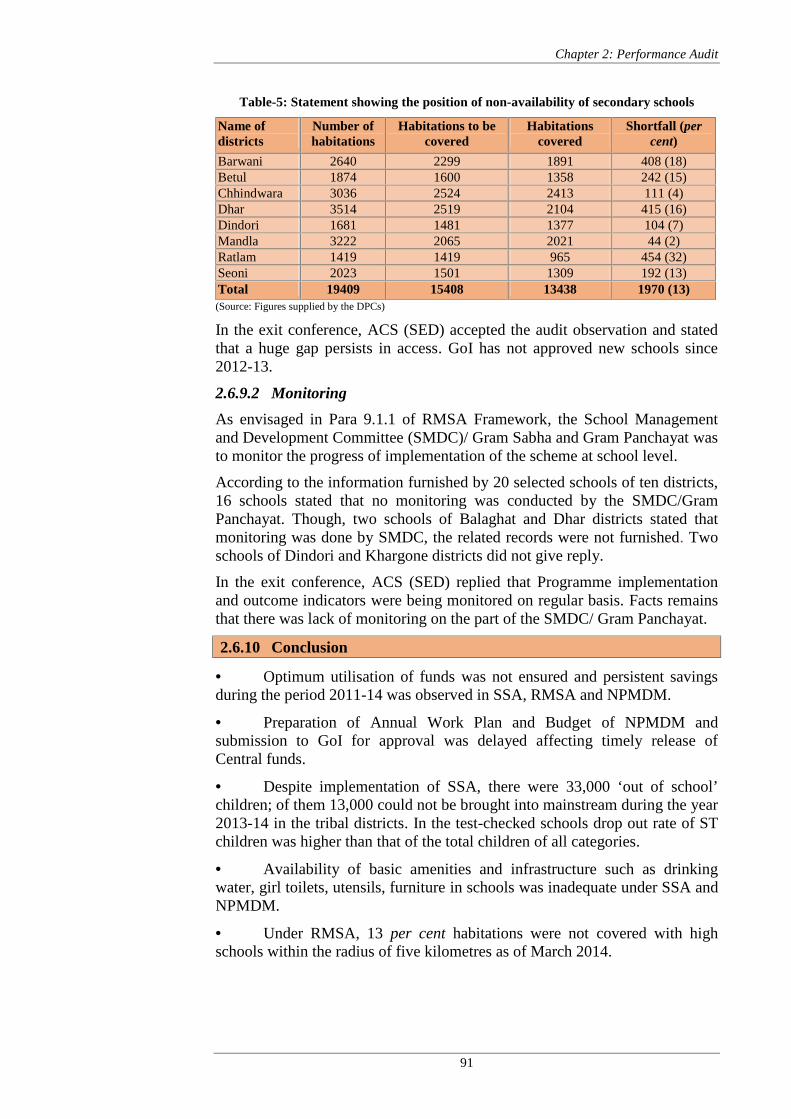
Chapter 2: Performance Audit 7 Chapter 2: Performance Audit Urban Development and Environment Department 2.1 Working of Madhya Pradesh Pollution Control Board Executive Summary For prevention and control of water and air pollution, the Parliament enacted the Water Act, 1974 and the Air Act, 1981. To regulate management of wastes viz. bio-medical waste, hazardous waste and municipal solid waste, relevant Rules were framed under the Environment (Protection) Act, 1986. Madhya Pradesh Pollution Control Board (MPPCB) was constituted in 1974, which is responsible for implementation of the Environmental Acts and Rules in the State. We observed deficiencies in working of the MPPCB during 2009-14. MPPCB prepared a five-year plan for 2012-17 without obtaining inputs from lower level functionaries. Besides, no survey was conducted to identify the polluting industries, health care establishments, rivers, etc. (Paragraph 2.1.7) Significant delays occurred in granting consent/ authorisation to industries and health care establishments. 2190 industries, 280 local bodies and 28 building projects were functioning either without obtaining consent or without renewal of consent under Water Act/Air Act. Out of 625 industries 76 industries were functioning without authorisation under Hazardous Waste Rules. This may impact the environment adversely. (Paragraphs 2.1.8.1 to 2.1.8.3, 2.1.8.5, 2.1.11.1 and 2.1.11.6) Compared to the norms prescribed by MPPCB for collection and testing of waste water samples from industries, there were shortfalls in fixation of targets ranging from 23 to 55 per cent. In 32 districts, there was no plant for treatment of domestic effluents/sewage. River water quality deteriorated at 19 monitoring locations and improved at eight monitoring locations. (Paragraphs 2.1.9.2 to 2.1.9.4) Fourteen ambient air quality monitoring stations were not functional. Testing of samples in the functional stations was inadequate; shortfalls ranged between 34 and 95 per cent. (Paragraph 2.1.10.1) Cement plants were emitting excess pollutants and were thus causing air pollution. (Paragraph 2.1.10.5) Processing and disposal of municipal solid waste was done by less than two per cent of the local bodies. (Paragraph 2.1.11.7) No norm was prescribed for inspection of industries and HCEs by the MPPCB, affecting the monitoring of pollution control. The Apex Committee on BMW constituted in January 2011 never met except once in 2011. (Paragraphs 2.1.12 and 2.1.11.3)
Transcript
Chapter 2: Performance Audit
7
Chapter 2: Performance Audit
Urban Development and Environment Department
2.1 Working of Madhya Pradesh Pollution Control Board
Executive Summary
For prevention and control of water and air pollution, the Parliament enactedthe Water Act, 1974 and the Air Act, 1981. To regulate management ofwastes viz. bio-medical waste, hazardous waste and municipal solid waste,relevant Rules were framed under the Environment (Protection) Act, 1986.Madhya Pradesh Pollution Control Board (MPPCB) was constituted in 1974,which is responsible for implementation of the Environmental Acts andRules in the State. We observed deficiencies in working of the MPPCBduring 2009-14. MPPCB prepared a five-year plan for 2012-17 without obtaininginputs from lower level functionaries. Besides, no survey was conducted toidentify the polluting industries, health care establishments, rivers, etc.
(Paragraph 2.1.7) Significant delays occurred in granting consent/ authorisation toindustries and health care establishments. 2190 industries, 280 local bodiesand 28 building projects were functioning either without obtaining consent orwithout renewal of consent under Water Act/Air Act. Out of 625 industries76 industries were functioning without authorisation under Hazardous WasteRules. This may impact the environment adversely.
(Paragraphs 2.1.8.1 to 2.1.8.3, 2.1.8.5, 2.1.11.1 and 2.1.11.6) Compared to the norms prescribed by MPPCB for collection andtesting of waste water samples from industries, there were shortfalls infixation of targets ranging from 23 to 55 per cent. In 32 districts, there wasno plant for treatment of domestic effluents/sewage. River water qualitydeteriorated at 19 monitoring locations and improved at eight monitoringlocations.
(Paragraphs 2.1.9.2 to 2.1.9.4) Fourteen ambient air quality monitoring stations were not functional.Testing of samples in the functional stations was inadequate; shortfallsranged between 34 and 95 per cent.
(Paragraph 2.1.10.1) Cement plants were emitting excess pollutants and were thus causingair pollution.
(Paragraph 2.1.10.5) Processing and disposal of municipal solid waste was done by lessthan two per cent of the local bodies.
(Paragraph 2.1.11.7) No norm was prescribed for inspection of industries and HCEs by theMPPCB, affecting the monitoring of pollution control. The Apex Committeeon BMW constituted in January 2011 never met except once in 2011.
(Paragraphs 2.1.12 and 2.1.11.3)
Audit Report on General and Social (Non-PSUs) Sectors for the year ended 31 March 2014
8
2.1.1 Introduction
In order to address pollution issues, the Parliament enacted the Water(Prevention and Control of Pollution) Act, 1974 (Water Act) and the Air(Prevention and Control of Pollution) Act, 1981 (Air Act) for prevention andcontrol of water and air pollution. To regulate management of wastes viz. bio-medical waste, hazardous waste and municipal solid waste, relevant rules wereframed (1989-2000) under the Environment (Protection) Act, 1986.
The Madhya Pradesh Pollution Control Board (MPPCB) was constituted inSeptember 1974 by Government of Madhya Pradesh (GoMP) under UrbanDevelopment and Environment Department1 (the Department) according tothe provisions of the Water Act. The MPPCB has been entrusted with theresponsibilities of prevention, control or abatement of water, air andenvironment pollution, as envisaged in the relevant Acts and Rules. It submitsan Annual Report on its activities to GoMP for laying before the StateLegislature. In a study2 conducted (2009) by Central Pollution Control Board(CPCB), five industrial clusters3 of Madhya Pradesh were found as pollutedclusters. Thus, pollution in industrial units is an area of concern in the State.
2.1.2 Organisational set-up
The Principal Secretary, Urban Development & Environment Department(Department) is the administrative head at State level. The MPPCB, headed bya Chairman, a Member Secretary (MS) and 15 other Members4, implements itsprogrammes through 13 Regional offices5, one central laboratory and 10regional laboratories. The laboratories are responsible for analysis of waterand air samples collected from industrial units and other sites.
2.1.3 Audit objectives
The performance audit (PA) was conducted to examine the working of theMPPCB. The audit objectives were to ascertain whether:
the planning was effective to prevent, control or abate pollution;
the grant of consent to industries was efficient and effective;
the provisions of Water and Air Acts were complied with effectively;
compliance with the Bio-Medical Waste Rules was effective;
monitoring mechanism in the MPPCB was in place and effective.
2.1.4 Audit criteria
The audit criteria adopted to arrive at audit conclusions were the rules andprocedures prescribed to abate pollution and the norms and standards in:
the Water Act, 1974, the Air Act, 1981 and the Rules made thereunder;
1 Earlier named as Housing and Environment Department (prior to July 2014)2 Comprehensive Environment Assessment made in 88 industrial clusters in India3 Dewas, Indore, Nagda-Ratlam, Pithampur and Singrauli.4 Five members from Government departments, five from local bodies, two from
government companies/corporations and three non-official members5 Bhopal, Dhar, Guna, Gwalior, Indore, Jabalpur, Katni (formed in September 2013),
Rewa, Sagar, Satna, Shahdol, Singrauli (formed in July 2011) and Ujjain
Chapter 2: Performance Audit
9
the Water (Consent) Madhya Pradesh Rules, 1975, the Environment(Protection) Act, 1986;
the Bio-Medical Waste Rules, 1998, the Hazardous Waste Rules, 2008,the Municipal Solid Waste Rules, 2000; and
the instructions issued by the MPPCB and CPCB from time to time.
Specific audit criteria have been mentioned in the relevant paragraphs.
2.1.5 Scope and coverage of audit
The review was conducted (February to July 2014) through test check ofrecords of MPPCB, eight6 out of 13 Regional offices (ROs), the centrallaboratory and eight regional laboratories covering the period 2009-14. TheROs were selected through ‘Simple Random Sampling without Replacement’.Information in respect of building projects was obtained from Town andCountry Planning Department and Municipal Corporations. An entryconference was held on 24 April 2014 with the Member Secretary, in whichobjectives, criteria and methodology of audit were discussed. The PrincipalSecretary did not response to our requests (September-October 2014) toconduct exit conference. Audit findings were discussed in the exit conferenceheld (5 November 2014) with the Chairman, MPPCB; their replies/views havebeen suitably incorporated in the review.
Audit findings
2.1.6 Financial position
Financial resources of the MPPCB comprised of grants-in-aid/assistance fromGoI/CPCB, grants from GoMP, water cess7 from industries and local bodies,consent and authorisation fees and renewal fees under various environmentActs and Rules. The financial position of the MPPCB is as given in Table-1.
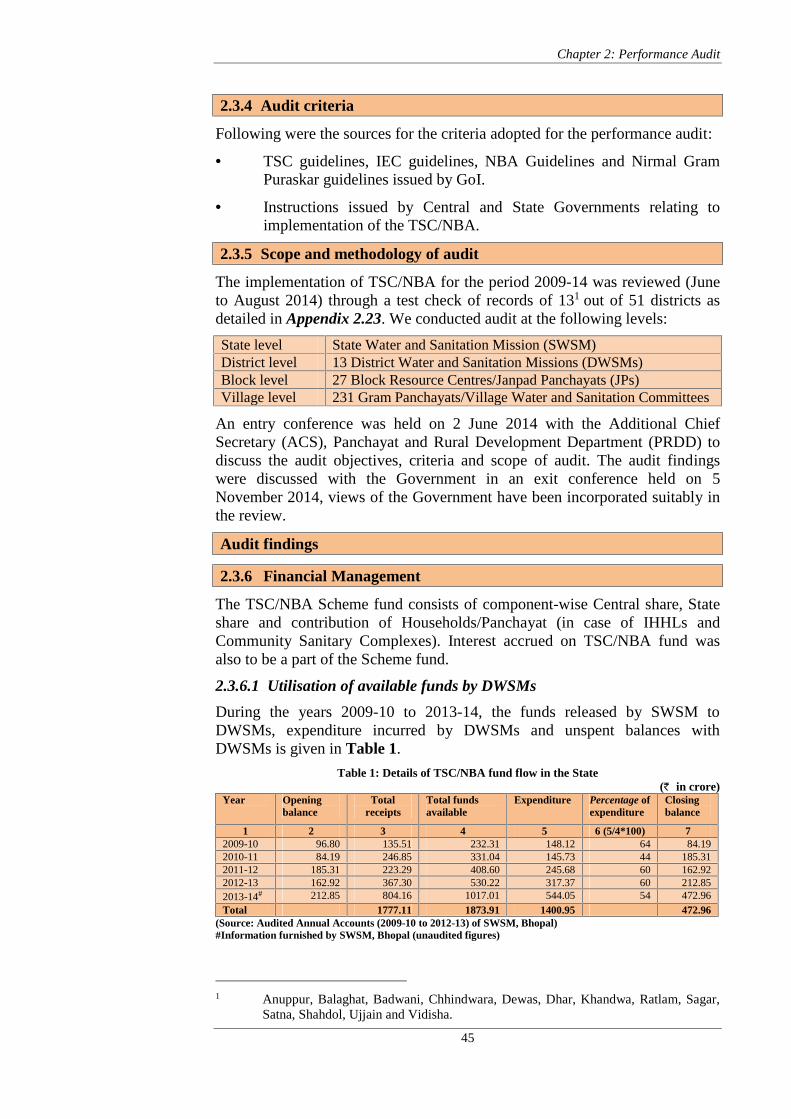
Table-1 : Financial resources of MPPCB and utilisation thereof(` in crore)
(Source: Data furnished by the MPPCB)
The MPPCB finalised the annual Accounts and submitted to GoMP onlyup to the year 2010-11.
In March 2013, GoI reimbursed ` 5.77 crore as share of water cess.MPPCB was to submit utilisation for the entire amount to GoI. The MPPCB,
6 Bhopal, Dhar, Gwalior, Indore, Jabalpur, Sagar, Satna and Ujjain.7 State Board levies and collects water cess and credits to the Consolidated Fund of India. Up to
80 per cent of the cess is remitted back to the State Board.8 Includes consent fee/consent renewal fee, authorisation fee/renewal of authorisation fee, interest
on investment etc.
Year Openingbalance
Amount of grant Reimburse-ment ofwater cessfrom GoI
Incorrect UC of` 4.80 croresubmitted to GoIby MPPCB
Audit Report on General and Social (Non-PSUs) Sectors for the year ended 31 March 2014
10
however, furnished (November 2013) UC for ` 4.80 crore to GoI against theactual expenditure of ` 0.32 lakh during 2012-13.
We also observed that RO, Jabalpur issued the reports of analysis ofwater and air samples without receipt of fees. As a result, ` 23.47 lakh for theperiod 1992 to 2013-14 on account of water and air analysis fee remainedoutstanding from industries and departments/institutions9. As of October 2014,` 4.32 lakh has been recovered.
In the exit conference, the Chairman admitted the audit observations.Regarding incorrect UC, he stated that necessary entries would be made afterreconciliation and this would be avoided in future. The Chairman also statedthat action would be taken to recover outstanding testing fees and a reportwould be submitted.
2.1.7 Survey and Planning
Under Section 17 of Water Act and Section 17 of Air Act, the MPPCB wasrequired to prepare a comprehensive programme for prevention, control orabatement of water and air pollution and to ensure execution thereof.
In order to plan for control of pollution and effective implementation of theActs, the MPPCB was to identify and prepare an inventory of all industries,health care establishments (HCEs), rivers, lakes, ponds, etc. in the State.
During test check of records of selected ROs (March-July 2014) we observedthat no survey was conducted at RO level to identify the polluting industries,rivers, lakes, HCEs, etc. However, the MPPCB prepared a five-year plan forthe period 2012-17, first time in April 2012, which consisted of financial andphysical targets for control of pollution and strengthening of organisation. Itsubmitted the Plan proposal (April 2012) to State Government.
Thus, the long term plan was prepared by the MPPCB on its own withoutobtaining any input from the lower level functionaries. We also observed thatonly 14 meetings of MPPCB were held during the period 2009-14 as against20 meetings due to be held, which included planning for abating pollution.
In absence of complete information relating to pollution, the plan for controlor abatement of pollution was not comprehensive.
The ROs confirmed the facts and stated that annual monitoring package forsampling of water and air was being prepared and submitted to the MPPCB.
In the exit conference, the Chairman stated that dedicated surveys were notconducted but the MPPCB has information of industries, HCEs from othersources. Though no inputs were taken from the ROs for preparation of fiveyear plan, position was being ascertained in the regular meetings of ROs.
The fact remains that mere information of industries, HCEs etc. does not givethe level of pollution in industries. Therefore, conduct of survey was neededfor ascertaining the status of polluting and non-polluting industries.
The MPPCB may ensure that the inputs from lower level functionaries areobtained and incorporated in the long term plans to make it comprehensive.
9 Few instances: Raymond Ltd., Boregaon (Chhindwara); Everest Industries, Kymore (Katni);ACC Ltd. Kymore (Katni); Nagar Nigam, Jabalpur and PHED Jabalpur, etc.
No survey wasconducted toidentify pollutingindustries, rivers,lakes, health careestablishments, etc.
MPPCB preparedFive Year Plan2012-17 withoutobtaining inputsfrom lower levelfunctionaries
Chapter 2: Performance Audit
11
2.1.8 Grant of consent
Under Section 25 of the Water Act and Section 21 of the Air Act, consent ofthe State Board was required to establish or take any step to establish anyindustry, operation or process which was likely to discharge sewage or tradeeffluent into a stream, well, sewer or on land and to pollute the air byprocess/emission in the State. Accordingly, the MPPCB issue consents forestablishment and operation of industries and renewal of consents.
As per notification issued in 1999, Ministry of Environment and Forests(MoEF) classified 64 types of industries as Red10, 25 as Orange11 and 55 asGreen12 based on their activities carried out and manufacturing products (feware mentioned in Appendix-2.1). As per information furnished by MPPCB,there were 14,396 industries (Red category: 6809, Orange category: 4698 andGreen category: 2889) in the State as of February 2014. Consent tolarge/medium scale industries is granted by the MPPCB Headquarter and forSmall Scale Industries (SSIs) by the respective RO.
2.1.8.1 Delay in grant of consent to industries
Section 25 of the Water Act and Section 21 of the Air Act provide that priorconsent of State Board was essential to establish any industry, its operation orprocess. In case the consent is not granted within four months from the date ofapplication, it would be treated as a deemed consent.
Test check of records revealed that in 38 cases13, consent orders were issuedby MPPCB head office and ROs with delays ranging from 3 to 224 days afterthe stipulated period of 120 days. Of these, 11 consents were related to largeand medium industries, which were issued with delays up to 136 days.
Thus, the industries were free to function on deemed consent after thestipulated time without actual grant of consent by the MPPCB which mayhave adverse impact on environment.
In the exit conference, the Chairman confirmed the facts and figures and statedthat efforts would be made to avoid delay in granting consent.
2.1.8.2 Industries functioning without renewal of consent
Every industry was required to obtain periodical renewal of consent from theMPPCB by paying prescribed consent renewal fee to continue its operationand process.
Test check of records of the MPPCB and ROs revealed that as of March 2014,177 large/medium water/air polluting industries14 and 2013 SSIs15 werefunctioning without renewal of consent of the MPPCB. An amount of ` 1.62
Audit Report on General and Social (Non-PSUs) Sectors for the year ended 31 March 2014
12
crore16 was chargeable from these SSIs on account of consent renewal fee.Functioning of the industries without renewal of consent may impact theenvironment adversely.
In the exit conference, the Chairman stated that this could not be done due toshortage of staff and efforts would be made to recover the amount and bringindustries under the consent regime. However, no comment was made onimpact on environment due to non-renewal of consent.
2.1.8.3 Annual consent renewal fees pending from local bodies
The Water (Consent) Madhya Pradesh Rules, 1975 prescribed consent fee andannual consent renewal fee chargeable from local bodies extracting water fromnatural sources and discharging effluents into streams.
We observed that out of 293 local bodies in the test checked ROs, 171 localbodies had never obtained consent from the MPPCB. Further, 109 local bodieswhich initially took consent were subsequently functioning17 without renewalof consent as of March 2014. A total amount of ` 13.75 lakh was receivablefrom these local bodies on account of consent renewal fee as of March 2014(Appendix 2.2).
In the exit conference, the Chairman confirmed the facts and stated thatcontinuous efforts were being made to recover pending fees from local bodies.
2.1.8.4 Maintenance of register of consented conditions
We observed that the register of consented conditions was not maintained bythe ROs of Ujjain, Sagar, Satna, Gwalior, Dhar and Indore during the period2009-14, though required under Section 25 (6) of the Water Act. The RO,Bhopal maintained such register only from May 2011, while RO, Jabalpur didnot maintain such register after May 2011. Thus, the consented conditionswere not open for inspection by the persons interested or affected by theoutlet, land or premises covered under the consent.
The Chairman stated that the ROs would be directed to maintain the register.
The MPPCB should ensure maintenance of register of consented conditions asprescribed in the Act.
2.1.8.5 Building projects functioning without consent of the MPPCB
As per notifications issued by MoEF, GoI (September 2006) and Departmentof Urban Administration and Development, GoMP (May 2010), the buildingand construction projects of prescribed categories18 were required to takeconsent/approval from the MPPCB.
17 44 local bodies for last five years, 18 local bodies for last 10 years and 47 localbodies for more than 10 years.
18 Building and construction projects with 20,000 sqm and more but less than 1,50,000sqm built-up area, Housing complexes with 100 tenements or more,Commercial establishments having built-up area of 2000 sqm or more.
Register ofconsentedconditions was notmaintained by theROs
280 local bodieswere functioningwithout validconsent in testchecked ROs
Chapter 2: Performance Audit
13
Scrutiny of records of selected ROs19 and information provided by MunicipalCorporations (MCs) revealed that out of 30 projects sanctioned by the MCsduring the period 2009-14, only two obtained consent of MPPCB. Theposition of building projects sanctioned by MCs is in Appendix 2.3 and statusof consent taken by building projects under Water/Air Acts from the MPPCBis given in Table-2.
Table-2: Position of Building projects under test checked ROsName ofMC
Number and description of projects to whom permissionwas granted by MCs
Number ofprojects whichwere grantedconsent by theMPPCB
Number ofprojects whichdid not haveconsent of theMPPCB
It would be seen that out of 30 construction projects permitted by MCs underthree categories, 28 projects were functioning/under construction without‘consent to establish’ (CTE) of the MPPCB. In addition, CTE was granted bythe MPPCB to 14 projects (Bhopal 03, Indore 11) before 2009-10. But, evenafter lapse of more than five years, ‘consent to operate’ was not obtained bythese projects. The MPPCB also did not inspect these projects to check theirstatus. We also observed that there was lack of co-ordination between theMPPCB and the MCs regarding permission granted for building projects, asneither the MC furnished the information to the MPPCB nor did the MPPCBtake any effective initiative to obtain the same.
On this being pointed out, the MS stated (August 2014) that under “GreyWater Recycling Model Bye-laws” (notified by GoMP in May 2010)permission was to be given by MC after approval of the MPPCB. Legal actionwould be taken on the concerned projects after due analysis/inspection.
The reply indicates lack of co-ordination between two Government agencies.
In the exit conference, the Chairman stated that efforts would be made forbetter co-ordination between MCs, Town and Country Planning Departmentand MPPCB to bring the Building projects under the consent mechanism. Asregards the CTE granted projects, the field inspection would be carried outshortly and appropriate action would be taken.
2.1.9 Water Act
The Water Act, 1974 is designed for prevention and control of water pollutionand the maintaining or restoring of wholesomeness of water. The State Boardwas required to plan a comprehensive programme for prevention, control orabatement of pollution of streams and wells and to secure execution thereof,issue consents to industries subject to such conditions as it deems fit forcontrol of water pollution and to watch compliance with the conditions.
19 The building projects requiring consent/approval were taken up only in three ROs outof selected eight ROs.
20 Projects having more than 20,000 but less than 1,50,000 square meter built-up area.21 Housing complexes with 100 tenements or more.22 Commercial establishments having built-up area of 2000 square meter or more.
Audit Report on General and Social (Non-PSUs) Sectors for the year ended 31 March 2014
14
2.1.9.1 National Water Quality Monitoring Programme
The CPCB, in collaboration with the State Boards, monitors the water qualityof aquatic resources in the country under National Water Quality MonitoringProgramme (NWMP). We observed that the MPPCB was monitoring waterquality at five stations of Global Environment Monitoring System (GEMS)and at 100 stations of Monitoring Indian Aquatic Resource System (MINARS)under NWMP by measuring the parameters pH, biological oxygen demand(BOD), chemical oxygen demand (COD), dissolved oxygen (DO), TotalSuspended Solids etc. in the water samples taken from rivers, lakes, ponds andwells. In addition, CPCB sanctioned (December 2011) 50 new stations underMINARS for strengthening of monitoring network. The frequency of thesampling for each identified station was fixed by the CPCB.
Year-wise targets and achievement of sampling under the programme isshown in Table-3.
Table-3: Position of targets and achievement of sampling of water under NWMPYear GEMS MINARS Total
Thus, the shortfall against the targets of sampling was 14 per cent during theperiod 2009-14.
On this being pointed out, the MS stated (August 2014) that the reasons forshortfalls were drying up of rivers in summer season and difficulties inapproaching sampling points in rainy season.
In the exit conference, the Chairman admitted the audit observations.
2.1.9.2 Monitoring of Natural Water Sources
The position of targets and achievement for collection and testing of samplesof natural water sources during the years 2009-10 to 2013-14, is given inTable-4.
Table-4: Position of targets and achievement of natural water sources
2009-10 2010-11 2011-12 2012-13 2013-14Targets 2015 2197 2474 2810 2939Achievement 2869 3516 3838 3515 4632(Source: Data furnished by the MPPCB)
Above table indicates that achievement was more than the targets during theyears 2009-10 to 2013-14.
On the basis of monitoring results of natural water resources, the MPPCBclassified the water quality as A, B, C, D and E based on several uses of water.We noticed that river water quality at 19 monitoring locations deteriorated andquality improved at eight locations in 2012-13 compared to the status of 2011-12, as shown in Appendix 2.4.
There was shortfallof 14 per cent insampling of waterunder NWMP
Water qualitydeteriorated at 19monitoringlocations andimproved at eightlocations in 2012-13, as compared to2011-12
Chapter 2: Performance Audit
15
In the exit conference, the Chairman stated that efforts were being made tofurther improve the water quality at the locations where it deteriorated.
2.1.9.3 Inadequate treatment of domestic effluents
As per provision 17 (1) (f) of the Water Act, 1974, the State Board wasrequired to inspect sewage or trade effluents, works and plants for treatmentand to review plans, specifications or other data relating to plants set up fortreatment of water, works for purification thereof.
During test check of records (March-July 2014) and analysis of informationprovided by selected ROs, we observed that 10 sewage treatment plants(STPs) were installed by six local bodies23. As per information furnished bythe test checked ROs, out of 1280.46 million litres daily (MLD) domesticeffluents generated in 38 districts, only 260.31 MLD domestic effluent wasbeing treated through 10 STPs in six districts and the remaining 1020.15 MLDwas disposed without treatment. Even in the six districts, where STPs wereinstalled, the treatment capacity of STPs was less than sewage generated. Thegap between sewage generation and treatment capacity ranged from 16per cent to 79.57 per cent (Appendix 2.5). The MPPCB neither took anyeffective action in this regard nor fixed any norm for inspection of STPs.
In the exit conference, the Chairman stated that notices would be issued tolocal bodies and norms would be fixed for inspection of STPs.
2.1.9.4 Monitoring of Industrial Waste Water
Every year MPPCB directed the ROs to propose a programme for monitoringof industrial waste water so as to monitor Red category industries everymonth, Orange category industries six times in a year and Green industries atleast twice in a year. Category-wise number of industries proposed formonitoring of industrial waste water is given in Table-5.
Table-5: Category wise number of industries proposed for monitoringCategory of industry 2009-10 2010-11 2011-12 2012-13 2013-14Red 365 401 410 428 430Orange 222 151 211 202 160Green 158 183 185 161 161Total 745 735 806 791 751
(Source: Data furnished by the MPPCB)
Based on proposals of the ROs, the MPPCB decided the targets for samplingof industrial waste water for each Regional office. The year-wise details oftargets fixed and the monitoring to be done as per MPPCB’s instructions isgiven in Table-6.
Table-6: Position of test due to be conducted, targets set and achievementYear No. of
industriesTotal number ofsampling which wasto be done asprescribed
Number ofsamplestargeted
Shortfall intargets vis-à-vis norms (percent)
Total achievement(as percentage ofprescribed numberof samples)
Audit Report on General and Social (Non-PSUs) Sectors for the year ended 31 March 2014
16
It would be seen that the targets were fixed lower than that prescribed byMPPCB, ranging from 23 per cent to 55 per cent during 2009-10 to 2013-14.
Further, scrutiny of monitoring reports for 2013-14 in six test checked ROs24
revealed that out of 359 industrial units test checked, in 53 units the treatedeffluent of the industries had high biological oxygen demand (BOD) andchemical oxygen demand (COD) content compared to the prescribed norms(BOD: 30 mg/l, COD:250 mg/l). The extent to which the BOD, CODexceeded the norms is given in Table-7.
Table-7: Position of parameter BOD, COD exceeded by the industries
* In four industries in RO, Satna, COD was not measured for want of instruments.
In the exit conference, the Chairman confirmed facts and figures and statedthat due to shortage of staff and equipment lower targets were fixed andefforts would be made to improve the situation.
The MPPCB may adhere to sample collection and testing norms prescribed.
2.1.10 Air Act
The Air Act, 1981 is designed for prevention, control or abatement of airpollution by preservation of quality of air. The State Board is required to planand execute programmes for prevention, control or abatement of air pollution,issue consents to industries subject to such conditions as it deems fit forcontrol of air pollution and to watch compliance of the consented conditions.
2.1.10.1 National Ambient Air Monitoring Programme
The MPPCB was conducting air monitoring at 25 stations of 10 cities, out of26 ambient stations sanctioned by CPCB (before 2009-10). Moreover, CPCBsanctioned (April 2011) 13 new ambient air quality monitoring stations25
under the programme in the State and directed the MPPCB to initiatemonitoring. A new parameter PM2.5 (fine particles less than 2.5 micrometers indiameter) believed to be of great health risk was started to monitor in ambientair from 2011-12.
Under the programme, the MPPCB was required to monitor ambient air twicein a week at each station i.e. 104 measurements in a year. They were requiredto take 624 Ambient Air Quality samples each of Sulphur dioxide (SO2) andOxides of Nitrogen (NOx), 312 samples for Respirable Suspended ParticulateMatter (RSPM) and 104 samples for PM2.5 from each station in a year26.
24 Bhopal, Dhar, Gwalior, Indore, Jabalpur and Satna.25 Amlai: 2, Bhopal: 4, Chindwara: 2, Jabalpur: 1, Katni: 2 and Pithampur (Indore): 226 (a) SO2 and NOx: 104 measurement X 6 (at 4 hourly interval) = 624 observations,
There was shortfallbetween 34 per centand 95 per cent insampling ofambient air underNational AmbientAir MonitoringProgramme
Chapter 2: Performance Audit
17
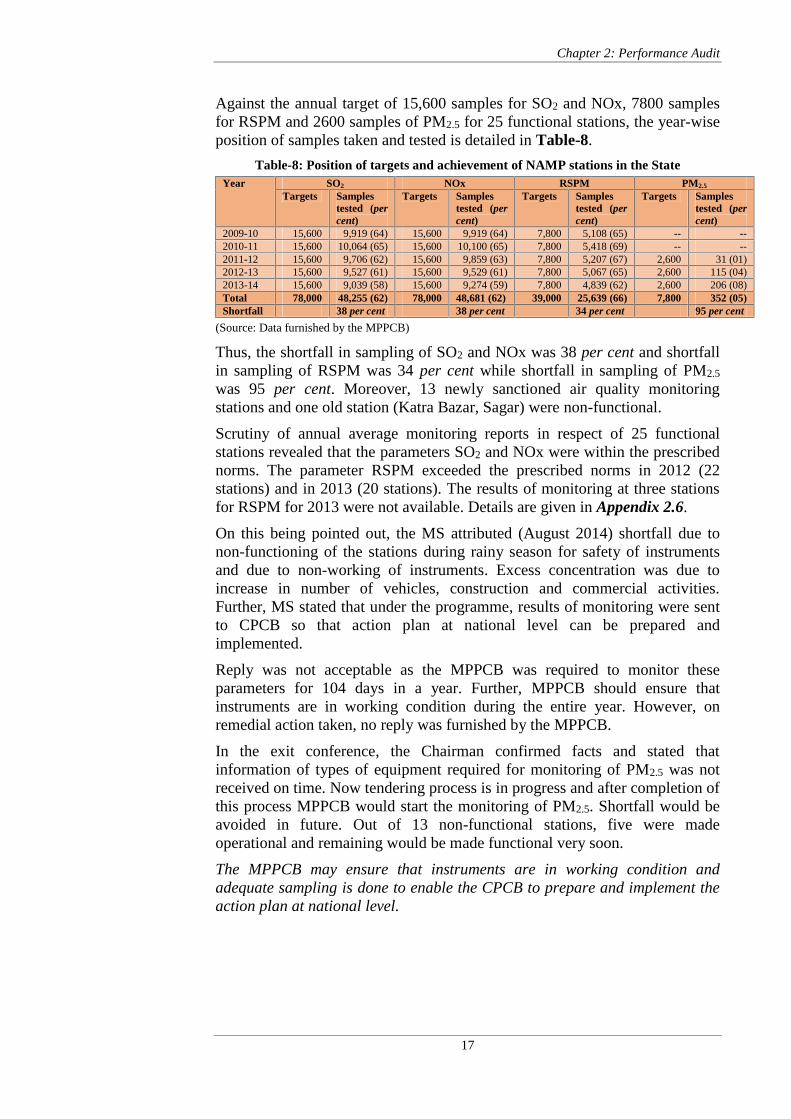
Against the annual target of 15,600 samples for SO2 and NOx, 7800 samplesfor RSPM and 2600 samples of PM2.5 for 25 functional stations, the year-wiseposition of samples taken and tested is detailed in Table-8.
Table-8: Position of targets and achievement of NAMP stations in the StateYear SO2 NOx RSPM PM2.5
Thus, the shortfall in sampling of SO2 and NOx was 38 per cent and shortfallin sampling of RSPM was 34 per cent while shortfall in sampling of PM2.5
was 95 per cent. Moreover, 13 newly sanctioned air quality monitoringstations and one old station (Katra Bazar, Sagar) were non-functional.
Scrutiny of annual average monitoring reports in respect of 25 functionalstations revealed that the parameters SO2 and NOx were within the prescribednorms. The parameter RSPM exceeded the prescribed norms in 2012 (22stations) and in 2013 (20 stations). The results of monitoring at three stationsfor RSPM for 2013 were not available. Details are given in Appendix 2.6.
On this being pointed out, the MS attributed (August 2014) shortfall due tonon-functioning of the stations during rainy season for safety of instrumentsand due to non-working of instruments. Excess concentration was due toincrease in number of vehicles, construction and commercial activities.Further, MS stated that under the programme, results of monitoring were sentto CPCB so that action plan at national level can be prepared andimplemented.
Reply was not acceptable as the MPPCB was required to monitor theseparameters for 104 days in a year. Further, MPPCB should ensure thatinstruments are in working condition during the entire year. However, onremedial action taken, no reply was furnished by the MPPCB.
In the exit conference, the Chairman confirmed facts and stated thatinformation of types of equipment required for monitoring of PM2.5 was notreceived on time. Now tendering process is in progress and after completion ofthis process MPPCB would start the monitoring of PM2.5. Shortfall would beavoided in future. Out of 13 non-functional stations, five were madeoperational and remaining would be made functional very soon.
The MPPCB may ensure that instruments are in working condition andadequate sampling is done to enable the CPCB to prepare and implement theaction plan at national level.
Audit Report on General and Social (Non-PSUs) Sectors for the year ended 31 March 2014
18
2.1.10.2 Monitoring of vehicular pollution
Under Section 20 of the Air Act, 1981 the State Board is to inspect thevehicles to ensure that the standards for emission of air pollutants by vehicleswere being complied with.
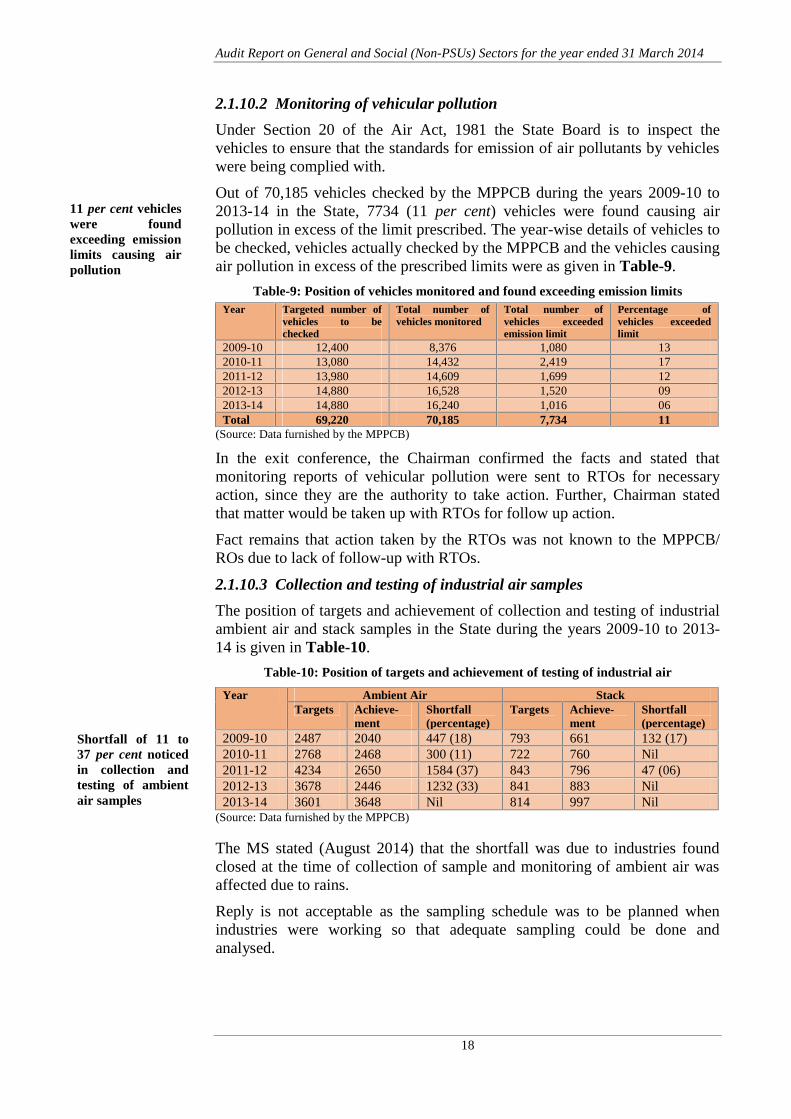
Out of 70,185 vehicles checked by the MPPCB during the years 2009-10 to2013-14 in the State, 7734 (11 per cent) vehicles were found causing airpollution in excess of the limit prescribed. The year-wise details of vehicles tobe checked, vehicles actually checked by the MPPCB and the vehicles causingair pollution in excess of the prescribed limits were as given in Table-9.
Table-9: Position of vehicles monitored and found exceeding emission limitsYear Targeted number of
In the exit conference, the Chairman confirmed the facts and stated thatmonitoring reports of vehicular pollution were sent to RTOs for necessaryaction, since they are the authority to take action. Further, Chairman statedthat matter would be taken up with RTOs for follow up action.
Fact remains that action taken by the RTOs was not known to the MPPCB/ROs due to lack of follow-up with RTOs.
2.1.10.3 Collection and testing of industrial air samples
The position of targets and achievement of collection and testing of industrialambient air and stack samples in the State during the years 2009-10 to 2013-14 is given in Table-10.
Table-10: Position of targets and achievement of testing of industrial air
The MS stated (August 2014) that the shortfall was due to industries foundclosed at the time of collection of sample and monitoring of ambient air wasaffected due to rains.
Reply is not acceptable as the sampling schedule was to be planned whenindustries were working so that adequate sampling could be done andanalysed.
11 per cent vehicleswere foundexceeding emissionlimits causing airpollution
Shortfall of 11 to37 per cent noticedin collection andtesting of ambientair samples
Chapter 2: Performance Audit
19
Further, test-check of monitoring reports of industrial air for the year 2013-14provided by the six test-checked ROs27 we observed that in 50 industrial units,the parameter RSPM exceeded the permissible limit of 100 µg/M3. The extentto which the RSPM exceeded the norms in these units is shown in Table-11.
Table-11: Position of parameter RSPM exceeded by the industries
Sl.No.
Range of parameter RSPM(µg/M3)
Number of industries exceeded theprescribed limits
In the exit conference, the Chairman confirmed the facts and auditobservations and stated that due to shortage of staff the targeted samples couldnot be collected and tested. Efforts would be made to achieve the targetedsamples. ROs would be directed to achieve the targets.
The MPPCB may adhere to sample collection and testing norms prescribed.
2.1.10.4 Monitoring of noise pollution
Under section 4 (3) of the Noise Pollution (Regulation and Control) Rules,2000, the State Board was required to collect, compile and publish technicaland statistical data relating to noise pollution and measures devised for itseffective prevention, control and abatement. The zone-wise standards for noisepollution were notified under the Noise Pollution (Regulation and Control)Rules, 2000.
The position of the tests conducted by the MPPCB at identified areas/zones28
and noise in excess of standards during the years 2009-10 to 2013-14 in theState is as given in Table-12.
Table-12: Position of tests conducted and found in excess of prescribed limits
Above table indicates that the noise in excess of the prescribed standards29
fixed by GoI ranged from 41 per cent to 50 per cent during the years 2009-10to 2013-14.
Further, we noticed that noise pollution, in selected ROs, was in excess ofnorms in 65 per cent samples in Commercial zone, 59 per cent samples in
27 Bhopal, Dhar, Gwalior, Indore, Jabalpur and Satna.28 Residential zone, Commercial zone, Silence zone and Industrial zone.29 Industrial area (Day: 75, Night: 70), Commercial area (Day: 65, Night: 55), Residential
area (Day: 55, Night:45), Silence Zone (Day: 50, Night:40) Limits are in dB (A) Leq
Noise pollutionwas in excess ofprescribedstandards in 47per cent cases
Audit Report on General and Social (Non-PSUs) Sectors for the year ended 31 March 2014
20
Silence zone, 56 per cent samples in Residential zone and 25 per cent samplesin Industrial zone.
We observed that during the year 2013-14 the total number of tests exceedingthe prescribed limit was significantly high in RO Bhopal (87 per cent), ROIndore (65 per cent) and RO Ujjain (59 per cent). The zone-wise position ofnoise pollution in test checked ROs is shown in Appendix 2.7.
Non-publishing of data regarding level of noise pollution resulted in non-compliance with the provisions. The stakeholders and general public alsoremained unaware about the level of noise pollution in the area.
In the exit conference, the Chairman stated that noise monitoring reports weresent to district Collectors, as district administration is the prescribed authorityin cases of noise pollution. Technical data of noise pollution indicating thelevel of pollution would be published in future.
2.1.10.5 Excess emission of air pollutants in cement plants
Under Section 21 of the Air Act, consent was granted to cement plants by theMPPCB with the condition of maintaining appropriate air pollution controlequipment at all points of emission and ensuring that these were always keptrunning and in working condition. The units were to make efforts to restrictparticulate emission as low as possible. At no point of time, the particulateemission from stack should exceed 50 mg/Nm3. Ambient air quality at theboundary of the factory premises was also to conform to the norms prescribed.
Analysis of the monitoring reports of cement plants revealed that RSPM(PM10), Particulate Matter (PM2.5) and particulate emission from stack emittedin the air beyond the permissible limits in the vicinity of the cement plants.The position of PM10, PM2.5 and PM stack monitored in five cement plants forthe years 2010-11 to 2013-14 is given in Appendix 2.8. In three cementplants30, the percentage of excess emission was up to 110, 120 and 89respectively.
In the exit conference, the Chairman stated that notices were issued to cementplants, where emission level was in excess of prescribed limit, with thedirection to bring down emission level. MPPCB would take corrective actionto bring down emission level by improving the efficiency of pollution controldevices.
2.1.11 Waste Management
Surface water contamination takes place when wastes reach water bodieswhile ground water gets contaminated when residues from waste percolateinto the ground water. The management and handling of waste is regulated bythe Environment (Protection) Act, 1986 and rules made thereunder viz. Bio-Medical Waste (Management and Handling) Rules 1998, Hazardous Wastes(Management, Handling and Transboundry Movement) Rules 2008, theMunicipal Solid Waste (Management and Handling) Rules, 2000 etc.
Cement plantswere emittingexcess pollutantsand were thuscausing airpollution
Chapter 2: Performance Audit
21
Bio-Medical Waste
Bio-Medical Waste (BMW) generated during diagnosis, treatment orimmunisation of human beings or animals or in research activities is harmfulto human health and management of BMW is an integral part of health care.
2.1.11.1 Authorisation of Health Care Establishments (HCEs)
As per Rule 8 of the BMW Rules every occupier disposing and/or handlingBMW in any manner should seek authorisation from the Board for handlingand disposal of BMW. Rule 7 (7) of BMW Rules, 1998 provides that everyapplication for authorisation shall be disposed of by the prescribed authoritywithin 90 days from the date of receipt of the application.
Scrutiny of annual reports of BMW submitted by the MPPCB to CPCBrevealed that out of 2280 to 2850 HCEs functioning in the State during thecalendar years 2009 to 2013, HCEs functioning without authorisation were808 to 1274 and HCEs not applied for authorisation were 782 to 1217. Year-wise details of total number of HCEs, HCEs applied for authorisation andauthorisation granted by MPPCB are shown in Appendix 2.9.
During test check of records related to authorisation in selected ROs andMPPCB headquarter, it was noticed that in 47 cases31 authorisation orderswere issued to the occupiers by the ROs and the MPPCB headquarters, withdelays ranging from 9 to 623 days beyond the stipulated time of 90 days.
In the exit conference, the Chairman confirmed the facts and stated that delaywould be avoided in future. He also stated that efforts are being made to bringHCEs under authorisation mechanism.
2.1.11.2 HCEs functioning without renewal of authorisation
As per Rule 8 of the BMW Rules, every occupier of an institution generating,collecting, receiving, storing, transporting, treating, disposing and/or handlingBMW in any other manner should obtain authorisation from the MPPCB forhandling and disposal of BMW.
Section 15 of the Environment (Protection) Act, 1986 provides penalty forcontravention of the provisions of the Act and Rules made thereunder.
Scrutiny of records relating to HCEs showed that 627 HCEs in selected ROs,which initially took authorisation, were subsequently functioning withoutrenewal of authorisation as of March 2014 (Appendix 2.10).
In the exit conference, the Chairman stated that this could not be done due toshortage of staff and efforts would be made to bring HCEs under theauthorisation mechanism.
Reply is not acceptable as the MPPCB confined its responsibilities to issuingof notices and penal action was not taken on defaulter HCEs as required underEnvironment (Protection) Act.
Audit Report on General and Social (Non-PSUs) Sectors for the year ended 31 March 2014
22
2.1.11.3 Inadequate meetings of Advisory Committee on BMW
In pursuant of recommendations of the Rajya Sabha Committee, StateGovernment constituted an Advisory Committee32 (January 2011) to advisethe State Government and the MPPCB on matters related to theimplementation of BMW Rules. This Apex Committee was to meet once inevery three months to coordinate enforcement of BMW Rules.
We observed that the Advisory Committee met only once in March 2011. TheCommittee decided to give training to hospital staff regarding management ofBMW at RO level and to prepare detailed project report (DPR) to studymanagement of BMW by including status of transportation of waste from ruralareas to Common Bio-Medical Waste Treatment Facility (CBWTF). For this,the MPPCB was to coordinate with the Public Health and Family WelfareDepartment, which would provide financial assistance.
The work of preparation of DPR was awarded (June 2011) to EnvironmentalPlanning & Coordination Organisation (EPCO) headed by an ExecutiveDirector. But, we observed that DPR had not been prepared by the EPCO.During the period 2011-14, only 11 trainings/workshops33 were organised innine ROs in which 1761 trainees were imparted training. No training/workshop were organised in the remaining four ROs34. Thus, recommendationof the Advisory Committee was not implemented fully as of August 2014.
On this being pointed out, the MS stated (August 2014) that due to non-providing of required funds to EPCO, the work was not initiated by them.
In the exit conference, the Chairman stated that efforts would be made toorganise regular meetings of the Committee and its recommendations wouldbe implemented. He also intimated that MPPCB constituted State LevelTechnical Advisory Committee with representative from Indian Council ofMedical Research, for periodical review and addressing the issues of BMW.
The Advisory Committee on BMW may meet at prescribed intervals andensure that its recommendations were implemented.
2.1.11.4 Monitoring of standards for incinerators
According to the emission standards for incinerators prescribed in the BMWRules, five parameters (Particulate Matter, Nitrogen oxides, HCL, height ofstack and volatile organic compounds in ash) were required to be monitoredby State Board to ensure that pollution limits were maintained. CPCBguidelines for CBWTFs provide that one CBWTF may be allowed to cater upto 10,000 beds and shall not cater health care units situated beyond a radius of150 Kms. There were 15 CBWTFs in the State as of March 2014.
Scrutiny of monitoring reports and records related to incinerators in four testchecked ROs35 revealed the following:
32 Headed by Principal Secretary of Public Health and Family Welfare Department.33 Bhopal (01), Guna (01), Gwalior (02), Indore (01), Jabalpur (01), Rewa (01), Sagar
(01), Satna (02) and Ujjain (01).34 Dhar, Katni, Shahdol and Singrauli.35 RO: Bhopal, Indore, Jabalpur and Satna.
Only one meetingof AdvisoryCommittee onBMW held since2011 againststipulation of onemeeting in everythree months
Chapter 2: Performance Audit
23
Volatile Organic Compounds (VOC) in ash was not checked by any ofthe four test-checked ROs, while the parameter HCL was not checked by theROs Satna and Jabalpur,
The Incinerator situated at Indore was catering the BMW from 12,991beds under the jurisdiction of RO Indore. The same incinerator was alsocollecting BMW from Ujjain, Dewas, Shajapur, Nagda, Dhar and Burhanpur.The number of beds in these districs were not known. Besides, Burhanpur issituated about 190 kms from Indore, beyond the prescribed limit of 150 kms.
The CBWTF at Sehore was authorised to cover Betul and GunaDistricts, which are about 200 kms from Sehore.
In the exit conference, the Chairman confirmed the fact and stated that due toshortage of equipment these parameters (VOC and HCL) could not bechecked. It would be checked in future. Authorisation to CBWTFs beyondradius of 150 Kms were issued as no other CBWTF was available in that area.
Hazardous waste
Hazardous waste means the waste which by reason of any of its physical,chemical, reactive, toxic, flammable, explosive or corrosive characteristicscauses danger or is likely to cause danger to health or environment. Certainindustries generate wastes that are toxic in nature and require adequate control.
2.1.11.5 Delayed issue of authorisation to occupiers and non-maintenanceof register of conditions of authorisation
Rule 5 of Hazardous Waste Rules provides that every person who is engagedin generation, collection, processing, conversion, transfer or the like ofhazardous waste shall require to obtain authorisation from State Board. Onreceipt of applications completed in all respect for seeking authorisation, theState Board will grant authorisation within 120 days subject to such conditionsas may be laid down therein.
During test check of records related to authorisation we observed that in 22cases36 (out of 220 cases test checked) authorisation was delayed ranging up to347 days. However, authorisation was granted from the date of application.Out of 22 cases, delays were more than 30 days in 13 cases. Thus, delays inissuing authorisation to these occupiers resulted in functioning of theoccupiers without authorisation during the period of delay.
We also noticed that the ROs did not maintain register of conditions imposedduring granting authorisation/ renewal, though required under the Rules. Thus,the conditions were not open for the persons affected due to the authorisation.
In the exit conference, the Chairman stated that efforts would be made toavoid delay in issue authorisation and the ROs would be directed to maintainthe register of conditions while granting the authorisation.
The MPPCB should ensure maintenance of register of conditions imposed atthe time of granting authorisation as prescribed in the Rules.
Audit Report on General and Social (Non-PSUs) Sectors for the year ended 31 March 2014
24
2.1.11.6 Industries functioning without renewal of authorisation
As per Rule 5 (4) of Hazardous Waste Rules, 2008 authorisation forfunctioning of industries given by the State Board is valid for five years and isrequired to be renewed for continuous functioning of the industry.
Test check of inventory report of hazardous waste in four test-checked ROsrevealed that out of 625 industries generating hazardous waste, 76 industries37
were functioning without renewal of authorisation under the Hazardous WasteRules as of March 2014.
In the exit conference, the Chairman stated that this could not be done due toshortage of staff and efforts would be made to bring industries under theauthorisation mechanism.
Municipal Solid Waste
Municipal Solid Waste (MSW) includes commercial and residential wastesgenerated in a municipal area in either solid or semi-solid form excludingindustrial hazardous wastes but including treated BMW.
2.1.11.7 Compliance with standards prescribed under MSW Rules
According to the Municipal Solid Waste Rules, Municipalities are responsiblefor disposal of MSW and the State Board is responsible for monitoring thecompliance of standards as specified in the Rules. The Rules also provide thatMSW shall be managed and handled in accordance with the compliancecriteria laid down in the Rules (Schedule II) in respect of six parameters viz.collection, segregation, storage, transportation, processing and disposal ofMSW.
Scrutiny of annual reports submitted by MPPCB to CPCB revealed that therewere 338 to 365 local bodies (LBs) in the State during the years 2009-10 to2013-14. We observed that during these years, MSW was collected by only 3to 11 LBs, while processing and disposal of MSW was done by only one tofive LBs. Thus, processing and disposal of MSW was done in less than twoper cent of the LBs. The status of compliance with standards for the sixparameters by the local bodies during 2009-14 is given in Appendix 2.11.
In the exit conference, the Chairman stated that notices were being issued tolocal bodies. Continuous efforts are being made at MPPCB level to improvethe situation. As local bodies are Government bodies the issue was alsobrought to the notice at appropriate level in the Government.
2.1.12 Monitoring for control of pollution in industries and HCEs
The State Board is required to inspect the establishments and monitorcompliance with various conditions of consent and authorisation under BMW,Hazardous Waste and Consent Rules. As per Rule 6 of Consent Rules, 1975,the MPPCB is also to make surprise checks and inspections of the agencies inorder to keep a constant check of pollution in the State.
Test-check of records of the MPPCB and the ROs revealed that inspection ofindustries and HCEs was conducted at the time of issue of consent/
Out of 625industries, 76industries werefunctioning withoutauthorisationunder HazardousWaste Rules
Processing anddisposal of MSWwas done by lessthan two per cent ofthe local bodies
No norms fixed forinspection ofindustries andHCEs
Chapter 2: Performance Audit
25
authorisation and renewal thereof. There was no record to show that surpriseinspection of the industries was conducted during the period 2009-14.
ROs confirmed the fact and stated that inspections were also carried out incase of complaint, if any.
In the exit conference, the Chairman stated that vigilance team has beenconstituted for random inspections.
The MPPCB may fix norms for inspection of industries and HCEs on the basisof their pollution potentiality and ensure their compliance.
2.1.13 Non-preparation of working manual
The Departmental manual is a permanent directive used for detailed guidancepertaining to the administrative functions of a department and is veryimportant for the smooth functioning of any department.
We observed that MPPCB did not prepare any manual for its functioning andto carry out the responsibilities entrusted to it under various Acts and Rules,despite being set up in 1974.
In the exit conference, the Chairman stated that the Committee has beenconstituted for preparation of working manual, it would be prepared shortly.
The MPPCB may prepare working manual specifying the duties andresponsibilities at each level for effective internal control.
2.1.14 Manpower management
As on 31 March 2014, the MPPCB had shortage of 303 staff (39 per cent ofsanctioned posts) in different cadres as shown in Appendix-2.12. We observedthat the staff shortage in technical services responsible for consent/authorisation and inspections was 45 per cent, while staff shortage in scientificservices responsible for collection and testing of samples as well as researchworks was 41 per cent. The shortages would adversely affect functioning ofthe MPPCB particularly collection and testing of samples and conduct ofinspections.
In the exit conference, the Chairman admitted the audit observations.
The vacant posts may be filled up for efficient functioning of the MPPCB.
2.1.15 Conclusion
Working of the Madhya Pradesh Pollution Control Board (MPPCB) forprevention, control or abatement of environment pollution was not adequate asreflected from the following:
Significant delays occurred in granting consent/ authorisation toindustries and health care establishments. In test checked ROs, 2190industries, 280 local bodies and 28 building projects were functioning eitherwithout obtaining consent or renewal of consent under Water Act/Air Act.Out of 625 industries 76 industries were functioning without renewal ofauthorisation under Hazardous waste Rules.
MPPCB did notprepare workingmanual
MPPCB hassignificant shortageof manpower
Audit Report on General and Social (Non-PSUs) Sectors for the year ended 31 March 2014
26
The MPPCB did not adhere to its norms prescribed for collection andtesting of samples from industries to monitor pollution level and fixed targetslower than the norms.
In 32 districts in the selected ROs, there was no sewage treatment plantfor treatment of domestic effluents/sewage. River water quality deteriorated at19 monitoring locations and improved at eight locations.
Fourteen ambient air quality monitoring stations out of 39 sanctioned,were not functional. Shortfalls in sampling of ambient air quality in thefunctional stations were ranged between 34 and 95 per cent.
Cement plants were causing excess emission of air pollutants.
Monitoring for control of pollution marred due to absence of anyprescribed norm for inspection of industries and HCEs by the MPPCB. TheApex Committee on BMW constituted in January 2011 never met except oncein 2011.
Chapter 2: Performance Audit
27
Food, Civil Supplies and Consumer Protection Department
2.2 Public Distribution System in Madhya Pradesh
Executive Summary
Public Distribution System (PDS) is a major instrument of the Government’seconomic strategy for ensuring availability of foodgrains to the public ataffordable prices as well as for enhancing food security to the poor. Whileoverall responsibility of management of foodgrains in the country vestedwith the Government of India (GoI), the State Government is responsible fortheir effective distribution in the State through the PDS. In Madhya Pradesh,the PDS was implemented by Food, Civil Supplies and Consumer ProtectionDepartment. During the period 2009-14, the State Government incurred anexpenditure of ` 2055 crore towards subsidy of foodgrains under PDS. Aperformance audit of the implementation of ‘Public Distribution System inMadhya Pradesh’ during the period 2009-14 revealed the following:
Significant under-utilisation of funds during 2013-14 affected the PDSactivities like recoupment of losses to fair price shops and lead societies onoperation of PDS, construction of godowns/Covered and Plinth Storage anddistribution of iodised salt.
(Paragraph 2.2.6.1)
Number of BPL and AAY ration cards issued were more than thenumber of such families, indicating circulation of bogus cards. Governmenttook initiatives for detection and elimination of bogus ration cards. But,reconciliation of BPL/AAY ration cards with survey list was not done.Computerisation of PDS was not done within the timeline.
(Paragraphs 2.2.7.1 to 2.2.7.3)
The Department did not distribute 12.44 lakh MT wheat and 1.61 lakhMT rice during the period 2009-14. APL quota wheat of 6.84 lakh MT wasdiverted for BPL card holders causing additional financial burden.
(Paragraphs 2.2.8.1 and 2.2.8.2)
Large quantity of PDS commodities remaining undistributed with FPSmay lead to illegal diversion.
(Paragraph 2.2.8.4)
The distribution of kerosene was done without ensuring theentitlement of cardholders possessing single and double LPG cylinders.
(Paragraph 2.2.8.7)
There was significant shortage of fair price shops in rural areas.
(Paragraph 2.2.9)
There was shortfall in conduct of monthly review of lifting and supplyof PDS commodities to FPSs by the Collectors. The Vigilance committeemeetings for review of allotment, distribution of foodgrains were not heldregularly.
(Paragraphs 2.2.10.2 and 2.2.10.3)
Audit Report on General and Social (Non-PSUs) Sectors for the year ended 31 March 2014
28
2.2.1 Introduction
Public Distribution System (PDS) is meant for distribution of essentialcommodities to the ration cardholders (consumers) through Fair Price Shops(FPS) for distribution of foodgrains at affordable prices to the poor. The mainobjective of PDS is to ensure regular supply of essential commodities atreasonable prices, particularly to the weaker sections of the society. In June1997, Government of India (GoI) introduced Targeted Public DistributionSystem (TPDS) under which foodgrains was to be issued at subsidised rates toeach family living Below Poverty Line (BPL). In order to make TPDS morefocused, GoI launched (December 2000) Antyodaya Anna Yojana (AAY) forsupply of foodgrains at highly subsidised rates for the poorest of the poor inthe country.
In Madhya Pradesh, the Madhya Pradesh State Civil Supplies CorporationLimited (MPSCSC) procures foodgrains as an agency of the State Governmentfor distribution under PDS and other welfare schemes. Procurement in excessof GoI allotment is surrendered to Food Corporation of India (FCI). Under thePDS, wheat, rice, coarsegrains1, sugar, kerosene and salt are distributed to theBPL, AAY and Above Poverty Line (APL) families.
In Madhya Pradesh, the network of PDS comprised of 22,165 FPS (rural:18,041 and urban: 4,124). As of March 2014, the total number of families was161.28 lakh (BPL: 58.20 lakh, APL: 85.49 lakh, AAY: 17.59 lakh). The Statestarted providing PDS commodities as per National Food Security Act, 2013(NFSA)2 from March 2014 to persons belonging to eligible households i.e.Priority Households (PH) and AAY. The total number of verified AAYfamilies was 16.88 lakh and PH families was 74.94 lakh as of March 2014.
2.2.2 Organisational set-up
The overall responsibility for implementation of the PDS is rested with theFood, Civil Supplies and Consumer Protection (FC&CP) Department (theDepartment) headed by a Principal Secretary. The Commissioner, FC&CP isthe nodal officer for assessment of the requirement, allotment of district quotaand payment of grants/loans/subsidies to implementing agencies, i.e. MadhyaPradesh State Civil Supplies Corporation Limited and Madhya Pradesh StateCo-operative Marketing Federation Limited (MARKFED).
The agencies are responsible for procurement of foodgrains, their storage anddistribution to consumers with the assistance of Madhya Pradesh StateWarehousing and Logistics Corporation (MPSWLC).The District Central Co-operative Bank (DCCB) finances the lead/link societies for PDS operations.
The District Collectors with the assistance of District Supply Officers/DistrictSupply Controllers (DSOs/DSCs) are responsible for assessing requirement offoodgrains for the districts and make further allocation to FPSs. They are alsoresponsible for monitoring and overall control in implementation of PDS inthe District. The Sub-Divisional Officers (SDOs), Revenue and the Tahsildars
1 Maize and Jowar .2 The Act provides for food and nutritional security by ensuring access to adequate
quantity of quality food at affordable prices to the people.
Chapter 2: Performance Audit
29
at block level assist the DSOs/DSCs in allotting FPS and issue of ration cardsrespectively.
2.2.3 Audit objectives
The objectives of the performance audit were to assess whether:
identification and selection of beneficiaries was as per norms;
distribution arrangements to ensure accessibility to PDS commoditieswere effective; and
effective vigilance was exercised over various functionaries of Schemeoperations through suitable monitoring/inspection mechanism.
2.2.4 Audit criteria
The Audit criteria were derived from the following sources:
Provisions of the Public Distribution System (Control) Order, 2001(GoI) and Madhya Pradesh Public Distribution System (MPPDS)(Control) Order, 2009 regarding issue of ration cards, operation ofFPSs, distribution, allotment and storage of PDS commodities as wellas inspection and supervision.
GoI guidelines relating to identification of beneficiaries.
Orders/instructions of GoI and State Government for issue of rationcards, weeding out of bogus ration cards and monitoring overfunctioning of FPS.
Scale of issue and issue rates of foodgrains prescribed by the GoI andthe State Government.
Prescribed monitoring mechanism as per State Government and GoIcontrol orders and instructions.
2.2.5 Audit coverage and methodology
Implementation of PDS during the period 2009-14 was reviewed betweenNovember 2013 and August 2014 through test check of records and analysisof the data collected from the offices of Commissioner (FC&CP), MPSCSC,MARKFED, MPSWLC Headquarters and selected district offices. Out of 51districts3 in the State, 14 districts4 were selected by adopting Simple RandomSampling Without Replacement (SRSWOR) method. Three blocks from eachselected districts and four FPS from each block were selected at district level.
The records of District Manager (DM) MPSCSC, District Marketing Officer(DMO) MARKFED in selected districts were also test checked along withrecords of warehouses/godowns, lead/link societies, wholesale dealers andFPSs in the selected blocks. The entry conference was held on 21 May 2014with the Principal Secretary of the Department wherein the audit objectives,scope and methodology were discussed. Exit conference was held with
3 One district (Agar-Malwa) created in August 2013.4 Barwani, Bhopal, Dhar, Indore, Katni, Khandwa, Khargone, Raisen, Ratlam,
Rewa, Satna, Shahdol, Sidhi and Ujjain.
Audit Report on General and Social (Non-PSUs) Sectors for the year ended 31 March 2014
30
Principal Secretary on 5 November 2014; the views of the Department havebeen incorporated suitably at appropriate places in the review.
Audit findings
2.2.6 Financial position
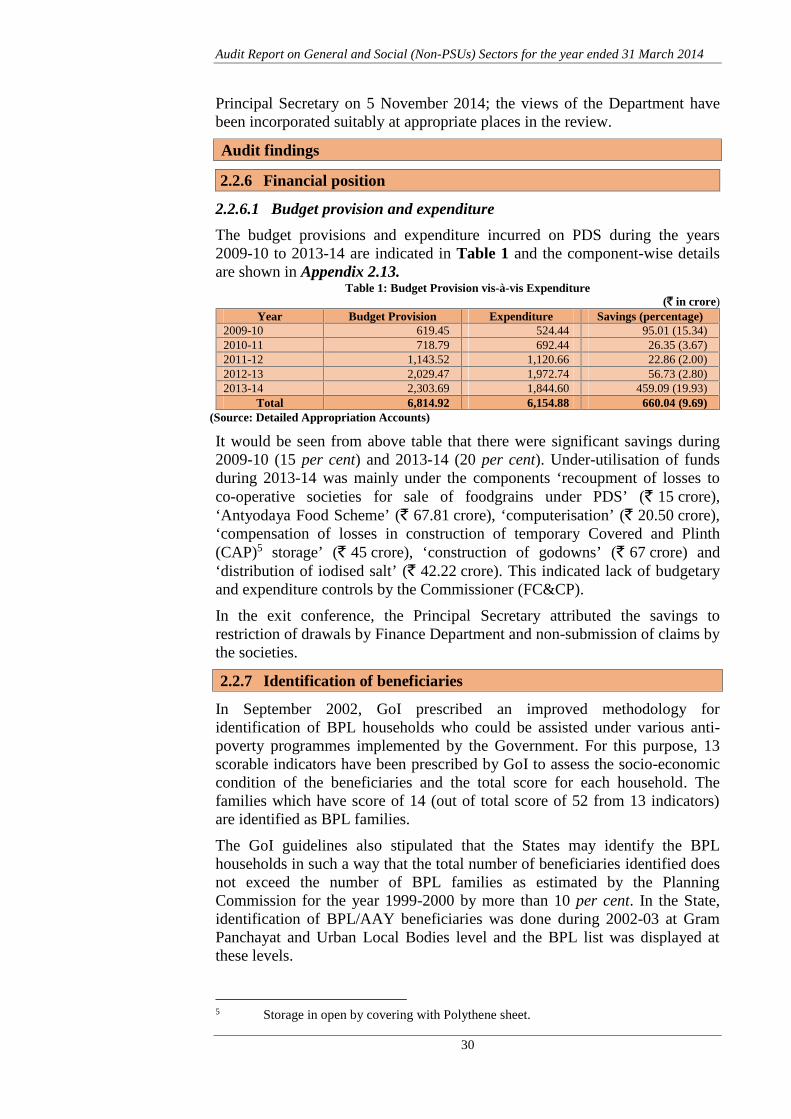
2.2.6.1 Budget provision and expenditure
The budget provisions and expenditure incurred on PDS during the years2009-10 to 2013-14 are indicated in Table 1 and the component-wise detailsare shown in Appendix 2.13.
Table 1: Budget Provision vis-à-vis Expenditure(` in crore)
Total 6,814.92 6,154.88 660.04 (9.69)(Source: Detailed Appropriation Accounts)
It would be seen from above table that there were significant savings during2009-10 (15 per cent) and 2013-14 (20 per cent). Under-utilisation of fundsduring 2013-14 was mainly under the components ‘recoupment of losses toco-operative societies for sale of foodgrains under PDS’ (` 15 crore),‘Antyodaya Food Scheme’ (` 67.81 crore), ‘computerisation’ (` 20.50 crore),‘compensation of losses in construction of temporary Covered and Plinth(CAP)5 storage’ (` 45 crore), ‘construction of godowns’ (` 67 crore) and‘distribution of iodised salt’ (` 42.22 crore). This indicated lack of budgetaryand expenditure controls by the Commissioner (FC&CP).
In the exit conference, the Principal Secretary attributed the savings torestriction of drawals by Finance Department and non-submission of claims bythe societies.
2.2.7 Identification of beneficiaries
In September 2002, GoI prescribed an improved methodology foridentification of BPL households who could be assisted under various anti-poverty programmes implemented by the Government. For this purpose, 13scorable indicators have been prescribed by GoI to assess the socio-economiccondition of the beneficiaries and the total score for each household. Thefamilies which have score of 14 (out of total score of 52 from 13 indicators)are identified as BPL families.
The GoI guidelines also stipulated that the States may identify the BPLhouseholds in such a way that the total number of beneficiaries identified doesnot exceed the number of BPL families as estimated by the PlanningCommission for the year 1999-2000 by more than 10 per cent. In the State,identification of BPL/AAY beneficiaries was done during 2002-03 at GramPanchayat and Urban Local Bodies level and the BPL list was displayed atthese levels.
5 Storage in open by covering with Polythene sheet.
Chapter 2: Performance Audit
31
In February 2008, Government of MP intimated GoI the number of BPLfamilies in the State as 44.59 lakh on the basis of ‘cut-off point’ against 37.13lakh fixed by the GoI. The inclusion of name in the BPL list is a continuousprocess and at the end of March 2014, there were 75.79 lakh BPL families inthe State as per BPL survey list.
2.2.7.1 Issue of ration cardsAs envisaged in Annexure-I of clause 3 of MP PDS (Control) Order 2009,APL ration cards under PDS are to be issued by the Gram Panchayats in ruralareas and urban local bodies in urban areas by designated authorities6. FromApril 2013, the Chief Executive Officer (CEO) Janpad Panchayat wasauthorised to issue the cards for rural areas. As per the provisions of MP LokSewaon ke Pradan ki Guarantee Adhiniyam 2010, BPL and AAY cards inrural areas are to be issued by Tahsildar and for urban areas by AssistantSupply Officers (ASOs) of DSO/DSC office.
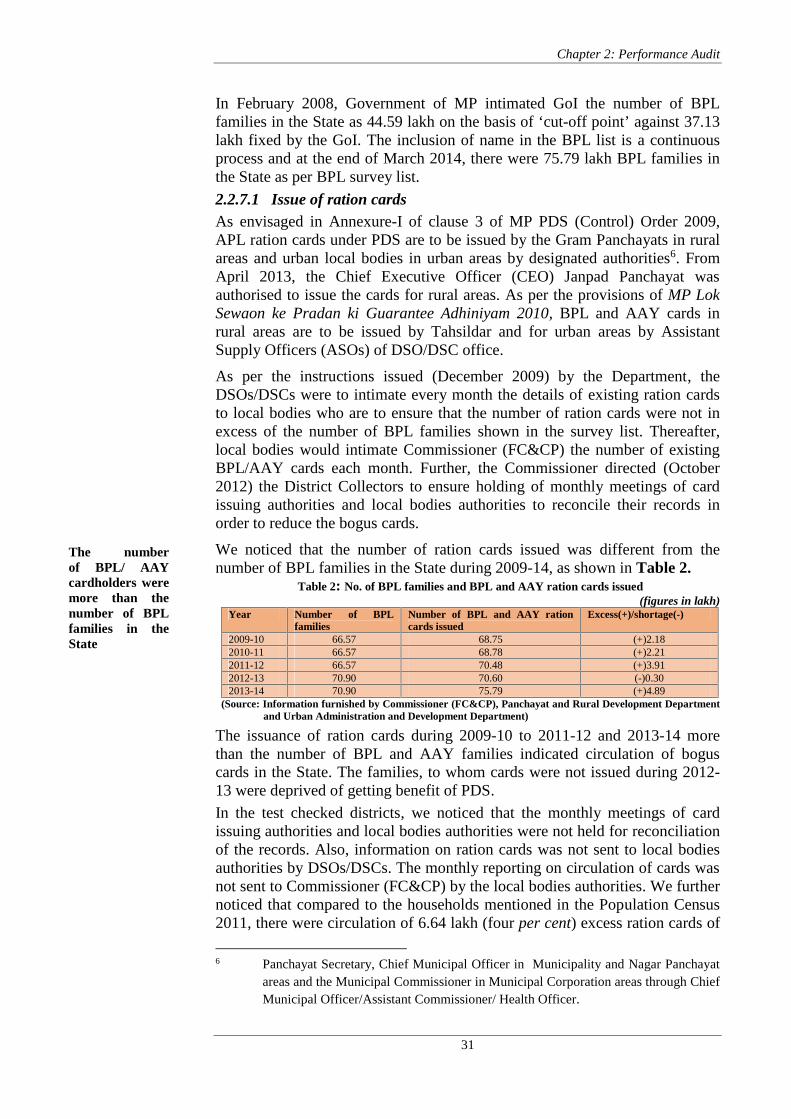
As per the instructions issued (December 2009) by the Department, theDSOs/DSCs were to intimate every month the details of existing ration cardsto local bodies who are to ensure that the number of ration cards were not inexcess of the number of BPL families shown in the survey list. Thereafter,local bodies would intimate Commissioner (FC&CP) the number of existingBPL/AAY cards each month. Further, the Commissioner directed (October2012) the District Collectors to ensure holding of monthly meetings of cardissuing authorities and local bodies authorities to reconcile their records inorder to reduce the bogus cards.
We noticed that the number of ration cards issued was different from thenumber of BPL families in the State during 2009-14, as shown in Table 2.
Table 2: No. of BPL families and BPL and AAY ration cards issued(figures in lakh)
(Source: Information furnished by Commissioner (FC&CP), Panchayat and Rural Development Departmentand Urban Administration and Development Department)
The issuance of ration cards during 2009-10 to 2011-12 and 2013-14 morethan the number of BPL and AAY families indicated circulation of boguscards in the State. The families, to whom cards were not issued during 2012-13 were deprived of getting benefit of PDS.
In the test checked districts, we noticed that the monthly meetings of cardissuing authorities and local bodies authorities were not held for reconciliationof the records. Also, information on ration cards was not sent to local bodiesauthorities by DSOs/DSCs. The monthly reporting on circulation of cards wasnot sent to Commissioner (FC&CP) by the local bodies authorities. We furthernoticed that compared to the households mentioned in the Population Census2011, there were circulation of 6.64 lakh (four per cent) excess ration cards of
6 Panchayat Secretary, Chief Municipal Officer in Municipality and Nagar Panchayatareas and the Municipal Commissioner in Municipal Corporation areas through ChiefMunicipal Officer/Assistant Commissioner/ Health Officer.
The numberof BPL/ AAYcardholders weremore than thenumber of BPLfamilies in theState
Audit Report on General and Social (Non-PSUs) Sectors for the year ended 31 March 2014
32
all categories in the State. In five districts7 out of 14 selected districts, excesscirculation was four to 22 per cent. The discrepancy was due to non-observance of Government directions.
As required under MP PDS (Control) Order 2009, the database of ration cardswas to be maintained at Directorate level and district level. The physicalverification of 20 per cent of ration cards issued every year was also to beensured by the District Collectors. We observed that the database of rationcards was not maintained and physical verification of ration cards was notdone by the Collectors.
In the exit conference, the Principal Secretary stated that instructions would beissued to the district authorities for reconciliation of records of ration cardsand survey list.
2.2.7.2 Elimination of bogus ration cardsThe PDS (Control) Order, 2001 stipulates that eliminating bogus ration cardsas well as bogus units in the ration cards should be a continuous exercise bythe State Government.
Scrutiny of records of Commissioner (FC&CP) revealed that despitedirections issued (June 2008) by GoI to communicate the action taken fordeletion of bogus ration cards, the Department did not take any initiative up toAugust 2009. Only after issue of GoI instructions in August 2009 to carry outan intensive campaign to review the list of BPL and AAY families and rationcards for elimination of the bogus ration cards, the State Government issueddirections (September 2009) for conducting campaign to all DistrictCollectors. During the campaign conducted (2009-11), 70,168 bogus rationcards were deleted in the State, as reported (July 2012) by the Commissioner(FC&CP) to the State Government.
Again, in October 2010, the Commissioner (FC&CP) directed all Collectors inpursuance with the GoI directions (September 2010) for issuing advertisementin newspaper for surrender of bogus ration cards within two weeks ofadvertisement and directed to launch campaign after the expiry of two weeks.After advertisement (October to December 2010), 35,428 bogus ration cardswere surrendered and deleted. In the test checked districts, we noticed thatfurther review of ration cards after expiry of two weeks of advertisement wasnot conducted except in Ujjain District.
Further, in June and October 2012 the Commissioner directed DSOs andDistrict Collectors for checking of one FPS each in 40 districts8 on randombasis and to trace the bogus cardholders by reconciling the records ofBPL/AAY ration cards with BPL survey list and total ration card holders withthe number of households projected in population census 2011. Variationsnoticed, if found, could be traced by door-to-door physical verification ofcardholders.
During the random checking, 1,315 bogus ration cards were detected and` 14.62 lakh were recovered during the period 2012-14 from the cardholdersfor the ration taken by them earlier.
7 Barwani: 54,665 ( 22 per cent), Dhar: 48,495 ( 11 per cent), Khandwa: 50,246 ( 19per cent), Ratlam : 12,988 ( 4 per cent) and Ujjain: 41,290 (11 per cent).
8 Excluding ten districts where the checking was conducted earlier.
1,06,911 bogusration cardswere eliminatedin the Stateduring 2009-14.Door to doorphysicalverification wasnot done
Chapter 2: Performance Audit
33
We observed that only in three selected districts, i.e. Khandwa, Satna andSidhi, the reconciliation of ration cards was done during the period. However,door-to-door physical verification was not done by them to settle the variationnoticed during reconciliation. Thus, possibility of existence of bogus rationcards in the State could not be ruled out. This indicates laxity on the part ofdistrict level officials in observing the Government directions and lack ofmonitoring on the part of Commissioner (FC&CP).
In the exit conference, the Principal Secretary stated that the Government hadmade sufficient efforts for cancelling the bogus ration cards and periodicalchecking of ration card to weed out the bogus ration cards would be ensured.
The periodical check of ration cards to weed out ineligible and bogus rationcards should be continued.
2.2.7.3 Delay in computerisation of TPDSFor computerisation of PDS, GoI framed guidelines and directed (October2011) the State Government to prepare action plan. The first component of thecomputerisation comprised of digitisation of ration cards/beneficiary and otherdatabases, computerisation of supply-chain management, setting up oftransparency portal and grievance redressal mechanisms was to be carried outduring the year 2012-13 and the second component (computerisation ofoperations at the FPS) was to be completed by the year 2013-14.
We observed that against the demand of ` 58.51 crore proposed by the StateGovernment in February 2013, GoI sanctioned (March 2013) ` 57.80 croreand released ` 17.34 crore during the period 2012-14 for the activities underthe first component. The State Government, however, spent ` 8.55 croreduring the years 2012-13 (` 3.11 crore) and 2013-14 (` 5.44 crore) fordigitisation of ration cards and procurement of hardware for supply chainmanagement etc. in the districts. As per the progress report submitted to GoI(July 2014) the work of digitisation of beneficiaries and supply chainmanagement was in progress.
Thus, the activities of even the first component of computerisation was notdone as of July 2014 for computerisation of PDS from FPS to State level.
In the exit conference, the Principal Secretary stated that the digitisation ofbeneficiaries is a continuous process and 116 lakh households have beendigitised. Computerisation of supply chain management is under progress.
2.2.8 Distribution of commodities under PDS
Foodgrains procured and lifted from FCI, sugar lifted from sugar factories andsalt procured from open market were kept in the warehouses hired by theauthorised nominee, MPSCSC. The delivery of PDS commodities from thewarehouses was made by MPSCSC through the lead/link societies9 to FPSsfor distribution. Kerosene was supplied by the oil companies to the wholesaledealers on the basis of allotment orders of the Commissioner (FC&CP). The
9 “Lead society" means a co-operative society which has been issued a license by theCollector for lifting and transportation of controlled essential commodities from theissue centre to the designated fair price shop. ”Link society” means any primaryagricultural co-operative society, laghu vanopaj sahakari samiti and marketing orwholesale consumers co-operative society authorized by the Department to run a fair
price shop in the rural areas under the public distribution system.
Audit Report on General and Social (Non-PSUs) Sectors for the year ended 31 March 2014
34
wholesale dealers supplied the kerosene to FPSs through lead societies/semiwholesale dealers. As on March 2014, there were 189 issue centres ofMPSCSC located at district and sub district level, 5560 lead societies and linksocieties and 22,165 FPS for distribution of PDS commodities to cardholders.
The PDS commodities allocated by GoI on quarterly/yearly basis was furtherre-allocated on monthly basis to DSOs/DSCs of the districts by Commissioner(FC&CP). The DSOs/DSCs issued block-wise/ FPS-wise allotment orders.The scale of issue of foodgrains as fixed by GoI for APL, BPL and AAYcardholders was 35 kg per cardholder since April 2002. In March 2008, theState Government scaled down the quantity of foodgrains for BPL families to20 kg per card holder and also reduced the rates10 of consumer price. Therewas no fixed scale of issue for APL cardholders in the State.However, Government enhanced11 (May 2011) the consumer price of wheatand rice for APL cardholders. The distribution of sugar was made atsubsidised rate of ` 13.50 per kg. to BPL and AAY families. The financialburden in excess of GoI subsidy (` 18.50 per kg.) was to be borne by the StateGovernment. The salt was distributed to BPL/AAY families at ` 1 per kg. bythe State Government from its own sources.During 2009-14, expenditure incurred by the State Government was` 1,891.14 crore for BPL and ` 163.97 crore for AAY on subsidisation ofissue price of foodgrains, in excess of the subsidy given by GoI.Due to implementation of NFSA 2013, priority households were to be issuedfoodgrains at 5 kg. per person per card and AAY cardholders at 35 kg. percard per month from March 2014. The flow diagram of the distribution of PDScommodities from State level to FPS is given in the chart (Appendix 2.14).The deficiencies noticed in the allotment, lifting, distribution and handling ofPDS commodities are discussed in succeeding paragraphs:
2.2.8.1 Diversion of APL quota of wheat for BPL beneficiaries
PDS (Control) Order, 2001 stipulates that the State Government should notdivert the allocation made by GoI under PDS for distribution under otherSchemes.The total number of BPL families identified (March 2014) by StateGovernment was 75.79 lakh. However, GoI allotted foodgrains for only 41.25lakh BPL families12. During scrutiny of records of allocation of foodgrains byCommissioner (FC&CP), we noticed that 6.84 lakh MT APL quota wheat wasdiverted to meet the requirement of BPL families. As a result, StateGovernment had to bear additional burden of ` 507.96 crore13, towardsdifference amount of Central Issue Price (CIP)14 and consumer price fixed by
10 The consumer price of wheat reduced from ` 5 to ` 3 per kg and rice ` 6.50 to ` 4.50per kg.
11 The price of wheat increased from ` 7 to ` 9 per kg and rice from ` 9.20 to ` 11.00per kg.
12 As per the number calculated by the Planning Commission (GoI)13 The difference in CIP ` 1,950 per MT (` 6,100 for APL wheat - `4,150 for BPL
wheat) X 6,83,873 MT = `13,335.52 lakh + difference in consumer price fixed byState Government ` 37,460.60 lakh (2009-11, ` 4,000 per MT X 2,80,806 MT=` 11,232.24 lakh+ 2011-13, ` 6,000 per MT X 2,77,800 MT=` 16,668.00 lakh +2013-14, ` 6,000 per MT X 23050 MT= ` 1383 lakh+ ` 8,000 per MT X 1,02,217MT= ` 8177.36 lakh).
14 The Price notified by GoI for distribution of foodgrains under PDS.
State Government for the total quantity of foodgrains diverted during 2009-14.Thus, APL quota wheat was diverted in violation of GoI order.
In the exit conference, the Principal Secretary stated that the APL quota ofwheat was diverted to BPL due to less allotment in BPL and the extra financialburden was borne by the State Government.
2.2.8.2 Shortfall in distribution of wheat and rice
The allotment of wheat and rice by GoI and distribution by the StateGovernment through MPSCSC during the period 2009-14 was as under
Allotment and distribution of wheat and rice (in lakh MT)
26.5
9
26.4
1
25.8
528.6
4
29.2
2
23.7
5
25.7
3
24.7
4
23.0
227.0
3
2.23
5.23 5.23
4.84
4.15
2.23 4.
89
4.95
4.47
3.53
0
5
10
15
20
25
30
35
2009-10 2010-11 2011-12 2012-13 2013-14
Allotment of WheatDistribution of WheatAllotment of RiceDistribution of Rice
The Department did not distribute 12.44 lakh MT wheat and 1.61 lakh MTrice during the period 2009-14.
The percentage of distribution of wheat by the State against allotment made byGoI ranged between 97 per cent (2009-10) and 86 per cent (2011-12). Thepercentage distribution of rice ranged between 100 per cent (2009-10) and 85per cent (2013-14). The details of distribution of foodgrains against allotmentmade by GoI for various categories of cardholders are given in Appendix 2.15.
The distribution of wheat and rice against GoI allotment for various categoriesof cardholders during the period 2009-14 are shown in Table 3.
Table 3: Distribution of wheat and rice against GoI allotment toAPL/BPL/AAY cardholders
Audit Report on General and Social (Non-PSUs) Sectors for the year ended 31 March 2014
36
It is evident from the table that the distribution of APL wheat against the GoIallotment ranged from 63 to 93 per cent. The distribution of BPL wheat wasmore than the allotment during the years 2010-11 to 2013-14. The distributionof AAY wheat ranged from 92 to 100 per cent and that of rice ranged from 87to 100 per cent.
Under NFSA 2013, the beneficiaries were provided 92 per cent wheat and 91per cent rice against the allotment during the month March 2014.
MPSCSC did not furnish the reasons for shortfalls in distribution of wheat andrice.
In the exit conference, the Principal Secretary attributed less distribution inAPL scheme to non-reaching of consumers because of less difference in themarket price and consumer price.
The reply to short distribution of foodgrains to APL cardholders was nottenable as diversion of APL wheat to BPL cardholders was made atDirectorate level and less quantity of wheat allotted to APL cardholders.
Efforts should be made to lift the entire quantity of PDS commodities allottedto ensure adequate food security to poor.
2.2.8.3 Selling of wheat at lower rates to lead societies for distribution
Under PDS, MPSCSC sold the commodities except kerosene to lead/linksocieties at the rate fixed by Government and these societies sold thecommodities to FPS at the sales price fixed for them.
As per the cost sheet15 approved (August 2010) by State Government, theselling price of adhoc/additional wheat to the lead societies was ` 930 perquintal for urban areas and ` 921 per quintal for rural areas. The rates wererevised in October 2010 to ` 963 and ` 957 respectively. However, it wasclarified (October 2010) that if the wheat had been distributed at old rates, thedifference in rate should be recovered from the concerned lead societies.
We observed that against allotment of 87,902 MT in the test checked districts,MPSCSC sold 51,479 MT of wheat (urban 24,442 MT and rural 27,037 MT)at old rates instead of revised rates to the lead societies. The selling at lowerrates resulted in loss of ` 1.78 crore (Appendix 2.16).In the exit conference, the Principal Secretary stated that instructions formaking recovery from lead societies had been issued to district offices.
2.2.8.4 PDS commodities remained undistributed in FPS
MP PDS (Control) Order, 2009 provides that the DSOs/DSCs should suballocate the commodities to FPS after deducting the balance quantity ofprevious month remaining with the FPS. But the DSOs/DSCs allocated thefoodgrains without taking into account the closing stock of previous monthwith the FPS. Scrutiny of monthly reports on allocation and distribution byFPS (M1) in test checked districts revealed that there were 3,693 Kilo Litre(KL.) kerosene and 20,971 MT foodgrains/sugar and salt worth ` 10.56 crorewere lying undistributed at FPSs as on 31 March 2014 in nine test checkeddistricts (Appendix 2.17). These included 1,575 MT APL foodgrains, whichwas not distributed due to launching of NFSA 2013.
15 Statement showing the sales rate fixed for lead societies and consumer.
Selling of wheatat lower rate tothe lead societiesresulted in loss of` 1.78 crore
Large quantity ofPDS commoditiesremainingundistributedwith FPS maylead to illegaldiversion
Chapter 2: Performance Audit
37
Large quantity of stock of PDS commodities remaining un-distributed at FPSlevel may lead to illegal diversion of subsidised commodities.
In the exit conference, the Principal Secretary stated that the undistributedAPL stock 4,181.7 MT had been allocated to Jails for prisoners at APL ratesand allocation of foodgrains at present was being made from Directorate levelafter adjusting the quantity lying in FPSs.
2.2.8.5 Acceptance of damaged/inferior quality of rice for PDS
The quality of rice as specified by GOI was to be ensured before distributionin PDS. Test check of records of DM, MPSCSC, Khandwa revealed that49,756 bags (24,224.84 quintal) of rice was received in Central WarehousingCorporation (CWC), Khandwa in February 2013 from Jabalpur District as perthe rake movement plan (through goods train). The Manager CWC reported(February 2013) DM Khandwa that 250 bags of rice received were wateraffected, damaged stock and 215 bags were mixed with coal, cement and dustand not fit for human consumption since, the rice bags were loaded withoutcleaning the wagon and without putting polythene on the floor. DistrictManager, Khandwa also reported (February 2013) DM Jabalpur regardingreceipt of inferior quality of rice and accepted 465 bags (229.80 quintal) ofrice valued ` 4.24 lakh.
Similarly, 161 bags (70.78 quintal) of rice valued ` 1.38 lakh received inCWC Khandwa in December 2013 through rake movement were foundcement mixed. The District Manager, Khandwa stated (May 2014) thatdisposal of inferior quality rice was under process at Headquarter level.
In the exit conference, the Principal Secretary stated that audit would beintimated after taking necessary action.
2.2.8.6 Non-delivery of sugar by sugar factories
Scrutiny of records of allotment and lifting of sugar revealed that the GoIinstructed (April to June 2012) five sugar factories in MP for supplying3,936.6 MT for the period June to August 2012 under PDS. Due to shortsupply of levy sugar of 2,746.40 MT, both GoI and State Government issued(January and June 2013) instructions to seize the sugar and take action as perprovisions contained in Essential Commodities (EC) Act, 1955. As of August2014 four factories did not supply 2,398.40 MT sugar.
Similarly, based on MPSCSC report (April 2013) regarding short supply of23,114.40 MT of sugar by 12 sugar factories, GoI issued instructions (April2013) to seize the stock of concerned sugar factories. As of August 2014, shortsupply of sugar was 12,000.62 MT by four factories of MP (328.90 MT) andeight factories of Maharashtra (11,671.72 MT).
There were no records to show that the districts authorities had taken anyaction for seizure of sugar.
Non-delivery of sugar by the sugar factories affected distribution of sugar tothe poor.
In the exit conference, the Principal Secretary stated that action taken againstnon-delivery of sugar by the concerned sugar factories would be intimated toAudit after getting information from District Collectors.
Action againstdefaulter sugarfactories for notdelivering 14,399MT sugar was notinitiated during2012-14
Audit Report on General and Social (Non-PSUs) Sectors for the year ended 31 March 2014
38
2.2.8.7 Distribution of Kerosene oil
Entitlement of kerosene under PDS was five litres for the BPL cardholders andfour litres for APL cardholders per month, if they do not have any LiquefiedPetroleum Gas (LPG) connection. The cardholders having LPG double bottleconnection (DBC) were not eligible for supply of kerosene under PDS and thecardholders having single bottle connection (SBC) would receive half of theentitlement. Further, as per Government instructions issued to the DistrictCollectors, the ration cards were to be stamped as DBC or SBC to preventdistribution of kerosene to ineligible cardholders.
We observed that there were 35.01 lakh DBCs and 35.03 lakh SBCs as ofMarch 2014. However, information about cardholders having one or two LPGcylinders and about stamped or unstamped ration cards was not available inthe Directorate. Out of 14 test-checked districts, six16 had the informationabout total gas connections. Only Khargone District had the information ofstamped/unstamped cardholders. However, all the DSOs/DSCs allotted thekerosene without ascertaining the actual entitlement of the cardholders. As aresult, distribution of kerosene to DBC cardholders and to the singleconnection holders in excess of their entitlement can not be ruled out.
In the exit conference, the Principal Secretary stated that the data of LPGconnection holders had been obtained from oil companies and distribution ofkerosene according to the entitlement of households would be ensured.
The Government needs to expedite stamping of LPG connection details in theration cards to eliminate supply of kerosene to ineligible cardholders.
2.2.8.8 Distribution of salt under PDS without ensuring iodine contents
The Commissioner (FC&CP) issued (November 2006) instructions fordistribution of salt at ` 1 per kg per month to each category of cardholder in89 tribal blocks. In May 2013, the Department decided to distribute salt in alldistricts except APL cardholders. Against allotment of 2.10 lakh MT salt, 1.68lakh MT (80 per cent) was distributed during 2009-14. In the test checkeddistricts, 0.66 lakh MT salt out of 0.74 lakh MT was distributed during2009-14.
MPSCSC issued (February 2008) instructions to conduct regular test of iodinecontents in the salt distributed to cardholders to ensure 30 ppm contents in saltas prescribed in Prevention of Food Adulteration Act 1954 (PFA Act) byrandom sampling through analysis kit. The random samples were also to betaken jointly by the District Manager and representative of Food Controllerand sent to Controller Food & Drugs twice in a month. The report of analysiswas to be sent to MPSCSC Headquarters. We noticed in 13 test checkeddistricts that no sample of salt was taken and sent to laboratory for analysis.This indicated that the salt supplied by the supplier was distributed in PDSwithout ensuring the iodine contents.
In the exit conference, the Principal Secretary attributed the shortfall to non-purchase by APL beneficiaries. He stated that quality testing kits would beprovided and instructions would be issued to districts for ensuring quality.
16 Dhar, Khandwa, Khargone, Satna, Sidhi and Ujjain.
Distribution ofkerosene wasnot restrictedto cardholderspossessingtwo/one LPGcylinder
In the testcheckeddistricts, saltwas distributedwithoutensuringprescribediodine contents
Chapter 2: Performance Audit
39
2.2.9 Working of Lead Societies and Fair Price Shops
All the lead societies and FPSs are run by the Co-operative societies which areregistered under MP Co-operative Societies Act, 1960. The running of FPS isto be regulated by procedures laid down in MP PDS (Control) Order, 2009.There should be one fair price shop in every Gram Panchayat (GP) providedthat a second FPS may be opened where the cardholders do not have FPSwithin three kilometres and there are at least 200 cardholders. In the urbanarea there should be one FPS for every 5,000 population.
The allotment of FPS is done by SDO (Revenue) at block level and by DSO atdistrict Headquarter. The allocation of foodgrains made to FPS should beverified by two members of FPS level Vigilance Committee and monthlyreporting on allocation and distribution was to be sent to lead societies by FPSby seventh of ensuing month.
As of March 2014, there were 4124 FPSs in urban areas for 2.01 crore urbanpopulation, (40.13 lakh househholds) and 18,041 FPSs in rural areas for23,006 Gram Panchayats having 1.11 crore households.
We observed that in the test-checked districts, there were shortages of 982FPSs in rural areas and 295 FPSs in urban areas. District-wise details are givenin Appendix 2.18. In 168 FPSs and 54 lead/link societies test checked, weobserved instances of non-compliance with the terms and conditionsprescribed in MP PDS (Control) Order 2009 as shown in Appendix 2.19 and2.20. Important observations are as under:
Physical verification of PDS commodities received were not conductedby members of Vigilance Committees in 146 FPSs.
133 FPSs did not maintain the cash book during the period 2009-14.
None of the FPSs displayed sealed sample of foodgrains to be sold inthe FPSs.
Fifty five FPSs salesman intimated that they opened the shop less thansix days in a week.
In the exit conference, the Principal Secretary stated that FPSs could not beoperated in each Panchayat as the Panchayats having less number ofhouseholds were not able to operate the FPS due to economic viability anddeficiencies would be eliminated after implementing door delivery system inthe entire State.
2.2.9.1 Non-recoupment of losses to lead societies and FPS
Co-operative Department, GOMP fixed (September 2000) the rates forcompensation to the lead societies and FPS for the losses incurred in operationof PDS. The recoupment amount fixed for FPS was ` 6,500 per FPS per yearand for lead societies it was ` 1.00 lakh or one per cent of their businesstransaction whichever is less. Scrutiny of records of Commissioner (FC&CP)revealed that losses amounting to ` 8.51 crore for the period 2006-13 were notrecouped to 220 lead societies (` 2.13 crore) in 29 districts and 10,102 FPSs(` 6.38 crore) in 30 districts, though ` 15 crore was provided for this purposeduring 2013-14.
There wereshortages of982 FPSs inrural areas and295 FPSs inurban areas intest-checkeddistricts
Non-recoupment oflosses amounting to` 8.51 crore to leadsocieties and fairprice shops
Audit Report on General and Social (Non-PSUs) Sectors for the year ended 31 March 2014
40
The Commissioner (FC&CP) attributed (May 2014) non-payment torestriction on drawals made by Finance Department.
2.2.10 Monitoring and Vigilance mechanism
2.2.10.1 Operation of Global Positioning System17 (GPS) in vehiclestransporting PDS commodities
The State Government made amendment (January 2012) in PDS (Control)Order, 2009 and directed (February 2012) District Collectors andMD,MPSCSC to install GPS instrument in all the vehicles engaged intransporting PDS commodities within six months. Further, in response to aPIL submitted by an organisation the Government submitted an affidavit inMarch 2013 before Hon`ble Supreme Court of India that the work oninstallation of GPS system was in progress.
Scrutiny of records of Commissioner (FC&CP) revealed that the software forGPS based vehicle tracking system was to be developed by Madhya PradeshState Electronics Development Corporation Limited (MPSEDC) formonitoring of the GPS equipment installed by the vehicle owners at districtlevel. The Commissioner paid ` 1.22 crore to MPSEDC between October2012 to March 2013. However, the Commissioner stated (August 2014) that inthe minutes of meeting held on 23 May 2014 with the Chief Minister, it wasdecided not to adopt the GPS system in the PDS.
Thus, the objective of monitoring leakage and diversion of PDS commoditiesduring transportation, through GPS, could not be fulfilled. The admissionmade to the Hon’ble Supreme Court through affidavit was not also adhered to.
2.2.10.2 Inspection of distribution agencies
As per clause eight of MP PDS (Control) Order, 2009, the Collector of theDistrict was to prepare rosters for inspection of fair price shops by executiveofficers of Food, Co-operative and Revenue Departments at least once inevery three months and inspection of the lead societies at least twice in amonth. The Collector should review the lifting and supply of PDScommodities to the FPS once in a month.
In the test checked districts, we observed that the rosters for inspecting theFPS and lead societies were prepared only in six18 districts and one district(Khargone) respectively. Further, the monthly review was conducted by theCollector only in five19 test checked districts. The reports of reviewsconducted were also not maintained. However, the Directorate had noinformation about the inspection conducted in the districts.
Further, we observed that there were shortfalls in inspection of the districtoffices by the officers of MPSCSC Headquarters ranging from 25 per cent to70 per cent compared to the roster/norms fixed during the years 2009-10 to2013-14. The inspections actually conducted by the District Managers werenot ascertained by MPSCSC since the monthly reports of inspection conducted
17 A radio-wave based navigation system that allows land, sea and airborne users todetermine their exact location, velocity and time 24 hours a day, in all weatherconditions, anywhere in the world.
18 Dhar, Khandwa, Khargone, Raisen , Ratlam and Satna.19 Khandwa, Rewa, Satna, Sidhi and Ujjain.
Chapter 2: Performance Audit
41
by District Managers were not sent regularly to MPSCSC Headquarters. Thisindicates lack of control over the PDS activities carried out by the districtsofficials. The MD, MPSCSC stated that there was shortage of staff inHeadquarters.
Further, misappropriation/shortage in store of PDS commodities i.e. wheat,rice and kerosene etc. were noticed during inspection of FPSs conducted bythe departmental authorities. The prescribed records i.e. stock register, salesregister were not available during inspection. The details are shown inAppendix 2.21.
In the exit conference, the Principal Secretary stated that inspection andmonitoring of FPSs would be strengthened by establishing grievance redressalmechanism and by inspection through officers.
The Department should strengthen the inspection mechanism over thefunctioning of FPSs to prevent distribution of commodities to ineligiblepersons and diversion of foodgrains if any.
2.2.10.3 Holding of Vigilance committee meetings
In February 2004, State Government issued instructions for formation andholding meetings of the Vigilance Committees (VC)20 at different levels. Itwas directed to hold weekly meeting at district level and monthly meeting atblock and FPS level.
We observed that the State level VC was formed in May 2009 and only twomeetings were held during 2009-14 against four meetings due each year.Vigilance Committees were not constituted in 301 FPSs (out of 7,259) and themeetings were not held regularly as shown in Appendix 2.22. The shortfalls inmeeting were 47 per cent at FPS level, 48 per cent at block level and 58per cent at district level. It was also observed that information relating to VCwas not sent to GoI during the review period due to non-submission of reportsby district authorities.
The Directorate issued (March and October 2009) instructions for sendingmonthly reports through online software developed for this purpose. Weobserved that the reports submitted by the DSOs/DSCs were not compiled atCommissioner (FC&CP) level. The Commissioner stated (August 2014) thatthe reports received from districts would be compiled in future. He also statedthat monitoring was done through video conferencing with districts officials.
Thus, monitoring and VC at all levels were ineffective and supervision/inspection over functioning of PDS was lax.
In the exit conference, the Principal Secretary stated that regular meeting ofVC would be ensured after formation new VC under NFSA 2013.
The Department should review the performance of vigilance committees at alllevels in monitoring the distribution of foodgrains.
20 Consisting of Chairman, Member Secretary and other members at block level anddistrict level, Chairman, Co-ordinator and other members at FPS level.
There was shortfall inconstitution ofVigilance Committeesat FPSs level andrequired number ofmeetings were notheld at all levels
Audit Report on General and Social (Non-PSUs) Sectors for the year ended 31 March 2014
42
2.2.11 Conclusion
Number of BPL and AAY ration cards issued were more than thenumber of such families, indicating issue of bogus cards. Though theDepartment detected and eliminated 1.07 lakh bogus ration cards during 2009-14, the initiatives were not effective since reconciliation of BPL/AAY rationcards with BPL survey list and total ration card holders with householdsprojected in population census 2011 was not done.
Computerisation of TPDS was not completed within the timeline fixedby GoI and funds provided for this purpose remained unutilised.
The Department did not distribute 12.44 lakh MT wheat and 1.61 lakhMT rice during the period 2009-14. APL quota wheat of 6.84 lakh MT wasdiverted for BPL card holders causing additional financial burden. Largequantity of PDS commodities remaining undistributed with FPS may lead toillegal diversion.
There were shortages of 982 FPSs in rural areas and 295 FPSs in urbanareas in test checked districts.
There was shortfall in conduct of monthly review of lifting and supplyof PDS commodities to FPSs by the Collectors. The Vigilance committeemeetings for review of allotment, distribution of foodgrains were not heldregularly.
Chapter 2: Performance Audit
43
Panchayat and Rural Development Department
2.3 Implementation of Total Sanitation Campaign/Nirmal BharatAbhiyan
Executive Summary
Government of India (GoI) introduced the Central Rural SanitationProgramme (CRSP) in 1986 with the objective of improving the quality oflife of the rural people through proper sanitation facilities and to provideprivacy and dignity to women. GoI modified CRSP in 1999 and renamed theprogramme as Total Sanitation Campaign (TSC). TSC was again renamed asNirmal Bharat Abhiyan (NBA) with effect from 01 April 2012. NBAenvisages covering the entire community for saturated outcome with a viewto create Nirmal Gram Panchayats.
There were significant delays up to 81 days in release of State shareby State Water and Sanitation Mission to the District Water and SanitationMissions. TSC funds were not transferred to NBA funds and were lying idlein bank accounts of Janpad Panchayats.
(Paragraphs 2.3.6.2 and 2.3.6.3)
Annual Implementation Plans were prepared without followingbottom up approach and community saturation approach. Holding ofmeetings of the State level and district level Missions was not adequate.
(Paragraph 2.3.7.2)
Number of GPs targeted for saturation and making ODF were notcommensurate with achieving the vision of Nirmal Bharat by 2022. Only 13per cent of the GPs targeted for saturation were completed during 2012-14.
(Paragraph 2.3.8.3)
Targets under various components of the scheme were not achieved.During the years 2009-10 to 2013-14 there was significant shortfall inachieving the targets of construction of Individual Household Latrines (11 to69 per cent) and Community Sanitary Complexes (66 to 90 per cent).
(Paragraph 2.3.8.1)
Information Education and Communication activities did not continuethroughout the year and no funds were provided to GPs for IEC activities.
(Paragraph 2.3.9.1)
Swachhta Diwas and Gram Swachhata Sabha were not convened inthe test checked GPs, impacting the social audit of the Scheme.
(Paragraphs 2.3.10.2 and 2.3.10.3)
2.3.1 Introduction
Government of India (GoI) introduced the Central Rural SanitationProgramme (CRSP) in 1986 with the objective of improving the quality of lifeof the rural people through proper sanitation facilities and to provide privacy
Audit Report on General and Social (Non-PSUs) Sectors for the year ended 31 March 2014
44
and dignity to women. GoI modified CRSP in 1999 and renamed theProgramme as Total Sanitation Campaign (TSC). The Programme was againrenamed as Nirmal Bharat Abhiyan (NBA) with effect from 01 April 2012
Meanwhile, Nirmal Gram Puraskar (NGP) was launched in October 2003 togive a fillip to TSC. The award was given to those Nirmal Gram Panchayats,blocks, and districts which had become fully sanitised and open defecationfree (ODF).
The objective of TSC/NBA is to bring out an improvement in the generalquality of life in rural areas by accelerating sanitation coverage to achieve thetarget of attaining Nirmal status for all Gram Panchayats (GPs) by 2022.
The components of TSC/NBA are Information, Education andCommunication (IEC), startup activities and capacity building, construction ofIndividual Household Latrines (IHHLs), community sanitary complexes,institutional toilets including schools, anganwadi sanitation and solid andliquid waste management (SLWM).
2.3.2 Organisational set-up
For implementation of TSC/NBA, State Water & Sanitation Mission (SWSM),a registered society was constituted in 2005. The Apex Committee of SWSMis headed by Minister-in-charge of Panchayat and Rural DevelopmentDepartment (PRDD) and the Development Commissioner is the MemberSecretary. The Executive Committee is headed by the Principal Secretary,PRDD. The State Programme Officer (SPO), NBA has the overallresponsibility of implementation of TSC. Besides, there are District Water andSanitation Missions (DWSMs) at district level, Block Water and SanitationCommittees (BWSCs) at block level and Village Water and SanitationCommittees (VWSCs) at village level for implementation of the Scheme.
In these Committees, State Programme Officer (SPO) at State level, DistrictCoordinator at district level, Block Coordinator at block level and Secretariesof the Gram Panchayats (GPs) at GP level are responsible for implementingthe Scheme.
2.3.3 Audit objectives
The audit objectives were to examine whether:
planning for implementation of the Scheme at different levels wasadequate and effective;
funds were released, accounted for and utilised by the StateGovernment in compliance with the guidelines issued under theScheme;
the targets set under various components of the Scheme were sufficientto achieve Scheme objectives;
IEC strategy under the Scheme was effective in generation of demandof TSC/NBA services through community mobilisation; and
the mechanism for monitoring was in place and evaluation of theoutcomes of the programme was done.
Chapter 2: Performance Audit
45
2.3.4 Audit criteria
Following were the sources for the criteria adopted for the performance audit:
TSC guidelines, IEC guidelines, NBA Guidelines and Nirmal GramPuraskar guidelines issued by GoI.
Instructions issued by Central and State Governments relating toimplementation of the TSC/NBA.
2.3.5 Scope and methodology of audit
The implementation of TSC/NBA for the period 2009-14 was reviewed (Juneto August 2014) through a test check of records of 131 out of 51 districts asdetailed in Appendix 2.23. We conducted audit at the following levels:
State level State Water and Sanitation Mission (SWSM)District level 13 District Water and Sanitation Missions (DWSMs)Block level 27 Block Resource Centres/Janpad Panchayats (JPs)Village level 231 Gram Panchayats/Village Water and Sanitation Committees
An entry conference was held on 2 June 2014 with the Additional ChiefSecretary (ACS), Panchayat and Rural Development Department (PRDD) todiscuss the audit objectives, criteria and scope of audit. The audit findingswere discussed with the Government in an exit conference held on 5November 2014, views of the Government have been incorporated suitably inthe review.
Audit findings
2.3.6 Financial Management
The TSC/NBA Scheme fund consists of component-wise Central share, Stateshare and contribution of Households/Panchayat (in case of IHHLs andCommunity Sanitary Complexes). Interest accrued on TSC/NBA fund wasalso to be a part of the Scheme fund.
2.3.6.1 Utilisation of available funds by DWSMs
During the years 2009-10 to 2013-14, the funds released by SWSM toDWSMs, expenditure incurred by DWSMs and unspent balances withDWSMs is given in Table 1.
Table 1: Details of TSC/NBA fund flow in the State(` in crore)
Audit Report on General and Social (Non-PSUs) Sectors for the year ended 31 March 2014
46
It could be seen from the above table that during the years 2009-10 to 2013-14, the expenditure out of total funds available with DWSMs ranged between44 per cent and 64 per cent and ` 84.19 crore to ` 472.96 crore remainedunspent at the year-end in bank accounts of DWSMs. Under-utilisation offunds led to slow progress under various components of the Scheme. Weobserved significant shortfalls in achievement of targets in construction ofIHHLs and community sanitary complexes, as discussed in para 2.3.8.1.
In the exit conference, Government stated that since the funds were received atthe end of financial year, same could not be utilised in that financial year. Thisprogramme relates to change in human behavior; hence, progress was slow.
Optimum utilisation of funds for implementation of the Scheme should beensured.
2.3.6.2 Delay in release of funds by SWSM
As per TSC/NBA guidelines, the State was required to release Central grantreceived along with State share to DWSMs within 15 days of receipt of theCentral grants.
We observed that there were delays ranging from 6 days to 81 days in releaseof State share to DWSMs during the period 2009-14; the details are given inAppendix 2.24.
Delays in release of funds to implementing agencies resulted in slow progressin implementation of the Scheme.
In the exit conference, Government admitted that there were delays in releaseof State funds due to delay in approval from Finance Department and non-availability of funds in the State Budget.
2.3.6.3 Scheme funds lying idle at Janpad Panchayats (JPs)
As per funding norms under TSC, DWSMs released the funds to JPs, which inturn, released the same to the GPs for implementation of the Scheme. TSCwas renamed as NBA from April 2012. As per funding arrangements underNBA, DWSMs were required to transfer the funds received from SWSMdirectly to the GPs.
After inception of NBA, the funds lying with the JPs were required to besurrendered to the DWSMs for its release to the GPs under NBA.
We observed that out of 27 test checked JPs, unspent amount of ` 6.58 crorepertaining to TSC in respect of 22 JPs were lying idle in the bank accounts ofJPs as of March 2014. Thus, Scheme funds remained blocked for more thantwo years. The details are given in Appendix 2.25.
In the exit conference, Government stated that funds lying at JPs would berefunded to DWSMs for its release to GPs as per revised funding norms ofNBA.
2.3.6.4 Keeping scheme funds as fixed deposits
As per para 13.2.2 of NBA guidelines, DWSMs were required to transfer thefunds for works directly to the GPs within 15 days of receipt of funds fromSWSM. The funds were to be utilised for construction of sanitation facilitiesand were not to be kept blocked by keeping it as fixed deposits.
There were delaysranging from 6 daysto 81 days in releaseof State share toDWSMs
During the years2009-10 to 2013-14;significant amount ofTSC/NBA fundsremained unspent
During scrutiny of records of JP Badnagar of District Ujjain and JP Balaghatof District Balaghat, we found that ` 81.50 lakh2 was kept as fixed deposit(August 2014).
In the exit conference, Government stated that funds lying at JPs would bereturned to DWSMs for its release to GPs as per revised funding norms ofNBA. If any district/block was keeping NBA fund as FDR, necessary actionwould be taken accordingly.
Funds lying at Janpad Panchayats should be refunded to DWSMs for itsrelease to Gram Panchayats as per revised funding norms of NBA.
2.3.6.5 Non-accountal of interest on TSC/NBA funds at block level
The TSC and NBA guidelines stipulate that the interest accrued on NBA fundswould be treated as a part of NBA resources. DWSMs were to submitutilisation certificate of interest accrued on NBA funds while submittingclaim(s) for subsequent instalment. This amount should include interest earnedat JP level and the total amount was to be reflected in Utilisation Certificates(UCs).
We observed that during 2009-10 to 2012-13, ` 74.17 lakh of interest earnedon TSC/NBA funds at 23 test checked JPs was not accounted for. Thus, theUCs submitted by DWSMs to SWSM did not reflect the amount of interestaccrued on TSC/NBA funds at JP level. The details are given inAppendix 2.26.
In the exit conference, Government stated that the interest accrued onTSC/NBA funds at block level would be taken into account of DWSM.
2.3.6.6 Non-recovery of loan given to Rural Sanitary Marts
As per para 5.5.1 of NBA guidelines, the Rural Sanitary Mart (RSM) was anoutlet dealing with the material, hardware and designs required for theconstruction of sanitary latrines, soakage and compost pits, vermi-compostingetc. The main aim of having a RSM was to provide material, services andguidance needed for constructing different types of latrines and other sanitaryfacilities for a clean environment.
An interest free loan up to ` 3.50 lakh could be given for establishing a RSMout of revolving fund available with the district. The loan was to be recoveredin 12-18 instalments after one year from the date of payment of the loan.
During test check of records of DWSMs of Anuppur, Dewas, Sagar andShahdol, we found that ` 16.50 lakh was given to Self Help Groups (SHGs) asloan for setting up 16 RSMs. Out of these RSMs, only one RSM (Shakti SHG,Tonkkhurd, District Dewas) was functional (August 2014) and only twoRSMs made repayment of ` 2.25 lakh after a lapse of nine years from the dateof sanction of the loan. The remaining ` 14.25 lakh was outstanding forrecovery (August 2014). The details are given in Appendix 2.27.
Since RSMs were non-functional and were not able to provide material,services and guidance needed for constructing different types of latrines and
2 JP Balaghat of district Balaghat deposited ` 70 lakh on 31.03.14 and JP Badnagar ofdistrict Ujjain deposited ` 10 lakh on 14.03.14 and ` 1.5 lakh on 30.03.13.
The interest earnedon TSC/NBA fundsat the JanpadPanchayats was notaccounted for
Loan of ` 14.25lakh given forsetting up of RSMswas outstanding forrecovery (August2014)
` 81.50 lakh ofscheme funds waskept as fixeddeposit by two testchecked JPs
Audit Report on General and Social (Non-PSUs) Sectors for the year ended 31 March 2014
48
other sanitary facilities, the expenditure incurred on setting up of RSMsremained unfruitful.
In the exit conference, Government stated that necessary action for recovery ofloans given for the establishment of RSMs would be taken.
2.3.6.7 Inflated reporting of expenditure in Utilisation Certificate
During scrutiny of records of DWSM Shahdol, we noticed that an amount of` 2.00 crore was transferred to DWSM Gwalior in 2010-11 as advance. Theamount was returned in May 2014. However, DWSM Shahdol showed it asfinal expenditure in the annual accounts of the year 2010-11. We furthernoticed that DWSM Gwalior showed the funds received from Shahdol Districtas GoI share (inter-district transfer) and also showed the same as expenditureagainst it in the UCs for the year 2010-11 sent to the Government.
Thus, the UCs for the year 2010-11 sent to the Government was inflated to theextent of ` 2.00 crore.
In the exit conference, Government accepted the observation and stated that infuture inter-district transfer of funds would be shown as advance/loan in theUCs.
2.3.6.8 Unfruitful expenditure on installation of Force Lift Pumps in schooltoilets
As per TSC/ NBA guidelines, the unit cost of construction of school toiletunder NBA was ` 35,000. As per orders of PRDD, Government of MadhyaPradesh (February 2011), the unit cost of construction of school toilet wasdecided as ` 27,000. The remaining ` 8,000 was to be used for installation ofForce Lift Pump (FLP) in school toilets for availability of running water.
During scrutiny of records of DWSM and 23 test checked GPs of ShahdolDistrict, we observed that 43 FLPs installed in 43 school toilets in these GPswere non-functional due to which an expenditure of ` 2.91 lakh incurred onthese FLPs remained unfruitful.
In the exit conference, Government stated that instructions would be issued to theSchool Education Department for proper operation and maintenance (O&M)and safety of FLPs.
The reply was not justifiable as due to non-functioning of the FLPs,availability of running water in these school toilets could not be ensured.
2.3.7 Planning
2.3.7.1 Revision of Project Implementation Plan
The Project Implementation Plan (PIP) is a long term plan for implementationof the Scheme. As per TSC/NBA guidelines, each project officer at districtwas required to revise the PIP and prepare a revised project proposal afterchange in the funding norms. The proposal should originate from the GPs,compiled at block level and then at district level by DWSM.
During the period 2009-14, the funding norms for providing incentive toIHHL beneficiaries were changed three times3. We observed that except for
3 2008-09, 2011-12 and 2012-13.
Chapter 2: Performance Audit
49
district Chhindwara where PIP was revised four times, remaining 12 testchecked districts did not revise the PIPs after change in funding norms.District Khandwa revised the PIP two times and eight4 districts revised the PIPonly once during the period 2009-14. In the remaining three districts norevision was made. The details are given in Appendix 2.28.
Due to non-revision of the PIPs, the targets set in PIPs were not commensuratewith attainment of Nirmal status by each GP in a time bound manner.
In the exit conference, Government stated that Ministry of Drinking Water andSanitation, GoI, revised the PIPs and the State wise project cost, whenevernorms were changed and accordingly, PIPs were auto updated.
Reply was not in order. The Scheme guidelines envisaged that the revisions inthe PIPs were to be originated from the GPs and routed through DWSM,SWSM and further to be ratified by GoI. Thus, there were no provisions forauto updating of PIPs by GoI.
The PIPs should be revised after change in funding norms so that actualrequirement of sanitation facilities in rural areas may be reflected in the PIPs.
2.3.7.2 Preparation of Annual Implementation Plan by SWSM andDWSMs
As per TSC/NBA guidelines, SWSM was required to prepare the AnnualImplementation Plan (AIP) for each district as per the progress made by thedistricts, ensure convergence mechanism between line departments, receiveCentral grant for specific project district and disburse the funds to theDWSMs. In the meetings, SWSM was required to review the implementationof the Scheme during previous year and plan for current/coming year.
The TSC/NBA guidelines stipulated that AIP was to be prepared afteridentification of GPs to be saturated for attaining the project objectives. TheseGP plans should be consolidated into Block Implementation Plan and furtherinto District Implementation Plan. The SWSM would consolidate the DistrictImplementation Plans for preparation of the State Implementation Plan. Forthis purpose, SWSM was required to meet at least once in six months.
The guidelines of TSC/NBA stipulate that the DWSM should plan andimplement the district project. It should review and monitor programmeimplementation so that the targets of the district annual action plan can beachieved leading to Nirmal GPs. The DWSM was required to meet at leastonce in every quarter. During the meeting, evaluation of performance ofprevious year and planning for next year was also to be done.
We observed that AIPs were prepared only at district level withoutpreparation of annual plans at block and GP levels.
The community saturation approach by identification of GPs that couldbe made Nirmal during the year/in the coming years was not adopted asdiscussed in para 2.3.8.3.
4 Anuppur, Dewas, Dhar, Ratlam, Sagar, Satna, Shahdol and Ujjain.
Bottom upapproach andcommunitysaturationapproach was notadopted forpreparation ofAIPs
The PIPs were notrevised afterchange in fundingnorms
Audit Report on General and Social (Non-PSUs) Sectors for the year ended 31 March 2014
50
Only four 5 meetings of SWSM were held against the required 10meetings during the period 2009-14. No meetings were held during the years2011-12 and 2013-14. This was indicative of lack of planning and monitoringof the Scheme at State level.
Prescribed number of meetings of the DWSMs was not held during theperiod 2009-14. In Anuppur, Balaghat and Ratlam Districts, only one meetingeach of the DWSM was held in 2010-11 and in Dhar District, the meetings ofDWSM were held only twice during 2011-12. Details are given inAppendix 2.29.
In the exit conference, the ACS admitted that bottom up approach was adoptedonly from 2014-15. Regarding conduct of meetings, the ACS stated thatreview meetings were conducted quarterly. However, the ACS stated thatconducting regular meetings of SWSM and DWSMs would be ensured.
AIPs should be prepared by following bottom up approach and by adoptingcommunity saturation approach so as to achieve the vision of Nirmal Bharatby 2022.
2.3.8 Programme implementation
2.3.8.1 Targets and achievement
The objectives of NBA were to bring about an improvement in the generalquality of life in the rural areas and to accelerate sanitation coverage in ruralareas so as to achieve the vision of Nirmal Bharat by 2022, with all GPs in thecountry attaining Nirmal status. For achieving the above objective,construction of Individual Household Latrines (IHHLs), Community SanitaryComplexes and school toilets were to be carried out.
We observed that the annual targets set in the AIPs under various componentsof the Scheme were not fully achieved as discussed below:
(a) Construction of IHHLs
As per the Scheme guidelines, a duly completed household sanitary latrineshall comprise of a basic low cost unit with a super structure. Incentive isprovided on completion and use of toilets.
During the period 2009-14, the shortfalls in achievement of targets forconstruction of IHHLs for BPL and APL families were as under:
Table 2: Shortfalls in achievement of targets of Individual Latrines
Year Shortfalls in IHHL for BPL families Shortfalls in IHHL for APL familiesTargets Shortfall Percentage Targets Shortfall Percentage
(Source: Annual Performance Reports of SWSM (2009-14))
It could be seen from the above that percentage of shortfalls against the targetsfor construction of IHHLs for BPL families ranged between 11 and 69 percent and that for APL families between 36 and 76 per cent.
5 The meetings were held on 19.05.2009, 06.02.2010, 06.09.2010 and 18.06.2012.
The annualtargets set undervariouscomponents ofthe Scheme werenot fully achievedin the State
Chapter 2: Performance Audit
51
(b) Construction of Community Sanitary Complexes (CSCs)
As per the Scheme guidelines, CSCs comprising an appropriate number oftoilet seats, bathing cubicles, washing platforms, wash basins etc. were to beset up in a place in the village acceptable to women/men/landless families andaccessible to them. Gram Panchayats would be responsible for maintenance ofthe complexes.
During the audit period 2009-14, the shortfalls in achievement of targets forconstruction of CSCs were as under.
Table 3: Shortfalls in achievement of targets of Community Sanitary Complexes
It could be seen from the above that there were shortfalls in communitysanitary complex, which ranged between 66 and 90 per cent.
(c) Construction of school toilets
As per the Scheme guidelines, separate toilets for boys and girls are to beconstructed in all government schools. Number of toilet should be adequate tomeet the requirement of all students of the schools.
The status of shortfalls in construction of school toilets was as under:
Table 4: Shortfalls in achievement of targets of school toilets
Year 2009-10 2010-11 2011-12 2012-13 2013-14Targets 15,128 12,994 12,290 10,644 No targetShortfall 4,333 No shortfall No shortfall 9,611 NilPercentage 29 Nil Nil 90 Nil
Thus, there were shortfalls of 29 per cent and 90 per cent against the targetsfor construction of school toilets in the years 2009-10 and 2012-13respectively. However, there were no shortfalls in achievement of targets ofconstruction of school toilets in 2010-11 and 2011-12.
The details of targets and achievements under various components of theScheme are given in Appendix 2.30.
We further observed that percentage of shortfalls in construction of IHHLsand Community Sanitary Complexes showed increasing trend during theperiod 2011-14. In 2013-14, no targets were set for school toilets by PRDDsince the activity was transferred to School Education Department.
In the exit conference, Government stated that achievement of targets undervarious components would be ensured in future.
Effective steps should be taken to achieve targets particularly for constructionof IHHL and community sanitary complexes.
2.3.8.2 Individual Household Latrines constructed through GPs
As per Para 5.4.1 of the NBA guidelines, construction of IndividualHousehold Latrines (IHHLs) was to be undertaken by the household itself andon completion and use of the toilet, the cash incentive was to be given to thehousehold in recognition of its achievement.
Audit Report on General and Social (Non-PSUs) Sectors for the year ended 31 March 2014
52
As per guidelines of “Maryada Abhiyaan” issued by PRDD, Government ofMadhya Pradesh, the execution of works through contractors was not allowed.
During scrutiny of records of 231 test checked GPs, we found that in 221 GPsof 13 districts, construction of IHHLs was done through GPs instead oftransferring the incentive amount to the beneficiaries.
In the exit conference, Government stated that State has adopted two modes torelease incentive for IHHL i.e. if beneficiary requests only for NBA funds thenincentive would directly be released to the beneficiary after construction oftoilet. In contrary, if beneficiary opts for IHHL through convergence withMGNREGS, then incentive would be released to the GPs for construction oftoilets.
The reply was not in conformity with the guidelines as the beneficiaries wereto purchase the construction material themselves and construct the toilets asper their choice which they were deprived of.
2.3.8.3 Non-achievement of targets of saturation
As per para 2.1 of NBA guidelines, the main objective of NBA was saturationof all Gram Panchayats to achieve the vision of Nirmal Bharat by 2022.
As per the records of SWSM, the number of GPs of the State targeted forsaturation and achievement against the targets during 2012-14 was as under:
Table 5: Details of Gram Panchayats targeted for saturation and achievement
Total 7,615 1,000(Source: Information furnished by SWSM, Bhopal)
It is evident from the above that the number of GPs targeted during the years2012-13 and 2013-14 for saturation and making ODF after inception of NBAwere not commensurate with achieving the vision of Nirmal Bharat by 2022.We observed that only 1,000 GPs (13 per cent) were made Open DefecationFree (ODF) against 7,615 GPs targeted for saturation. Thus, after inception ofNBA only four per cent of total GPs (23,006) could be saturated as of March2014.
With such pace of programme implementation, possibility of achieving thetarget of making the State “Nirmal” by 2022 is remote.
In the exit conference, Government stated that this programme can beaccelerated when there is a behaviour change and demand comes from thecommunity. As this is a slow and difficult process, the progress was also slow.
2.3.8.4 Non-release of second instalment of Nirmal Gram Puraskar andslip back of awarded GPs
As per Nirmal Gram Puraskar (NGP) guidelines 2010, the prize money ofNGP to the selected GP would be released in two equal instalments. The firstinstalment would be released immediately after the GPs were selected for theaward. Random checks were to be carried out by SWSM after six months inall the awardee GPs. If Nirmal Gram and ODF status was found continuing,second instalment would also be released by the DWSM. Otherwise, State
In 221 testchecked GPs,construction ofIHHLs was doneby GPs
Chapter 2: Performance Audit
53
would take necessary measures to revive the Nirmal Gram status of theawardee. NGP award money was to be recovered from persistent defaulters.
The amount of award money ranges from ` 0.50 lakh to five lakh dependingupon the population of the GP. The GPs receiving NGP award were requiredto utilise the award money for maintaining sanitation facilities and sustainingODF status, creation of additional sanitation facilities in the village, Solid andLiquid Waste Management (SLWM) and purchasing land for SLWMpurposes.
During scrutiny of records of SWSM, we observed that during the year 2011-12, total 212 GPs of the State were selected for NGP to whom first instalmentof ` 1.35 crore of NGP was released (May 2012) but second instalment wasnot released to these GPs (September 2014). On an audit query, the SWSMstated that second instalment of award money was not released due to non-receipt of verification report from the DWSMs. It was observed that SWSMalso did not conduct random checks of these GPs for ascertaining Nirmal andODF status maintained by these GPs.
Non-release of entire amount of award money adversely affected the objectiveof maintaining the existing facilities and creation of additional sanitationfacilities suffered.
In the exit conference, Government stated that due to non-receipt of UCs offirst instalment of NGP award money and some gap in number of toilets in theawarded GPs, second instalment was not released.
The reply was not justifiable as SWSM did not ensure conduct of survey ofNGP awarded GPs and timely release of second instalment.
During scrutiny of records of DWSM Shahdol we found that duringthe period January 2008 to December 2011, total 33 GPs were awarded NGP,of which only one GP (Pongri of Sohagpur Block) was released secondinstalment of NGP and an amount of ` 17.50 lakh of second instalment inrespect of remaining 32 GPs was retained by the district (August 2014) due tonon-maintenance of Nirmal status by these GPs. This indicated that theDWSM did not conduct adequate survey to ensure maintaining the “NirmalGram” status of these GPs. Thus, the objective of achieving Nirmal status ofthe GPs was not achieved.
In the exit conference, Government replied that regular survey/ monitoring/evaluation of NGP awarded GPs would be ensured so as to ascertain that theseGPs were maintaining ODF status.
Survey of NGP awarded GPs should be carried out at regular intervals so asto ensure maintenance of Nirmal status by these GPs.
2.3.8.5 Non-implementation of Solid and Liquid Waste Management
As per TSC/NBA guidelines, Solid and Liquid Waste Management (SLWM)is a key component of the Scheme. Under this component, activities likecompost pits, vermin composting, low cost drainage, soakage channels/pits,system for collection, segregation and disposal of household garbage etc. wereto be undertaken. SLWM project was to be prioritised in identified GPstargeted for Nirmal status and GPs, which had already been awarded NGP.
212 GPs selected forNGP were paid onlyfirst instalment butthe secondinstalment of NGPaward money wasnot released
32 NGP awardedGPs in ShahdolDistrict did notmaintain theNirmal status
Audit Report on General and Social (Non-PSUs) Sectors for the year ended 31 March 2014
54
During test check of records of SWSM, we found that no work was done bythe SWSM under SLWM during the period 2009-14, since no GPs wereidentified and no funds were allotted for this purpose.
Due to non-implementation of SLWM, the objective of bringing aboutimprovement in the general quality of life in rural areas was defeated.
In the exit conference, Government stated that under first phase, 31 GPshaving population above 10,000 were identified for implementation of SLWMprojects. Detailed Project Report (DPR) was under preparation through expertagencies and works would be started.
The reply was not in order since no work of SLWM was done during 2009-14.Even the NGP awarded GPs were also not considered for implementation ofSLWM projects.
Solid and Liquid Waste Management should be carried out on priority basis inNGP awarded GPs.
2.3.9 Information Education and Communication (IEC) activities
2.3.9.1 Lack of IEC activities
The IEC activities are intended to trigger the demand and sanitary facilities inthe rural areas for households, schools, anganwadis and community sanitarycomplexes through behavioural change. IEC activity should be continuedthroughout the year and should be conducted at all three tiers i.e. districts,blocks and GPs. The guidelines also stipulate that for effective disseminationof the IEC material, funds should also be provided under IEC component toblocks and GPs for execution of works.
We observed that IEC activities were carried out by DWSM. Separate fundswere not provided to the test checked blocks or the GPs for IEC component.
Analysis of the information obtained through questionnaires from theSecretaries of 231 test-checked GPs revealed the following:
The Secretaries of 218 GPs (94 per cent) stated that IEC activities didnot continue throughout the year.
The Secretaries of all the 231 GPs stated that no funds were providedto GPs for IEC activities.
The Secretaries of 224 GPs (97 per cent) stated that the BlockResource Coordinators (BRCs) were not involved in making strategyfor IEC activities at GP level.
The Secretaries of 225 GPs (97 per cent) stated that IEC personnelswere not imparted training for capacity building.
It is evident from the above that there was lack of IEC activities in the testchecked GPs. As a result, the objective of bringing about behavioural changewas not fully achieved. During joint physical verification, we noticedinstances of toilets being used for storing fuel woods and other material asshown in the photographs below:
The IEC activitiesdid not continuethroughout theyear. The fundswere not providedto GPs for IECactivities
No work was doneunder Solid andLiquid WasteManagementcomponent
Chapter 2: Performance Audit
55
IHHL of Shri Buddilal , GP Barhatola, JP Beohari,Shahdol being used for storing fuel woods.
IHHL of Shri Shivprasad Akali, GP Mau, JPBeohari, Shahdol being used as store room.
The SPO, NBA stated that evaluation of IEC activities to assess the impact onrural population was not done at the State level.
Further, we observed that DWSM, Shahdol spent ` 12.92 lakh of IEC fundsfor printing of VWSC minutes register, monitoring registers, measurementbooks (MBs), forms of evaluation reports and completion certificates.
In the exit conference, Government stated that plan for regular and intensiveIEC, Inter Personnel Communication (IPC), Behavior Change Communication(BCC), training and capacity building activities throughout the year wasprepared and its execution would be ensured. Government also stated thathenceforth, IEC funds would be utilised for IEC activities only as mentionedin new guidelines of Swachha Bharat Mission.
The IEC activities should be continued throughout the year and adequatefunds should be provided to GPs also for IEC activities.
2.3.10 Monitoring and evaluation
2.3.10.1 State Review Mission
As per para 16.1 of NBA guidelines, State Review Mission was to be set up,headed by Joint Secretary level officer of the State Government with at leastthree members from other linked departments and independent representativesfrom reputed organisations in the field of sanitation. The State was alsorequired to set up a panel of experts at State level for conducting reviews intovarious NBA districts periodically.
During test check of records of SWSM, we observed that the State ReviewMission was not constituted and no panel of experts was set up at State level.As such, no periodical review of district projects was conducted to evaluatethe Scheme implementation and take corrective measures.
In the exit conference, Government stated that necessary action would betaken to establish State Review Mission.
2.3.10.2 Swachhata Diwas (Sanitation Day)
As per para 17.2.1 of the NBA guidelines, each GP was required to earmark aparticular day of the month to be named as ‘Swachhata Diwas’ (SanitationDay) with the objectives to record the achievements made in previous month,identifying individuals demanding sanitation facilities, projecting monthlyplan for construction of toilets in the GPs, IEC events, trainings undertaken,
The State ReviewMission was notconstituted andno Panel ofExperts was setup at State level
` 12.92 lakh ofIEC funds werespent for printingworks byDWSM, Shahdol
Audit Report on General and Social (Non-PSUs) Sectors for the year ended 31 March 2014
56
identifying slip back cases under IHHL and verifying expenditure made onvarious activities in the previous month.
Secretaries of all the231 test checked GPs stated that Swachhta Diwas was notorganised during the period 2009-14.
In the exit conference, Government replied that necessary instructions hadbeen issued to the GPs for convening Swachhata Diwas regularly.
2.3.10.3 Conduct of Gram Swachhata Sabha for social audit
As per para 17.3.1 of NBA guidelines, a Gram Sabha was to be convened bythe Secretary, GP as ‘Gram Swachhata Sabha’ (GSS) every six month toreview the progress made under various monthly plans and proceedings ofSwachhata Diwas that were held in the GP. DWSM/District Collector wasresponsible for ensuring that the social audit/review was convened timely asper schedule.
The Secretaries of all the 231 test checked GPs stated that no GSS wasconvened in any of the test checked GPs during the period 2009-14.
Due to non-convening Swachhata Diwas and GSS at the GP level, social auditof the Scheme was not conducted.
In the exit conference, Government stated that necessary instructions had beenissued to the GPs for convening GSS regularly.
Swachhata Diwas and Gram Swachhata Sabha should regularly be convenedby the GPs so as to ensure social audit of the Scheme.
2.3.10.4 Non-existence of mechanism for verifying authenticity of data atState level
As per para 19.1 of NBA guidelines, the Ministry of Drinking Water andSanitation developed an online monitoring system for NBA. The State wasrequired to have a mechanism in place for verifying the authenticity of datauploaded on NBA website.
On being enquired, the SPO, NBA stated that there was no system forverifying authenticity of data and the data of Annual Performance Report(APR) were not cross checked with the data uploaded on NBA website.However, the development of system for authentication of data was underprogress.
In the exit conference, Government stated that output (number of toiletconstructed) and outcome (usage of toilets) based monitoring had been startedat State level from the year 2014-15. In the State, SAMAGRA database wasprepared in which households having toilets were entered. In future, thisdatabase would be bridged to the GoI MIS database.
Due to absence of system of reconciliation of data, the authenticity of datacould not be ascertained.
2.3.11 Conclusion
There were significant delays up to 81 days in release of State share bySWSM to the DWSMs. TSC funds were not transferred to NBA funds andwere lying idle in bank accounts of Janpad Panchayats.
Swachhta Diwaswas notorganised in anyof the testchecked GPs
No GramSwachhataSabha wasconvened inany of the testchecked GPs
There was nosystem ofreconciliation ofdata of AnnualPerformanceReport with thedata uploadedon NBA website
Chapter 2: Performance Audit
57
Annual Implementation Plans were prepared without adopting bottomup approach and community saturation approach.
Number of Gram Panchayats targeted for saturation and making opendefecation free was not commensurate with achieving the vision of NirmalBharat by 2022.
Targets under various components of the Scheme were not achieved.There was significant shortfall in achieving the targets of construction ofIndividual Household Latrines and Community Sanitary Complexes.
Information Education and Communication activities for generatingdemand for sanitary facilities did not continue throughout the year and nofunds were provided to the GPs for IEC activities.
Audit Report on General and Social (Non-PSUs) Sectors for the year ended 31 March 2014
58
Women and Child Development Department,Tribal Development Department and
Scheduled Caste Development Department
2.4 Implementation of Schemes for Welfare and Empowerment ofGirl Child
Executive Summary
For empowerment of girls through self-development and generatingawareness about health and nutrition, the State Government implementedKishori Shakti Yojana (KSY) and Rajiv Gandhi Scheme for Empowermentof Adolescent Girls (SABLA) (in 15 districts). Kanya Saksharta ProtsahanYojana (KSPY) has been implemented for increasing female literacy and tocontinue study up to higher secondary level among SC and ST girlstudents.
Identification of girls under the KSY for providing training andhealth check-up was done without conducting a separate survey. Thus, notarget was set for coverage of girls under KSY. However, the eligibility ofthe selected girls was also not got scrutinised through Gram Sabha. UnderSABLA, survey was conducted for identification of girls.
(Paragraphs 2.4.7.1 and 2.4.8.2)
Vocational training was not imparted to girls under KSY and therewere shortfalls in providing guidance and counseling on nutrition andhealth education, family welfare and life skill education under SABLA.
(Paragraphs 2.4.7.2 and 2.4.8.4)
Health check-up of girls was not done under KSY. Under SABLA,health check-up was not done in 79 AWCs test checked and Iron FolicAcid (IFA) supplementation was not provided in 68 AWCs test checked.Convergence with the schemes/programmes of other departments was alsonot done.
(Paragraphs 2.4.7.3, 2.4.8.6 and 2.4.8.8)
Monitoring and supervision of KSY and SABLA was not adequatesince there was significant shortfalls in required meetings of monitoringcommittees at district and project levels, which affected schemeimplementation.
(Paragraphs 2.4.7.4 and 2.4.8.10)
Under KSPY, assistance was provided to the girl students withoutensuring the eligibility criteria. There were delays up to 18 months indistribution of benefits in eligible cases. The objective of encouraging theSC/ST girls to continue study up to higher secondary level was not fullyachieved. There was no monitoring of the Scheme at any level.
(Paragraphs 2.4.9.2, 2.4.9.3, 2.4.9.5 and 2.4.9.6)
Chapter 2: Performance Audit
59
2.4.1 Introduction
In Madhya Pradesh, female literacy rate was 50 per cent as per Census 2001and 60 per cent as per Census 2011, lower than the National women literacyrate of 65.46 per cent, as per Census 2011. The Government of India (GoI) aswell as the State Government launched various schemes for improvement inthe health, nutrition, personal hygiene, education and self development of thegirls. Audit findings on implementation of the schemes Ladli Laxmi Yojana1,Gaon Ki Beti Yojana2 and Pratibha Kiran Yojana3 were included in the Reportof the Comptroller and Auditor General of India on General and Social (Non-PSUs) Sectors for the year ended 31 March 2013. With the same objectives,the State Government implements the following three other programmes:
Kishori Shakti Yojana (KSY) and Rajiv Gandhi Scheme forEmpowerment of Adolescent Girls (SABLA):
GoI introduced (2000) KSY as a component of Integrated Child DevelopmentServices (ICDS) Scheme in order to empower adolescent girls (AGs) throughself-development, generating awareness about nutrition, health and familycare and learning life skills. With the same objectives, Rajiv Gandhi Schemefor Empowerment of Adolescent Girls (SABLA) was introduced in December2010 in 15 districts4 in the State by replacing KSY. KSY is fully funded byGoI. Under SABLA, cost of nutrition is equally shared by Centre and State. Fornon-nutrition component, GoI provides 100 per cent grant to ICDS project.
Kanya Saksharta Protsahan Yojana (KSPY):
The State Government introduced (1986-87) KSPY in order to increaseenrolment and female literacy among Scheduled Caste (SC) and ScheduledTribe (ST) girl students for sixth standard in educational institutions. From2003, Government decided to extend the financial benefit to the SC/ST girlsfor continuation of their education up to higher secondary level, students ofninth and eleventh standards were also included. Under the Scheme, financialassistance is provided to SC/ST girl students at the time of their enrolment inschool.
2.4.2 Implementation arrangements
The Schemes KSY and SABLA are implemented by Women and ChildDevelopment Department (WCD), headed by the Principal Secretary. TheCommissioner is the administrative head of the Department, who is assistedby District Programme Officers (DPOs) at district level and ChildDevelopment Project Officers (CDPOs) at block level.
The Scheme KSPY is implemented by Tribal Development Department andScheduled Caste Development Departments, headed by Principal Secretaries.The Commissioner, Tribal Development (CTD) and the Commissioner,Scheduled Caste Development (CSCD) are the administrative heads of theDepartment. Assistant Commissioners, Tribal Development (ACTDs) in 26
1 To promote educational improvement, family planning and prevent child marriage.2 To promote higher education among meritorious girls from villages.3 To promote higher education among meritorious girls from urban BPL families.4 Balaghat, Betul, Bhind, Bhopal, Damoh, Indore, Jabalpur, Jhabua, Neemuch,
Rajgarh, Rewa, Sagar, Sheopur, Sidhi and Tikamgarh.
Audit Report on General and Social (Non-PSUs) Sectors for the year ended 31 March 2014
60
districts and District Organisers, Tribal Welfare (DOTWs) in 24 districtsimplement the Scheme through Block Education Officers(BEOs)/Principals/Head Masters of the Middle/High/ Higher SecondarySchools.
2.4.3 Audit objectives
The audit objectives were to ascertain whether:
identification and selection of beneficiaries under Schemes was done asper Scheme guidelines;
financial management of the Schemes was efficient;
the Schemes were implemented as per guidelines and the intendedobjectives of self-development, generating awareness of girls aboutnutrition, health and family care and education development of SC and STgirls were achieved; and
the monitoring of the schemes were adequate and effective.
2.4.4 Audit criteria
The norms, standards, procedures laid down in the following documents havebeen adopted as audit for the performance audit:
Scheme guidelines;
Instructions issued by Central and State Governments for implementationof the Schemes;
Madhya Pradesh Treasury Code, Volume I (MPTC Vol. I); and
Prescribed monitoring and evaluation mechanism.
2.4.5 Scope of audit
In the Performance Audit (PA), implementation of the Schemes KSY andKSPY has been covered for the period 2009-14 and the SABLA Scheme hasbeen covered from January 2011 to 2013-14. Out of 51 districts5 in the State,13 districts6 including four7 districts where SABLA is being implementedwere selected randomly on the basis of Simple Random Sampling withoutReplacement (SRSWOR) method.
Four ICDS projects in each selected district with 10 Anganwadi Centers(AWCs) in each Project where SABLA is implemented, were randomlyselected. Five Middle and Higher Secondary Schools in each district underKSPY were test checked. List of units covered under various schemes are inAppendix 2.31.
An entry conference was held in March 2014 with the Principal Secretary,WCD, the Secretary, Tribal Welfare Department (TWD) and theCommissioner, Scheduled Caste Development Department to discuss the auditobjectives, audit criteria and the scope of audit. In the exit conference held in
5 One district (Agar-Malwa) created in August 2013.6 Balaghat, Burhanpur, Chindwara, Dindori, Gwalior, Hoshangabad, Jhabua, Mandla,
Mandsour, Neemuch, Sagar, Seoni and Umaria.7 Balaghat, Jhabua, Neemuch and Sagar.
Chapter 2: Performance Audit
61
November-December 2014 audit findings were discussed with the PrincipalSecretaries of the WCD, Scheduled Caste Welfare Department (SCWD) andTribal Welfare Department (TWD); their views have been incorporated in thereview.
2.4.6 Budget and expenditure
The details of budget allotment and expenditure under the schemes during theperiod 2009-14 are shown in Table 1.
Table-1: Budget allotment and expenditure during the period 2009-14(` in Crore)
Scheme Allotment ExpenditureKishori Shakti Yojana (KSY) 21.54 19.82Rajiv Gandhi Scheme for Empowerment of Adolescent Girls(SABLA)
Total 696.12 665.09(Source-Data furnished by the Departments)
Year-wise details of budget allotment, expenditure and savings under theSchemes are given in paras 2.4.7, 2.4.8.1 and 2.4.9.
Implementation of Schemes
2.4.7 Kishori Shakti Yojana (KSY)
Under KSY Scheme, the training was to be imparted to the girls in the agegroup of 11 to 18 years on balanced diet, health consciousness and economicempowerment. Besides, health check-up of girls was to be carried out and IFAtablets were to be provided by ANMs of Public Health and Family WelfareDepartment. The Scheme was implemented in 51 districts up to 2010-11 andin 36 districts since 2011-12.
Under the Scheme, GoI provided funds at ` 1.10 lakh per annum to eachICDS project. Out of ` 21.54 crore released under KSY during 2009-14,expenditure was ` 19.82 crore. Thus, savings of ` 1.72 crore, occurred mainlyunder ‘training’. Year-wise details are given in table below:
Table-2: Year-wise budget allotment and expenditure during the period 2009-14(` in crore)
Year 2009-10 2010-11 2011-12 2012-13 2013-14 Total
Allotment 4.98 4.98 4.98 3.30 3.30 21.54
Expenditure 4.24 4.68 4.67 3.12 3.11 19.82
Savings 0.74 0.30 0.31 0.18 0.19 1.72(Source: Data furnished by the Departments)
2.4.7.1 Identification and selection of eligible girls
As per KSY guidelines, Anganwadi-wise survey was to be conductedseparately for identification of girls in the age-group of 11 to 18 years. A listof identified girls was to be kept at AWCs and POs. It was observed that noseparate survey was conducted and no separate list prepared for the purpose ofKSY at anganwadi level. As such, the POs did not have any list of identifiedgirls for the Scheme. Thus, identification of beneficiaries through survey, asenvisaged in the guidelines, was not done.
No separatesurvey wasconducted and listprepared for thepurpose of KSY
Audit Report on General and Social (Non-PSUs) Sectors for the year ended 31 March 2014
62
Further, in order to select girls for imparting panchayat level training,preference was to be given to girls from Below Poverty Line (BPL) familyand out of school girls in descending order of their age. A list of selected girlswas to be forwarded by the POs to the Supervisors and Health Committee ofGram Sabha for confirmation of their eligibility. However, the selected POsreported that list of girls selected for training was not forwarded to GramSabha for scrutiny of eligibility.
We observed that during 2009-14, 1.97 lakh girls in respect of 34 POs wereselected for three-days training (out of 2.10 lakh girls selected in 36 testchecked POs) without ensuring adherence to the norms prescribed. There wasno record to show that prioritisation of the eligible girls, as envisaged inguidelines, was done either by the POs or by the Health committees of GramSabha. Of them, 395 girls in 21 POs were imparted Panchayat level trainingthough the girls were not in the age group of 11-18 years.
In the exit conference, the Principal Secretary, WCD stated that due to non-availability of register, the survey list of girls was not available in AWCs andPOs. From year 2014-15 survey data would be maintained in register.
The Department and the Project Offices should maintain a complete databaseof girls in the age-group of 11 to 18 years to ascertain eligibility ofbeneficiaries under the Schemes.
2.4.7.2 Conduct of training programme
As per KSY guidelines, two-days training on balanced diet, healthconsciousness and economic empowerment was to be imparted at block levelby the CDPOs, Lady Doctors and Assistant Project Officers (APO)/DistrictRural Development Authority or Chief Executive Officer (CEO) of JanpadPanchayat to the Supervisors of WCD and Health Department, AuxiliaryNurse Midwife (ANMs), AWWs and two girl beneficiaries from each AWCso as to prepare them as master trainers.
These master trainers, in turn were to impart three-days training at Panchayatlevel to the beneficiary girls on the above issues at an interval of three months(i.e. one day in every three month). Gram Panchayat-wise roster of trainingprogramme for girls was to be prepared by the Supervisors of WCD and ANMof Health Department, which was to be forwarded for approval to the DPO ofWCD and the Chief Medical and Health Officer (CMHO).
We observed that no targets were set for coverage of girls under theprogramme. However, the number of girls imparted training on balance diet,health consciousness and economic empowerment was 14.21 lakh in the years2009-10 and 2010-11. The number of girls covered under ‘training’, decreasedto 9.39 lakh during 2011-12 and to 9.42 in next two years 2012-13 and 2013-14. The decrease was because of replacement of KSY Scheme by SABLA in15 districts during these years.
The number of Panchayats and beneficiaries covered under KSY in the testchecked POs during 2009-14 is shown in Table 3.
Adherence to thenorms for selection ofgirls was not ensured
Chapter 2: Performance Audit
63
Table- 3 Number of Panchayat level training held and girls imparted training in testchecked projects
Year Number ofPanchayat in selectedPOs
Number of Panchayat inwhich Panchayat leveltraining was held
Total 11,281 10,365 2,09,531(Source: Information furnished by the Project Offices)
We observed the following:
Roster of training programme for trainers and trainees was notprepared by 268 out of 36 test checked POs and forwarded to DPO and CMHOfor approval.
Two-days training to prepare master trainer at block level wasimparted in all the test checked POs. However, the CEOs and APOs did notparticipate in any block level training in 36 test checked POs. Besides, trainingfor health consciousness by a lady doctor was imparted only in eight9 out of36 test checked POs.
During the period 2009-14, three-days training to girls at Panchayatlevel was imparted by 33 POs out of 36 test checked POs. In PO Dindori,training was not conducted during 2009-10 to 2011-12 by CDPO because thefunds were utilised on block level training. Similarly, in Sitamau (2009-10)and Malhargarh (2009-11 and 2012-14) in Mandsour District the CDPOs didnot conduct Panchayat level training reportedly due to non-receipt of list ofgirls from AWCs. Hence, entire fund was surrendered.
Further, as per guidelines, after completion of three-days Panchayat leveltraining, Supervisors were to prepare lists of girls who were found fit forvocational training and forward their names to POs. The CDPOs were toforward the lists of girls to the Commissioner through the respective DPOs.
We noticed that girls were not selected by the Supervisors for vocationaltraining in any of the test checked POs under KSY. As a result, vocationaltraining was not imparted to girls as envisaged in the Scheme.
In the exit conference, the Principal Secretary, WCD accepted the fact andstated that instructions would be issued to field offices for taking action.
Preparation of roster for training programme and participation of CEOs andAPOs in block level training under KSY may be ensured.
8 Amarpur, Bajag, Bichua, Bijadandi, Burhanpur rural, Chindwara Rural, Dindori,Gwalior Urban I, Gwalior Urban III, Ghughri, Hoshangabad Urban, HoshangabadRural, Itarsi, Karanjia, Kesla, Khaknar, Manpur, Mandla, Malhargarh, Mohgaon,Mohkhed, Nepanagar, Pali, Sitamou, Tamia and Umaria I.
9 Burhanpur Urban, Gwalior Urban II, Hoshangabad Urban, Itarsi, Khaknar,Mallahargarh, Sitamou and Umaria II.
CEOs andAPOs did notparticipate inblock leveltraining
Vocationaltraining was notimparted togirls underKSY
Audit Report on General and Social (Non-PSUs) Sectors for the year ended 31 March 2014
64
2.4.7.3 Health check-up and IFA supplementation
As per guidelines of the Schemes, the health check-up of girls and Iron FolicAcid (IFA) supplementation was to be done by ANMs and any girl appearedseriously ill was to be referred to Primary Health Center (PHC).
We observed that health check-up and IFA supplementation was not done inany of the test checked districts where KSY was being implemented. On beingenquired in audit, the CDPOs stated that CMHOs/Block Medical Officerswere not informed the schedule for conducting training and health check-up.
In the exit conference, the Principal Secretary, WCD stated that instructionswould be issued to the DPOs and CDPOs in this regard.
2.4.7.4 Monitoring
The KSY guidelines envisaged that a ‘Review Committee’ in each district andin each block was to be formed, which would review the progress of Schemeimplementation once in every three months. However, no provision was madein the guidelines for constitution of a Committee at State level for overallmonitoring of the Scheme implementation.
We observed that out of nine test checked districts, only the DPO, Umariaheld meetings, that too only in 2010-11 and 2011-12. In eight other districts,no meetings were held. Similarly, out of 36 test checked projects, meetingswere held only in four projects10 during the years 2009-10 to 2013-14.
Thus, there were deficiencies in monitoring at all levels, adversely affectingthe Scheme implementation.
In the exit conference, the Principal Secretary, WCD accepted the fact andstated that instructions would be issued to hold the meetings by monitoringcommittees as prescribed in the guidelines.
2.4.8 Rajiv Gandhi Scheme for Empowerment of Adolescent Girls(SABLA)
The objectives of the Scheme were to empower the adolescent girls for self-development, improve their nutritional and health status, promote awarenessabout health, hygiene, nutrition, Adolescent Reproductive and Sexual Health(ARSH) and family and child care, upgrade their home-based skills, life skills,bringing back the school dropout adolescent girls into formal/non formaleducation and provide information/guidance about working of various publicinstitutions. In addition to these, nutrition supplementary diet is provided toeligible adolescent girls. SABLA Scheme, is being implemented in 15 districtsof the State.2.4.8.1 Utilisation of funds
Under SABLA Scheme, GoI provided funds at ` 3.80 lakh per annum to eachICDS project for non-nutrition component. For this component, ` 12.51 crorewas utilised against ` 15.75 crore provided by GoI during 2010-14. Similarly,for the nutrition component, the Commissioner utilised ` 391.06 crore against
10 Hoshangabad Rural (District-Hoshangabad), Amarpur (District-Dindori), Khaknaar(District-Burhanpur) and Tamia (District-Chhindwara).
Health check upof girls was notconducted inAWCs
Meetings ofmonitoringcommittee werenot held
Chapter 2: Performance Audit
65
the provision of ` 402.89 crore; savings were mainly during 2012-13 and2013-14, as shown in table below:
Table-4: Year-wise budget allotment and expenditure during the period 2009-14(` in crore)
Total 15.75 402.89 418.64 12.51 391.06 403.57 15.07(Source: Data furnished by the Departments)
It would be seen from the above that there were significant saving under bothnutrition and non-nutrition components during the year 2013-14.
We observed that 11 test checked Project Offices (POs)11 did not fully utilisethe funds allotted for various activities such as conduct of Kishori Diwas, LifeSkill Education, Nutrition and Health Education and Vocational Trainingplanned under non-nutrition component of SABLA. Out of total allotment of` 31.90 lakh under these activities, actual expenditure was ` 24.52 lakh.(Appendix 2.32).
Further, we observed that the Commissioner, WCD withdrew ` 3.06 crore forprocurement of SABLA training kits and ` 0.48 crore for SABLA registers andkept the amounts in Civil Deposit on 28 March 2012 and on 31 March 2013respectively to avoid lapse of funds. Of these, ` 3.06 crore was spent in 2012-13 and ` 0.48 crore remained parked in Civil Deposit as of November 2014.Blocking of Scheme funds affected the Scheme implementation andachievement of targets.
In the exit conference, the Principal Secretary, WCD accepted the fact andstated that IFA tablet is being provided by the Health Department andselection of Vocational Training Providers (VTPs) was not done by somedistricts as such funds could not be utilised. He also stated that the amountkept in Civil Deposit would be utilised shortly.
2.4.8.2 Coverage of beneficiaries
Under SABLA Scheme, baseline survey for identification of adolescent girls in15 districts for different components was conducted by Anganwadi Workers(AWWs) during 2010-11. The number of beneficiaries covered and theshortfalls under various components of SABLA Scheme was as under:
11 Javad, Jhabua, Lalburra, Manasa, Meghnagar, Neemuch Urban, Neemuch Rural,Petlavad, Sagar Urban I, Sagar Urban II and Thandla.
11 Project Officesdid not fully utilisethe allotted fundsfor programmeactivities. Besides,` 0.48 croreremained in Civildeposit
Audit Report on General and Social (Non-PSUs) Sectors for the year ended 31 March 2014
66
Table-5: Component-wise shortfall in coverage of girls under SABLA
Component No. of AGsas per baselinesurvey
2011-12 2012-13 2013-14Girlsbenefit-ed
Shortfall(withpercent-tage)
Girlsbenefit-ed
Shortfall(withpercent-tage)
Girlsbenefit-ed
Shortfall(withpercent-tage)
Iron Folic Acid(IFA)
3,36,08112 2,01,506 1,34,575(40)
2,05,850 1,30,231(39)
2,15,850 1,20,231(36)
Health Check-up
3,36,081 98,329 2,37,752(71)
1,12,305 2,23,776(67)
1,14,850 2,21,231(66)
Training to girlsimparted underSABLA13
3,36,081 1,10,100 2,25,981(67)
1,15,090 2,20,991(66)
1,15,800 2,20,281(66)
Nutritionprovided to girlsunder SABLA
10,07,59414 8,00,758 2,06,836(21)
8,92,666 1,14,928(11)
8,97,000 1,10,594(11)
(Source: Data furnished by the department and Progress Report submitted to GoI)
The reasons for significant shortfall under various components of SABLAScheme have been discussed in paras 2.4.8.4, 2.4.8.6 and 2.4.8.9. TheDepartment stated that the coverage under the Scheme was less as these werethe initial years of implementation and more awareness amongst thebeneficiaries and the service providers was needed.
2.4.8.3 Conduct of vocational training
As per para 6.8 of SABLA guidelines, vocational training for girls in the agegroup of 16 to 18 years for their skill development and employment was to beimparted by vocational training providers. GoI provided ` 30,000 every yearto each PO for imparting vocational training. We observed that vocationaltraining was not conducted in the seven15 out of 36 test-checked POs duringthe period 2011-12 to 2013-14.
In the exit conference, the Principal Secretary, WCD accepted theobservations
2.4.8.4 Providing guidance/counseling
Under SABLA, guidance/counseling to the ‘out of school’ girls on ‘Nutritionand Health Education’ were to be provided for a minimum two sessions in aquarter; ‘Family Welfare, Adolescent Reproductive & Sexual Health (ARSH)and Child Care Practices’ for at least three sessions and ‘Life Skill Education’for minimum two sessions in a quarter.
The status of guidance and counseling sessions conducted in 160 test checkedAWCs of four selected districts during 2011-14 is given in Table-6.
12 Out of school girls in the age group of 11 to 18 years.13 Three types of training imparted are (i) Nutrition and Health Education (NHE),
(ii) Family Welfare and Child Care and (iii) Life Skill Education.14 Out of school girls in the age group of 11 to 14 years plus all girls in the age group of
15 to 18 years.15 Jhabua (2011-12), Javad (2012-13), Lalburra (2013-14), Manasa (2011-12 and 2013-
14), Neemuch Urban (2012-13), Neemuch Rural (2013-14) and Petlavad (2012-13).
Significantshortfall noticedin providingservices to girlsunder SABLA
(Source: Information furnished by AWWs and Supervisors)
It is evident from the above that only in Balaghat District, shortfall wasminimum (0 to 23 per cent) whereas in other test checked districts shortfall inguidance and counseling ranged from 33 per cent (NHE) to 97 per cent(Family Welfare and ARSH).
In the exit conference, the Principal Secretary, WCD stated that the coverageunder the Scheme was less, as these were the initial years.
Guidance and Counseling may be provided to the girls, as envisaged in theguidelines.
2.4.8.5 Distribution of Training Kits
As per para 5.2 of SABLA guidelines, funds for procurement of training kitswere provided by GoI at ` 1,000 per operational AWC every year to assist thegirls in understanding various health, nutrition, social and legal issues. Weobserved that the training kits were not provided by Directorate during theyears 2010-11, 2011-12 and 2013-14. Training kits were provided to AWCstwice during 2012-13, for current year and for the previous year, sinceadministrative sanction for 2011-12 was delayed. Training kits for the year2013-14 were also not provided to AWCs due to late allotment of funds todistrict offices.
We also observed that the DPOs of all the test checked districts surrenderedentire funds (` 60.06 lakh16) as the funds were received at the end of the year.As a result, the girls remained deprived of the practical knowledge of varioushealth, nutrition, social and legal issues which they could get through the kits.
In the exit conference, the Principal Secretary, WCD stated that due to delayedadministrative approval training kits were not provided to AWCs.
2.4.8.6 Health check-up and IFA supplementation
As per guidelines of the Scheme, the health check-up of girls and Iron FolicAcid (IFA) supplementation was to be done by ANMs, and in case of girlshaving problems requiring specialised treatment, Medical Officers would referthe girls to the District Hospital/Primary Health Centre (PHC).
Out of 160 test-checked AWCs in four selected districts, where SABLA wasbeing implemented, health check-up was not conducted in 79 AWCs and IFAsupplementation was not done in 68 AWCs.
In the exit conference, the Principal Secretary, WCD stated that instructionswould be issued to the DPOs and CDPOs in this regard.
There wereshortfalls inguidance andcounseling sessionsin the test checkedAWCs
Training Kitswere notprovided toAWCs
Health check upof girls was notconducted inAWCs
Audit Report on General and Social (Non-PSUs) Sectors for the year ended 31 March 2014
68
Conducting health check-up of girls and supply of IFA tablets may be ensuredat PO level.
2.4.8.7 Maintenance of Kishori Cards
As per para 5.4 of SABLA guidelines, Kishori cards for each girl was to bemaintained in AWCs. The card contains information about the weight, bodymass index, IFA supplementation and services like counselling sessions, takehome ration (THR) received, etc. We observed that against the requirement of15.44 lakh Kishori Cards17, the Commissioner placed order in July 2011 forsupply of 12 lakh cards. Supply was made to the districts only in October2012.
We observed that in four test checked districts, 2.34 lakh cards (60 per cent)were procured against requirement of 3.89 lakh Kishori Cards as detailedbelow:
(Source: Information furnished by the District Offices and Directorate)
As per information furnished by the AWWs, out of 160 test checked AWCs,31 AWCs did not receive any Kishori Card, 86 AWCs did not receive requirednumber of Kishori Cards and only 43 AWCs had received Kishori Cards asper their requirement. Due to short distribution of Kishori Cards, informationabout IFA supplementation, health check-up, counselling sessions attendedand THR provided to each girl was not maintained at AWCs.
In the exit conference, the Principal Secretary, WCD stated that Kishori Cardswere provided to the districts on the basis of baseline data for the year2011-12.
The reply was not acceptable as the order placed for Kishori Cards was muchless than the requirement as per the baseline survey data of the districts.
2.4.8.8 Convergence with different departments
The SABLA Scheme envisaged an integrated delivery of a multiplicity ofservices which were to be handled by different departments at different levels.For this, Districts/Project Offices were to converge the services under theSchemes with various schemes/programmes of the Education Department,Health Department, Youth Affairs Department, Labour Department andPanchayati Raj Institutions for implementation of different components underthe Scheme.
The DPOs and CDPOs could not produce to Audit any records in support ofconvergence done, if any, with other departments. However, the DPONeemuch converged with Health and Education Departments. Thus, the
17 As per baseline data of 15 districts where SABLA was implemented.
Convergence withschemes/programmes ofdifferentdepartments was notdone at district/project level
Chapter 2: Performance Audit
69
objective of SABLA to achieve effective co-ordination of policy andimplementation amongst the various departments to promote girlempowerment remained unaccomplished.
In the exit conference, the Principal Secretary, WCD accepted the fact andstated that DPOs and CDPOs would be instructed to keep records ofconvergence with concerned departments.
For effective implementation of the Schemes convergence with variousschemes of different departments may be done at all levels to ensureintegrated delivery of a multiplicity of the services.
2.4.8.9 Providing Supplementary Nutrition to girls
As per GoI guidelines, THR as supplementary nutrition was to be provided for300 days in a year to ‘out of school’ girls in the age group of 11 to 14 yearsand all girls in the age group of 15 to 18 years. Under the Scheme, girls wereprovided THR packets of Soya Barfi/Khichdi per week of 900 grams each. Forproviding 300 days THR in a year, each girl was to be given at least 50packets (a packet for six days) in a year.
We noticed that there were shortfalls ranging from 11 per cent to 21 per centin providing the THR in the State under SABLA Scheme as mentioned inTable 5. Scrutiny of THR stock register, supplementary nutrition records andenrolment data of supplementary nutrition for girls furnished by the DPO,Neemuch revealed that against the total requirement of 42.07 lakh18 packetsfor providing THR to all enrolled girls 30.08 lakh packets (72 per cent) weresupplied during the period 2011-14. This resulted in 23,957 girls (28 per cent)being either deprived of getting benefit of supplementary nutrition or providedless than 300 days of THR to 84,131 girls as shown in Table-8.
Table-8: Shortfall in providing THR in Neemuch district
(Source: Data furnished by the DPO Neemuch)
No shortfall in other selected districts was noticed in audit and the weight,cost, quantity and nutrition value were same as prescribed in GoI guidelines.
In the exit conference, the Principal Secretary, WCD stated that 100 per centgirls could not be benefited with THR because girls belonging to well to dofamilies were not taking THR.
The reply is not acceptable as all enrolled girls under Nutrition Component ofSABLA should have been provided Supplementary Nutrition as per norms.Further, the Department has not furnished any record in support of their reply.
18 84,131 girls x 50 packets =42,06,550.
Short coverage ofbeneficiaries undernutritioncomponent
Audit Report on General and Social (Non-PSUs) Sectors for the year ended 31 March 2014
70
2.4.8.10 Monitoring
Under SABLA, a State Level Monitoring and Supervision Committee headedby the Chief Secretary was to be formed and was required to meet quarterly oras and when required. The State Level Committee was formed in March 2011.However, no meeting was held as of July 2014.
At district level, a Committee headed by the District Magistrate and at Projectlevel, a Committee headed by the DPO was to be formed. They were requiredto meet once in each quarter and in a month respectively. We observed thatthe Monitoring Committees at project level and district level were notconstituted in Sagar District. In Neemuch and Jhabua Districts though theCommittees were constituted (March 2011 and May 2011 respectively) at bothlevels, quarterly meetings for supervision and monitoring were not held. InBalaghat District, only four quarterly meetings were held by district levelcommittee against 12 prescribed meetings during 2011-14. Out of 16 testchecked projects, only Baraseoni and Katnagi projects held monthly meetings.
Thus, there were deficiencies in monitoring at all levels, adversely affectingthe Scheme implementation.
In the exit conference, the Principal Secretary, WCD accepted the fact andstated that instructions would be issued to hold the meetings by monitoringcommittees as prescribed in the guidelines.
Monitoring committees at all level may be constituted and meetings heldregularly as per guidelines to review the progress of the Scheme and to takecorrective action, if required.
2.4.9 Kanya Saksharta Protsahan Yojana (KSPY)
The KSPY, a State sponsored Scheme, is being implemented in all 51 districtsin the State. The Scheme provides financial assistance of ` 500 for class sixth,` 1000 for class ninth and ` 3000 for class eleventh SC/ST girl students,whose parents are not Income Tax payee at the time of their enrolment inschools. The incentive amount was to be paid in the bank account ofbeneficiary. However, payment of incentive in cash was allowed for thoseinstitutions where banks were not available.
Under the Scheme, ` 241.70 crore was spent out of ` 255.94 crore allocatedduring the period 2009-14, as shown in table below:
Table-9: Year-wise budget allotment and expenditure during the period 2009-14(` in crore)
In the 13 test checked districts, expenditure incurred was ` 65.60 crore againstprovision of ` 67.98 crore during the period 2009-14. We observed that out of` 65.60 crore released by the district offices, a total amount of ` 1.25 crorewas lying in the bank account of ACTDs/BEOs/Principals in six districts, asshown in Appendix 2.33 and the same was not deposited in the Governmentaccount.
Meetings ofmonitoringcommittee werenot held
Incentive amountof ` 1.25 crorewas lying in thebank account ofACTDs/BEOs/Principals
Chapter 2: Performance Audit
71
2.4.9.1 Coverage of beneficiaries
There was no record to show the number of identified girls or targets set bythe concerned departments for KSPY Scheme. Year-wise number ofbeneficiaries covered under the Scheme was as under:
Table-10: Status of achievement under KSPY(figures in lakh)
Class Number of students covered in classes 6th, 9th and 11th under KSPY2009-10 2010-11 2011-12 2012-13 2013-14
SC ST Total SC ST Total SC ST Total SC ST Total SC ST Total6 1.19 1.23 2.42 1.33 1.46 2.79 1.42 1.78 3.20 1.62 1.83 3.45 1.40 1.87 3.27
In the 13 test checked districts, 2.79 lakh SC and 4.19 lakh ST girls wereidentified under the Scheme. Of them, incentive was paid to 2.76 lakh SC (99per cent) and 4.13 lakh ST (99 per cent) girl students.
2.4.9.2 Benefits given without obtaining requisite documents
The KSPY guidelines envisaged that the eligibility criteria for sanction ofscholarship by the State Government should be applicable for sanction offinancial assistance under the Scheme.
As per Scholarship Rule (1972) and instructions issued by CTD (July 2011),submission of applications along with caste certificates and certificatesregarding the parents not being income tax payee was mandatory before theincentive is released to the eligible girls.
We observed that in nine out of 13 selected districts, benefits of `1.48 crorewere given to 9189 beneficiaries without ascertaining the eligibility criteria. Ineight districts19, benefits were given to 7,354 girls (of 13 schools) withoutobtaining applications and certificates regarding income, while in threedistricts20 1,835 girls (of four schools) were given benefits without obtainingcaste certificates during the period 2009-14, as shown in Appendix 2.34. Inabsence of requisite documents eligibility of the girls could not be ascertainedin audit.
The Principals of schools accepted and stated that the applications and castecertificates could not be obtained and would be obtained in future.
In the exit conference, the Principal Secretaries, SCWD and TWD stated thatinstructions had been issued to district offices for maintaining the records asper norms.
2.4.9.3 Delayed distribution of incentive amount to girl students
We observed that there were delays from two to 15 months in release of fundsby the district authorities to the schools, despite availability of funds. Scrutinyof records in 62 selected higher secondary schools and middle schools
Benefits extended togirls withoutobtaining documentsin support ofeligibility
There were delaysranging from twoto 18 months indistribution ofincentive
Audit Report on General and Social (Non-PSUs) Sectors for the year ended 31 March 2014
72
revealed that the incentives amounting to ` 1.25 crore pertaining to 10,332SC/ST girl students in 34 schools (12 districts) were paid with delays rangingfrom two to 18 months, as shown in Appendix 2.35. The delay was due tonon-submission of sanctions/proposals in time by the head of educationalinstitutes and delayed release of funds by District Offices.
In the exit conference, the Principal Secretaries, SCWD and TWD stated thatdelayed distribution of incentive amount was mainly due to non-opening ofbank accounts of girls, delayed drawal of allotment by the district offices anddelay in providing of additional fund as per actual demand received from fieldoffices.
The Department should ensure timely payment of incentive to avoid anyadverse impact on enrolment and retention of girls in schools.
2.4.9.4 Incentive amount paid in cash
Scrutiny of paid vouchers in 13 test checked districts revealed that during theperiod 2009-14, in 841 schools21 of six districts,22 69,348 girls students werepaid ` 6.82 crore in cash, as shown in Appendix-2.36. Possibility of mis-utilisation of funds in these cases cannot be ruled out. In seven other districtsincentives were paid through the bank accounts of beneficiaries.
On this being pointed out, the heads of educational institutions stated that dueto non-opening of bank account of girls, incentive amount was paid in cash.
In the exit conference, the Principal Secretaries, SCWD and TWD stated thatincentive amount would be paid in the bank account of girl students/parentsthrough School Education Department from year 2014-15.
2.4.9.5 Decrease in number of girls in secondary and higher secondaryclasses
The KSPY scheme was launched for improvement in literacy of SC and STgirls and continuation of their education in secondary and higher secondaryclasses.
We noticed that enrolment of SC and ST girl students improved during theperiod 2009-14. There was gradual increase in the number of beneficiary from1.94 lakh (SC) and 1.75 lakh (ST) in 2009-10 to 2.59 lakh (SC) and 3.24 (ST)in 2013-14 (as detailed in Table-10).
Further, we observed that during the year 2009-10 the number of SC and STgirls was 2.42 lakh in 6th class. During 2012-13 the same number of girlshould have been available in 9th class. We noticed that the actual number ofSC and ST girls in 9th class during 2012-13 was 1.99 lakh i.e. a decrease of 18per cent.
Against the number of SC and ST girls of 6th class in 2010-11 (2.79 lakh), thenumber of girls in 9th class during 2013-14 was much less (1.92 lakh)indicating a decrease of 31 per cent.
21 Includes 16 schools out of 65 schools test checked and 825 other schools in Mandladistrict (out of 902 schools) paid vouchers of which were examined separately.
Similarly, the number of SC and ST girls in 9th class during the years 2009-10,2010-11 and 2011-12 was 0.95 lakh, 1.18 lakh and 1.67 lakh respectively. Thesame number of girl should have been available in 11th class during 2011-12,2012-13 and 2013-14. We observed that the number of SC and ST girls in 11th
class during these years was 0.55 lakh, 0.58 lakh and 0.64 lakh respectively,indicating decrease of girls in 11th class by 42 per cent, 51 per cent and 62per cent respectively.
Thus, though there was an increase in overall enrolment of SC and ST girls inthe State, the number of girl students decreased in secondary level and highersecondary level.
In the exit conference, the Principal Secretary, SCWD stated that effortswould be made to reduce the drop out of girls. Principal Secretary, TWDstated that implementation of the schemes resulted increase of enrolment ofST girl students. However, no reply in respect of decrease in number of girlstudents in higher classes was received.
The fact remains that the objective of the scheme was not fully achieved.
2.4.9.6 Monitoring
As per instructions issued (October 1986) by Tribal Welfare Department, theBlock Development Officer of Janpad and the BEOs are responsible forreviewing the progress of Scheme through quarterly meetings and evaluationof the Scheme was to be conducted by Tribal Development and ResearchInstitute. We noticed that monitoring of the Scheme was not done during2009-14 at any level. Due to non-monitoring at prescribed levels the delayeddisbursement of incentive amount to girls, blockage of fund at all levelsremained unnoticed.
Further, evaluation of the Scheme was not done by the Tribal Developmentand Research Institute.
The Government stated that evaluation of the Scheme would be done throughTribal Development and Research Institute.
The implementation may be monitored as prescribed, for effective impact ofthe Scheme.
2.4.10 Conclusion
Under KSY, identification of girls through anganwadi-wise survey wasnot done. Also, list of the selected girls was not sent to Gram Sabha forscrutiny of eligibility. There was no target for coverage of girls under KSY.Under KSY, vocational training and health check-up was not done at all.
Under SABLA, the Programme was improved by introducing thecomponent ‘nutrition’ for girls; 79 per cent to 89 per cent of selected girlswere benefitted. However, the coverage under the component ‘guidance andcounseling’ on nutrition and health education, family welfare and life skilleducation introduced under SABLA was much less than the target set. Healthcheck-up was conducted in 79 out of 160 selected anganwadi centres.
Under KSPY the objective of encouraging the SC/ST girls to continuestudy up to higher secondary level was not fully achieved since the girl
Absence ofmonitoringmechanism
Audit Report on General and Social (Non-PSUs) Sectors for the year ended 31 March 2014
74
students decreased from upper primary level to secondary level and furtherreduced to higher secondary level. There were delays up to 18 months inextending the financial assistance to the girl students.
Monitoring and supervision of the programmes KSY and SABLA wasnot adequate, since there were significant shortfalls in meetings of monitoringcommittees. Monitoring of the programme KSPY was not done at any level.
Chapter 2 : Performance Audit
75
Public Health and Family Welfare Department
2.5 Implementation of Health Schemes in Tribal Districts
2.5.1 Introduction
Tribal Sub Plan (TSP) initiated by Government of India (GoI) is seen ascritical initiative in closing the development gap between the ScheduledTribes (ST) and others. In Madhya Pradesh, tribal population is 21 per cent oftotal population (7.26 crore). As per procedure evolved by the PlanningCommission, Central Ministries are to ensure appropriate earmarking offunds for various sectors (including Health Sector) under TSP in the AnnualPlan proposals. However, no mechanism has been evolved for maintenanceof separate accounts for TSP funds.
Under Health Sector, the flow of TSP funds was in 21 schemes of NationalRural Health Mission (NRHM) and seven1 non-NRHM schemes. Two non-NRHM schemes viz. National Programme for Prevention and Control ofCancer, Diabetes, Cardiovascular Disease and Stroke (NPCDCS) and NationalProgramme for Health Care for the Elderly (NPHCE) were selected forperformance audit (PA) covering the period 2011-14.
NPCDCS was launched in 2008 for reducing the incidences of Non-Communicable Diseases (NCDs) such as cancer, diabetes, cardiovasculardiseases and stroke. The aim of the NPHCE programme launched in 2010 is toprovide separate and specialised comprehensive health care services to thesenior citizens at various levels of State health care units. These programmeshave been implemented in five tribal districts2 of the State.
At the State level, Principal Secretary of the Department is responsible forimplementation of the programmes who is assisted by Director, HealthServices and Mission Director of State Health Society (SHS). A State NCD(Non-communicable Disease) cell headed by Deputy Director and at districtlevel a District NCD cell headed by Chief Medical and Health Officer(CMHO) were established for overall implementation and monitoring of boththe programmes.
2.5.2 Audit objectives
The broad objectives of the review were to examine whether:
planning for implementation of the programmes was well designed;
adequate financial outlay was earmarked under TSP;
health care services were delivered efficiently, as envisaged in theProgrammes; and
effective monitoring mechanism was in place.
1 (i) National Programme for Prevention and Control of Cancer, Diabetes,Cardiovascular Diseases and Stroke, (ii) National Programme for Health Care for theElderly, (iii) National Mental Health Programme, (iv) Assistance to State forCapacity Building (Trauma Care), (v) Human Resource for Health, (vi)Strengthening of State Drug regulatory system, (vii) Strengthening of State FoodRegulatory System.
2 Chhindwara, Dhar, Hoshangabad, Jhabua and Ratlam.
Audit Report on General and Social (Non-PSUs) Sectors for the year ended 31 March 2014
76
2.5.3 Scope and methodology of audit
These programmes were implemented in five tribal districts out of 21 tribaldistricts in the State. In addition to the State NCD Cell, we test-checkedrecord of three District NCD Cells at Chhindwara, Dhar and Ratlam, nineCHCs3 (Community Health Centres) out of 32, 16 PHCs (Primary HealthCentres) out of 138 and 34 SHCs (Sub-health Centres) out of 858 wereselected for the review.
An entry conference was held in June 2014, where the audit objectives andmethodology were discussed with the Director, Health Services (DHS)/Director,National Rural Health Mission (NRHM). The exit conference was held inNovember 2014 with the Principal Secretary alongwith other concerned officers.The views of the Department have been incorporated in the relevant paragraphs.
2.5.4 Financial management
During the period 2011-14, total budgetary allocation under TSP (HealthSector) was only seven per cent of total allocation under Health Sector in theState. Under the programmes NPCDCS and NPHCE, funds allotted under TSPwere 20 per cent and 13 per cent respectively of total allocation for theProgramme.
Year-wise details of funds available and expenditure incurred under NPCDCSand NPHCE during the period 2011-14 were as in Table 1.
Table 1: Funds available and expenditure incurred under NPCDCS and NPHCE(` in crore)
(Source: State NCD Cell)
Under-utilisation of funds was 77 to 100 per cent under NPCDCS and70 to 94 per cent under NPHCE. As a result, various activities viz.establishment of geriatric wards and clinics, procurement of machinery,equipment, drugs, deployment of human resources, training and publicawareness were not carried out, as discussed in paragraphs 2.5.6 and 2.5.7.
GoI released funds in three components viz. General Head, Tribal Sub-plan and Scheduled Caste Sub-Plan. However, these three components weremixed in a corpus fund and the State NCD Cell released the same to thedistricts without earmarking as TSP funds of ` 3.43 crore (` 2.64 crore underNPCDCS and ` 0.79 crore under NPHCE). Further, neither separate records of
3 Damua, Dhanora, Harrai, Jamai, Kukshi, Namli, Pithampur, Sailana and Tamia.4 At State and District level.
Under-utilisation offunds during 2011-12to 2013-14 was 77 to100 per cent underNPCDCS and 70 to94 per cent underNPHCE
Chapter 2 : Performance Audit
77
expenditure were maintained at any level nor separate utilization certificatesubmitted to GoI for TSP funds.
During the years 2011-12 to 2013-14, out of total Central sharereleased for NPCDCS and NPHCE, funds earmarked under TSP componentwas 20 per cent and 13 per cent respectively. We observed that the fivedistricts where programmes were implemented had 44 per cent tribalpopulation.
In the exit conference Principal Secretary stated (November 2014) that theshortage of manpower was the main reason for non-utilisation of funds. It wasalso stated that separate plan for TSP was not prepared and no instructionswere received from GoI to maintain separate accounts for TSP funds.
Optimum utilization of available financial resources may be ensured.
2.5.5 Planning
As envisaged in programme guidelines, State and District NCD cells wereresponsible for overall planning, implementation, monitoring and evaluationof the different activities and achievement of physical and financial targetsplanned under both the programmes in the State. We observed the following:
During the years 2011-12 and 2012-13, State Action Plan or DistrictAction Plan and database on physical and financial targets was not prepared.The State Action Plan for 2013-14 was prepared and sent to GoI, for whichapproval was not received (July 2014). According to the guidelines, State anddistrict level data on physical, financial, epidemiological profile was to bemaintained at State and district level for determining the priorities for actionplan. However, no such data was maintained either at State NCD Cell level orby the test checked district NCD Cells.
The guidelines provided for a wider knowledge base in the communityfor effective prevention, detection, referrals and treatment strategies throughconvergence with ongoing interventions of NRHM, NTCP5 and AYUSH6 etc.On an audit enquiry, the State NCD Cell stated that no plan for convergence ofNPCDCS and NPHCE activities with other related programmes was prepared.
In the exit conference, Principal Secretary confirmed the fact and stated(November 2014) that convergence with other schemes would be taken intoconsideration during the preparation of next year’s Action Plan.
2.5.6 Implementation of NPCDCS
To achieve the objectives of NPCDCS, strategies to be undertaken wereprevention through behaviour change, early diagnosis, treatment, capacitybuilding of human resource, Surveillance and Monitoring.
2.5.6.1 IEC activities for generating awareness about NCDs
To prevent the risk factors to NCD, general awareness about the NCD was tobe created through mass media, community education and interpersonalcommunication for behaviour change. As per guidelines, Central NCD Cellwas to prepare prototype Information, Education and Communication (IEC)
5 National Tobacco Control Programme.6 Ayurveda, Yoga, Unani, Siddha and Homeopathy.
State and districtaction plan anddatabase on physical,financial andepidemiologicalprofile was notprepared
Audit Report on General and Social (Non-PSUs) Sectors for the year ended 31 March 2014
78
material on NCD diseases to sensitise the community about the risk factorsand inform about services available through various electronic and printmedia. These were to be provided to States by Central NCD cell fordissemination. Further, public awareness regarding health promotion andprevention of NCD through communication messages, distribution of printedmaterial and social mobilization were to be carried out at State, district andCHC levels.
As reported by State NCD Cell, no IEC material was received fromCentral NCD Cell during the period 2011-14. Further, no IEC activities wereorganised at State and CHC level. However, few activities were organised atdistrict level during the years 2012-13 and 2013-14 at a cost of ` 1.86 lakh outof available funds of ` 6.13 lakh. We observed that due to non/shortdeployment for the posts of nurse, counselor and care coordinator, nointerpersonal communication campaign in the selected districts was organisedduring the year 2011-12. However, only two campaigns were organised by thedistricts test-checked during the years 2012-13 and 2013-14, which wereattended by 403 participants.
In respect of mass media and community education for publicawareness, the banners, posters etc. were not received at district level fromState NCD Cell and therefore message was also not broadcasted or telecastedin two test-checked districts viz. Dhar and Ratlam.
Thus, IEC activities were not organised as envisaged and the objectives ofprevention from NCDs through behaviour change could not be fully achieved.
In the exit conference Principal Secretary stated (November 2014) that due topaucity of manpower IEC activities could not be carried out in a satisfactorymanner.
Awareness generation activities may be carried out for bringing behaviouralchange among the NCD patients.
2.5.6.2 Strategy for early diagnosis
For early diagnosis of chronic NCDs, opportunistic screening was to becarried out at DH, CHC and SHC level and suspected cases were to be eitherinvestigated or referred to higher level health facility centre. We observed thefollowing:
Screening camps were not organized in Dhar and Ratlam Districtsduring the period 2011-14. In Chhindwara District, screening camps wereorganised during 2013-14 where 7.39 lakh individuals were screened for NCDdiseases.
GoI initiated (2011-12) a school-based screening programme fordiabetes on pilot basis in the Ratlam District. The screening was primarilyfocused on school children in the age group of 5 to 15 years. We observed thatpilot study was not conducted in Ratlam District despite availability of funds.
In the exit conference, Principal Secretary stated (November 2014) that due toshortage of manpower screening activity could not be carried out and unspentfund of pilot study would be refunded to GoI.
Thus, shortage of manpower defeated the strategy for early diagnosis of NCDdiseases.
Screening campswere not organised intwo test checkeddistricts and pilotstudy on school basedscreening programmefor diabetes was notconducted
Chapter 2 : Performance Audit
79
2.5.6.3 Lack of investigation facilities
Guidelines provided that nine types of investigation facilities7 were to beavailable at district NCD clinics. We observed that against ` 8.13 croreallotted during 2012-13 and 2013-14 for procurement of investigationfacilities only ` 4.29 crore were utilised. As a result, essential investigationfacilities mainly related to Cancer diseases such as Colposcopy andmammography were not available at District NCD clinics as detailed inAppendix 2.37. Further, according to the guidelines, chemotherapy facilitywas to be made available at each District NCD clinic. We noticed that thisfacility was not available in any of the three test-checked District NCD clinics.
As per guidelines, five types8 of essential investigation facilities were to beavailable at CHC level NCD clinics. We observed that ultra-sound facility wasnot available in any of the test checked CHC clinics. Further, lipid profilefacility in eight CHCs9, X-ray in four CHCs10 and ECG facility in six CHCs11
was not available, as detailed in Appendix 2.38. It was also reported by thetest-checked districts and CHC NCD clinics that facilities not available werenot outsourced and facility for management of common CVDs, Diabetes andStroke cases was not available in five CHCs12 clinics.
2.5.6.4 Strengthening of Cardiac Care Unit (CCU)
According to the guidelines, CCUs at districts were to be strengthened withseven types of equipment13 for providing timely and emergent care to thereferred patients. We observed that essential equipment for cardiac patientsviz. 12 channel stress ECG test equipment treadmills were not available atDhar and Ratlam Districts and cardiac monitor with defibrillator was notavailable in Ratlam Distrct. Further, separate CCU was not established inDistrict Hospital, Ratlam and machines and the equipment procured duringAugust 2012 to March 2014 at a cost of ` 41 lakh were lying idle in absenceof CCU unit. Hence, intensive cardiac care was not provided to the NCDpatients.
In the exit conference, Principal Secretary confirmed the fact and stated(November 2014) that a timeline for recruitment of human resources,procurement of equipment and civil works has been decided and would becompleted up to December 2014, June 2015 and December 2015 respectively.
7 Blood sugar, Lipid profile, Kidney function test, Liver function test, ECG,Ultrasound, X-Ray, Colposcopy and Mammography.
8 Blood sugar, ECG, Lipid profile, Ultra sound and X-ray.9 Damua, Dhanora, Jamai, Kukshi, Namli, Pithampur, Sailana, and Tamia.10 Damua, Dhanora, Namali and Tamia.11 Damua, Dhanora, Jamai, Kukshi, Sailana and Tamia.12 Damua, Dhanora, Kukshi, Pithampur and Sailana.13 Computerised ECG machine, ECG machine ordinary, 12 channel stress ECG test
Essentialinvestigationfacilities were notavailable in districtsas well as CHC levelNCD clinics
Due to shortage ofbuildings andequipment cardiaccare unit could not bestrengthened
Audit Report on General and Social (Non-PSUs) Sectors for the year ended 31 March 2014
80
2.5.6.5 Shortage of essential drugs
As per the guidelines, 38 types of drugs for Diabetes, CVD and Stroke (DCS)component and 22 types of drugs for Cancer component were to be madeavailable at District NCD clinics. We observed that 29 to 45 per cent drugsunder DCS component and 91 to 100 per cent drugs under Cancer componentwere not available in the three test-checked District NCD clinics (detailed inAppendix 2.39). Thus, District NCD clinics were not fully equipped to providespecialised health care services to the NCD patients.
In the exit conference, Principal Secretary stated (November 2014) thatremaining drugs would be made available to the District NCD clinics.
2.5.6.6 Tertiary Cancer Centres (TCCs) for specialised Cancer careIn view of developing regional referral cancer centres to provide specialisedcancer care including training and research facilities in all types of Cancer,Government Medical Colleges/ District Hospitals/ Government Institutionswere to be identified by the State Government for providing financialassistance under TCC Scheme. We observed that during the period 2011-14,no hospital or health institution was identified by the State NCD cell as TCC.Hence, the objective of providing specialized treatment was not achieved.
In the exit conference, Principal Secretary stated (November 2014) thatidentification of a TCC in Vidisha District was in progress.
2.5.6.7 Capacity building of human resourcesAs envisaged in the guidelines, NCD cells were to be supported by contractualstaff at State and district levels. We noticed that against the requirement offour posts14, no staff was deployed at State NCD cell.
Further, one post each of District Programme Officer (DPO), ProgrammeAssistant, Finance cum Logistic Officer and Data Entry Officer was requiredfor each District NCD Cell. We noticed that the posts of the DPOs in Dhar andRatlam Districts and the posts of Programme Assistant in Chhindwara, Dharand Ratlam Districts were lying vacant.
As per the guidelines, additional staff was to be recruited on contract basis tomanage District and CHC NCD clinics. The position of man power in fivedistricts and 45 CHCs was as under:
Table 2 Men in position at various levelsSl. No. Name of post Required as per
It would be seen from the above that there was 85 per cent shortage ofmanpower at District NCD clinics and 81 per cent shortage in CHC level NCDclinics. Moreover, all the posts of specialists and doctors in the district levelclinics and the post of doctors in 44 CHC level clinics were lying vacant.
Acute shortage of specialists/doctors and para-medical staff in the clinicsadversely impacted the implementation of the programmes.
In the exit conference Principal Secretary confirmed the fact and stated(November 2014) that a timeline for deployment of human resource has beendecided and would be completed up to December 2014.
All vacant posts may be filled up expeditiously so that the health care servicescould be provided at health facility centres.
2.5.7 Implementation of NPHCE
To achieve the objectives of NPHCE, strategies to be undertaken werecommunity education and public awareness, expansion of treatment facility,capacity building of the medical and paramedical professionals and continuousmonitoring of the programme.
2.5.7.1 Community education and public awareness
The NPHCE guidelines also envisaged generation of public awareness asrequired under the programme NPCDCS. However, no IEC material wasreceived from Central NCD Cell and the IEC activities were not carried out asalready discussed in paragraph 2.5.6.1
2.5.7.2 Training for capacity building not conducted
As per para 2.3.6 of NPHCE guidelines, plan for training of personnel ofvarious facilities under the programme was to be prepared by the State NCDCell detailing training institutions, duration, broad curriculum etc. Weobserved that due to non-posting of manpower, only 1391 personnel wereimparted training during 2012-14 against 3225 personnel planned. Details arein Appendix 2.40. Hence, against the available funds of ` 37.88 lakh during2012-14, only ` 16.59 lakh could be utilised.
In the exit conference, Principal Secretary confirmed the fact and stated(November 2014) that as per guidelines Medical Colleges and otherinstitutions would be identified for imparting training.
2.5.7.3 Non-availability of Geriatric Wards and Clinics
According to the guidelines, 10 bedded geriatric ward for in-patient care of theelderly people was to be established in each District Hospital (DH) andseparate geriatric clinic was also to be established at each DH, CHC and PHC.For this purpose, against the available fund of ` 3.40 crore in 2012-14, only` 1.31 crore were utilised. We noticed that out of three test-checked districts,
Only 1391personnel wereimpartedtraining against3225
Geriatric wardsand clinics werenot established indistricts and CHCslevel NCD clinicsfor elderly people
Audit Report on General and Social (Non-PSUs) Sectors for the year ended 31 March 2014
82
geriatric ward and clinic were not established in Dhar District Hospital.Geriatric clinic was not established in eight out of nine test-checked CHCs andin any of the 16 test-checked PHCs.
Further, rehabilitation unit for physiotherapy and counselling was also notavailable in eight out of nine test-checked CHCs. Callipers and supportivedevices were also not issued to ANMs for providing to elderly people in sevenout of 16 test-checked PHCs. (detailed in Appendix 2.41).
Thus, dedicated health facilities/services were not established in terms of theprogramme for treatment of elderly people.
2.5.7.4 Shortage of manpower
Guidelines provided that in case of scarcity of specialists in geriatric field, theservices of existing specialists in various fields like General Medicine,Orthopaedics, Ophthalmology, ENT etc. were to be utilised for managingGeriatric Clinic and Wards of DHs. Additional staff viz. Medicine consultant,Nurse, Physiotherapist etc. was also to be recruited on contractual basis. Wenoticed that against the requirement of 39 additional staff in the three test-checked DH, there was shortage of 24. Further, out of nine test checked CHCsRehabilitation Worker was not posted in eight CHC15, as detailed inAppendix 2.42.
2.5.7.5 Annual check-up of elderly people
As envisaged in guidelines, annual check-up of all the elderly people at villagelevel was to be organized by PHC/CHC in health check-up camps andinformation was to be updated in Standard Health card for the elderly people.
We have noticed that annual check-up of elderly people was not conducted inany of the nine test-checked CHCs and 1516 out of 16 test-checked PHCs.
2.5.8 Supervision and monitoring under NPCDCS and NPHCE
The Central NCD Cell prescribed standard formats for recording and reportingby various health centres, District and State NCD Cells. A ManagementInformation System was also to be developed to computerize the information.Review meetings at State level were to be organised on quarterly basis todiscuss constraints in implementation of the programme.
We observed that reporting was being done from SHC to CHC, CHC toDistrict NCD Cells and district to State NCD Cell. However, only number ofpatients screened and suspected cases were being reported in these formats.Total number of patients treated, details of patients for whom follow-up,physiotherapy, home based care and counselling was provided at NCD clinicswere not being reported. The quarterly review meetings at State level werealso not organised and the quarterly reports were not sent to Central NCDCell.
In the exit conference (November 2014) Principal Secretary Stated thatprescribed mechanism as per guidelines would be followed.
Dungaria, Haldi, Hanotia, Nalchha, Sagore, Sharvan and Shivgarh.
Chapter 2 : Performance Audit
83
Prescribed mechanism for supervision and monitoring may be followed toensure effective and efficient implementation of the programmes.
2.5.9 Conclusion
Annual Action Plan for NPCDCS and NPHCE programmes anddatabase on physical, financial and epidemiological profile was not preparedat State and district levels.
Information, Education and Communication for general awareness ofthe non-communicable diseases were not carried out at State and districtlevels.
There were shortages of geriatric wards, clinics, essential drugs,machinery and equipment in NCD clinics mainly due to under-utilisation offunds.
Due to non-deployment of medical and para-medical staff, health careservices could not be provided efficiently under the programmes.
Audit Report on General and Social (Non-PSUs) Sectors for the year ended 31 March 2014
84
School Education Department
2.6 Implementation of Tribal Sub-Plan under Education Sector
2.6.1 Introduction
Tribal Sub Plan (TSP) was initiated by the Government of India (GoI) duringthe Fifth Five-Year Plan period. TSP is seen as critical in bridging thedevelopment gap between the ST people and others, with direct plan resourcesacross the Union Ministries and Departments in the States at least inproportion to the ST population. For Education Sector, GoI allotted fundsunder TSP for implementation of Sarva Shiksha Abhiyan (SSA), NationalProgramme of Mid Day Meal (NPMDM) and Rashtriya Madhyamik ShikshaAbhiyaan (RMSA) in Madhya Pradesh.
The SSA was introduced (2003) for implementation of Universal ElementaryEducation (UEE) for children in the age group of 06-14 years with greateremphasis on girls. Primary and Upper primary level education is providedunder this Programme. The NPMDM was introduced (1995) for providingnutritional support and increasing attendance of children in schools. RMSA(launched in 2009) was implemented to widen the secondary level educationwith emphasis on enrolment of girls, Schedule Caste (SCs) and ScheduledTribe (STs) in the age group of 14-18 years.
The Commissioner, Rajya Shiksha Kendra (RSK) is the Mission Director ofSSA and is responsible for implementation of SSA at State level. At thedistrict level, the District Programme Co-ordinator (DPC) under thesupervision of District Collector as District Mission Director (DMD) andChief Executive Officer (CEO) as District Project Director (DPD) implementthe SSA. Besides, the Block Resource Centre Coordinator (BRCC) at blocklevel and the Cluster Resource Centre Coordinator (CRCC) at village level arealso involved in implementation of SSA.
At State level NPMDM is implemented by the Madhya Pradesh MadhyanBhojan Karyakram Parishad Samiti (MPMBKPS) headed by theDevelopment Commissioner, who is assisted by CEO, Zila Panchyat (ZP) atdistrict level.
The Commissioner, Madhya Pradesh Madhyamik Shiksha Abhiyan Samittee(MPMSAS) is the Mission Director of RMSA, and is responsible forimplementation of RMSA at State level. At District level, the DPC (RMSA)implemented the programme under the supervision of District Collector andCEO (ZP).
2.6.2 Audit objectives
The audit objectives were to ascertain whether:
the Schemes were planned as per the guidelines issued by GoI;
funds provided by the Central and State Governments were fullyutilised in the tribal districts;
Chapter 2: Performance Audit
85
the Schemes for primary, upper primary and secondary education wereimplemented in conformity with the approved Plans; and
infrastructure development was adequate.
2.6.3 Scope and coverage of audit
For the Performance Audit, 10 districts1 out of 21 tribal districts and their 21blocks2 out of 88 tribal blocks were test checked covering the period 2011-14.Eighty four schools3 of selected 21 blocks were test-checked. For SSA, weaudited records of Commissioner, RSK and DPCs. For NPMDM, the Schoolsselected for SSA were examined for NPMDM as well and we audited recordsof Commissioner, NPMDM and CEOs of ZP. For RMSA, records ofMPMSAS and DPCs (RMSA) were test checked and one High School (HS)and one Higher Secondary School (HSS) of each selected district were test-checked. Details are shown in Appendix 2.43.
During the entry conference held (June 2014) the audit objectives, criteria andcoverage were discussed with the Commissioner, RSK and Secretary,Panchyat and Rural Department for NPMDM and Joint Director of PublicInstruction and Joint Director of RMSA. The exit conference was held(November 2014) with the Additional Chief Secretaries (ACSs) of SchoolEducation Department (SED) and Panchayat and Rural DevelopmentDepartment (PRDD). The views of the Department have been incorporated inthe relevant paragraphs.
Audit findings
2.6.4 Financial management
For the Schemes, the Central and State Governments released funds separatelyfor General Head, Tribal Sub-Plan (TSP) and Scheduled Caste Sub-Plan(SCSP). However, during execution, these separate funds were mixed in acorpus funds of the schemes. Further, funds under SSA and RMSA werereleased to districts without earmarking as General Head, TSP and SCSP. As aresult, separate records of expenditure under TSP were not maintained at anylevel. However, under the NPMDM, TSP funds were released separately tothe districts.
Year-wise expenditure against available funds under these schemes is given inAppendix 2.44. We observed the following:
During the period 2011-14, total available fund under SSA was` 12,191.07 crore (including opening balance of ` 2404.60 crore as on1st April 2011). Out of which ` 10,304.19 crore was utilised, leaving anunspent balance of ` 1886.88 crore (15 per cent). The overall utilisation offunds during the period 2011-14 was ranged from 63 to 72 per cent. Hence,optimum utilisation of available financial resources could not be ensured.
3 Two primary schools and two upper primary schools in each block.
The released fundswere not earmarkedas General, SCSPand TSP under SSA.Funds were not fullyutilised under SSA,RMSA and NPMDM
Audit Report on General and Social (Non-PSUs) Sectors for the year ended 31 March 2014
86
Funds provided for TSP component were ranged from 18 to 20 per cent of thetotal funds. But due to non-maintenance of separate accounts, expenditureagainst the TSP funds could not be ascertained.
Under the NPMDM, annual accounts were not prepared by the MDMParishad, hence, opening/closing balance and other receipts were notprovided to audit. However, against the total available Central and State shareof ` 3031.95 crore, expenditure of ` 3041.24 crore was incurred as per thestatement of expenditure of the MDM Parishad. Under the scheme, separateaccounts for TSP funds was maintained. We observed only 83 per cent of TSPfunds could be utilised against the available funds during 2011-14.
We noticed that during the period 2011-14, total available fund underRMSA was ` 1601.02 crore (including opening balance of ` 76.99 crore as on1st April 2011). Out of which ` 1484.01 crore was utilised, leaving an unspentbalance of ` 117.01 crore (seven per cent). Release of funds by GoI for TSPcomponent for the years ranged between 5 and 14 per cent. But, due to non-maintenance of separate accounts, expenditure against the TSP funds couldnot be ascertained.
In the exit conference, the ACS (SED) stated that the savings under SSA weredue to excess release of funds by the GoI. In respect of RMSA, the ACS(SED) stated that savings were due to code of conduct for elections duringOctober 2013 to December 2013 and March 2014 to May 2014.
The Government’s reply in respect of unspent balances is not acceptable asthere was a window of three months in between the periods of code of conductin which funds could have been released/utilised.
Optimum utilisation of funds may be ensured under each component.
2.6.5 Planning
As envisaged in the guidelines of NPMDM, overall planning, implementationand monitoring of the different activities and achievement of physical andfinancial targets planned under these programmes was to be done at Statelevel as well as district level. In this regard, following shortcomings werenoticed in audit:
We observed that during the period 2011-14, submission of Annual WorkPlan and Budget (AWP&B) by MDM Parishad to MHRD was delayed by 39to 45 days, which caused delay in approval of AWP&B and release of fundsas well. Details shown in Appendix 2.45.
In the exit conference, the ACS (PRDD) stated that the time schedule wouldbe adhere to in future.
The Annual Work Plans and Budget may be prepared and submitted timely sothat funds could be timely released.
Programme Implementation
2.6.6 Sarva Siksha Abhiyaan (SSA)
The goals of the SSA are (i) enrolment of all children in school, (ii) retentionof all children till the upper primary stage by 2010 and (iii) bridging of genderand social category gaps in enrolment, retention and learning etc.
The AWP&B werenot submittedtimely underNPMDM
Chapter 2: Performance Audit
87
2.6.6.1 Out of school children
Guidelines of SSA and RTE Act stipulate that every child in the age group of6 to 14 shall have free and compulsory education in a neighbourhood school.As per the norms specified in SSA framework, special training facility shallbe provided for ‘out of school’ children in order to bring them into themainstream.
We observed that at the State level ‘out of school’ children during the years2011-12 to 2013-14 ranged between 0.03 per cent and 0.90 per cent. Detailsare shown in the table-1 below:
Table-1: Statement showing the position of ‘out of school’ children at State level(Number of children in lakh)
Similarly, in the 21 Tribal districts in the State, percentage of ‘out of school’children during the years 2011-12 to 2013-14 ranged between 0.68 and 1.34per cent. In 10 selected districts it ranged between 0.75 and 1.28 per cent.Details are given in table-2 below:
Table-2: Statement showing the position of ‘out of school’ children in 21 Tribal districtsand 10 selected districts
(Number of children in lakh)
(Data Source: AWP&B of Rajya Shiksha Kendra)
It would be seen from the above table that in 21 tribal districts, the number ofchildren brought into mainstream during 2011-12 was only 0.16 lakh (24 percent) and during 2013-14, it was only 0.20 lakh (61 per cent). Thus, 13,000children could not be brought into mainstream as of March 2014. Similarly, in10 selected districts, only 0.12 lakh children (33 per cent) during 2011-12 and0.11 lakh children (52 per cent) during 2013-14 were brought intomainstream.
2.6.6.2 Drop out of ST students in selected schools
According to information furnished by 84 test-checked primary and upperprimary schools of 10 selected districts, total 49,291 students were enrolled inschools during the period 2011-14, out of which 33,722 (68 per cent) wereSTs. As reported by the schools total 689 students dropped out, of which 619were of ST students (90 per cent of total dropped out students). Thus, drop outrate among the ST children was higher than that of all categories of children.Details are given in Appendix 2.46.
In the exit conference, the ACS (SED) stated that the process of entering the‘out of school’ children into the mainstream was in progress through “SchoolChalein Hum” was in progress.
Year 21 Tribal districts 10 selected districtsNo. ofChildren
All ‘out ofschool’ childrencould not bebrought intomainstreamduring the period2011-14
Audit Report on General and Social (Non-PSUs) Sectors for the year ended 31 March 2014
88
2.6.6.3 Non-rationalisation of teachers
The Section 19 of the RTE Act, 2009 prescribed norms for posting of teachersin Primary Schools4 and Upper Primary Schools5. The pupil-teacher ratioshould be 40:1 for the schools having more than 200 students.
In 10 selected districts, we observed that 4227 Primary Schools (PSs) teachersand 931 Upper Primary School (UPSs) teachers in 3474 PSs and 882 UPSsrespectively were declared surplus by the RSK. We noticed that expenditureof ` 2.58 crore6 was incurred every month on account of salaries of thesesurplus teachers.
In the exit conference, the ACS (SED) stated that the Government has issuedan order (September 2014) for rationalisation of teachers.
The reply is not acceptable because in view of fixed sanctioned strength ofteachers, the position of surplus teachers may affect the prescribed pupilteacher ratio.
2.6.6.4 Availability of infrastructure
As per SSA guidelines, position regarding availability of infrastructure i.e.number of schools without classrooms, drinking water facilities, toilet facility,girls’ toilets, access ramps, boundary wall, gap in classrooms and number ofUPSs without Head Master (HM) rooms etc. was to be included in the plan toassess the gap in school infrastructure.
Scrutiny of records and information in respect of 29,939 Schools in 10selected districts revealed non-availability of basic amenities andinfrastructure in the schools as shown in Table-3 below. District-wise detailsare given in Appendix 2.47.
Table-3: Statement showing the position of infrastructure
Thus, non-availability of basic amenities affected the retention rate ofchildren.
In the exit conference, the ACS (SED) stated that water sources will beprovided through Rural Drinking Water Scheme. Construction of toiletswould be done from the funds of Member of Parliament/Member ofLegislature Assembly and GoI sanction for furniture was awaited.
4 PS: up to 60 pupil: 2 teachers, from 61-90 pupil: 3 teachers, from 91-120 pupil: 4teachers, 121-200 (5 teachers).
5 UPS: At least one teacher for 35 pupil.6 As per MER, per month salary of a teacher is at least ` 5000 and on this basis
calculation was done. (minimum salary @ ` 5000 x 5158 teachers=` 2,57,90,000).
There was non-availability of basicamenities invarious PSs/UPSs
Reply is not acceptable since infrastructure was lacking despite significantunspent funds under SSA, indicating lack of planning.
The availability of infrastructure in schools may be ensured so as to improveenrolment and retention of students.
2.6.6.5 Distribution of text books
As per SSA guidelines, free textbooks were to be provided to all the childrenof Government/Local Body schools. We randomly selected two classes eachof 71 schools and four KGBVs for scrutiny of distribution of test books.Analysis of the information provided to Audit revealed that prescribed set ofbooks for class I to VIII were provided to all the students.
2.6.7 National Programme for Mid Day Meal (NPMDM)
The NPMDM is implemented with the aim of universalisation of education,improve nutritional health standard of the children by providing cooked mealand to increase retention and attendance and reduce dropout rate of children.
During scrutiny of the Annual Work Plans for the years 2011-12 to 2013-14we observed that all students who attended schools were served MDM underthe Scheme. No shortfall in providing the MDM was noticed in the testchecked schools. During 2011-12, 2012-13 and 2013-14 the number ofstudents covered under NPMDM in the 10 test-checked districts was 20.10lakh, 18.66 lakh and 18.27 lakh respectively. District-wise details are given inAppendix 2.48.
2.6.7.1 Delay in construction of Kitchen-cum-store
We observed that out of 10 selected districts, in four districts7 MDM Parishaddid not release the allotted funds (` 7.61 crore) during the year 2012-13,despite receipt of the Central funds in September 2012. The amount wasreleased in May 2013. As a result, construction works of 376 kitchen-cum-stores8 in four districts were not completed up to March 2014.
We also observed that out of 84 selected schools in 10 districts, store-roomswere not available in 30 schools, drinking water facility was not available insix schools and the required number of utensils was not available in 28schools, as shown in table-4 below:
Table-4: Statement showing the position of non-availabilityof infrastructure under MDM
8 Balaghat: 100, Betul: 46, Chhindwara: 118 and Dindori: 112.
There was delay inrelease of fund forconstruction ofKitchen-cum-store
Audit Report on General and Social (Non-PSUs) Sectors for the year ended 31 March 2014
90
In the exit conference, the ACS (PRDD) stated that the delay was due toopening of new Accounting Head of construction of Kitchen-cum-Store. Thefunds would be released soon to the districts for purchasing the utensils.
Availability of infrastructure under NPMDM may be ensured for delivery ofmid day meal.
2.6.8 Monitoring and Evaluation
As per NPMDM guidelines, the State fixed monthly targets for inspection ofMDM served in schools by ZP level. Feedback received through theinspection reports were to be analysed by MPMBKPS. On an average, 25per cent of the PSs were to be visited every quarter.
In the selected 84 schools only 885 inspections were carried out during 2011-14 against the required 3024 inspections. Thus, there was shortfall of 2139inspections (71 per cent). It was also noticed that no evaluation study wasconducted by any other agency in the test-checked school.
Further, as per the guidelines of NPMDM, State level Steering cumMonitoring Committee headed by Development Commissioner andAdditional Chief Secretary and Vice-President of MPMBKPS was required tobe set up to oversee the implementation of the Scheme. As per the instructionsissued (August 2010) by GoI, the meetings of the Steering Committee at Statelevel were to be held at least once in six months.
The records of the State level committee showed that only one meeting washeld each year during 2011-12 and 2012-13. Thus, monitoring of the Schemeimplemented at State level was not adequate.
The ACS (PRDD) stated that instructions for conducting the inspectionswould be re-issued to the ZPs and the GoI instructions for conducting meetingof Steering Committee would be complied with in future.
2.6.9 Rashtriya Madhyamik Shiksha Abhiyaan (RMSA)
The main objective of the scheme RMSA is to make good quality educationavailable, accessible and affordable to all young person in the age group of14-18, so as to ensure Universal Secondary Education by 2017.
2.6.9.1 Non-availability of secondary schools
Under RMSA, State was to provide High Schools within reasonable distanceof five km and Higher Secondary Schools within 7-10 km.
Scrutiny of records revealed that out of 19409 habitations, 13438 habitationswere covered with HSs and 1970 (13 per cent) habitations were without HSswithin a distance of five km radius, as of March 2014. Information was notprovided by two districts, namely, Balaghat and Khargone. Details are shownin table-5 below:
There was shortfallin inspections ofschools upto 71per cent
There was non-availability of HSsin 1970 eligiblehabitations.
Chapter 2: Performance Audit
91
Table-5: Statement showing the position of non-availability of secondary schools
In the exit conference, ACS (SED) accepted the audit observation and statedthat a huge gap persists in access. GoI has not approved new schools since2012-13.
2.6.9.2 Monitoring
As envisaged in Para 9.1.1 of RMSA Framework, the School Managementand Development Committee (SMDC)/ Gram Sabha and Gram Panchayat wasto monitor the progress of implementation of the scheme at school level.
According to the information furnished by 20 selected schools of ten districts,16 schools stated that no monitoring was conducted by the SMDC/GramPanchayat. Though, two schools of Balaghat and Dhar districts stated thatmonitoring was done by SMDC, the related records were not furnished. Twoschools of Dindori and Khargone districts did not give reply.
In the exit conference, ACS (SED) replied that Programme implementationand outcome indicators were being monitored on regular basis. Facts remainsthat there was lack of monitoring on the part of the SMDC/ Gram Panchayat.
2.6.10 Conclusion
Optimum utilisation of funds was not ensured and persistent savingsduring the period 2011-14 was observed in SSA, RMSA and NPMDM.
Preparation of Annual Work Plan and Budget of NPMDM andsubmission to GoI for approval was delayed affecting timely release ofCentral funds.
Despite implementation of SSA, there were 33,000 ‘out of school’children; of them 13,000 could not be brought into mainstream during the year2013-14 in the tribal districts. In the test-checked schools drop out rate of STchildren was higher than that of the total children of all categories.
Availability of basic amenities and infrastructure such as drinkingwater, girl toilets, utensils, furniture in schools was inadequate under SSA andNPMDM.
Under RMSA, 13 per cent habitations were not covered with highschools within the radius of five kilometres as of March 2014.