12 Chapter 2 Project Area Description General Summary Entire Watershed Most of the watershed is level to gently rolling agricultural lands. Row cropping is the predominate agricultural use. Soils consist mostly of poorly drained to moderately well drained silty clays and silty clay loams. The watershed is nearly all privately owned except for state owned Wildlife Management Areas. Land Adjacent to River The upper and lower reaches are generally more rolling and transitional, while the middle section of the watershed has little slope and dominated by floodplain and wetlands. Channelization of the main channel is present in this section. Much of the floodplain is used for pasturing cattle. The lower portion of the river (mi. 18-0) flows through a forested valley as it drops into the MN River valley. All lands adjacent to the river are in private ownership. Little Cottonwood River and Middle Minnesota Major Watershed The Middle Minnesota Basin covers 1,347 square miles in parts of 8 counties in South Central Minnesota. The basin ranks sixth in area of the twelve major watersheds supplying the Minnesota River. The Middle MN River Watershed defines a large irregular-shaped area that drains into the MN River through a number of relatively small streams, seeps and small springs. The Middle MN and Little Cottonwood River (LCR) minor watershed differ from most of the other watersheds of the MN River basin in that they are defined more by the main stem of the Minnesota than by any particular tributary. That makes this basin somewhat unique; the rest of the 11 basins all have identifying dendritic rivers. This unique feature of the watershed can pose difficulty in making water quality assessments and implementation since there are a large number of first and second order streams. The LCR watershed is a part of the Middle MN River basin and drains a thin strip of land along the LCR River. The LCR watershed comprises 170 of the 1,347 square miles or 13% of the Middle Minnesota Major Watershed. Map 2 shows the LCR watershed in relation to the state of Minnesota, Minnesota River Basin and, Middle Minnesota Major Watershed. The Little Cottonwood is classified as an agricultural river by the Department of Natural Resources. Besides the Little Cottonwood, covering parts of Brown, and Cottonwood County, the Middle Minnesota includes parts of Redwood, Renville, Sibley, Nicollet, Le Sueur, and Blue Earth counties, as well as direct-to-main stem drainage in northern Brown County. Originating near the town of Jeffers in Cottonwood County, the LCR, the largest tributary of the Middle Minnesota Major Watershed, flows for over 50 miles in a northeasterly direction before confluence with the MN River seven miles south of New Ulm. The LCR drains the NE section of Cottonwood Co. and the south-central section of Brown Co. A very small portion of the watershed, near the mouth lies within Blue Earth Co. Table 1 gives specific watershed characteristics.
Transcript
12
Chapter
2 Project Area Description
General Summary Entire Watershed
Most of the watershed is level to gently rolling agricultural lands. Row cropping is the predominate agricultural use. Soils consist mostly of poorly drained to moderately well drained silty clays and silty clay loams. The watershed is nearly all privately owned except for state owned Wildlife Management Areas.
Land Adjacent to River The upper and lower reaches are generally more rolling and transitional, while the middle section of the watershed has little slope and dominated by floodplain and wetlands. Channelization of the main channel is present in this section. Much of the floodplain is used for pasturing cattle. The lower portion of the river (mi. 18-0) flows through a forested valley as it drops into the MN River valley. All lands adjacent to the river are in private ownership.
Little Cottonwood River and Middle Minnesota Major Watershed
The Middle Minnesota Basin covers 1,347 square miles in parts of 8 counties in South Central Minnesota. The basin ranks sixth in area of the twelve major watersheds supplying the Minnesota River. The Middle MN River Watershed defines a large irregular-shaped area that drains into the MN River through a number of relatively small streams, seeps and small springs. The Middle MN and Little Cottonwood River (LCR) minor watershed differ from most of the other watersheds of the MN River basin in that they are defined more by the main stem of the Minnesota than by any particular tributary. That makes this basin somewhat unique; the rest of the 11 basins all have identifying dendritic rivers. This unique feature of the watershed can pose difficulty in making water quality assessments and implementation since there are a large number of first and second order streams.
The LCR watershed is a part of the Middle MN River basin and drains a thin strip of land along the LCR River. The LCR watershed comprises 170 of the 1,347 square miles or 13% of the Middle Minnesota Major Watershed. Map 2 shows the LCR watershed in relation to the state of Minnesota, Minnesota River Basin and, Middle Minnesota Major Watershed. The Little Cottonwood is classified as an agricultural river by the Department of Natural Resources. Besides the Little Cottonwood, covering parts of Brown, and Cottonwood County, the Middle Minnesota includes parts of Redwood, Renville, Sibley, Nicollet, Le Sueur, and Blue Earth counties, as well as direct-to-main stem drainage in northern Brown County.
Originating near the town of Jeffers in Cottonwood County, the LCR, the largest tributary of the Middle Minnesota Major Watershed, flows for over 50 miles in a northeasterly direction before confluence with the MN River seven miles south of New Ulm. The LCR drains the NE section of Cottonwood Co. and the south-central section of Brown Co. A very small portion of the watershed, near the mouth lies within Blue Earth Co. Table 1 gives specific watershed characteristics.
13
1
2 3
4
Minnesota River Watershed
Minnesota River BasinMiddle Minnesota Major WatershedLittle Cottonwood River Minor Watershed
90 0 90 180 Miles
Middle MN Major and Little Cottonwood Minor Watershed
14
Table 1: Watershed Characteristics
15
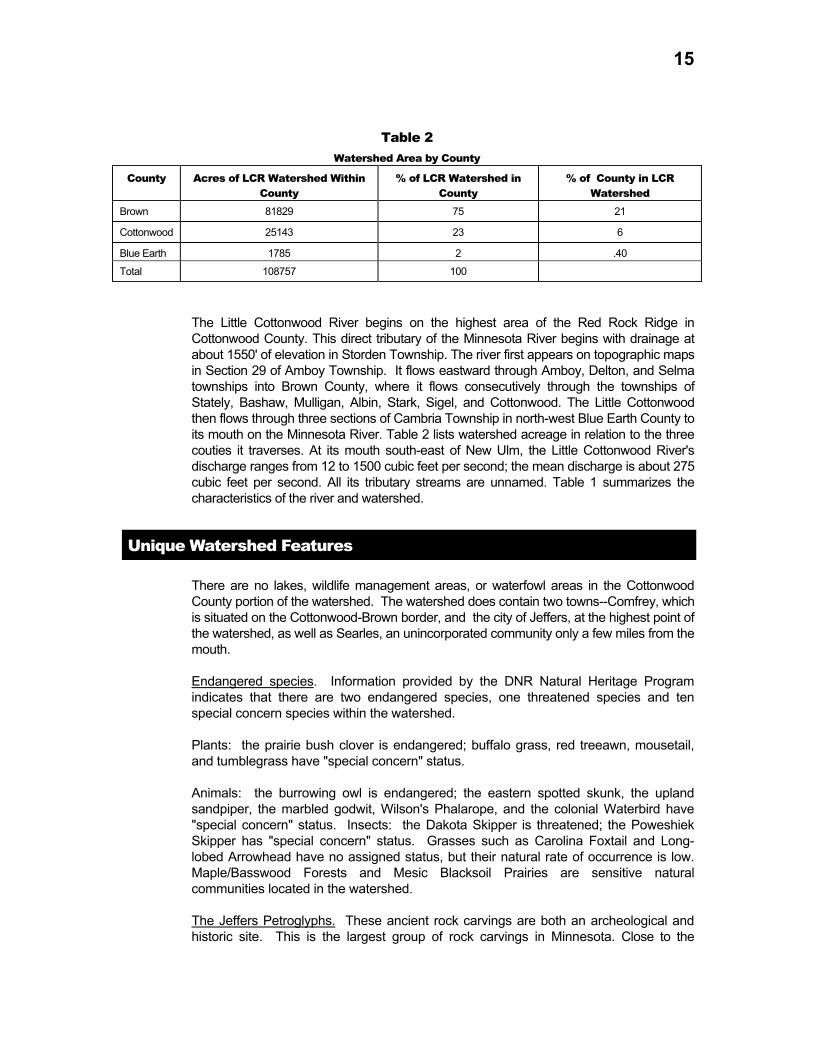
Table 2 Watershed Area by County
County Acres of LCR Watershed Within County
% of LCR Watershed in County
% of County in LCR Watershed
Brown 81829 75 21
Cottonwood 25143 23 6
Blue Earth 1785 2 .40
Total 108757 100
The Little Cottonwood River begins on the highest area of the Red Rock Ridge in Cottonwood County. This direct tributary of the Minnesota River begins with drainage at about 1550' of elevation in Storden Township. The river first appears on topographic maps in Section 29 of Amboy Township. It flows eastward through Amboy, Delton, and Selma townships into Brown County, where it flows consecutively through the townships of Stately, Bashaw, Mulligan, Albin, Stark, Sigel, and Cottonwood. The Little Cottonwood then flows through three sections of Cambria Township in north-west Blue Earth County to its mouth on the Minnesota River. Table 2 lists watershed acreage in relation to the three couties it traverses. At its mouth south-east of New Ulm, the Little Cottonwood River's discharge ranges from 12 to 1500 cubic feet per second; the mean discharge is about 275 cubic feet per second. All its tributary streams are unnamed. Table 1 summarizes the characteristics of the river and watershed.
Unique Watershed Features
There are no lakes, wildlife management areas, or waterfowl areas in the Cottonwood County portion of the watershed. The watershed does contain two towns--Comfrey, which is situated on the Cottonwood-Brown border, and the city of Jeffers, at the highest point of the watershed, as well as Searles, an unincorporated community only a few miles from the mouth.
Endangered species. Information provided by the DNR Natural Heritage Program indicates that there are two endangered species, one threatened species and ten special concern species within the watershed.
Plants: the prairie bush clover is endangered; buffalo grass, red treeawn, mousetail, and tumblegrass have "special concern" status.
Animals: the burrowing owl is endangered; the eastern spotted skunk, the upland sandpiper, the marbled godwit, Wilson's Phalarope, and the colonial Waterbird have "special concern" status. Insects: the Dakota Skipper is threatened; the Poweshiek Skipper has "special concern" status. Grasses such as Carolina Foxtail and Long-lobed Arrowhead have no assigned status, but their natural rate of occurrence is low. Maple/Basswood Forests and Mesic Blacksoil Prairies are sensitive natural communities located in the watershed.
The Jeffers Petroglyphs. These ancient rock carvings are both an archeological and historic site. This is the largest group of rock carvings in Minnesota. Close to the
16
headwaters of the Little Cottonwood River (near Jeffers), a spot on a ripple-marked and glacially striated quartzite ridge is covered with nearly 2,000 rock carvings, or petroglyphs, which apparently date from two periods, 3000 B.C. to A.D. 500 and A.D. 900 to 1750. The two major periods are the Late Archaic-Early Woodland Period (3,000 BC to 900 AD) and the Lake Woodland Period (900 AD to 1750).
The Jeffers Petroglyphs are one of only three well-preserved series of petroglyphs in Minnesota. Native prairie is also present near Jeffers. (Ojakangus, p. 230) The site contains nearly 2,000 carvings in the outcropping of Sioux Quartzite, known as the Red Rock Ridge. The carvings of animals, such as bison, rabbit, wolf, turtle and elk; human stick figures; and various weapons, such as spear points, arrowheads, axhands, and lances have been intensely studied by archaeologists and anthropologists.
Many of the known locations of above-mentioned threatened species can be found in areas such as Nature Conservancy Preserves, wildlife protection areas and the Jeffers Petroglyphs Historical Site, which are protected or managed by federal or state agencies. A section of native prairie, with wagon wheel ruts still observable, lies immediately west northwest of the petroglyph site.
To ensure the preservation of the site, the Minnesota Historical Society purchased the site in 1966; in 1970, the Minnesota Legislature appropriated funds for the construction of an interpretive center. This had fallen into disrepair; it was reconstructed in 1996.
The Petroglyphs State Historical Society Site, with Native American rock carvings and native prairie, is located in Delton, Section 9. This site includes several unique geologic conditions. The ancient carvings were painstakingly pecked into the Sioux Quartzite, yet petroglyph site visitors can also observe striations in the rock from glacial debris, as the Des Moines lobe of the Wisconsinian-age glaciers moved south-easterly across the Sioux Quartzite ridge. Ripple marks can also be observed here, showing that the deposition environment of the quartzite was a beach with gentle wave action.
The exposed rock outcrops create mini-climates quite different from the surrounding countryside. Prickly pear cacti can be found at the margins of the outcrops, where precipitation is quickly drained with resulting aridity conducive to this atypical vegetation.
At least three native prairie stands of grasses are preserved in the area included in this watershed. Two are managed by the State Historical Society; and one has been donated to the Nature Conservancy. The original vegetation includes several rare plants.
The watershed is steep in Cottonwood County, resulting in "flashy" stream flow conditions. After even moderate rainfall, the Little Cottonwood River rises quickly. There is a corresponding quick fall in river levels with the cessation of rain. The high ground of the Red Rock Ridge has been described as "weather-grabbing". Residents believe that this area is relatively wetter, windier, hotter in summer, colder in winter than the surrounding flatter areas. The outcrops and swiftly flowing river make the area especially scenic. As the river enters Brown County, in Section 34 of Stately Township, there are a series of cascades, composed of Sioux quartzite rock outcrops.
In Bashaw township, the Wildlife Management Area is part of the watershed, as is the city of Comfrey. County Ditches 28-I and 39 flow into the river in Mulligan Township. The flood plain in this area includes a number of wetlands. In Albin township, Gilman Lake outlets into the Little Cottonwood, and in Sigel Township, the Helget Braulick Wildlife Management Area is included in the watershed, as is the Joseph A. Tauer Prairie State
17
Scenic and Natural Area, and Lake Juni. In Cottonwood (South) Township, County Ditches 67 and 58, with influences from Omsrud Lake and the City of Hanska, join the River just upstream from the Searles Community. Three miles east of Searles is the Brown/Blue Earth County line. The Little Cottonwood River flows into the Minnesota River about two miles east of the county line, midway between Courtland and Cambria.
Surface Water Systems
In the Cottonwood County portion of the watershed, the Little Cottonwood River is the only consequential surface water system. The watershed contains no lakes or wetlands. No bodies of water in this watershed are classified under the MPCA water quality management system. There are no county parks, wildlife management areas, or waterfowl areas in the Cottonwood County portion of the watershed. The following tables describe the location and extent of the major drainage features.
Table 3 Little Cottonwood River Basin Minor Watersheds in Cottonwood County
ID # Outlet Stream Name Outlet Location T / R / S
Area (sq mi) Total
Area (sq mi) County
Order CSAW Number Stream / Watershed
28080 Little Cottonwood River
108/34/15 34.56 26.50 1 1-55-91/18-22-5
28081 Creek to Little Cottonwood River
108/34/15 7.86 0.08 1 1-55-91-6/18-22-4-1
28090 Creek to County Ditch 281
108/33/17 17.06 10.99 1 1-55-91-5-1/18-22-3-1-1
28097 Little Cottonwood River
108/33/17 15.53 1.80 2 1-55-91/18-22-4
Table 3 describes ditch systems in the LCR Watershed in Cottonwood County, including locations, miles of open ditch, underground tile miles, and cost comparisons.
After record rainfall in 1993, Judicial Ditch 7 BC flooded a substantial portion of the town of Comfrey. As a consequence of this flooding and Federal Emergency Management Agency (FEMA) flood remediation funding, ongoing work to remedy the problem is occurring with Area II, the DNR, and Brown and Cottonwood Counties.
Table 4 Little Cottonwood River Basin Ditches in Cottonwood County
Table 5 Little Cottonwood River Basin Minor Watersheds in Brown County
ID # Outlet Stream Name Outlet Location T / R / S
Area (sq mi) Total
Area (sq mi) County
Order CSAW Number Stream / Watershed
28080 Little Cottonwood 108/34/15 34.56 8.16 1 1-55-91/18-22-5 28081 Creek to LCR 108/34/15 7.86 7.78 1 1-55-91-6/18-22-4-1 28082 County Ditch 63 108/30/1 11.26 11.26 1 1-55-90-1/18-22-1-1 28083 Judicial Ditch 10 108/30/1 22.41 22.41 1 1-55-90/18-22-2 28084 Creek to LCR 109/31/32 7.24 7.24 1 1-55-91-4/18-22-2-1 28085 Little Cottonwood 109/31/32 32.96 32.96 3 1-55-91/18-22-3 28086 County Ditch 11 109/22/38 10.09 10.09 1 1-55-91-3/18-22-2-1 28087 Little Cottonwood 109/30/20 10.23 10.23 3 1-55-91/18-22-2 28088 County Ditch 68 109/31/28 7.11 7.11 1 1-55-91-2/18-22-2-1 28089 Creek to LCR 109/30/20 7.49 7.49 1 1-55-91-1/18-22-1-1 28090 Creek to CD281 108/33/17 17.06 6.07 1 1-55-91-5-1/18-22-3-1-1 28091 County Ditch 281 108/33/17 6.71 6.71 1 1-55-91-5/18-22-3-1 28057 Little Cottonwood 109/29/16 13.10 10.32 3 1-55-91/18-22-1 28048 Minnesota River 110/29/16 17.41 4.45 5 1-55/18/23 28096 Little Cottonwood 108/33/17 15.53 13.73 2 1-55-91/18-22-4
Brown County Judicial & County Ditch Maintenance
During an average year (1986), ditch maintenance costs in the Little Cottonwood River Watershed totaled $ 34,213; ditch improvement costs totaled $ 12,300. These figures calculate to a cost per mile of $ 1,006.26. These figures represent only 5% of total county maintenance and improvement costs for the watershed, which covers 28.4% of the county land area. Total area artificially drained in this watershed is 64.16 square miles.
19
Topography
Topography of watershed
A majority of the watershed is nearly level or gently sloping. The topography is steepest in the upper portion of the watershed where there are typically more slopes from the red rock ridge coteau. Land along the river is also steep as the river descends into the MN River valley. Map 3 is a Digital Elevation Model representing land slope within the watershed. Percentage of slope was reclassified into four categories. Both the land slope and shaded relief maps were derived from 30-meter resolution USGS Digital Elevation Models. Lighter shades of pink indicate areas within the watershed where there is little to no slope. The red to dark red areas indicate the highest slope classes.
Map 4 is a shaded relief map or hillshade. Hillshade is a hypothetical illumination of a surface for graphical display. The hill shade relief map also helps depict the flatter and steeper areas of the watershed.
20
$Z
$Z
$Z
$Z
Minorsheds
Little Cottonwood River$Z Water Quality Monitoring Sites
00-33-6>6
Slope ClassesDigital Elevation Model
Little Cottonwood River WatershedLand Slope
N
7 0 7 14 Miles
Map 3: Land Slope in watershed as percentage using USGS 30-meter resolution Digital Elevation Model.
21
$Z
$Z
$Z
$Z
Little Cottonwood River WatershedShaded Relief
Little Cottonwood River$Z Water Quality Monitoring Sites
N
5 0 5 10 Miles
Map 4: Shaded relief (hillshade) of the watershed.
22
Topography of river course
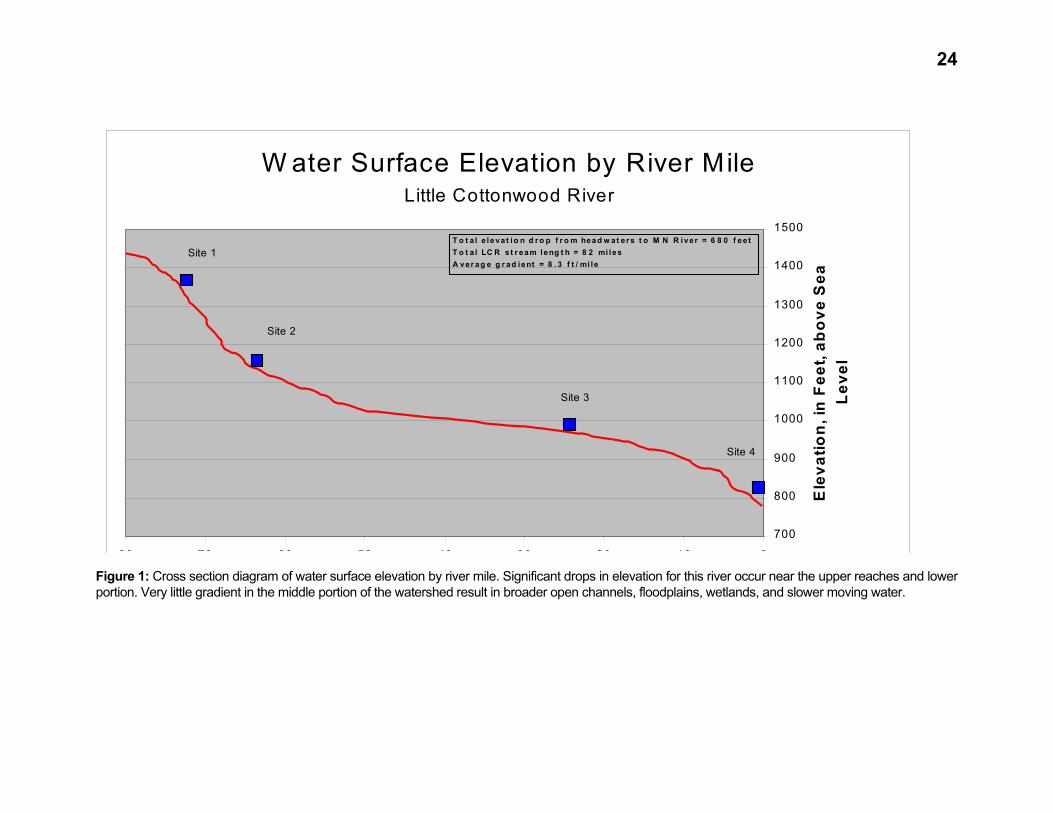
The LCR river is 82 miles long with the headwaters near the town of Jeffers in Cottonwood County. Elevation of the river starts at 1460’ and up until water quality monitoring site #1 the gradient is 10 feet/mile. See figure 1 for surface water elevation by river mile. As the river crosses under Highway 71 gradient increases to 22 feet/mile. In this area the river drops considerably compared to much of the course as it descends over Sioux Quartzite bedrock outcroppings (coteau). Between monitoring sites 2 and 3 the river topography declines substantially and has very little gradient. This portion of the watershed is mainly level with broad open channels and floodplain. Average gradients in the middle portion of the watershed is reduced to 5 feet/mile. As the river descends into the MN River valley, between sites 3 and 4, gradients increase slightly to 8 feet/mile. Elevation of the river at the mouth is 780’. Overall the river drops a total of 680 feet from the headwaters to the mouth with an average gradient of 8.3 feet/mile. Table 6 lists the elevations and gradients by site.
Table 6 River Elevation and Gradients by Water Quality Site
River Location Total drop in elevation
(feet)
Gradient
(Feet/mile)
Headwaters to site 1 ( mi. 81.6-75.2) 70 10
Site1 to site 2 ( mi. 75.2-65.4) 220 22
Site 2 to site 3 (mi. 65.4-26.9) 190 5 Site 3 to 4 (mi. 26.9-0) 180 8
AVERAGE GRADIENT 680 8.3
23
Brown Nicollet Cottonwood Water Board
River Gradients Between Water Monitoring SitesLittle Cottonwood River Watershed
1
2 3
4
N
Average gradient = 8.3 feet per mileTotal LCR stream length = 81.6 miles orTotal elevation drop from headwaters to mouth = LCR GRADIENT
Little Cottonwood River Watershed
Little Cottonwood River
S
Water Monitoring Sites$Z
Elevation Points ( 10-foot increments )
SS S
SSSSSSSSS
SSSSS
SSSSSSSSSSSSSSSS
S SS
SSS S
S S
SS
SS
S
S
S
S
SS
S
SSS S
S SSSSS SSS
SS$Z
$Z
$Z
$Z
LCR Gradient = 22 feet per mile
2
LCR Gradient = 5 feet per mile
3
LCR Gradient = 8 feet per mile
4
1LCR Gradient = 10 feet per mile
7 0 7 14 Miles
431,086 feet680 feet
24
W ater Surface Elevation by River MileLittle Cottonwood River
700
800
900
1000
1100
1200
1300
1400
1500
01020304050607080
Ele
vatio
n, i
n F
eet,
abo
ve S
ea
Lev
el
Site 1
Site 4
Site 2
Site 3
T o t a l e l eva t io n d r o p f r o m head w at er s t o M N R i ver = 6 8 0 f ee tT o t a l LC R s t r eam leng t h = 8 2 mi lesA ver ag e g r ad ient = 8 . 3 f t / mi le
Figure 1: Cross section diagram of water surface elevation by river mile. Significant drops in elevation for this river occur near the upper reaches and lower portion. Very little gradient in the middle portion of the watershed result in broader open channels, floodplains, wetlands, and slower moving water.
25
Climate e
The Little Cottonwood River Watershed is continental, with cold dry winters and warm wet summers. Climatic records from New Ulm, MN which is just North of the watershed show temperatures over the last 30 years ranged from a low of -37° F on January 24, 1981, to a high of 105°F on three separate occasions during the summer of 1988. Average monthly temperatures in New Ulm have ranged from 13.8° F in January to 73.9°F in July over the same period of record.
Annual precipitation rates average 26 inches in the Western portion of the watershed and up to 28 inches near in the lower reaches. Average annual runoff is estimated to be between 3-5 inches.1
Figure 2: Normal Average Annual Precipitation Rates (inches) (1961-1990 State Climatology Office)
Summary of Precipitation During Water Quality Monitoring Period
Analysis of precipitation data is important in any water quality monitoring study. Differences in annual precipitation levels within the watershed can result in large differences in the amount of runoff and consequently water quality. Therefore spatial and temporal characteristics are important factors to consider, especially when comparing water quality between monitoring years and watersheds. During the phase I diagnostic study precipitation information was gathered three ways.
At monitoring sites 2 and 3 total daily rainfall amounts were collected for parts of the monitoring season in 1998, 1999, and 2000. The information derived helped determine localized storm event intensities. Since rainfall amounts can differ widely throughout the watershed information gathered through a network of rain gage readers was also utilized. Located in each township, volunteers collected and reported total rainfall amounts. The results of that information can be seen in the appendix.
In addition to precipitation data at the monitoring sites and watershed townships, long-term rainfall data from the State Climatologic Office was used to further assess climatic differences within the watershed.
Historic rainfall data from State Climatologic Office was utilized from two locations just outside the watershed. The Springfield station is located approximately 15 miles North of the watershed between monitoring sites 2 and 3. The New Ulm station is located 10 miles Northwest of the watershed. This information was used to help compare rainfall frequencies between monitoring years and departures from normal.
1 Minnesota River, Basin Information Document, 1997, MPCA
26
Figure 3:
State Climatology stations
Springfield and New Ulm
Since the watershed is very long and narrow significant differences in precipitation exist in portions of the watershed. In general the eastern portion of the watershed south of Courtland receives an average of 3 to 4 additional inches of rainfall per year compared to the western reaches near Cottonwood County.
1998 and 1999
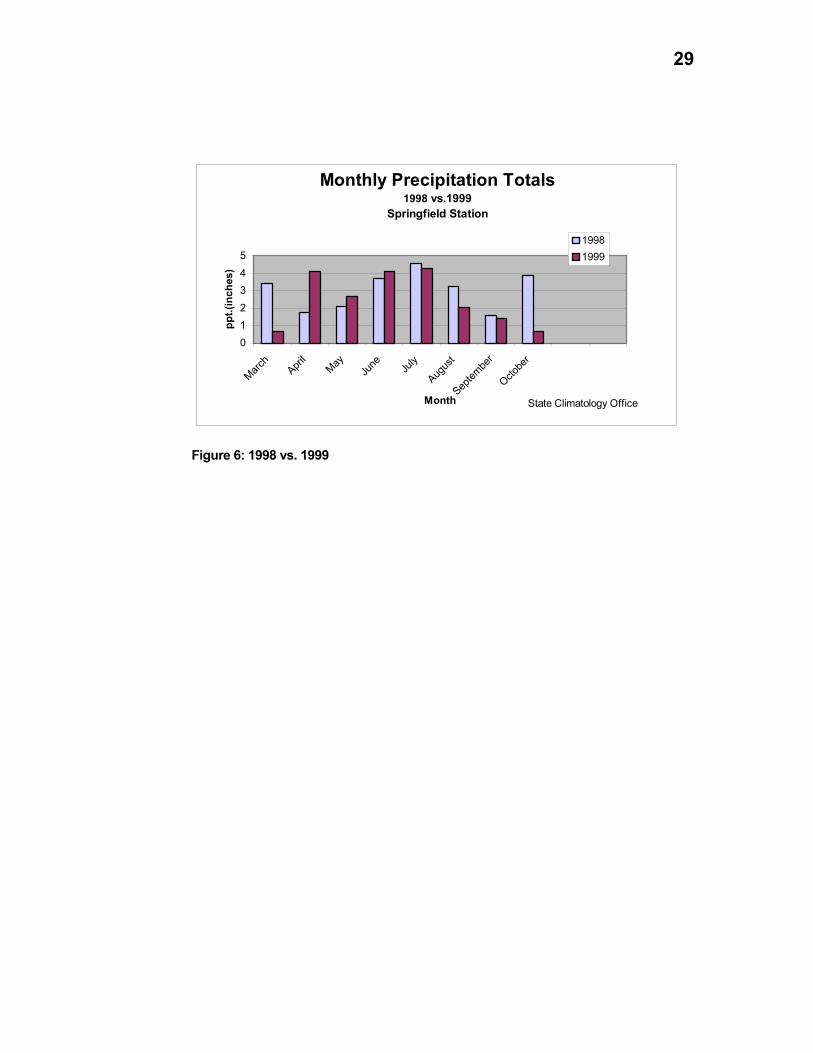
In summary the precipitation levels for the monitoring seasons fell slightly below average for both 1998 and 1999. Most of this deficit was attributed during the spring of 1998 and fall of 1999.
1999 and 2000
In late summer and early fall of 1999 near drought conditions resulted in a more than 4-inch difference in precipitation compared to 1998. Little precipitation continued throughout the late winter and spring season of 2000. This was especially significant in the western portion of the watershed. The very dry spring conditions of 2000 hinted to what seemed to be an impending drought year. Much of that changed in late May and June when rainfall deficits were balanced out by normal rainfall.
Despite the abnormalities during the spring and fall seasons of the monitoring years the period of June, July, and August neared normal for the 1999 water year.
For the 1999 growing season (April-September) as reported by township readers, precipitation in the vicinity of monitoring site 2 was approximately 6 inches less than the eastern portions of the watershed. Near and to the west of site 2 the total precipitation received was 12-13’ while near the lower reaches and towards the mouth 17-18” of rainfall was recorded during the growing season. Increasing precipitation from west to east is common in this watershed during normal years. This precipitation trend has been considered when analyzing the water quality data from the watershed.
$Z
$Z
$Z
$Z
1
2 3
4
Brown Co.
Cottonwood Co.
Nicollet Co.
SPRINGFIELD
NEW ULM
27
Monthly Precipitation TotalsNormal vs.1998
Springfield Station
00.5
11.5
22.5
33.5
44.5
5
March
April
MayJu
ne July
Augus
t
Septem
ber
Octobe
r
Month
ppt.(
inch
es)
Normal1998
State climatology data
1998 Springfield Station Precipitation
Figure 4: Normal vs. 1988
Normal is simply a 30 –year arithmetic mean computed once per decade. The normals presented in the graph above use the observation period 1961-1990. These values are the benchmarks to be used throughout the 1990’s and into the year 2000. New normals will be computed by the State Climatology Office in 2001 and will use data from 1971-2000.
28
Monthly Precipitation TotalsNormal vs.1999
Springfield Station
00.5
11.5
22.5
33.5
44.5
5
March
April
MayJu
ne July
Augus
t
Septem
ber
Octobe
r
Month
ppt.(
inch
es)
Normal1999
State climatology data
• 1999 Springfield Station Precipitation
Figure 5: Normal vs. 1999
29
Monthly Precipitation Totals1998 vs.1999
Springfield Station
0
12
34
5
March
April
MayJu
ne July
Augus
t
Septem
ber
Octobe
r
Month
ppt.(
inch
es)
19981999
State Climatology Office
Figure 6: 1998 vs. 1999
30
Figure 7: 1999 water year precipitation averages and departures from normal. Study area in yellow.
31
Land Use
Since the 1850’s the watershed has been transformed from open prairie and wetlands to an intensively developed agricultural area. Whereas the market for the products of the early farmers was limited to areas only about 30 miles away, much of the current agricultural production is marketed around the U.S and overseas. Roads on virtually every section line provide transportation routes2.
Cultivated crops are the predominant land use, with some pasture and occasional feedlots, small municipalities, and small forested areas. Land Use within the LCR watershed is primarily agricultural, accounting for approximately 89% of the land area. Two- year corn/soybean rotations comprise close to 90% of cropped lands within the watershed; small grains-oats, barley, wheat, peas, hay, and grasslands enrolled in the Conservation Reserve Program make up the majority of the balance.
Residential development is not common, but some year-round residential use is occurring within commuting distances of major cities. Current recreational use of these waters and adjacent lands is low. River miles 0 through 27.6 are classified for recreational canoeing during high water conditions. Although potential exists for additional development and recreation, water quality constraints and competing land uses, particularly agriculture, will inhibit expansions3. See Map 6 for Land use and land cover within watershed. Land cover is based on 1990 land use.
Table 7 1990 Land Use and Land Cover
Land use Acres % of Area
Cultivated Land 96670 89.0 Grassland 5543 5.1
Deciduous Forest 3820 3.5 Farmsteads and Rural Residences
1521 1.4
Urban and industrial 339 .31 Water 279 .26
Wetlands 253 .23 Other Rural Developments 151 .14
Grassland-Shrub-Tree (deciduous)
72 .07
Gravel Pits and open mines 28 .03
Transitional Agricultural Land 18 .02
Exposed Soil; Sandbars and Sand dunes
1.8 .00
Rural Residential Development Complex
.03 .00
2 Soil Survey, Brown County, USDA, 1988. 3 MDNR Fisheries Report, 1986
32
$Z
$Z
$Z
$Z
Brown Co.
Cottonwood Co.
Nicollet Co.
County
Tribu tariesLit tle C ottonwood Rive r
$Z Water Quality M onito ring S ites
Land us e/Land CoverCult iv ated LandDec iduous ForestExposed S oil; Sandbars and Sand DunesFarms teads and Rural ResidencesGras slandGras sland-S hrub-Tree (deciduous)Grav el Pits and Open MinesOther Rural DevelopmentsRural Residential Dev elopm ent ComplexTransit ional A gr icultural LandUrban and IndustrialW aterW etlands
Little Cottonwood River W atershed1990 Land Use
N
9 0 9 18 Miles
1
2 3
4
33
Soils
According to the University of Minnesota’s Department of Soil Water and Climate the lower Middle MN Major watershed is mainly comprised of wetter Blue Earth Till deposits. These deposits are a complex mixture of relatively flat (2-6%) well drained soils and very flat (0-2%) poorly drained soils. Soils within these deposits are generally loamy in texture. Artificial drainage to remove ponded water from flat and depressional areas is extensive in the far upper and middle portion of the watershed. Geomorphilogical composition of the LCR watershed is predominantly till plains. Most of the soils in the watershed were developed in glacial till, under tall grass prairie conditions and are of the Mollisol soil order.
Near the river in the upper and middle reaches alluvial deposits and coarser textured materials dominate. Water erosion potentials are moderate on 46% of the land within this geomorphic setting.
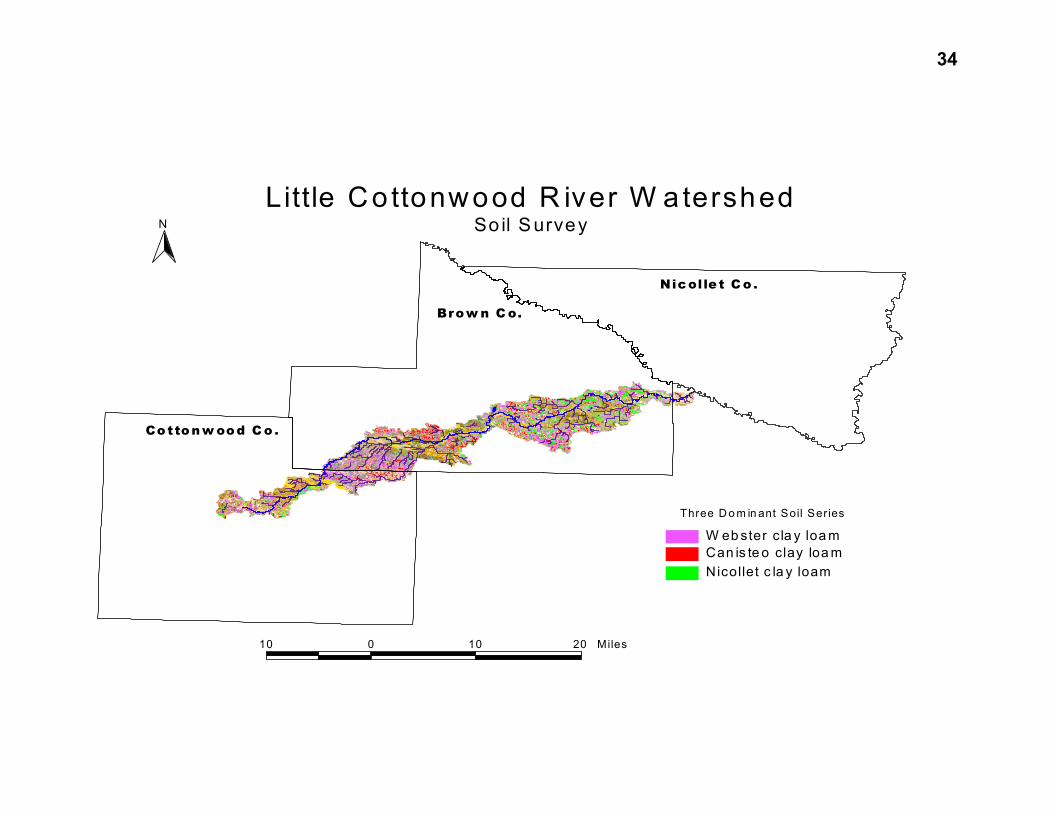
The three dominant soil series within the watershed are the Webster clay loam, Canisteo clay loam, and Nicollet clay loams. Together these soils comprise 30% of the watershed area. Map 7 shows the spatial occurrence of the various soil series in the watershed and is based on the 1988 soil survey. The three dominate soil series are color coded to stand out from the rest of the minor soil series.
Webster Series
The Webster series consist of deep, poorly drained, moderately permeable soils formed in loamy glacial till on till plains. Slopes range from 0-2 percent.
Canisteo Series
The Canisteo series consists of deep, poorly drained, moderately permeable soils formed in loamy glacial till on ground moraines. Slopes range from 0-2 percent.
Nicollet Clay Loam
The Nicollet Series consists of deep, moderately well drained, moderately permeable soils formed in loamy glacial till on ground moraines. Slopes range from 1 to 3 percent.4
4 Soil Survey of Brown County, MN USDA, Soil Conservation Service 1988.
34
Brow n C o.
Cotton w ood C o .
Nicolle t C o .
Little Co ttonwood R iver W atershed
Can is te o clay loa mNicollet c la y loam
W eb ster cla y loa m
Three D o m in ant Soil Series
So il S urveyN
10 0 10 20 Miles
35
Eroding Lands
Table 8 shows the total number of tracts and acres of highly erodible lands by township in the Little Cottonwood River Watershed. Farmers working these tracts of land are required to follow a highly erodible land use plan if they participate in any of the United States Department of Agriculture (USDA) farm programs.
Table 8 Highly Erodable Land (HEL) Summary
Township Tracts Acres
Cottonwood -Amboy 15 0.0 Cottonwood -Delton 15 331.1 Cottonwood -Selma 7 128.7 Cottonwood Storden 52 2,418.6 Brown Stately 6 119.9 Brown Bashaw 8 150.5 Brown Mulligan 5 224.3 Brown -Albin 3 28.3 Brown Lake Hanska 1 22.0 Brown Linden 1 11.0 Brown Leavenworth 0 0.0 Brown Stark 3 36.8 Brown Sigel 4 33.6 Brown -Cottonwood 4 47.0 Little Cottonwood River Totals 124 3,552.7
36
Soil Erosion Potential Model
Soil erosion is frequently associated with sediment and phosphorus transport to surface water bodies. Identifying the extent and location of area with high erosion will help managers pinpoint areas where Best Management Practices should be implemented (i.e. buffer strips, or conservation tillage). To estimate the amount of soil loss specific to the watershed the Revised Universal Soil Loss Equation (RUSLE) was used. RUSLE is a USDA-NRCS derived model used to assess the degree of rill and interrill erosion (in tons per acre per year), identify situations where erosion is serious, and guide development of conservation plans to control erosion. RUSLE is a widely used model to predict soil loss on any field condition where soil erosion by water is possible.
RUSLE is applicable to sheet and rill detachment only. It does not estimate erosion in channels or compute deposition. Maps 8, 9, and 10 display the results of the model. The maps show areas of the watershed in sections. Map 8 shows the soil erosion potential for the upper portion of the watershed or basically up until water quality monitoring site 2. Map 9 shows the results of the model for the middle section and finally map 10 displays the results of the lower section (near the mouth).
Table 9, 10, 11 describes the numerical results of analysis. The tables show the amount of acres and % of minor shed by erosion category. Table 11 takes the data a step further by listing the amount of RUSLE erodible acres within 200 feet of the river or tributary for the watershed.
Table 9 % of Sub-shed by RUSLE erosion category
Soil Erodibility Category (Tons/Acre/Year)
Subwatershed 0-3 3-5 5-15 15-30 > 30
28081 95 0 4 .9 0.1 28080 97 .16 2.4 .37 .1
28097 96 0 3.8 .02 0 28090 99 .15 .85 0 0
28057 95 .62 2 .3 1.7 28087 98 .46 1.3 .37 .23
28085 96 .39 3.4 .49 0 28088 97 1.3 1.3 .57 0
28091 98 0 1.9 .4 0
28089 99.6 .34 .04 0 .02
28084 99.4 .2 .4 0 0
28086 99 0 .1 0 0
37
Table 10 Acres of Subshed by erosion category
Soil Erodibility Category (Tons/Acre/Year)
Subwatershed 0-3 3-5 5-15 15-30 > 30 Total acres of minor
Table 11 Number erodible acres within 200 feet of a waterway by Soil Loss Category (T/A/Yr)
Soil Erodibility Factor 3-5 5-15 15-30 > 30
Acres 85 896 213 88
38
5 0 5 10 Miles
N
0-33 - 55 - 1515 - 30Greater than 30
Erosion Rate (tons/acre/year)
MinorshedsLittle Cottonwood River
$Z Water Quality Monitoring Sites
Little Cottonwood River WatershedModeled Soil Erosion Potential using RUSLE
Upper Portion of Watershed
$Z
$Z
Map 8: Potential erosion rates in the upper portion of the watershed
39
$Z
$Z
Middle Portion of Watershed
Modeled Soil Erosion Potential using RUSLELittle Cottonwood River Watershed
Erosion Rate (tons/acre/year)
Greater than 3015 - 305 - 153 - 50-3
N
5 0 5 10 Miles
Water Quality Monitoring Sites$Z
Little Cottonwood River
Minorsheds
Map 9: Potential erosion rates in the middle portion of the watershed
40
$Z
$Z
5 0 5 10 Miles
N
0-33 - 55 - 1515 - 30Greater than 30
Erosion Rate (tons/acre/year)
Little Cottonwood River WatershedModeled Soil Erosion Potential using RUSLE
Lower Portion of Watershed
Water Quality Monitoring Sites$Z
Little Cottonwood River
Minorsheds
Map 10: Potential erosion rates in lower portion of the watershed
41
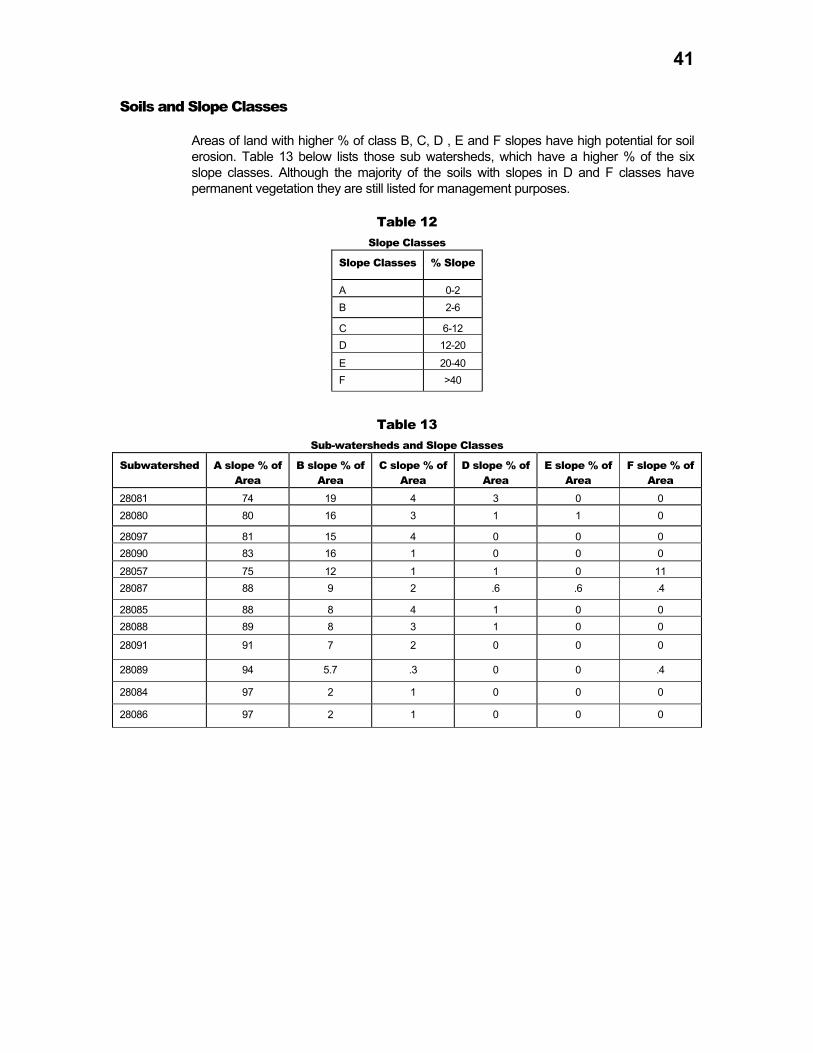
Soils and Slope Classes
Areas of land with higher % of class B, C, D , E and F slopes have high potential for soil erosion. Table 13 below lists those sub watersheds, which have a higher % of the six slope classes. Although the majority of the soils with slopes in D and F classes have permanent vegetation they are still listed for management purposes.
Table 12 Slope Classes
Slope Classes % Slope
A 0-2 B 2-6
C 6-12 D 12-20
E 20-40 F >40
Table 13 Sub-watersheds and Slope Classes
Subwatershed A slope % of Area
B slope % of Area
C slope % of Area
D slope % of Area
E slope % of Area
F slope % of Area
28081 74 19 4 3 0 0 28080 80 16 3 1 1 0
28097 81 15 4 0 0 0 28090 83 16 1 0 0 0
28057 75 12 1 1 0 11 28087 88 9 2 .6 .6 .4
28085 88 8 4 1 0 0 28088 89 8 3 1 0 0
28091 91 7 2 0 0 0
28089 94 5.7 .3 0 0 .4
28084 97 2 1 0 0 0
28086 97 2 1 0 0 0
42
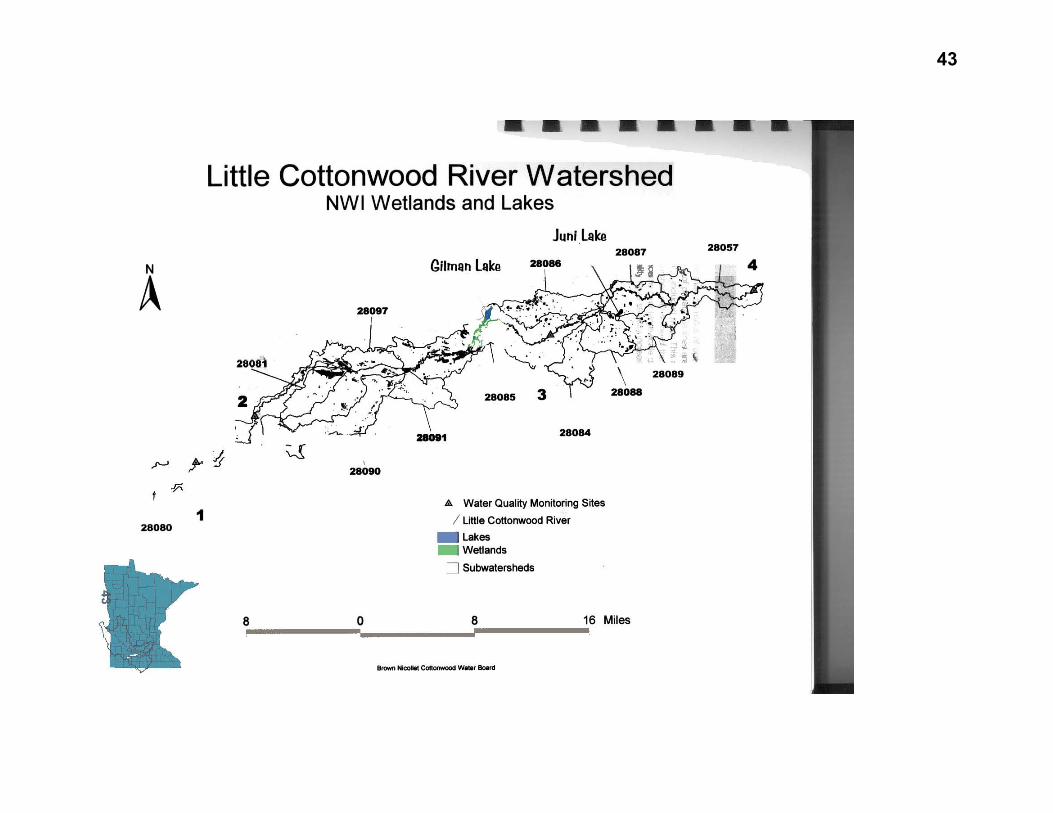
Wetlands
The National Wetlands Inventory (NWI) of the U.S. Fish and Wildlife Service produces information on the characteristics, extent, and status of the Nation’s wetlands and deepwater habitats. Map 11 shows current wetland status as of 1995 NWI survey.
According to the National Wetland Inventory approximately 3,861 acres of the watershed land area is classified as a wetland habitat ecosystem.
Table 14 Wetland Characteristics
Subwatershed Acres of wetlands(NWI)
% of sub-shed area in
wetland habitat 28081 434 9 28085 1576 7
28087 384 6 28086 243 4
28097 319 3 28057 217 3
28091 96 2 28090 185 2
28088 55 1
28080 259 1
28084 49 1
28089 44 .9
43
44
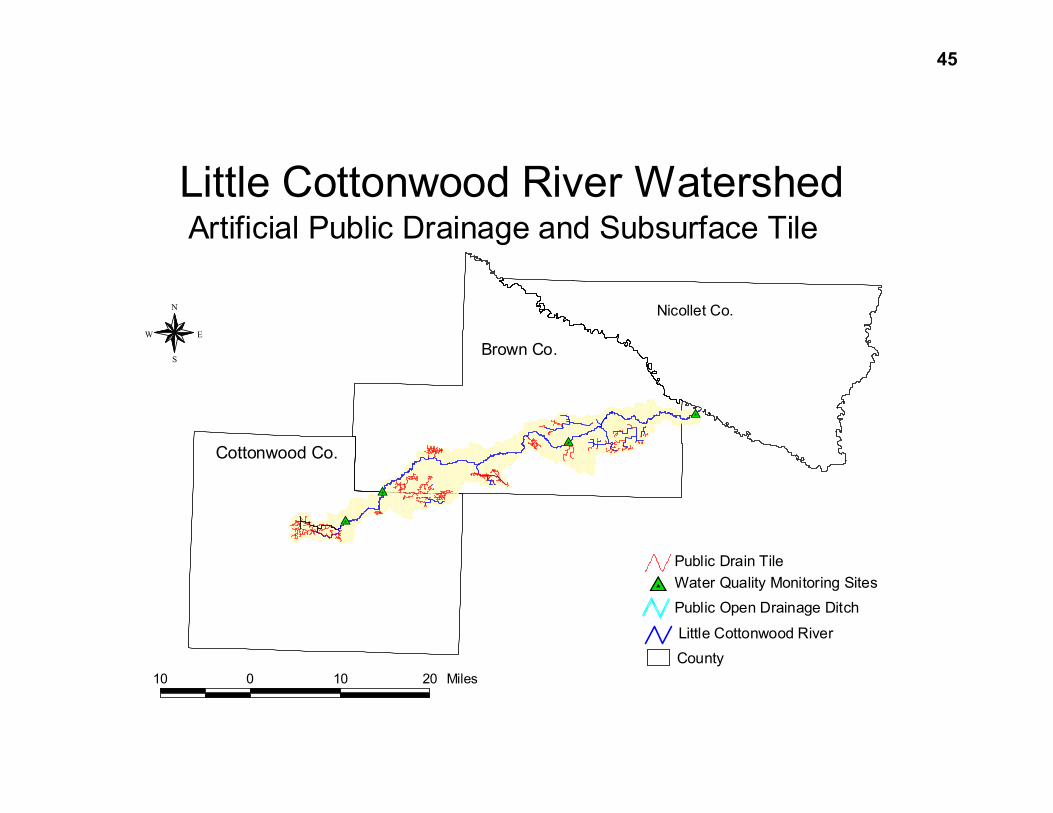
Drainage
More than 50 miles of open ditches and 140 miles of public drain tile with many more miles of private tile lines are located within the watershed. Private tile lines are not shown on the included map. This network of drainage, see map 12, has converted much of the watershed into some of the most productive soils in the state, and country. However, the concerns over large-scale drainage projects within the watershed in terms of quantity and quality have steadily increased along with the amount of drainage the past 10 years.
45
N
EW
S
Little Cottonwood River WatershedArtificial Public Drainage and Subsurface Tile
$Z
$Z
$Z
$Z
CountyLittle Cottonwood River
Public Open Drainage Ditch$Z Water Quality Monitoring Sites
Public Drain Tile
10 0 10 20 Miles
Nicollet Co.
Brown Co.
Cottonwood Co.
46
Tillage Transect Survey
Minnesota’s Tillage Transect Survey for Monitoring Trends in Crop Residue Management Minnesota Board of Water and Soil Resources
Every spring since 1995, local government staff in Minnesota’s agricultural counties have driven along a designated route to build an annual record of crops grown, tillage type, and surface residue remaining after planting. For each participating county, the route is designed as a grid that equally represents all cultivated areas. Local staff from the SWCD, NRCS and other conservation organizations cooperate to cover the route, stopping every half mile to record field conditions to the left and right of the road. With 450-500 field observations in each county, the data represents a statistical average of the entire cropland area. This tillage transect survey procedure was developed by the Department of Agronomy at Purdue University.
The results are entered on forms that are scanned into a computer program that aids in summarizing the data. Each data point is associated with its county, major watershed, slope length and steepness and other USLE based erosion information. A methodology has been developed to conduct the survey in minor watersheds, and participating watersheds will be able to compare crop residue trends with stream monitoring data.
Counties facing growing expectations for water and soil resource conservation are finding the data useful for demonstrating the importance of promoting conservation tillage, and prioritizing where those efforts should be targeted. The data also enables conservation staff to monitor outcomes from tillage programs, and recognize the success (or failure) of agricultural producers in meeting crop residue targets. When it is used to demonstrate needs, prioritize efforts, track progress and recognize success, the Tillage Transect Program’s data enables a county to secure funding and achieve conservation objectives.
Trends in crop residue management are summarized using a method that calculates the percent of fields in the corn-soybean rotation that meet crop residue targets. It is computed as the average of the percent of corn acres planted into >15% residue, and the percent of soybean acres planted into >30% residue. From 1995 to 1999, the number of Minnesota counties conducting the survey has been 37, 37, 27, 39, and 43, respectively. During those years, the percent of cropland meeting residue targets has been 31%, 41%, 50%, 39% and 37%, respectively. There is large variation in surface residue management from county-to-county, and year-to-year. The amount of residue left on the surface depends on many factors, most importantly opportunity to till (based on weather conditions) and intent to maintain residue.
A summary of the conservation tillage results for counties within the watershed is shown in table 15. Blue Earth County was not included since there is a very small portion of tillable acres within this area of the watershed.
47
Table 155 Tillage Transect Survey
Summary of 2000 Tillage Survey
This year the sixth annual tillage transect survey was conducted in the Minnesota River Basin. Forty-four percent of the corn/soybean fields in 36 Minnesota River Basin counties met the residue targets (fields with greater than 30 percent residue cover following corn and greater than 15 percent residue following soybeans). In 1995, 28 percent of the fields in the Minnesota River basin met the targets, rising to 41% and 45% in1996 and 1997, respectively. Then, in 1998 and 1999 long fall tillage seasons correspond with lower residue levels of 37 and 38 percent, respectively. This year’s jump to 44% may be due to dry soil concerns during spring tillage, or perhaps a greater producer effort to keep soil in place?
Within the LCR watershed Brown County has the lowest conservation tillage amounts as well as the MN River basin. Within the past six years of tillage surveys, less than 30% of the fields sampled have met residue targets. On the contrary, Cottonwood County has the highest residue amounts in the watershed and some of the highest trends meeting targets in the MN River Basin. Over the past six years 56-74% of fields have met residue targets. Although data for the transect survey was not compiled on a watershed specific procedure, comments from tillage transect survey staff indicate tillage residue amounts in the county mirror residue amounts in the watershed. The lowest residue amounts in the 1999 and 2000 survey were located in the lower portion of the watershed in Brown County.6 Other possible reasons for the wide variance in residue amounts by county include planting concerns. Higher clay amounts found in Brown County can sometimes delay planting due to soil wetness and temperature. Those concerns help to explain higher moldbord plowing and other lower residue tillage systems in this area.
The ten Minnesota River Basin Counties with the highest corn-soybean averages include: Swift (84%), Big Stone (80%), Le Sueur (77%), Martin (73%), Waseca (64%), Lac Qui Parle (60%), Cottonwood (56%), Traverse (54%), Dakota (54%), and Chippewa (54%). Variation in levels from county-to-county may be attributable to differences in soil and climate, and high levels may also reflect local success in promoting conservation tillage.
5 Minnesota Board of Water and Soil Resources,2000. 6 Greg Tennant and Tom Maher, Brown County NRCS and SWCD personnel.
48
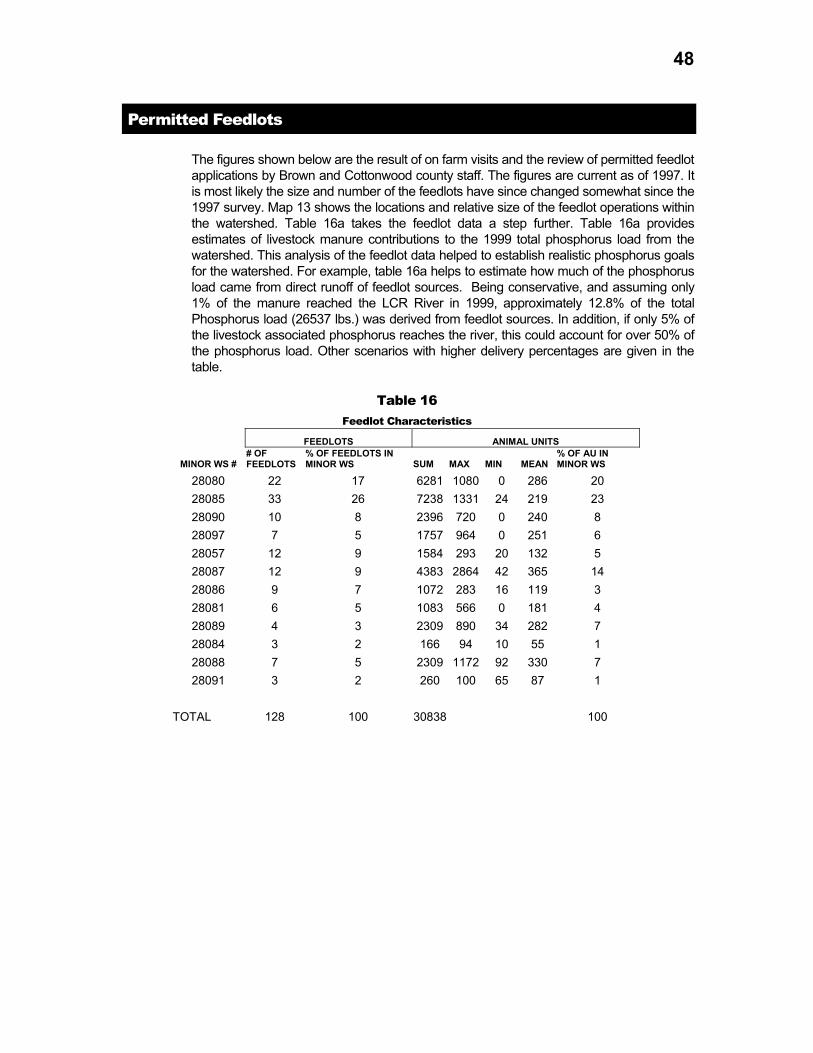
Permitted Feedlots
The figures shown below are the result of on farm visits and the review of permitted feedlot applications by Brown and Cottonwood county staff. The figures are current as of 1997. It is most likely the size and number of the feedlots have since changed somewhat since the 1997 survey. Map 13 shows the locations and relative size of the feedlot operations within the watershed. Table 16a takes the feedlot data a step further. Table 16a provides estimates of livestock manure contributions to the 1999 total phosphorus load from the watershed. This analysis of the feedlot data helped to establish realistic phosphorus goals for the watershed. For example, table 16a helps to estimate how much of the phosphorus load came from direct runoff of feedlot sources. Being conservative, and assuming only 1% of the manure reached the LCR River in 1999, approximately 12.8% of the total Phosphorus load (26537 lbs.) was derived from feedlot sources. In addition, if only 5% of the livestock associated phosphorus reaches the river, this could account for over 50% of the phosphorus load. Other scenarios with higher delivery percentages are given in the table.
Table 16a Analysis of Potential Phosphorus Contribution in the Little Cottonwood River Watershed
Part I. Low, Medium, and High estimates of total phosphorus produced bylivestock (lbs./ animal unit)
Low Medium High Adapted from:lbs./year/a.u. 5 11 26 Livestock Waste Facilities Handbook-3rd ed.Cattle and Swine Midwest Plan Service, Iowa State Univ., 1993
Converted to total phosphorus (TP)using TP = 0.44 x P2O5
Part II. Estimated livestock numbers and low, medium, and high estimates of mass of phosphorus produced by livestock in Little Cottonwood watershed (lbs./year)minor watershed a.u.'s Low Medium High
Part III. Estimated number of acres required for land application of all manure produced in watershed based on application rate of 80 lbs./acre P2O5
Acres of crop land in Little Low Medium HighCottonwood River Watershed: 96,670 4380 9637 22778
Part IV. Comparison of annual load of total phosphorus to estimate of phosphorus produced by livestock
Low Medium HighLivestock estimate (pounds per year) 154190 339218 8017881999 measured load (pounds) 26537 26537 26537
Part V. Percent of 1999 load that could be from livestock manurebased on different assummed delivery percentages
% of annual load from livestock*Explanation of delivery percentages: 1% 5.8% 12.8% 30.2%A 5% delivery, for example, means 5% 29% 64% 151%that 5% of the total phosphorus 10% 58% 128% 302%associated with manure makes its way 20% 116% 256% 604%from feedlots or fields to the 50% 291% 639% 1511%Little Cottonwood River 100% 581% 1278% 3021%* A percentage greater than 100 indicates more phosphorus than was measured in 1999.
The type of analysis done in Part III. could be applied to individual minor watershedsIn either case, it is important to recognize that manure could be land applied in different minor watersheds from where it is produced, or outside of the Little CottonwoodRiver watershed altogether.
50
Coun ty BoundaryLittle Cottonwood River W a te rshed
Little Cotttonwood TributariesLittle Cottonwood River
$Z W ate r Quality Mon ito ring S ites
Ac tive Feedlots (An im al U nits)#Y 0 - 50#Y 51 - 100#Y 101 - 500#Y 501 - 1000#Y 1001 - 3000
$Z
$Z
$Z
$Z
#Y#Y#Y#Y
#Y#Y#Y
#Y#Y
#Y #Y#Y#Y
#Y
#Y
#Y#Y#Y
#Y#Y
#Y#Y#Y
#Y#Y#Y#Y#Y #Y#Y #Y
#Y#Y #Y#Y#Y#Y
#Y #Y#Y
#Y #Y#Y#Y #Y
#Y#Y
#Y#Y
#Y
#Y#Y
#Y#Y#Y #Y #Y
#Y#Y
#Y#Y #Y#Y#Y#Y#Y
#Y #Y #Y#Y
#Y
#Y #Y
#Y#Y
#Y #Y#Y
#Y
#Y#Y #Y
#Y #Y
#Y#Y#Y
#Y #Y
#Y#Y#Y#Y
#Y
#Y
#Y#Y#Y
#Y#Y#Y #Y
#Y#Y
#Y
#Y#Y
#Y
#Y #Y#Y#Y
#Y#Y #Y#Y#Y #Y
#Y
#Y#Y #Y
#Y
#Y#Y
#Y
#Y
#Y#Y
#Y
#Y
Brow n Co.
Cottonwood Co.
Nicollet Co.
1
2 3
4
Little Cottonwood River W atershedFeedlots
N
9 0 9 Miles
NOTE : Thi s ma p re pre sents fee dlo ts which have bee n pe rm itted b y the sta te o f MN a nd re presen tsth e most up to d ate loca tion s a nd sizes of fee dlo ts wi th in the wa te rshe d as o f 1 998 . Mo st like ly th e numb er , an d size of the fee dlo ts with in the wate rshe dhas cha nge d sin ce th e in iti al sur vey.
1
2 3
4
51
Floodplains
A substantial portion of the LCR watershed is classified as having a high flood potential, having been identified through 1981 FEMA Flood Insurance Study, the 1981 Flood Insurance Rate Map, the 1981 Flood Boundary and Floodway Map, and the 1982 SCS National Resources Inventory. A majority of these areas exist within the central portion of the watershed. These acres come under the jurisdiction of the Flood Plain Ordinance.
Specific Flood Plain Delineation for the Little Cottonwood River can be found on panels 50, 75, and 125 of the Flood Insurance Rate Map in the Cottonwood County Environmental Office, and in the Brown County Planning & Zoning Office. A more comprehensive discussion of the flood plain ordinance and program are discussed in Section IIB.
Lakes
Following is a summary table of the DNR Zoning Classifications of LCR lakes in the state protected waters inventory: Map 11 shows locations of the major lakes.
Lake # Lake Name Area Shore Length Maximum Depth DNR Zoning Classification
8-10 Omsrud Lake 265.0 acres 3.9 miles 6.0 feet Natural Environment
8-16 Juni Lake 65.0 acres na na Natural Environment
8/35 Gilman Lake 199.0 acres 1.5 miles 1.5 feet Natural Environment
Game Management Lakes are defined as, “lakes shallower than six feet, which ordinarily contain water throughout the year. They are ordinarily deeper marshes.” Game Ecological Classifications are used to describe lakes that are, “of very high fertility, usually with an abundance of aquatic vegetation present. Winterkills may occur annually. This type of lake is characterized by substantial populations of muskrats and/or waterfowl.”
52
Omsrud Lake is classified as a Game Management Lake and a Game Ecological Lake. A secchi disk survey for lake clarity resulted in a low level of clarity: .5 feet. Omsrud Lake was surveyed for biological parameters over fifty years ago (1947). Even at that time, carp were abundant, and erosion from steep wooded shores was considered a problem.
Juni Lake has not been surveyed or classified.
Gilman Lake is classified as a Game Management Lake and a Game Ecological Lake. It too was last surveyed for biological parameters in 1947. High carp counts led to a recommendation for the installation of a carp barrier at that time.
FERTILIZERS AND PESTICIDES
Fertilizer and/or pesticide usage varies from one farmer to another depending on the soil type(s) of the individuals property and the past productivity of that land. Information pertaining to each land parcel or watershed is not attainable. But using the most up-to-date information from the U.S. Department of Agriculture, estimates can be made on a county level concerning the application of fertilizers and pesticides. The numbers used are derived from 1998 statistical data. These are rough estimations made using a combination of state and county-level data.
CORN
7,300,000 acres of cropland were seeded with corn in Minnesota for 1998. 96 percent had nitrogen applied to it with an average of 1.6 applications at 78 lbs. per acre. Phosphate was applied to 91 percent of the land with an average of 1.0 application at 52 lbs. per acre.
Herbicide was applied to 97 percent of the corn cropland with insecticide being spread over 10 percent of the land. 11 different herbicides were used with Dicamba being the most frequent at 46 percent with a rate of 0.37 pounds per acre. Atrazine was second at 39 percent with a rate of 0.59 pounds per acre, and Acetochlor was third at 28 percent at a rate of 1.59 pounds per acre. All three were applied at 1.0 application per acre.
In 1998, 148,400 acres of land were planted with corn in Brown County. When calculated with state averages, nitrogen application was 5786.6 tons and phosphate totaled 3858.4 tons. For 1998, Cottonwood County had 174,800 acres planted with corn which had 6817.2 tons of nitrogen and 4544.8 tons of phosphate applied to it.
SOYBEANS
6,900,000 acres of cropland were planted with soybeans. Nitrogen was applied to 18 percent of the soybean cropland at a rate of 1.1 applications with 21 lbs. per acre.
53
Phosphate was put on 17 percent of the land at a rate of 1.0 application at 33 lbs. per acre.
Twelve different herbicides were spread on 97 percent of the soybean cropland. Imazethapyr was number one at 27 percent at a rate of 1.0 application and 0.030 lbs. per acre. Glyphosate and Imazamox were close with both being applied to 26 percent of the acreage. Glyphosate was higher at 1.3 applications and 0.69 lbs. per acre. Imazamox was at a rate of 1.0 application and 0.030 lbs. per acre.
Soybean acreage totaled 143,100 acres in Brown County. Nitrogen applied was equal to 1502.55 tons and phosphate application equaled 2361.15 tons. Soybeans were planted on 177,300 acres in Cottonwood County with totals of 1861.65 tons of nitrogen and 2925.45 tons of phosphate applied to it.
Population
The Little Cottonwood River Watershed lies primarily within Brown and Cottonwood counties. Population figures were made by looking at township borders and the watershed boundary together and estimating the percent of coverage in each township. This percentage was multiplied by the population for each individual township. The most recent data available was 1990 and was attained from the U.S. Department of Commerce, Bureau of the Census.
The population of the Little Cottonwood Watershed was approximately 2810 people in 1990. Jeffers and Comfrey’s population totaled 918 people making up 33 percent of the entire watershed.
Total county populations for Brown and Cottonwood counties in 1990 were 26,984 and 12,694 respectively. The 1999 estimate for Brown County is 26,903 and for Cottonwood County the number is 11,908. Brown and Cottonwood Counties are seeing decreasing trends in populations. The change for Brown County was –0.3 percent and –6.2 percent for Cottonwood.