Chapter 2 The NRSA Study and Comparison Groups: Characteristics and Training Assessing the career progress of NRSA predoctoral trainees and fellows requires that three questions be initially asked. First, what do we know about their training (e.g., length of support, field, and quality), and is it consistent with the goals of the NRSA programs? Second, did this training differ from that of individuals who did not receive these traineeships and fellowships? And third, did former trainees and fellows differ in other ways that are known to also influence career trajectories? By speaking to the plausibility of both differences and no-difference findings, answers help in interpreting the outcomes. That is, if NRSA predoctoral awardees achieve more than those whose graduate studies were not supported by NIH training funds, is there reason to believe that these accomplishments could be a product of their different training experiences, other characteristics that affect career decisions, or both? In this chapter are described the characteristics of NRSA predoctoral support for former trainees and fellows who earned their Ph.D. in the biological and behavioral sciences between 1981 and 1992. Included are the field and location of training, Institute providing support, type of award, and the length and timing of support. The other sources used to finance their doctoral study are then described and compared to those for Ph.D.s in the two comparison groups who did not receive such traineeships and fellowships. This partly addresses the issue regarding how NRSA support may have provided somewhat different graduate training experiences; that is, by providing tuition assistance and stipends, it may have reduced involvement in activities that are not directly related to doctoral study and thus extend the time required to complete the degree (e.g., Bowen & Rudenstine, 1992; Ehrenberg & Mavros, 1995). Because the intent of the NRSA training programs is to foster high quality doctoral training for talented graduate students, the reputation of the doctorate-granting institution also is examined to assess whether this goal was realized. The chapter concludes with an examination of the extent to which former NRSA trainees and fellows resembled the comparison groups on other background characteristics that may partly explain differential performance. These include age at beginning graduate school, gender, race/ethnicity, and field of degree. Prior research has shown that these characteristics can account for variation in career paths among scientists. For example, women doctoral scientists and engineers in 1997 were less likely than men to be employed in the private-for-profit sector (21 versus 35 percent) and to report research and development as their primary work activity (34 versus 43 percent); similar disparities occurred when comparing White scientists and engineers with their counterparts from underrepresented minority groups (National Science Foundation, 1999). Employment and publication patterns also have been shown to differ by gender and race/ethnicity (Long & Fox, 1995; Pearson, 1985; Sonnert & Holton, 1995). The Characteristics of NRSA Predoctoral Training Support The underlying rationale of the NRSA predoctoral training programs is to improve the quality of research in areas important to the Nation=s health. This is to be accomplished by attracting talented individuals and providing them with training opportunities of the highest caliber. Funds are used to award (1) training grants to institutions that then select and appoint promising graduate students, and (2) fellowships to individual students for conducting research under the supervision of a senior scientist. To ensure high-quality training, award decisions are made by scientific review groups. The maximum length of support (five years) is based on the assumption that tuition assistance and stipends should finance a critical portion of trainees= and fellows= graduate education. For trainees, in particular, this typically involves a mixture of basic and specialized knowledge that is imparted through courses in the early years of graduate school.
Transcript
Chapter 2The NRSA Study and Comparison Groups: Characteristics and Training
Assessing the career progress of NRSA predoctoral trainees and fellows requires that three questions be initially asked. First, what do we know about their training (e.g., length of support, field, and quality), and is it consistent with the goals of the NRSA programs? Second, did this training differ from that of individuals who did not receive these traineeships and fellowships? And third, did former trainees and fellows differ in other ways that are known to also influence career trajectories? By speaking to the plausibility of both differences and no-difference findings, answers help in interpreting the outcomes. That is, if NRSA predoctoral awardees achieve more than those whose graduate studies were not supported by NIH training funds, is there reason to believe that these accomplishments could be a product of their different training experiences, other characteristics that affect career decisions, or both?
In this chapter are described the characteristics of NRSA predoctoral support for former trainees and fellows who earned their Ph.D. in the biological and behavioral sciences between 1981 and 1992. Included are the field and location of training, Institute providing support, type of award, and the length and timing of support. The other sources used to finance their doctoral study are then described and compared to those for Ph.D.s in the two comparison groups who did not receive such traineeships and fellowships. This partly addresses the issue regarding how NRSA support may have provided somewhat different graduate training experiences; that is, by providing tuition assistance and stipends, it may have reduced involvement in activities that are not directly related to doctoral study and thus extend the time required to complete the degree (e.g., Bowen & Rudenstine, 1992; Ehrenberg & Mavros, 1995). Because the intent of the NRSA training programs is to foster high quality doctoral training for talented graduate students, the reputation of the doctorate-granting institution also is examined to assess whether this goal was realized.
The chapter concludes with an examination of the extent to which former NRSA trainees and fellows resembled the comparison groups on other background characteristics that may partly explain differential performance. These include age at beginning graduate school, gender, race/ethnicity, and field of degree. Prior research has shown that these characteristics can account for variation in career paths among scientists. For example, women doctoral scientists and engineers in 1997 were less likely than men to be employed in the private-for-profit sector (21 versus 35 percent) and to report research and development as their primary work activity (34 versus 43 percent); similar disparities occurred when comparing White scientists and engineers with their counterparts from underrepresented minority groups (National Science Foundation, 1999). Employment and publication patterns also have been shown to differ by gender and race/ethnicity (Long & Fox, 1995; Pearson, 1985; Sonnert & Holton, 1995).
The Characteristics of NRSA Predoctoral Training Support
The underlying rationale of the NRSA predoctoral training programs is to improve the quality of research in areas important to the Nation=s health. This is to be accomplished by attracting talented individuals and providing them with training opportunities of the highest caliber. Funds are used to award (1) training grants to institutions that then select and appoint promising graduate students, and (2) fellowships to individual students for conducting research under the supervision of a senior scientist. To ensure high-quality training, award decisions are made by scientific review groups. The maximum length of support (five years) is based on the assumption that tuition assistance and stipends should finance a critical portion of trainees= and fellows= graduate education. For trainees, in particular, this typically involves a mixture of basic and specialized knowledge that is imparted through courses in the early years of graduate school.
Basic biomedical Other biological Health Behavioral
2-2 Chapter 2. The NRSA Study and Comparison Groups: Characteristics and Training
The implication is that the NRSA trainees and fellows should share certain types of experiences. The fields of their degree would be those identified as key to the biomedical research enterprise. Their graduate study would have occurred in programs known for the quality of their faculty and effectiveness in training scientists. Assuming that a doctorate typically is earned within 6-7 years, support would cover a healthy fraction of this period (e.g., two or more years). For trainees, this support would be provided during the early years of graduate study B the time of intensive course work.
Field of Training
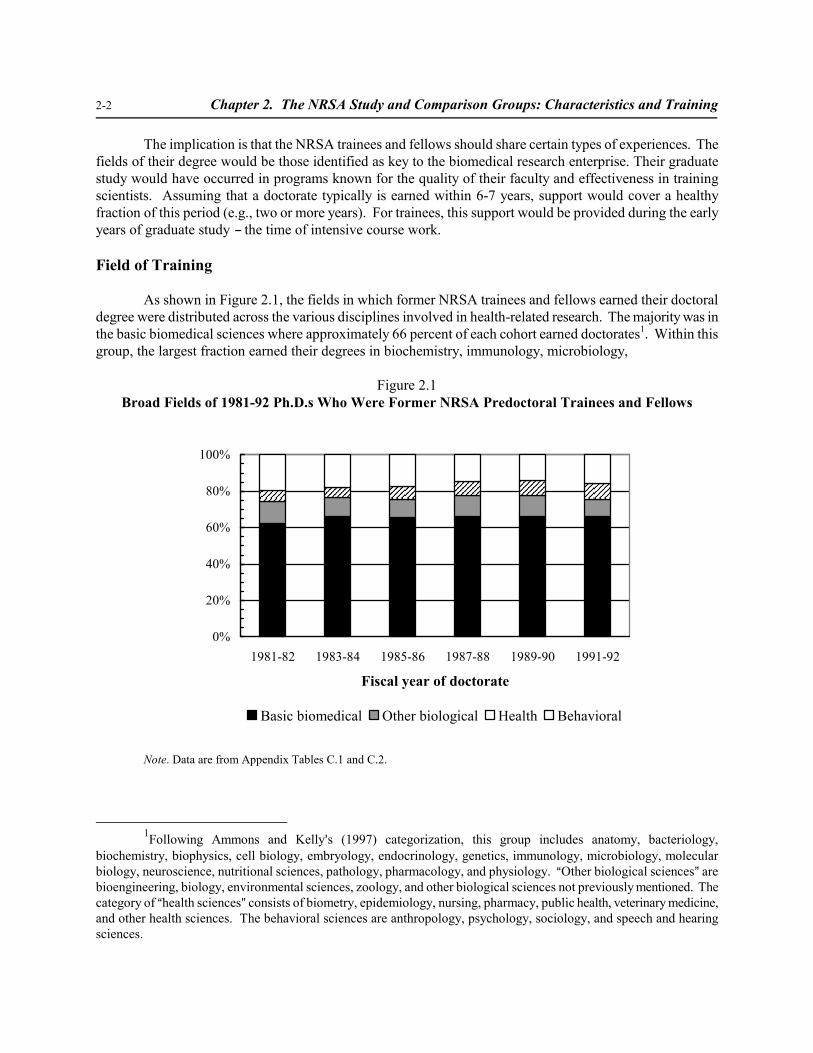
As shown in Figure 2.1, the fields in which former NRSA trainees and fellows earned their doctoral degree were distributed across the various disciplines involved in health-related research. The majority was in the basic biomedical sciences where approximately 66 percent of each cohort earned doctorates1. Within this group, the largest fraction earned their degrees in biochemistry, immunology, microbiology,
Figure 2.1 Broad Fields of 1981-92 Ph.D.s Who Were Former NRSA Predoctoral Trainees and Fellows
1Following Ammons and Kelly=s (1997) categorization, this group includes anatomy, bacteriology, biochemistry, biophysics, cell biology, embryology, endocrinology, genetics, immunology, microbiology, molecular biology, neuroscience, nutritional sciences, pathology, pharmacology, and physiology. AOther biological sciences@ are bioengineering, biology, environmental sciences, zoology, and other biological sciences not previously mentioned. The category of Ahealth sciences@ consists of biometry, epidemiology, nursing, pharmacy, public health, veterinary medicine, and other health sciences. The behavioral sciences are anthropology, psychology, sociology, and speech and hearing sciences.
Chapter 2. The NRSA Study and Comparison Groups: Characteristics and Training 2-3
parasitology, or cell, developmental, or molecular biology B fields that often share faculty across programs and are viewed as areas of rapid progress (National Research Council, 1994).2 Across time, there were some shifts in the basic biomedical science disciplines in which degrees were earned. Biochemistry and related fields increased their share by about four percentage points. The proportion of Ph.D.s in neuroscience, another discipline that has spawned several major scientific advances, rose from 5 percent of 1982-83 Ph.D.s to 9 percent of the 1991-92 cohort (see Appendix Table C.1). At the same time, declines occurred in anatomy, genetics, pharmacology, and physiology.
The other major disciplinary groups comprised considerably smaller percentages of former trainees and fellows. Depending on the cohort, about 10-12 percent of the NRSA study group was awarded Ph.D.s in other biological science disciplines. About 6-9 percent received health science degrees; within this group, doctorates in nursing B a relatively new field in doctoral education B increased their share of NRSA recipients from 1 percent of the 1981-82 cohort to 4 percent of 1991-92 Ph.D.s. In contrast, the proportion of degrees in the behavioral sciences declined from 19 to 16 percent.
Institutes of Support
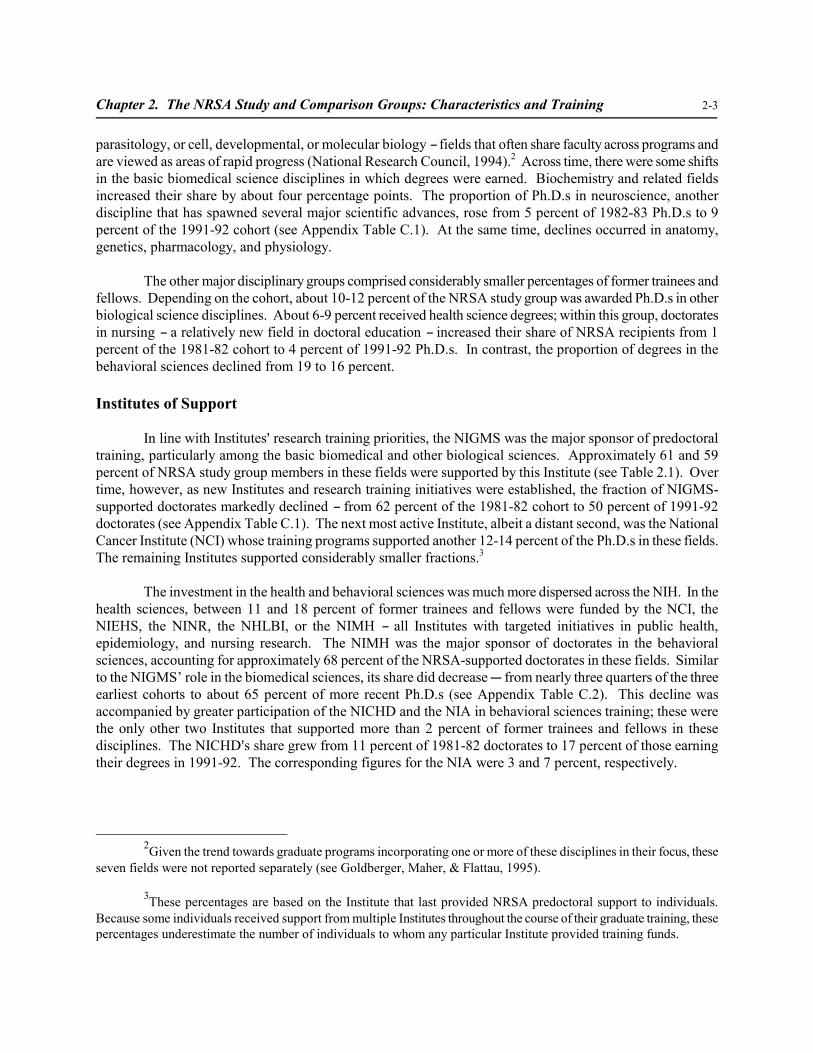
In line with Institutes= research training priorities, the NIGMS was the major sponsor of predoctoral training, particularly among the basic biomedical and other biological sciences. Approximately 61 and 59 percent of NRSA study group members in these fields were supported by this Institute (see Table 2.1). Over time, however, as new Institutes and research training initiatives were established, the fraction of NIGMS-supported doctorates markedly declined B from 62 percent of the 1981-82 cohort to 50 percent of 1991-92 doctorates (see Appendix Table C.1). The next most active Institute, albeit a distant second, was the National Cancer Institute (NCI) whose training programs supported another 12-14 percent of the Ph.D.s in these fields. The remaining Institutes supported considerably smaller fractions.3
The investment in the health and behavioral sciences was much more dispersed across the NIH. In the health sciences, between 11 and 18 percent of former trainees and fellows were funded by the NCI, the NIEHS, the NINR, the NHLBI, or the NIMH B all Institutes with targeted initiatives in public health, epidemiology, and nursing research. The NIMH was the major sponsor of doctorates in the behavioral sciences, accounting for approximately 68 percent of the NRSA-supported doctorates in these fields. Similar to the NIGMS’ role in the biomedical sciences, its share did decrease C from nearly three quarters of the three earliest cohorts to about 65 percent of more recent Ph.D.s (see Appendix Table C.2). This decline was accompanied by greater participation of the NICHD and the NIA in behavioral sciences training; these were the only other two Institutes that supported more than 2 percent of former trainees and fellows in these disciplines. The NICHD=s share grew from 11 percent of 1981-82 doctorates to 17 percent of those earning their degrees in 1991-92. The corresponding figures for the NIA were 3 and 7 percent, respectively.
2Given the trend towards graduate programs incorporating one or more of these disciplines in their focus, these seven fields were not reported separately (see Goldberger, Maher, & Flattau, 1995).
3These percentages are based on the Institute that last provided NRSA predoctoral support to individuals. Because some individuals received support from multiple Institutes throughout the course of their graduate training, these percentages underestimate the number of individuals to whom any particular Institute provided training funds.
2-4 Chapter 2. The NRSA Study and Comparison Groups: Characteristics and Training
Table 2.1 Broad Fields of 1981-92 Ph.D.s Who Were Former NRSA Predoctoral Trainees and Fellows by Institute of Support
Major Disciplinary Grouping Institute
Biomedical sciences
(n = 10,095)
Other biolog-ical sciences (n = 1,252)
Health sciences
(n = 1,094)
Behavioral sciences
(n = 2,440)
Total, all fields
(n = 14,881)
NIAAA 0.3 0.3 0.9 2.4 0.7
NIA 0.5 0.5 0.9 5.7 1.4
NIAID 4.1 2.1 1.1 0.0 3.1
NIAMS 1.3 0.6 0.9 0.0 1.0
NCI 11.6 13.9 13.7 0.2 10.1
NICHD 3.9 7.2 2.7 14.1 5.8
NIDA 0.5 0.0 0.2 1.4 0.6
NIDDK 0.7 0.0 0.3 0.0 0.5
NIDR 0.1 1.1 0.4 0.2 0.2
NIEHS 4.9 1.8 12.0 < 0.1 4.4
NEI 0.6 1.0 0.5 0.7 0.7
NIGMS 60.7 59.1 8.3 1.9 47.1
NHLBI 5.8 5.0 10.6 1.8 5.4
NIMH 3.3 6.3 11.2 68.2 14.8
NINR < 0.1 0.1 17.7 0.7 1.4
NINDS 1.5 10.7 0.7 0.8 1.2
Other < 0.1 0.2 18.3 1.9 1.7
Total 100.0 100.0 100.0 100.0 100.0
Note. Data are from the NRC Doctorate Records File (1994) and the NIH Trainee and Fellow File (1994). Individuals who were supported by multiple Institutes are classified under the last Institute providing predoctoral research training support. Included under AOther@ NIH Institutes are the Agency Research on Healthcare Research and Quality (AHRQ), the National Institute on Deafness and Communication Disorders (NIDCD), and the Division of Nursing, Bureau of Health Professions (which no longer has an NRSA program).
Chapter 2. The NRSA Study and Comparison Groups: Characteristics and Training 2-5
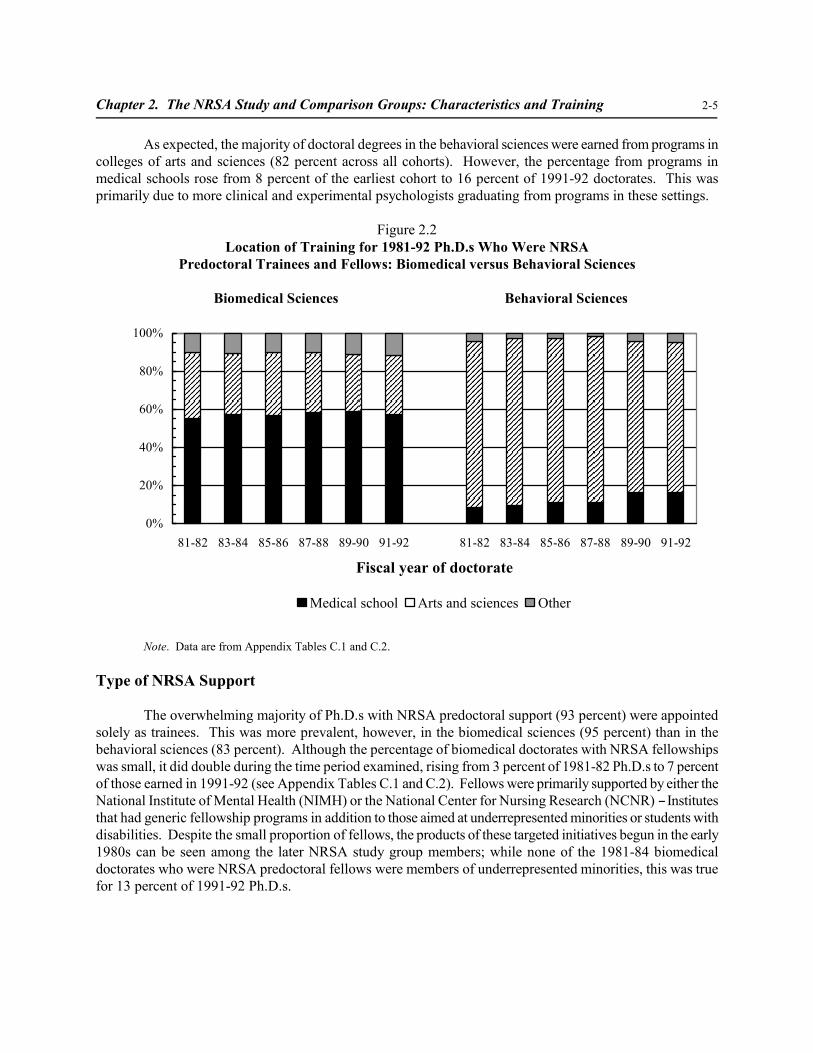
As expected, the majority of doctoral degrees in the behavioral sciences were earned from programs in colleges of arts and sciences (82 percent across all cohorts). However, the percentage from programs in medical schools rose from 8 percent of the earliest cohort to 16 percent of 1991-92 doctorates. This was primarily due to more clinical and experimental psychologists graduating from programs in these settings.
Figure 2.2 Location of Training for 1981-92 Ph.D.s Who Were NRSA
Predoctoral Trainees and Fellows: Biomedical versus Behavioral Sciences
The overwhelming majority of Ph.D.s with NRSA predoctoral support (93 percent) were appointed solely as trainees. This was more prevalent, however, in the biomedical sciences (95 percent) than in the behavioral sciences (83 percent). Although the percentage of biomedical doctorates with NRSA fellowships was small, it did double during the time period examined, rising from 3 percent of 1981-82 Ph.D.s to 7 percent of those earned in 1991-92 (see Appendix Tables C.1 and C.2). Fellows were primarily supported by either the National Institute of Mental Health (NIMH) or the National Center for Nursing Research (NCNR) B Institutes that had generic fellowship programs in addition to those aimed at underrepresented minorities or students with disabilities. Despite the small proportion of fellows, the products of these targeted initiatives begun in the early 1980s can be seen among the later NRSA study group members; while none of the 1981-84 biomedical doctorates who were NRSA predoctoral fellows were members of underrepresented minorities, this was true for 13 percent of 1991-92 Ph.D.s.
2-6 Chapter 2. The NRSA Study and Comparison Groups: Characteristics and Training
Predoctoral fellowships were more frequently used in the behavioral sciences. Although training grants again was the predominant mechanism of support, former fellows comprised about 15 percent of all NRSA-supported Ph.D.s in these disciplines during this time period, and the NIMH sponsored the majority of these awards (80 percent). Nearly 30 percent of former behavioral science fellows overall were underrepresented minorities, and their participation increased from 16 to 38 percent of the 1981-82 and 1991-82 cohorts, respectively. One contributing factor to this growth was the minority fellowship programs funded by the NIMH and administered by the American Psychological and American Sociological Associations, whose recipients accounted for the large majority of Black and Hispanic predoctoral training appointments.4
Duration and Timing of Support
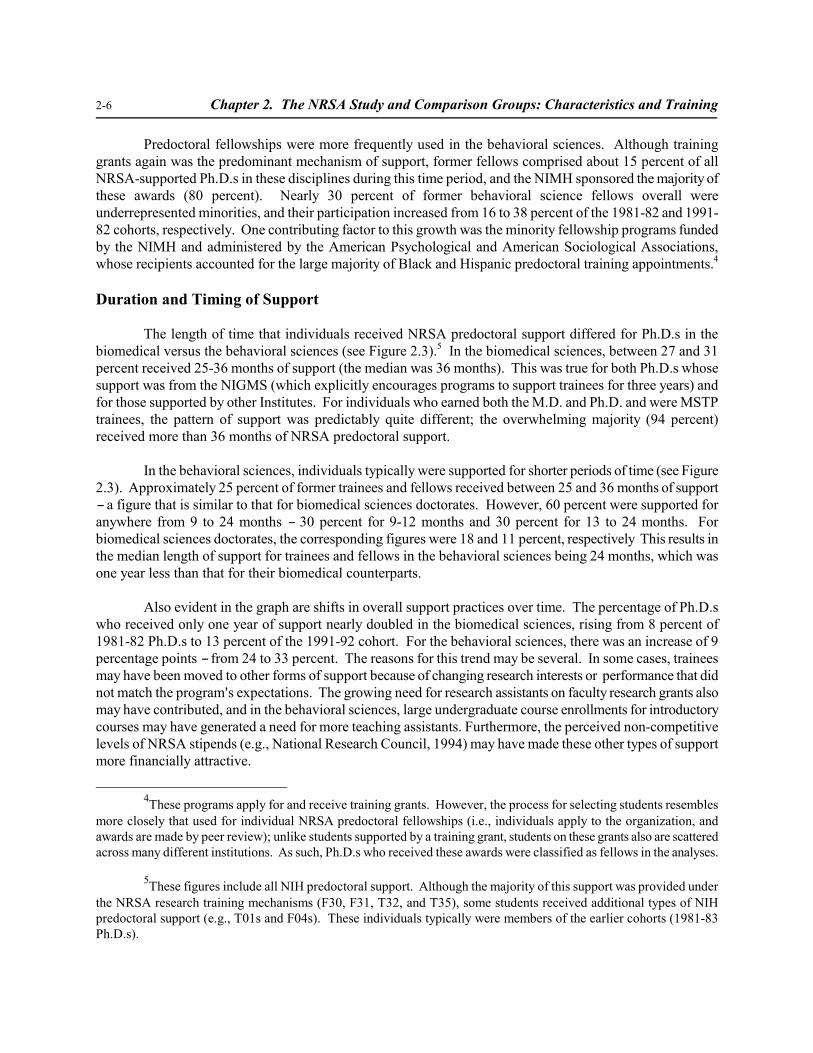
The length of time that individuals received NRSA predoctoral support differed for Ph.D.s in the biomedical versus the behavioral sciences (see Figure 2.3).5 In the biomedical sciences, between 27 and 31 percent received 25-36 months of support (the median was 36 months). This was true for both Ph.D.s whose support was from the NIGMS (which explicitly encourages programs to support trainees for three years) and for those supported by other Institutes. For individuals who earned both the M.D. and Ph.D. and were MSTP trainees, the pattern of support was predictably quite different; the overwhelming majority (94 percent) received more than 36 months of NRSA predoctoral support.
In the behavioral sciences, individuals typically were supported for shorter periods of time (see Figure 2.3). Approximately 25 percent of former trainees and fellows received between 25 and 36 months of support B a figure that is similar to that for biomedical sciences doctorates. However, 60 percent were supported for anywhere from 9 to 24 months B 30 percent for 9-12 months and 30 percent for 13 to 24 months. For biomedical sciences doctorates, the corresponding figures were 18 and 11 percent, respectively This results in the median length of support for trainees and fellows in the behavioral sciences being 24 months, which was one year less than that for their biomedical counterparts.
Also evident in the graph are shifts in overall support practices over time. The percentage of Ph.D.s who received only one year of support nearly doubled in the biomedical sciences, rising from 8 percent of 1981-82 Ph.D.s to 13 percent of the 1991-92 cohort. For the behavioral sciences, there was an increase of 9 percentage points B from 24 to 33 percent. The reasons for this trend may be several. In some cases, trainees may have been moved to other forms of support because of changing research interests or performance that did not match the program=s expectations. The growing need for research assistants on faculty research grants also may have contributed, and in the behavioral sciences, large undergraduate course enrollments for introductory courses may have generated a need for more teaching assistants. Furthermore, the perceived non-competitive levels of NRSA stipends (e.g., National Research Council, 1994) may have made these other types of support more financially attractive.
4These programs apply for and receive training grants. However, the process for selecting students resembles more closely that used for individual NRSA predoctoral fellowships (i.e., individuals apply to the organization, and awards are made by peer review); unlike students supported by a training grant, students on these grants also are scattered across many different institutions. As such, Ph.D.s who received these awards were classified as fellows in the analyses.
5These figures include all NIH predoctoral support. Although the majority of this support was provided under the NRSA research training mechanisms (F30, F31, T32, and T35), some students received additional types of NIH predoctoral support (e.g., T01s and F04s). These individuals typically were members of the earlier cohorts (1981-83 Ph.D.s).
Chapter 2. The NRSA Study and Comparison Groups: Characteristics and Training 2-7
Figure 2.3 Months of Support for 1981-92 Ph.D.s Who Were Former NRSA
Predoctoral Trainees and Fellows: Biomedical versus Behavioral Sciences
9-12 months 13-24 months 25-36 months 37 or more months
Note. Data are from Appendix Tables C.1 and C.2.
In the behavioral sciences, the other distinct possibility is that the end of the training grant precluded additional years of support. Of the former trainees with only 9-12 months of NRSA predoctoral support, the majority (76 percent) was appointed to NIMH training grants. Of these grants, only 15 percent were still active as of FY 1997.
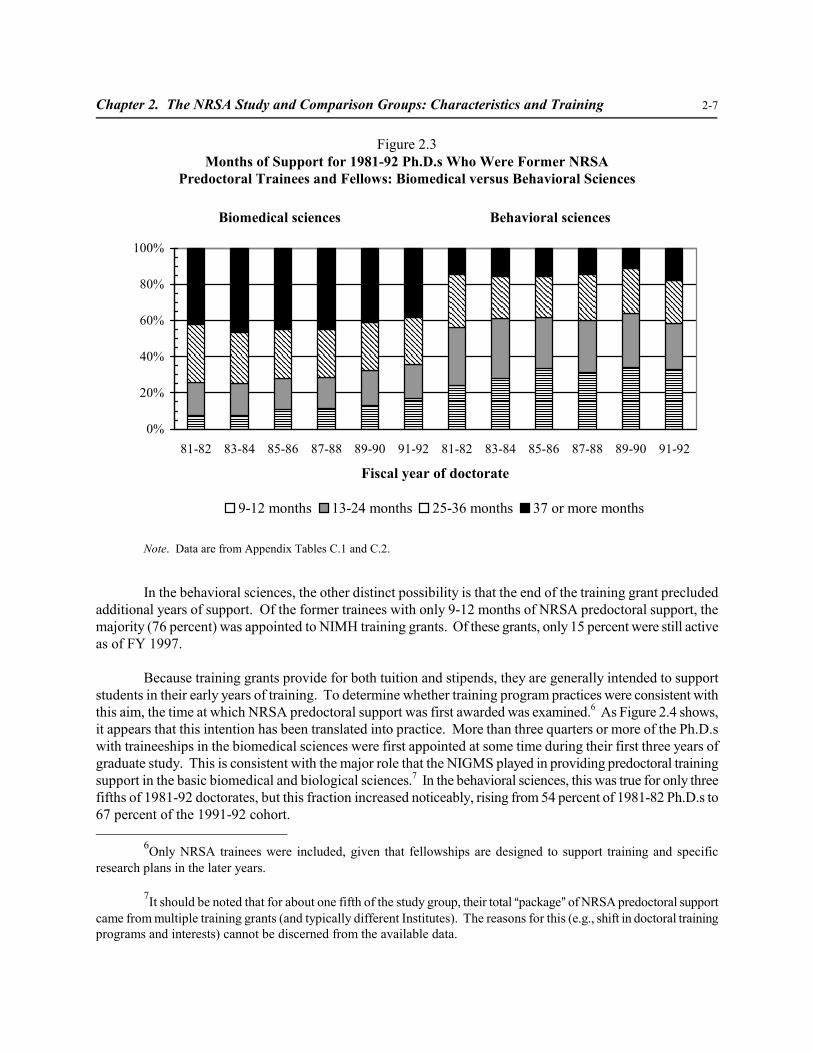
Because training grants provide for both tuition and stipends, they are generally intended to support students in their early years of training. To determine whether training program practices were consistent with this aim, the time at which NRSA predoctoral support was first awarded was examined.6 As Figure 2.4 shows, it appears that this intention has been translated into practice. More than three quarters or more of the Ph.D.s with traineeships in the biomedical sciences were first appointed at some time during their first three years of graduate study. This is consistent with the major role that the NIGMS played in providing predoctoral training support in the basic biomedical and biological sciences.7 In the behavioral sciences, this was true for only three fifths of 1981-92 doctorates, but this fraction increased noticeably, rising from 54 percent of 1981-82 Ph.D.s to 67 percent of the 1991-92 cohort.
6Only NRSA trainees were included, given that fellowships are designed to support training and specificresearch plans in the later years.
7It should be noted that for about one fifth of the study group, their total Apackage@ of NRSA predoctoral support came from multiple training grants (and typically different Institutes). The reasons for this (e.g., shift in doctoral training programs and interests) cannot be discerned from the available data.
Beha
2-8 Chapter 2. The NRSA Study and Comparison Groups: Characteristics and Training
Figure 2.4 Percent of 1981-92 Ph.D.s Whose NRSA Predoctoral Support Began
in the First Three Years of Doctoral Study: Biomedical versus Behavioral Sciences
100
80
Perc
ent 60
40
20
0
1981-82 1983-84 1985-86 1987-88 1989-90 1991-92
Fiscal year of doctorate
Biomedical Ph.D.s vioral Ph.D.s
Note. Data are from Appendix Tables C.1 and C.2. The percentages are based, in some cases, on estimates of the year of graduate study in which support would have occurred.
The Role of NRSA Training Support During Graduate Study
Although tuition assistance, stipends, and funds for other relevant training activities are not the primary ingredients of NRSA training, they are the essential budgetary items for which funds are expended. Because the period of NRSA support typically covers only part of individuals= time spent in a doctoral program, however, it is useful to examine traineeships and fellowships within the context of support received from other sources.8 In fact, only about 10 percent of the NRSA study group in the biomedical sciences and 3 percent in the behavioral sciences reported a traineeship or fellowship as their only source of graduate support.
Contrasting the sources utilized by NRSA trainees and fellows to those of non-NRSA supported students also provides some notion as to whether NRSA support resulted in a different set of training experiences and opportunities. That is, individuals whose graduate study was financed by research and teaching assistantships or outside jobs most likely had some different demands and work responsibilities. For example, being a teaching assistant or working in a part-time job to cover living expenses can decrease the time available to spend on courses and developing a research project that will yield a dissertation. The same has been said for research assistants, particularly when the focus is on completing the faculty=s research project
8It is also the case that trainees and fellows may receive other types of financial aid during their period of NRSA support. The NRSA guidelines permit some supplementation of stipends and additional compensation under certain conditions (e.g., monies earned as research assistants for work that does not duplicate NRSA training activities).
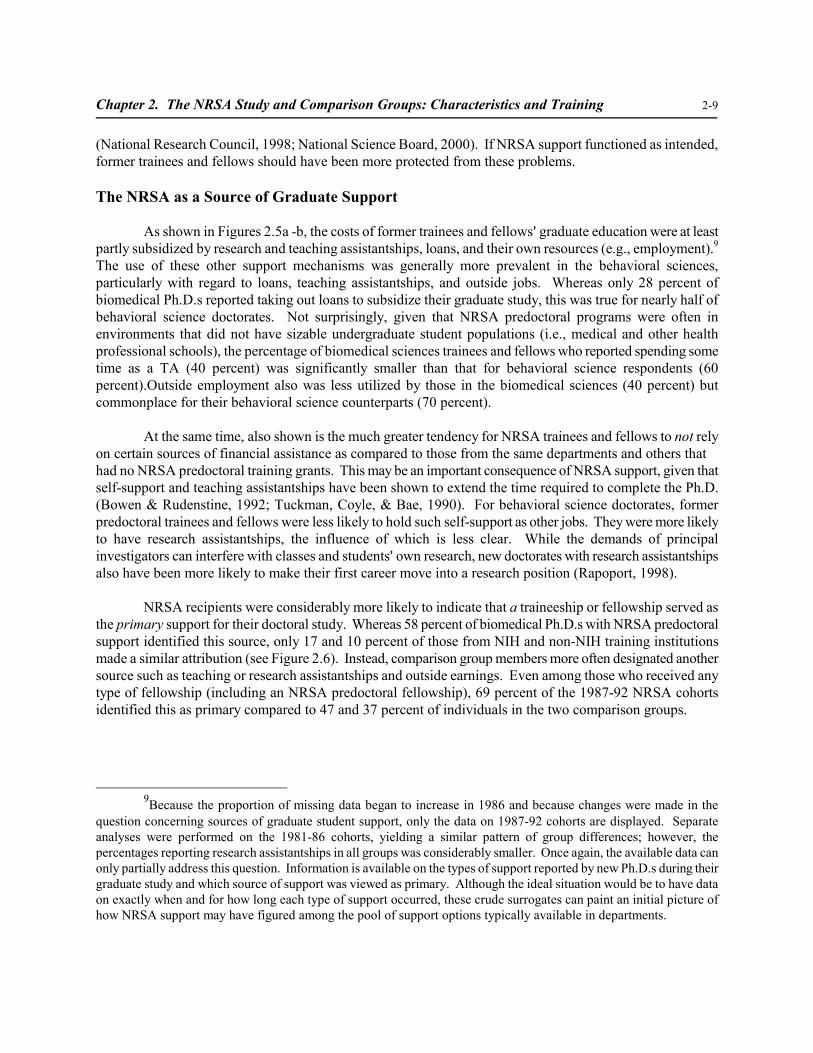
Chapter 2. The NRSA Study and Comparison Groups: Characteristics and Training 2-9
(National Research Council, 1998; National Science Board, 2000). If NRSA support functioned as intended, former trainees and fellows should have been more protected from these problems.
The NRSA as a Source of Graduate Support
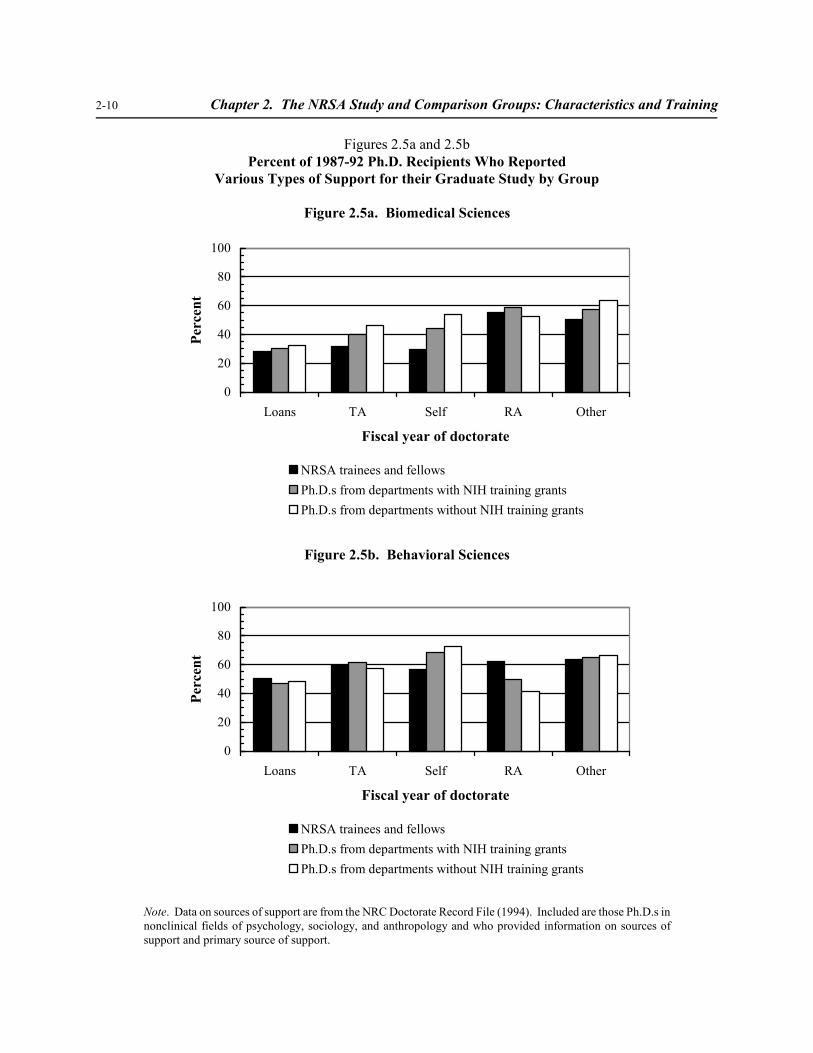
As shown in Figures 2.5a -b, the costs of former trainees and fellows= graduate education were at least partly subsidized by research and teaching assistantships, loans, and their own resources (e.g., employment).9
The use of these other support mechanisms was generally more prevalent in the behavioral sciences, particularly with regard to loans, teaching assistantships, and outside jobs. Whereas only 28 percent of biomedical Ph.D.s reported taking out loans to subsidize their graduate study, this was true for nearly half of behavioral science doctorates. Not surprisingly, given that NRSA predoctoral programs were often in environments that did not have sizable undergraduate student populations (i.e., medical and other health professional schools), the percentage of biomedical sciences trainees and fellows who reported spending some time as a TA (40 percent) was significantly smaller than that for behavioral science respondents (60 percent).Outside employment also was less utilized by those in the biomedical sciences (40 percent) but commonplace for their behavioral science counterparts (70 percent).
At the same time, also shown is the much greater tendency for NRSA trainees and fellows to not rely on certain sources of financial assistance as compared to those from the same departments and others that had no NRSA predoctoral training grants. This may be an important consequence of NRSA support, given that self-support and teaching assistantships have been shown to extend the time required to complete the Ph.D. (Bowen & Rudenstine, 1992; Tuckman, Coyle, & Bae, 1990). For behavioral science doctorates, former predoctoral trainees and fellows were less likely to hold such self-support as other jobs. They were more likely to have research assistantships, the influence of which is less clear. While the demands of principal investigators can interfere with classes and students= own research, new doctorates with research assistantships also have been more likely to make their first career move into a research position (Rapoport, 1998).
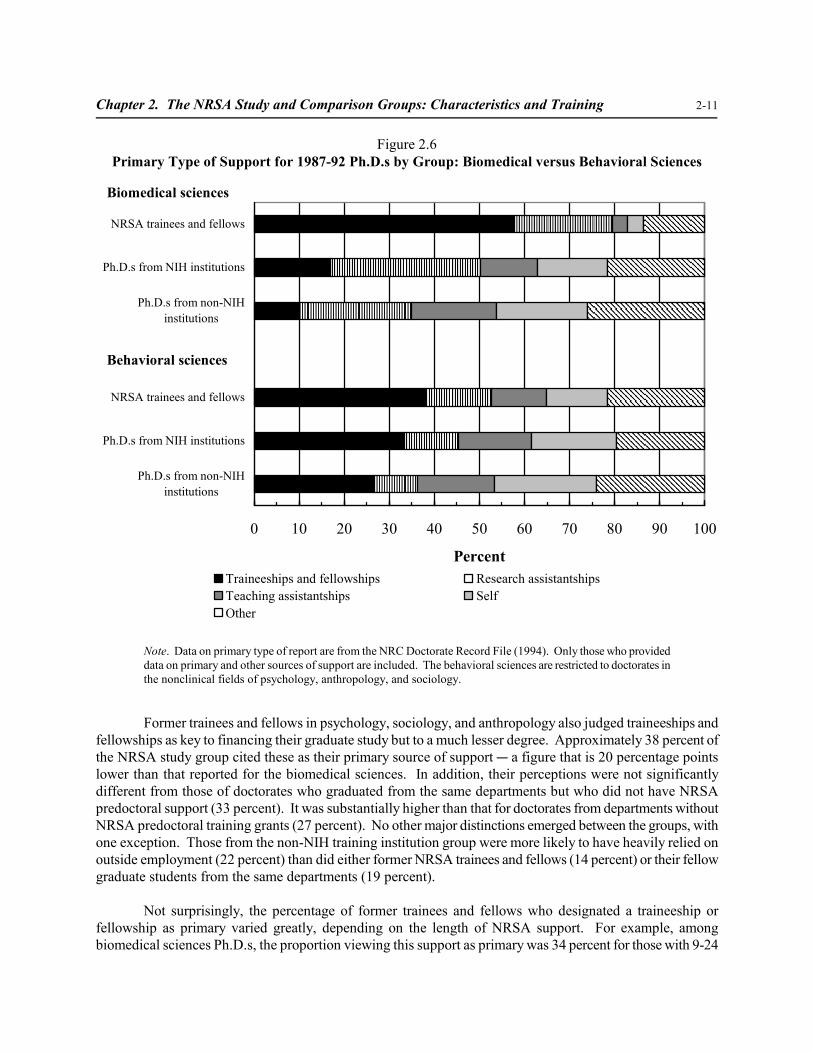
NRSA recipients were considerably more likely to indicate that a traineeship or fellowship served as the primary support for their doctoral study. Whereas 58 percent of biomedical Ph.D.s with NRSA predoctoral support identified this source, only 17 and 10 percent of those from NIH and non-NIH training institutions made a similar attribution (see Figure 2.6). Instead, comparison group members more often designated another source such as teaching or research assistantships and outside earnings. Even among those who received any type of fellowship (including an NRSA predoctoral fellowship), 69 percent of the 1987-92 NRSA cohorts identified this as primary compared to 47 and 37 percent of individuals in the two comparison groups.
9Because the proportion of missing data began to increase in 1986 and because changes were made in the question concerning sources of graduate student support, only the data on 1987-92 cohorts are displayed. Separate analyses were performed on the 1981-86 cohorts, yielding a similar pattern of group differences; however, the percentages reporting research assistantships in all groups was considerably smaller. Once again, the available data can only partially address this question. Information is available on the types of support reported by new Ph.D.s during their graduate study and which source of support was viewed as primary. Although the ideal situation would be to have data on exactly when and for how long each type of support occurred, these crude surrogates can paint an initial picture of how NRSA support may have figured among the pool of support options typically available in departments.
2-10 Chapter 2. The NRSA Study and Comparison Groups: Characteristics and Training
Figures 2.5a and 2.5b Percent of 1987-92 Ph.D. Recipients Who Reported
Various Types of Support for their Graduate Study by Group
Figure 2.5a. Biomedical Sciences
100
80
Perc
ent
Perc
ent 60
40
20
0 Loans TA Self RA Other
Fiscal year of doctorate
NPP
RSA trainees and fellows h.D.s from departments with NIH training grants h.D.s from departments without NIH training grants
Figure 2.5b. Behavioral Sciences
100
80
60
40
20
0 Loans TA Self RA Other
Fiscal year of doctorate
NRSA trainees and fellows Ph.D.s from departments with NIH training grants Ph.D.s from departments without NIH training grants
Note. Data on sources of support are from the NRC Doctorate Record File (1994). Included are those Ph.D.s in nonclinical fields of psychology, sociology, and anthropology and who provided information on sources of support and primary source of support.
Chapter 2. The NRSA Study and Comparison Groups: Characteristics and Training 2-11
Figure 2.6 Primary Type of Support for 1987-92 Ph.D.s by Group: Biomedical versus Behavioral Sciences
Biomedical sciences
NRSA trainees and fellows
Ph.D.s from NIH institutions
Ph.D.s from non-NIH institutions
Behavioral sciences
NRSA trainees and fellows
Ph.D.s from NIH institutions
Ph.D.s from non-NIH institutions
0 10 20 30 40 50 60 70 80 90 100
Percent Traineeships and fellowships Research assistantshipsTeaching assistantships SelfOther
Note. Data on primary type of report are from the NRC Doctorate Record File (1994). Only those who provided data on primary and other sources of support are included. The behavioral sciences are restricted to doctorates in the nonclinical fields of psychology, anthropology, and sociology.
Former trainees and fellows in psychology, sociology, and anthropology also judged traineeships and fellowships as key to financing their graduate study but to a much lesser degree. Approximately 38 percent of the NRSA study group cited these as their primary source of support C a figure that is 20 percentage points lower than that reported for the biomedical sciences. In addition, their perceptions were not significantly different from those of doctorates who graduated from the same departments but who did not have NRSA predoctoral support (33 percent). It was substantially higher than that for doctorates from departments without NRSA predoctoral training grants (27 percent). No other major distinctions emerged between the groups, with one exception. Those from the non-NIH training institution group were more likely to have heavily relied on outside employment (22 percent) than did either former NRSA trainees and fellows (14 percent) or their fellow graduate students from the same departments (19 percent).
Not surprisingly, the percentage of former trainees and fellows who designated a traineeship or fellowship as primary varied greatly, depending on the length of NRSA support. For example, among biomedical sciences Ph.D.s, the proportion viewing this support as primary was 34 percent for those with 9-24
2-12 Chapter 2. The NRSA Study and Comparison Groups: Characteristics and Training
months compared to 59 percent for those with 25-36 months, 70 percent with 37-48 months, and 76 percent with at least five years of NRSA stipends. The same pattern was evident for former trainees and fellows in the behavioral sciences, but the percentages were consistently lower. Whereas 19 percent of those with 9-24 months of support viewed a traineeship or fellowship as key to financing their graduate education, this was true for 39 percent for individuals with 25-36 months, 49 percent from those with 37-48 months, and 54 percent for those with five or more years of NRSA support. Taken together, these data suggest that the NRSA programs were not inconsequential to these individuals= doctoral training experience, but played a smaller role for behavioral science Ph.D.s. This may be a product of the shorter periods of NRSA support typically provided to behavioral science graduate students coupled with the longer time (and perhaps additional costs) to complete the degree.10
It is worth noting that the role of NRSA training in financing one=s graduate study decreased over time. For 1981-86 trainees and fellows, 76 percent of those in the biomedical sciences and 44 percent in the
behavioral sciences identified a traineeship or fellowship as their primary source of support. Corresponding figures for the 1987-92 cohorts were 58 and 29 percent. Similar declines did not occur in the two comparison groups.11 This may suggest the lower purchasing power of the NRSA stipends, which may be problematic in attracting talented students.12 The recent increase in stipends should help remedy this problem.
The Quality of Doctoral Training Environments
As previously noted, the NRSA programs are intended to recruit not only talented graduate students but also support them in acquiring the best possible research training in their chosen field. Thus, those in the NRSA study group should have (a) been highly accomplished individuals who (b) received their doctoral training in distinguished biomedical, health, and behavioral sciences doctoral programs.
Determining whether the first criterion was met was difficult, given the lack of data on individual research talent or scholarly ability.13 Although programs often rely on Graduate Record Examination (GRE)
10Despite possible problems with question ambiguity and non-response (e.g., Ingram & Reis, 1994), the pattern of results (i.e., substantially larger percentages identifying a traineeship and fellowship as primary and the variation in the percentages of NRSA recipients associated with the duration of their support) provides more confidence in using these data to examine the role of NRSA support in terms of financing graduate study.
11Twenty percent of both the 1981-86 and 1987-92 biomedical Ph.D.s from NIH training institutions viewed traineeships and fellowships as key forms of financial assistance, and this was true for 11 percent of those from departments with no NIH training grants. Among behavioral science doctorates, there was a slight decline in the proportions for those from the same departments (20 percent of the 1981-82 cohort versus 12 percent of the 1987-92 cohort) and little change for the non-NIH training institution group (9 and 7 percent, respectively).
12This argues against the possibility that the differences resulted solely from changes in the survey questions and the larger proportion of missing data among the 1987-92 cohorts, given that these methodological artifacts should have affected all groups similarly.
13For NRSA predoctoral fellows, the fact that individual awards were based on surviving the NIH peer review system is one approximate indicator of a selection process designed to identify talent and merit. For trainees, however, the situation is much less clear, given that award decisions are made at the institutional level and may vary across programs. Anecdotal information from training directors and department chairs indicates some degree of heterogeneity;
Chapter 2. The NRSA Study and Comparison Groups: Characteristics and Training 2-13
scores to identify the Abest@ applicants, such information is not routinely collected by the NIH or readily available. At the same time, the usefulness of GRE scores as a valid measure of research talent is unclear. They appear be more strongly related to undergraduate performance than to later success as an investigator (e.g., Briel, O=Neill, & Scheuneman, 1993). For example, correlations between GRE scores and first-year graduate GPA and faculty ratings have been found, but they ranged from 0.14 to 0.48, depending on the field, study, and the GRE score used (e.g., Schneider & Briel, 1990). The validity of these measures for even predicting first-year graduate GPA has been mixed. In some cases, the typical coefficients have been around 0.20-0.28 (e.g., Burton & Turner, 1983). However, a meta-analysis of thirty published studies found statistically nonsignificant correlations (Morrison & Morrison, 1995). When the criterion was Ph.D. attainment, time-to-degree, or number of publications, the relationships weakened or disappeared (Clark & Centra, 1982; Schrader, 1978, 1980).
To obtain some sense of the quality of former NRSA trainees and fellows and the research training that they received, two traditional measures related to the quality of academic institutions were used. NRSA study and comparison group members were contrasted on the selectivity of their baccalaureate institution (as indicated by the average SAT score for entering freshmen) and the reputational ratings of their biomedical or behavioral science doctoral programs (Goldberger, Maher, & Flattau, 1995). These measures bear some relationship to research aptitude and training quality. In one study, the correlations of the SAT Verbal and Math Scores to the GRE Analytical and MCAT scores were both 0.76 (Astin, 1992). Also, the prestige of the undergraduate university has been shown to positively correlate to training in a research-oriented environment, which, in turn, correlates with later research productivity (O=Brecht, Pihl, & Bois, 1989). Although data were available only at the institutional level, they provide at least some sense of the selectivity of the Ph.D.-granting program, given that more stringent thresholds for acceptance are typically associated with the most research-intensive doctoral programs.
Undergraduate Background
Looking at individuals= baccalaureate lineage, approximately 15 percent of all 1981-92 Ph.D.s in the biomedical sciences graduated from selective undergraduate institutions (as defined by an average SAT/ACT score of 1,200 or higher for incoming freshman in 1991). A higher proportion of NRSA recipients earned their degree from these colleges and universities. Across all cohorts, slightly more than one quarter of the NRSA group (26 percent) received their undergraduate degree from this type of institution B a percentage considerably larger than that for the non-NIH training institution group (7 percent) and for the NIH training comparison group (13 percent). These differences fluctuated little across cohorts, were statistically significant, and reflect small- to moderate-sized differences (see Appendix Table C.3). They also are consistent with the notion that NRSA participants in the biomedical sciences are academically talented.
some emphatically state that the Abest incoming or current students@ are chosen from a large pool of qualified applicants while others consider several other factors such as availability of other support in making their traineeship appointments.
2-14 Chapter 2. The NRSA Study and Comparison Groups: Characteristics and Training
In the behavioral sciences, the percentage of doctorates who came from selective undergraduate institutions was 13 percent overall. Once again, this proportion was higher for former NRSA predoctoral trainees and fellows (19 percent) as compared to 10 percent of doctorates from departments without NRSA training grants. This pattern of small and significant differences was consistent across each cohort (see Appendix Table C.4). In contrast, for those Ph.D.s graduating from the same departments as former NRSA trainees and fellows but who did not receive NRSA predoctoral support, the percentage from selective undergraduate institutions was nearly the same (16 percent) as that for the NRSA study group.
Reputation of the Doctorate-Granting Institution
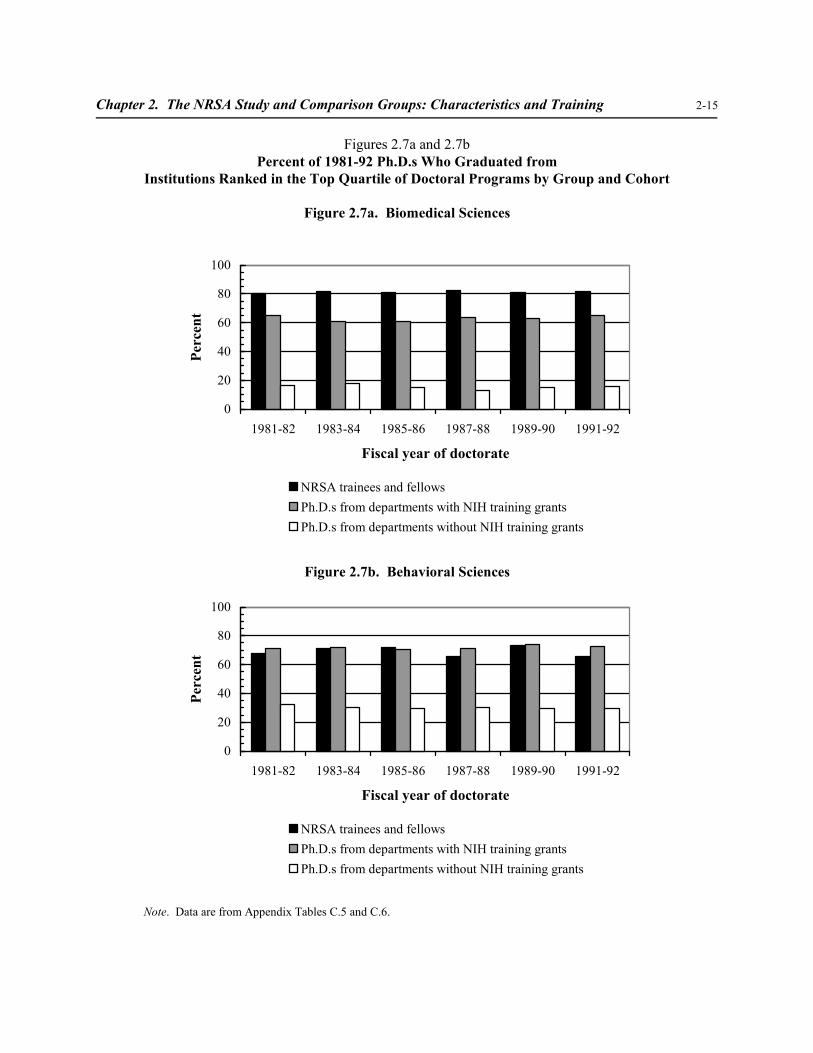
In terms of the proportion of individuals who graduated from distinguished doctoral institutions in the biomedical sciences, the results also are consistent with the picture of NRSA monies being awarded to graduate programs of high quality.14 Between 1981 and 1992, approximately half of the Ph.D.s in the biomedical sciences graduated each year from institutions that ranked in the top quartile on this institutional prestige score. As depicted in Figure 2.7a, individuals who received NRSA training support were substantially more likely than their comparison group counterparts to have graduated from such academic institutions (82 percent). The proportion of those in the non-NIH training institution group was dramatically smaller (16 percent). Among the Ph.D.s from the same institutions as former trainees and fellows but with no NRSA support, approximately 63 percent of the NIH training institution group received their doctorates from such top-ranked biomedical research institutions, representing a statistically reliable different, although more moderate in size. Taken together, this pattern of group differences is consistent with a review process that awards training monies to high-quality doctoral training programs in research-intensive institutions.
Again, the results for the behavioral sciences are both similar and different (see Figure 2.7b). Across all groups, a slightly smaller proportion of doctorates in the nonclinical areas of psychology, sociology, and anthropology earned their degrees from distinguished institutions (46 percent as compared to 52 percent in the biomedical disciplines). Similar to the biomedical sciences, the majority (69 percent) of behavioral science study group members completed their degrees in programs at institutions in the top quartile of those with behavioral science doctoral programs. This proportion was substantially higher than the figure for the non-NIH training institution group (30 percent). Unlike the results for the biomedical fields, however, the percentage of former trainees and fellows from such distinguished programs was nearly identical to that for their fellow graduate students from the same departments (72 percent).15
14In identifying what was a distinguished institution, reputational survey ratings of the scholarly quality of faculty for each doctoral program participating in a recent study by Goldberger, Maher, and Flattau (1995) were used. Because their assessment focused on judging the quality of Ph.D. programs and because the doctoral degree itself is awarded by institutions, an institutional score was derived. For comparisons involving the biomedical sciences, the summary ratings of the eight programs in the relevant fields were averaged for each institution. The same procedure was done in the behavioral sciences, using the ratings for psychology, sociology, and anthropology doctoral programs. Because differences in the distributions of faculty ratings differed somewhat across fields (e.g., some fields had smaller fractions of programs being rated as either Adistinguished@ or Amarginal@), the standardized scores were used in calculating these averages. It is recognized that such institutional ratings are at best a partial reflection of institutional quality, and their use extends far beyond the nature of the individual program data that were collected and the recommendations of the study authors who collected them. At the same time, such a summary index provides some sense of the research-intensiveness of the institution in which one=s graduate training occurred..
15This was true for both psychology and sociology/anthropology.
Chapter 2. The NRSA Study and Comparison Groups: Characteristics and Training 2-15
Figures 2.7a and 2.7b Percent of 1981-92 Ph.D.s Who Graduated from
Institutions Ranked in the Top Quartile of Doctoral Programs by Group and CohortPe
rcen
t Pe
rcen
t
100
80
60
40
20
0
100
80
60
40
20
0
Figure 2.7a. Biomedical Sciences
1981-82 1983-84 1985-86 1987-88 1989-90 1991-92
Fiscal year of doctorate
NRSA trainees and fellows Ph.D.s from departments with NIH training grants Ph.D.s from departments without NIH training grants
Figure 2.7b. Behavioral Sciences
1981-82 1983-84 1985-86 1987-88 1989-90 1991-92
Fiscal year of doctorate
NRSA trainees and fellows Ph.D.s from departments with NIH training grants Ph.D.s from departments without NIH training grants
Note. Data are from Appendix Tables C.5 and C.6.
2-16 Chapter 2. The NRSA Study and Comparison Groups: Characteristics and Training
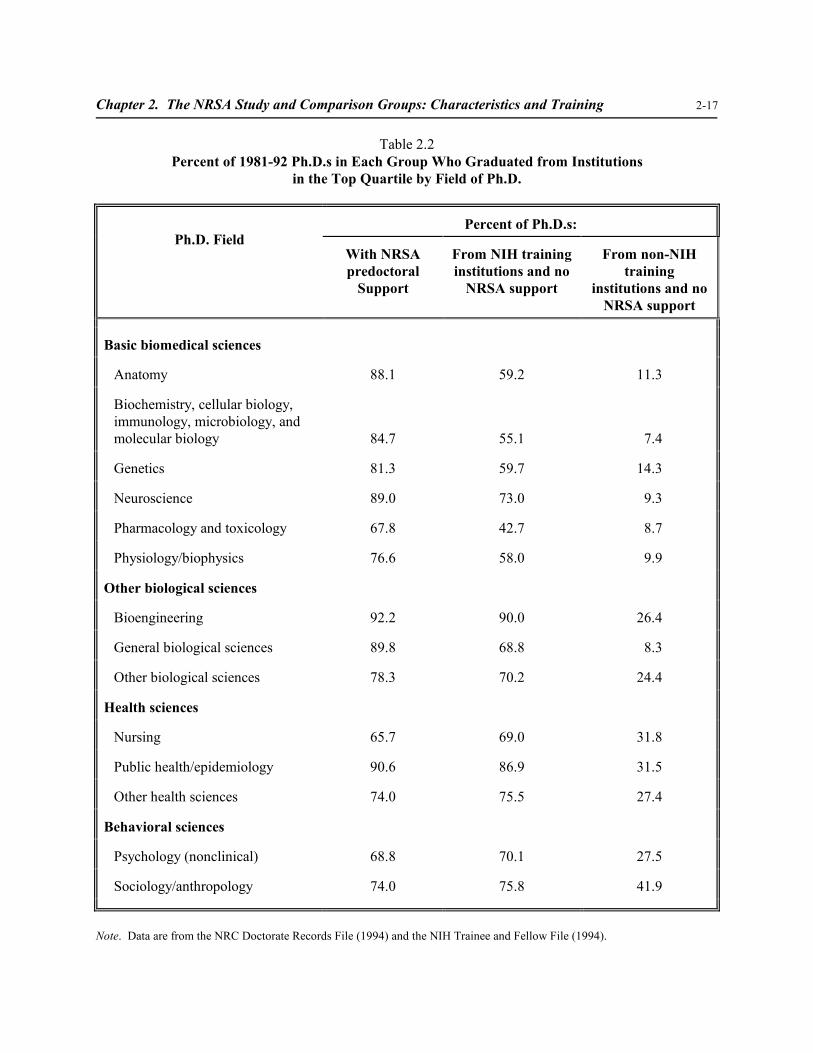
Because the faculty scholarship ratings used in the institutional index for the biomedical sciences disciplines did not include all disciplines supported by NRSA funds, it is useful to examine the percentages of Ph.D.s in the top quartile by field of degree for this group. Depicted in Table 2.2 is the variation among disciplines, ranging from 90-92 percent of the NRSA-supported Ph.D.s in bioengineering and public health/epidemiology graduating from top-ranked institutions to 66-68 percent of those in nursing and pharmacology. Regardless of field, however, nearly two thirds or more of the former NRSA trainees and fellows were trained in these top 50 research institutions. Also illustrated is the variation in terms of the study and comparison group dissimilarity, particularly as it relates to the group consisting of the graduate student counterparts of the NRSA-supported Ph.D.s. In bioengineering, public health/epidemiology, and nursing, these group differences were relatively small C 2-4 percentage points. A much wider disparity characterized the majority of the biological sciences.
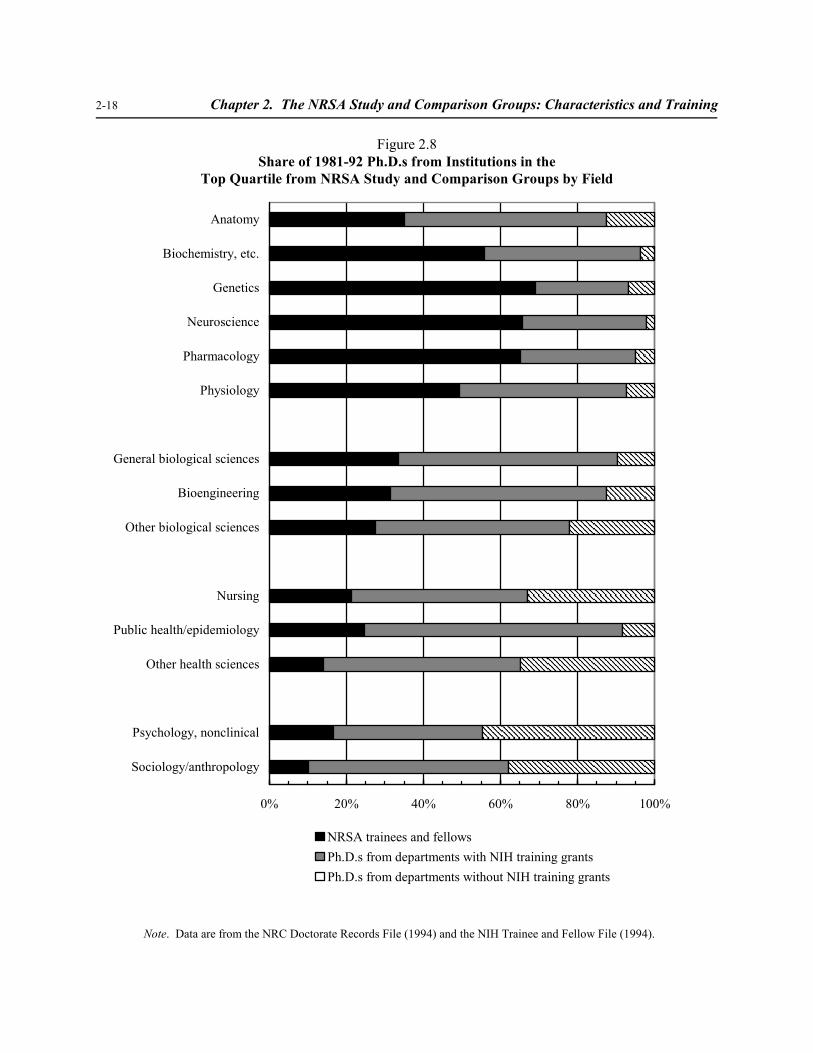
These results suggest differences in the role of NRSA support in graduate training at highly ranked institutions. That is, traineeships and fellowships have contributed more to supporting graduate study in leading research institutions for certain fields than others. Figure 2.8 displays each group=s contribution to the production of Ph.D.s from the top quartile of institutions with biomedical (or behavioral) sciences doctoral programs. As illustrated by the combined percentage of NRSA-supported Ph.D.s and their institutional counterparts (the black and gray portions of each bar), departments with NRSA predoctoral training grants and fellowships produced more than 70 percent of 1981-92 Ph.D.s from distinguished institutions in biochemistry, general biological sciences, genetics, neuroscience, pharmacology, physiology, and public health/epidemiology. Moreover, with the exception of the general biological sciences, slightly more than half of the doctorates from these departments had 9 or more months of NRSA support. Healthy but much smaller percentages of those graduating from top-ranked universities in nursing and other health science disciplines earned their degrees from institutions with NIH training grants.16
The NRSA predoctoral programs occupy a much smaller place in terms of doctoral production from distinguished departments in sociology, anthropology, and the nonclinical areas of psychology. Whereas nearly one half of 1981-92 doctorates in the behavioral sciences graduated from these programs, those with NRSA predoctoral training support comprised about 14 percent of this group. As Figure 2.8 illustrates, its contribution was slightly larger in psychology where 17 percent of those from the top-ranked institutions were former NRSA trainees and fellows. For sociology and anthropology, the figure was 10 percent. Not Surprisingly, the contribution of an NRSA predoctoral award to this group of distinguished graduates was small, given that fewer awards are made to behavioral science programs.
Other Indicators of Doctoral Training Experiences
The training of researchers requires hands-on experience in research and early socialization in functioning as a researcher, including communicating the results of one=s research. Data on the number of
16This is partly a measurement artifact that is associated with having the institutional rankings based on doctoral programs in the basic biomedical sciences. Unfortunately, the health science fields were neither included in Goldberger, Maher, and Flattau=s (1995) study nor are similar assessments available.
Chapter 2. The NRSA Study and Comparison Groups: Characteristics and Training 2-17
Table 2.2 Percent of 1981-92 Ph.D.s in Each Group Who Graduated from Institutions
Note. Data are from the NRC Doctorate Records File (1994) and the NIH Trainee and Fellow File (1994).
2-18 Chapter 2. The NRSA Study and Comparison Groups: Characteristics and Training
Figure 2.8 Share of 1981-92 Ph.D.s from Institutions in the
Top Quartile from NRSA Study and Comparison Groups by Field
Anatomy
Biochemistry, etc.
Genetics
Neuroscience
Pharmacology
Physiology
General biological sciences
Bioengineering
Other biological sciences
Nursing
Public health/epidemiology
Other health sciences
Psychology, nonclinical
Sociology/anthropology
0% 20% 40% 60% 80% 100%
NRSA trainees and fellows Ph.D.s from departments with NIH training grants Ph.D.s from departments without NIH training grants
Note. Data are from the NRC Doctorate Records File (1994) and the NIH Trainee and Fellow File (1994).
Chapter 2. The NRSA Study and Comparison Groups: Characteristics and Training 2-19
articles published between 1981 and the completion of the doctorate were available on a sample of the 1987-88 cohort in the biomedical sciences. To avoid counting articles published while an undergraduate and articles stemming from one=s dissertation, the period covering three years prior to the Ph.D. was examined.
Of the NRSA trainees and fellows, an estimated 56 percent had published at least one article during this time period as compared to 45 and 43 percent of the NIH training and non-NIH training comparison groups. These differences were small in magnitude and statistically significant. Although the average number of articles for those who published did not differ significantly (the means ranged from 2.5 for the NRSA group to 2.6 for both comparison groups), these findings suggest that NRSA trainees and fellows are more likely to be involved in research and on projects that result in at least one coauthored publication.17 Such early socialization and success in research (i.e., early publication productivity) have been linked with later research career outcomes.18
Comparability of the NRSA Study and Comparison Groups on Other Characteristics
The preceding section presented data that consistently point to NRSA support being awarded to high-quality biomedical research institutions. This speaks to the coherence between the goals of the NRSA program and its actual implementation. It also highlights noticeable differences between those receiving and not receiving NRSA traineeships and fellowships in terms of the locus and reputation of their doctoral institution B factors that have been linked to performance on several measures associated with research careers.
In addition to the quality of one=s doctoral training and the type of support used to finance this education, other variables have been associated with differential career achievement. Of obvious importance is the field of the doctorate, which is related to the pursuit of postdoctoral training, the labor market conditions facing recent Ph.D.s, and publication standards and outlets. In addition, several studies have identified the implications of gender, minority, and age differences on career opportunities. Among their findings include lengthier time-to-degree for Blacks (Pearson, 1985), underrepresentation of both women and minorities among tenured faculty (Commission on Professionals in Science and Technology, 1994), lower publication counts for women and minorities (Cole & Zuckerman, 1984; Helmreich et al., 1980; Pearson, 1985), but higher citations per individual paper for women (Long, 1992; Sonnert & Holton, 1995). Based on these findings, the compositions of the NRSA study and comparison groups were examined on selected background characteristics.
The Biomedical Sciences
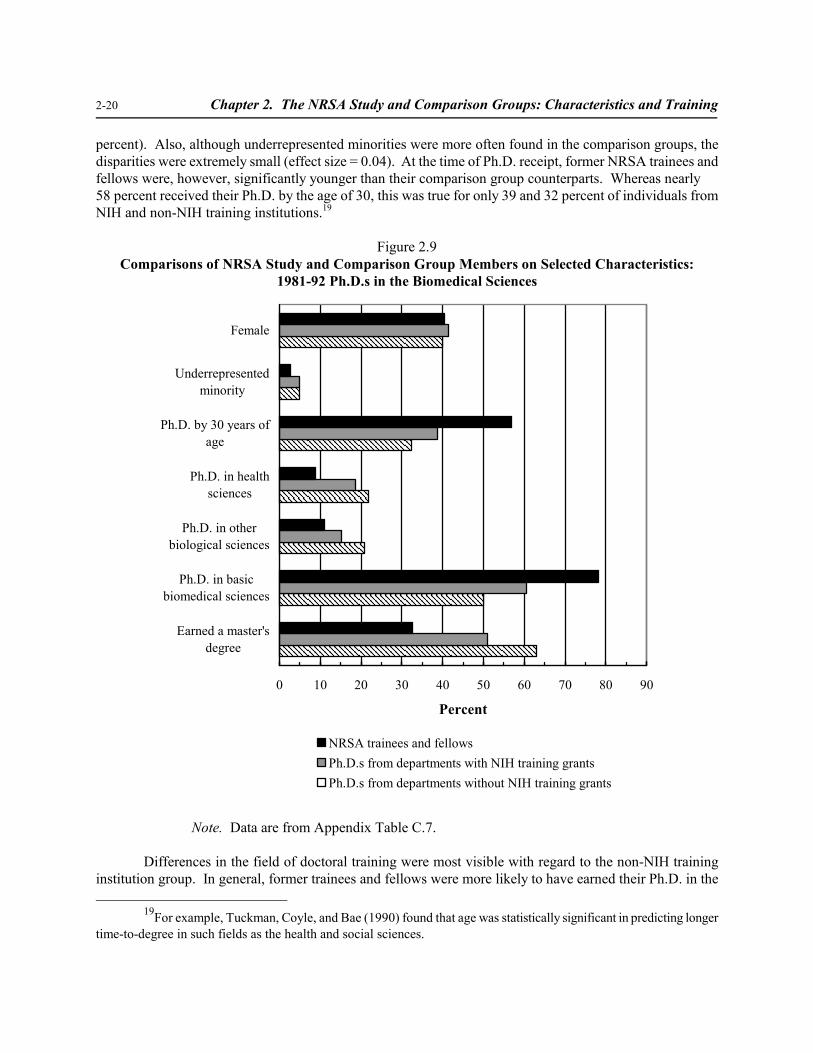
Figure 2.9 compares these background characteristics for the biomedical sciences study and comparison groups. Across all cohorts, the percentages of women in each group were nearly identical (40 - 41
17The means and standard deviations for the three groups were 2.50 and 1.86 for NRSA, 2.62 and 2.58 for NIH training institutions, and 2.60 and 2.03 for institutions with no NRSA predoctoral support. The statistical analyses were based on logarithmic transformations of publication counts due to the skewed nature of the distributions.
18The number of 1987-88 Ph.D.s in the behavioral sciences who had NRSA predoctoral support was too small to permit meaningful comparisons.
2-20 Chapter 2. The NRSA Study and Comparison Groups: Characteristics and Training
percent). Also, although underrepresented minorities were more often found in the comparison groups, the disparities were extremely small (effect size = 0.04). At the time of Ph.D. receipt, former NRSA trainees and fellows were, however, significantly younger than their comparison group counterparts. Whereas nearly 58 percent received their Ph.D. by the age of 30, this was true for only 39 and 32 percent of individuals from NIH and non-NIH training institutions.19
Figure 2.9 Comparisons of NRSA Study and Comparison Group Members on Selected Characteristics:
1981-92 Ph.D.s in the Biomedical Sciences
Female
Underrepresented minority
Ph.D. by 30 years of age
Ph.D. in health sciences
Ph.D. in other biological sciences
Ph.D. in basic biomedical sciences
Earned a master's degree
0 10 20 30 40 50 60 70 80 90
Percent
NRSA trainees and fellows Ph.D.s from departments with NIH training grants Ph.D.s from departments without NIH training grants
Note. Data are from Appendix Table C.7.
Differences in the field of doctoral training were most visible with regard to the non-NIH training institution group. In general, former trainees and fellows were more likely to have earned their Ph.D. in the
19For example, Tuckman, Coyle, and Bae (1990) found that age was statistically significant in predicting longer time-to-degree in such fields as the health and social sciences.
Chapter 2. The NRSA Study and Comparison Groups: Characteristics and Training 2-21
basic biomedical sciences; doctorates in other biological disciplines (e.g., biology and zoology) and the health sciences were more concentrated in the comparison groups. Whereas 78 percent of trainees and fellows received their doctorates in the basic biomedical sciences (e.g., biochemistry, cell/molecular biology, neuroscience, and pharmacology), this was true for 61 percent of those from NIH training institutions and 58 percent of those from non-NIH training institutions. Greater percentages of the NRSA study group earned Ph.D.s in each of the basic biomedical disciplines except physiology and biophysics. In contrast, approximately 11 percent of former trainees and fellows graduated from programs in the other biological sciences as compared to 15 and 21 percent of the NIH and non-NIH training institution groups. Corresponding figures for the health science disciplines were 9, 19, and 22 percent, respectively. Within this cluster, there were fewer NRSA-supported Ph.D.s in every discipline except public health and epidemiology where the percentages for the study and the non-NIH training institutions group were nearly identical.
Groups were compared on the extent to which they received a master=s degree at either the same institution as their Ph.D. or from a different university. This variable was chosen, given its relationship to the time required to complete the degree and the type of training received (e.g., variation among programs in degree requirements). In general, earning a master=s degree on the way to the doctorate, either from the same or a different institution that awarded the Ph.D., was much more common of comparison group members than NRSA trainees and fellows. Whereas 41 percent of those from NIH training institutions and 63 percent of those from non-NIH training institutions received a master=s degree, this was true for only one third of NRSA trainees and fellows B a group that had a lower representation of Ph.D.s in such fields as nursing and public health.
The Behavioral Sciences
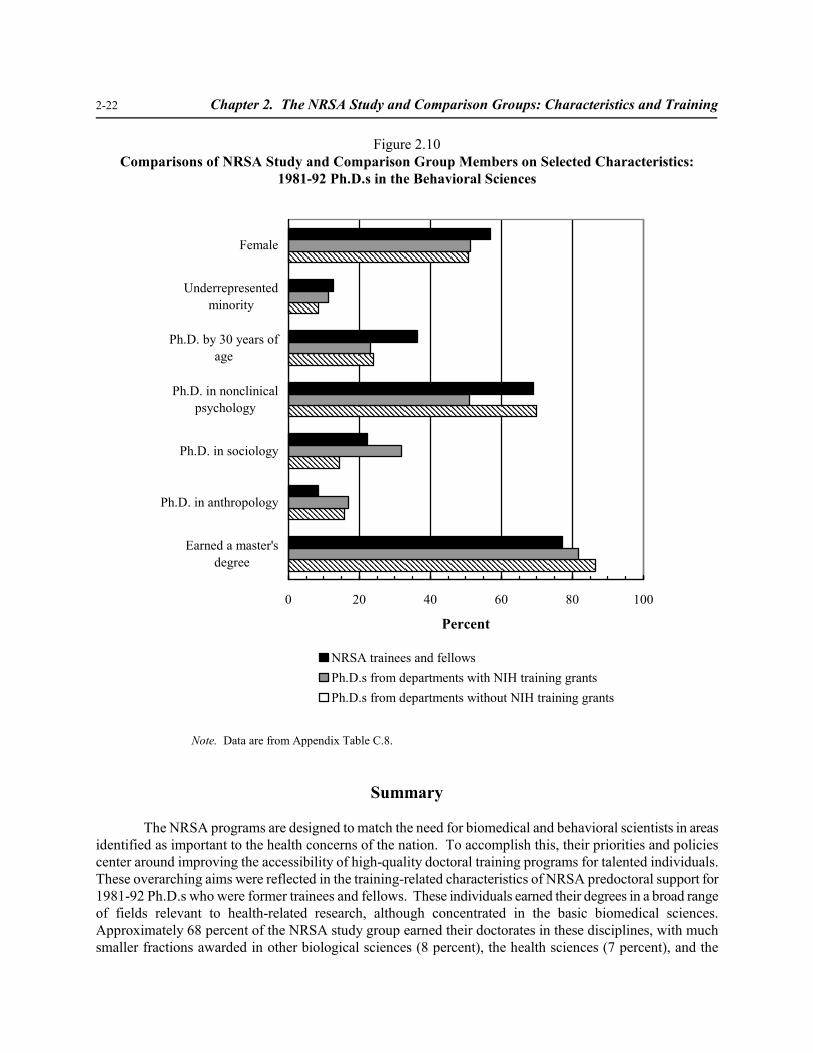
In general, doctorates in the behavioral sciences are more likely to be women, members of underrepresented ethnic minorities, and older at the time of Ph.D. receipt than those in the biomedical sciences. Nevertheless, former NRSA trainees and fellows differed in some ways from their comparison group
counterparts (see Figure 2-10). Compared to both those from NIH and non-NIH training institutions, a slightly larger percentage of NRSA-supported doctorates were women (57 versus 51 percent). They also were more likely to be an underrepresented minority than were those graduating from departments with no NRSA predoctoral training support (13 percent versus 8 percent). Similar to the biomedical sciences, former trainees and fellows completed their degree at a younger age than either comparison group; whereas 36 percent of study group members graduated by the time they were 30, this was true for only 23 percent of both comparison groups.
Across all cohorts, approximately 69 percent of those with NRSA predoctoral support received their doctorate in a nonclinical field of psychology, 22 percent graduated with Ph.D.s in sociology, and the remaining 9 percent were trained in anthropology. The NIH training institution group, however, was noticeably less populated by psychologists (51 percent) but by considerably more sociologists and anthropologists (32 and 17 percent, respectively). Those who graduated from departments without NRSA predoctoral training grants were less likely to have been in sociology (14 percent) and but nearly twice as likely to have earned a degree in anthropology (16 percent) as compared to their NRSA counterparts.
Earning a master=s degree is a common practice among behavioral sciences doctoral programs, with 84 percent of all Ph.D.s holding a master=s degree. However, former NRSA trainees and fellows (77 percent) were less likely to have a master=s degree than those from departments with no NIH training grants (86 percent). This 10-point percentage difference stemmed from the greater tendency of those from departments without NRSA predoctoral training grants to have their students enroll with a master=s degree that was earned at a different institution rather than as part of the doctoral training program.
2-22 Chapter 2. The NRSA Study and Comparison Groups: Characteristics and Training
Figure 2.10 Comparisons of NRSA Study and Comparison Group Members on Selected Characteristics:
1981-92 Ph.D.s in the Behavioral Sciences
Female
Underrepresented minority
Ph.D. by 30 years of age
Ph.D. in nonclinical psychology
Ph.D. in sociology
Ph.D. in anthropology
Earned a master's degree
0 20 40 60 80 100
Percent
NRSA trainees and fellows Ph.D.s from departments with NIH training grants Ph.D.s from departments without NIH training grants
Note. Data are from Appendix Table C.8.
Summary
The NRSA programs are designed to match the need for biomedical and behavioral scientists in areas identified as important to the health concerns of the nation. To accomplish this, their priorities and policies center around improving the accessibility of high-quality doctoral training programs for talented individuals. These overarching aims were reflected in the training-related characteristics of NRSA predoctoral support for 1981-92 Ph.D.s who were former trainees and fellows. These individuals earned their degrees in a broad range of fields relevant to health-related research, although concentrated in the basic biomedical sciences. Approximately 68 percent of the NRSA study group earned their doctorates in these disciplines, with much smaller fractions awarded in other biological sciences (8 percent), the health sciences (7 percent), and the
Chapter 2. The NRSA Study and Comparison Groups: Characteristics and Training 2-23
behavioral sciences (16 percent). Matching the objective of supporting basic mastery in a research field, NRSA support typically was provided in the form of traineeships during the early years of graduate study when the focus is on courses and similar didactic experiences.
Differences between the biomedical and behavioral sciences did emerge, however. Having a predoctoral fellowship was much more frequent among Ph.D.s in the behavioral sciences; whereas 16 percent of the behavioral science Ph.D.s who received NRSA support were fellows, this was true for only 5 percent of those in the biomedical sciences. Former NRSA predoctoral awardees in nonclinical psychology, sociology, and anthropology also were supported for shorter periods of time (the median was 24 months as contrasted with 36 months for the biomedical sciences). For trainees, a larger fraction was first awarded this support in the 4th or later years of graduate study (36 versus 19 percent, respectively).
Across all disciplines, the Ph.D.-granting institutions of former trainees and fellows clearly reflected the objective of sponsoring high-quality training. In every discipline examined, a large majority of NRSA trainees and fellows were trained in institutions ranked in the top quartile of those with biomedical or behavioral science doctoral programs. There was variation among disciplines, however. For example, whereas 66 percent of nursing Ph.D.s and 68 percent of those in pharmacology came from such universities, the corresponding figures for bioengineering and public health/epidemiology exceeded 90 percent.
NRSA training support often played a critical role in supporting graduate study at this group of distinguished institutions, particularly in the basic biomedical science programs. In genetics, neuroscience, and pharmacology, at least 40 percent or more of the Ph.D.s earned between 1981 and 1992 from institutions in the top quartile received at least 9 months of NRSA predoctoral support. Although the fraction was considerably smaller in the other disciplines, it also was the case that regardless of field, departments with NRSA predoctoral training awards produced at least half of the doctorates in their discipline. In some fields, this fraction grew to 70 percent (e.g., genetics, neuroscience, pharmacology, public health, and epidemiology). Thus, if one considers that all students in departments with training grants may have some exposure to NRSA-supported activities, the contribution of these programs to training researchers with the potential for productive research careers is noteworthy.
The available data on the NRSA training experience itself suggest that receiving NRSA support carried with it certain other features that distinguished trainees and fellows from those who did not receive such support. Overall, it appeared that they were freed of using some sources of support that can deter progress on the Ph.D. Moreover, former trainees and fellows were more likely to identify a traineeship/fellowship as primary to financing their doctoral education. Once again, there were differences between the biomedical and behavioral sciences. NRSA recipients in either group were less likely to report depending on outside employment to support graduate school costs, and those in the biomedical sciences also were less likely to have teaching assistantships. And, although behavioral science trainees and fellows in the behavioral sciences viewed a traineeship or fellowship as a major source of financial assistance, it was to a much lesser degree than in the biomedical sciences. This may not be surprising, given the tendency to be supported for shorter periods of time.
Given that source of support has been linked to early progress toward a research career (i.e., time-to-degree and post-graduation plans), these results provide an initial sense of how NRSA programs may facilitate the production of career investigators. In addition, the differences between the biomedical and behavioral sciences may help explain differential performance in the later outcome comparisons.
2-24 Chapter 2. The NRSA Study and Comparison Groups: Characteristics and Training
The merit-based nature of the NRSA training programs, while speaking to the coherence between program goals and operation, also may help account for any differences in later performance. This should be expected B the quality of doctoral training has consistently been linked to academic employment in prestigious universities and other career outcomes, and NRSA support is concentrated in these institutions. Because these two are closely related, this has implications for interpreting the results of analyses designed to determine the Avalue added@ of NRSA training support, over and above other plausible contributors such as the quality of one=s doctoral training. That is, the concentration of NRSA support in institutions with distinguished doctoral programs may play a partial role in accounting for differences in outcomes for those graduating from institutions without NRSA predoctoral training grants.
The shaping of careers, however, is not solely affected by one=s doctoral training. Thus, the role of gender, minority representation, and age also may make some contribution. Furthermore, field of the degree possesses implications for what is considered appropriate Aperformance standards@ on many research-related outcomes (e.g., authorship of articles versus books or book chapters). In both the biomedical and behavioral sciences, the study and comparison groups differed in certain ways. The largest differences were with regard to field of study. For the biomedical sciences, not only were NRSA recipients more likely to be trained in the basic biomedical sciences, but this training more often occurred in fields where there have been recognized advancements B e.g., neuroscience and cellular and molecular biology. Among the behavioral sciences, those in the comparison groups were more likely to earn their degrees in sociology or anthropology. In both field clusters, those with NRSA support also tended to be younger at the time of their Ph.D. than their non-NRSA counterparts.
These differences and their possible influence on career choices and opportunities justify their consideration when trying to identify the role of NRSA support. Thus, in Chapters 3 and 4, group differences on outcomes have been probed to determine the contribution of these other factors.
It is recognized that the information on both NRSA predoctoral training and individual background characteristics is incomplete. For example, the available data on NRSA support is based on the basic administrative information that is regularly collected by the NIH.20 Data on other sources of support for doctoral study indicate only receipt or non-receipt rather than when or for how long such support was provided. Consequently, many key ingredients of the doctoral training experience such as multidisciplinary content,
faculty contact, and mentoring (e.g., Anderson, 1996) are not captured, and these are often the very components believed to be unique among NRSA predoctoral training programs. The same is true for variables related to career progress, including personality and motivation (e.g., Berg & Ferber, 1983; O=Brecht, Pihl, & Boss, 1989). Nevertheless, what is available indicates that both the modes of financial support utilized by NRSA predoctoral trainees and fellows and the environments in which they were trained differed from other graduate students. These differences have been found to be associated with certain career outcomes B the topic of the remaining chapters.
20This includes the type of award (traineeship or fellowship), the sponsoring Institute, and the appointment and termination dates. Although discipline, specialty, and field of training also are encoded, they were not used because of problems with coding errors, inconsistency in who provides the information, and missing data.
Chapter 2. The NRSA Study and Comparison Groups: Characteristics and Training 2-25
References
Ammons, S. W., Jr., & Kelly, D. E. (1997). Profile of the graduate student population in U.S. medical schools. Academic Medicine, 72, 820-830.
Anderson, M. S. (1996). Collaboration, the doctoral experience, and the departmental environment. The Review of Higher Education, 19, 305-326.
Astin, A. W. (1992). Factors influencing acquisition of scientific knowledge and quantitative competency. In A. Astin & H. S. Astin (Eds.)., Undergraduate science education: The impact of different college environments on the educational pipeline in the sciences. (Grant SPA-8955365). Los Angeles, CA: Higher Education Research Institute.
Berg, H. M., & Ferber, M. A. (1983). Men and women graduate students: Who succeeds and why? Journal of Higher Education, 54, 629-648.
Bowen, W. G., & Rudenstine, N. L. (1992). In pursuit of the Ph.D. Princeton, NY: Princeton University Press.
Briel, J. B., O=Neill, K. A., & Scheuneman, J. D. (1993). GRE technical manual: Test development, score interpretation, and research for the Graduate Record Examinations Program. Princeton, NJ: Educational Testing Service.
Burton, N. W., & Turner, N. J. (1983). Effectiveness of the Graduate Record Examinations for predicting first-year grades: 1981-82 summary of the Graduate Record Examination Validity Study Service. Princeton, NJ: Educational Testing Service.
Clark, M. J., & Centra, J. A. (1982). Conditions influencing career accomplishments of Ph.D.s. (GRE Board Professional Report No. 76-1R). Princeton, NJ: Educational Testing Service.
Cole, J. R., & Quckerman, H. (1984). The productivity puzzle: Persistence and change in patterns of publication among men and women scientists. In P. Maehr & M. W. Steinkamp (Eds.), Advances in motivation and achievement. Greenwich, CT: JAI. (pp. 217-256).
Commission on Professionals in Science and Technology. (1994). Professional women and minorities: A total human resource data compendium. (11th edition). Washington, DC: Author.
Ehrenberg, R. G., & Mavros, P. G. (1995). Do doctoral students= financial support patterns affect their times-to-degree and completion probabilities? Journal of Human Resources, 30, 581-609.
Helmreich, R. L., Spence, J. T., Beane, W. E., Lucker, G. W., & Matthews, K. A. (1980). Making it in academic psychology: Demography and personality correlates of attainment. Journal of Personality and Social Psychology, 39, 896-908.
Goldberger, M. L., Maher, B. A., & Flattau, P. E. (Eds.). (1995). Research-doctorate programs in the United States: Continuity and change. Washington, DC: National Academy Press.
2-26 Chapter 2. The NRSA Study and Comparison Groups: Characteristics and Training
Ingram, L., & Reis, P. (1994). Validation study of the Survey of Earned Doctorates. Washington, DC: Office of Scientific and Engineering Personnel, National Research Council.
Long, J. S. (1992). Measures of sex differences in scientific productivity. Social Forces, 71, 159-178.
Long, J. S., & Fox, M. F. (1995). Scientific careers: Universalism and particularism. Annual Review of Sociology, 21, 45-71.
Morrison, T., & Morrison, M. (1995). A meta-analytic assessment of the predictive validity of the quantitative and verbal components of the Graduate Record Examination with graduate grade point average representing the criterion of graduate success. Educational and Psychological Measurement, 55, 309-316.
National Research Council. (1994). Meeting the nation=s need for biomedical and behavioral scientists. Washington, DC: National Academy Press.
National Research Council. (1998). Trends in the early careers of life scientists. Washington, DC: National Academy Press.
National Science Board. (2000). Science and engineering indicators B 2000 (NSF 00-1). Arlington, VA: National Science Foundation.
National Science Foundation. (1999). Characteristics of doctoral scientists and engineers in the United States: 1997 (NSF 00-308). Arlington, VA: Author.
O=Brecht, M., Pihl, R. O., & Bois, P. (1989). Criteria for granting research training awards to graduate students. Research in Higher Education, 30 (6), 647-664.
Pearson, W. (1985). Black scientists, white society, and colorless science: A study of universalism in American science. Millwood, NY: Association of Faculty.
Rapoport, A. I. (1998, July 22). Are forms of financial support and employment choices of recent science and engineering Ph.D.s related?. (NSF 98-320). Arlington, VA: National Science Foundation.
Schrader, W. B. (1978). Admissions test scores as predictors of career achievement in psychology (GRE Board Professional Report No. 76-1R). Princeton, NJ: Educational Testing Service.
Schrader, W. B. (1980). GRE scores as predictors of career achievement in history (GRE Board Professional Report No. 76-1R). Princeton, NJ: Educational Testing Service.
Sonnert, G., & Holton, G. (1995). Gender differences in science careers: The Project Access Study. New Brunswick, NJ: Rutgers University Press.
Tuckman, H., Coyle, S., & Bae, Y. (1990). On time to the doctorate: A study of the increased time to complete doctorates in science and engineering. Washington, DC: National Academy Press.