Date post: | 29-May-2019 |
Category: |
Documents |
Upload: | truongtram |
View: | 220 times |
Download: | 0 times |
Chapter 2
Supply and Demand
Learning Objectives
After reading this chapter you should be able to:
LO1 Illustrate and explain the economic model of supply and demand.
LO2 Define many terms, including supply, demand, quantity supplied, and quantity demanded.
LO3 Utilize the intuition behind the supply and demand relationships as well as the variables that can change these relationships to manipulate the supply and demand model.
Chapter Outline
Supply and Demand Defined
The Supply and Demand Model
All about Demand
All about Supply
Determinants of Demand
Determinants of Supply
The Effect of Changes in Price Expectations on the Supply and Demand Model
Page 1
© 2018 by McGraw-Hill Education. This is proprietary material solely for authorized instructor use. Not authorized for sale or distribution in any manner. This document may not be copied, scanned, duplicated, forwarded, distributed, or posted on a website, in whole or part.
Kick It Up a Notch: Why the New Equilibrium?
Page 2
© 2018 by McGraw-Hill Education. This is proprietary material solely for authorized instructor use. Not authorized for sale or distribution in any manner. This document may not be copied, scanned, duplicated, forwarded, distributed, or posted on a website, in whole or part.
Teaching Tip
Emphasize that this chapter is fundamental to nearly everything they will study in the course and that this is not a chapter they can fake.
SUPPLY AND DEMAND DEFINED
Definitions
Supply and Demand: the name of the most important model in all economics
Price: the amount of money that must be paid for a unit of output
Market: any mechanism by which buyers and sellers negotiate price
Output: the good or service and/or the amount of it sold
Consumers: those people in a market who are wanting to exchange money for goods or services
Producers: those people in a market who are wanting to exchange goods or services for money
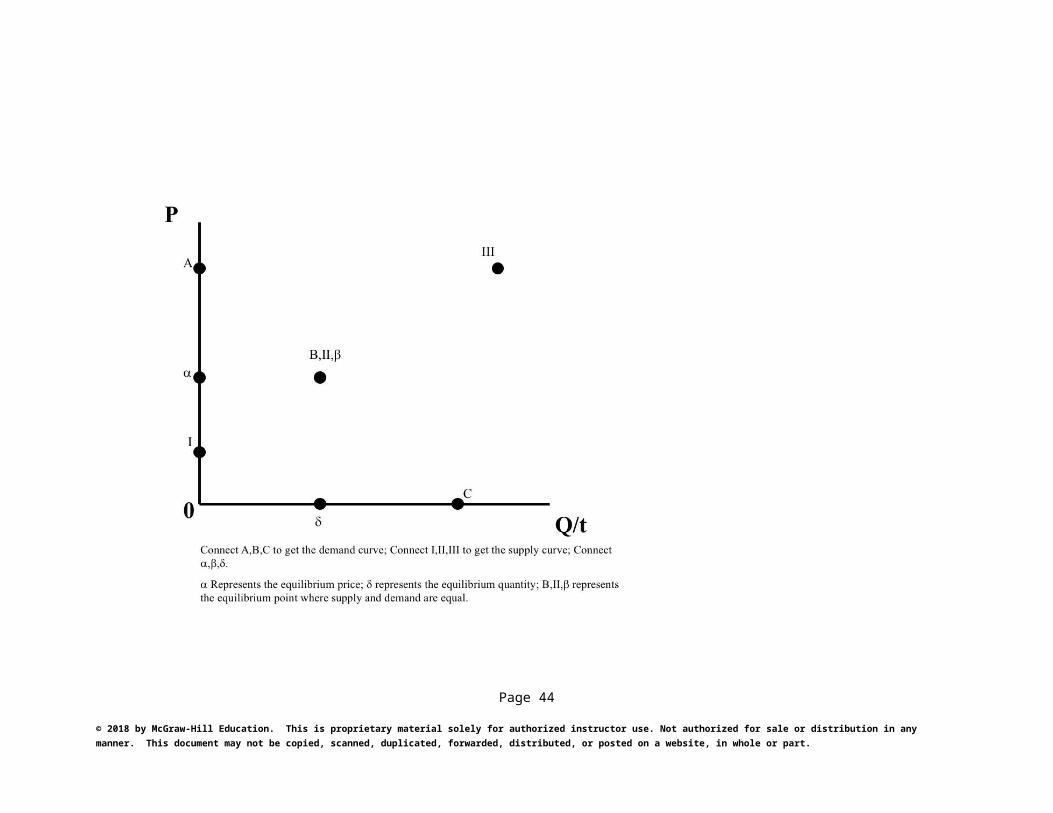
Equilibrium Price: the price at which no consumers wish they could have purchased more goods at that price; no producers wish that they could have sold more
Equilibrium Quantity: the amount of output exchanged at the equilibrium price
Quantity Demanded and Quantity Supplied
Quantity Demanded: how much consumers are willing and able to buy at a particular price during a particular period of time
Quantity Supplied: how much firms are willing and able to sell at a particular price during a particular period of time
Page 3
© 2018 by McGraw-Hill Education. This is proprietary material solely for authorized instructor use. Not authorized for sale or distribution in any manner. This document may not be copied, scanned, duplicated, forwarded, distributed, or posted on a website, in whole or part.
Teaching Tip
Acknowledge the fact that popular press references to supply or demand often are references to quantity supplied or quantity demanded.
Markets
Capitalism
o Free markets in financial capital as well as goods and services
o Freedom to borrow or lend
o Profits go to the owners of capital
Communism
o Capital and the profit that it generates is controlled by a government authority.
o A government authority decides how the money is used.
Socialism
o A significant part of the profit generated by financial capital goes to government in the form of taxes.
o A government uses the tax money to counter the wealth impacts of the distribution of profit.
Page 4
© 2018 by McGraw-Hill Education. This is proprietary material solely for authorized instructor use. Not authorized for sale or distribution in any manner. This document may not be copied, scanned, duplicated, forwarded, distributed, or posted on a website, in whole or part.
Teaching Tip
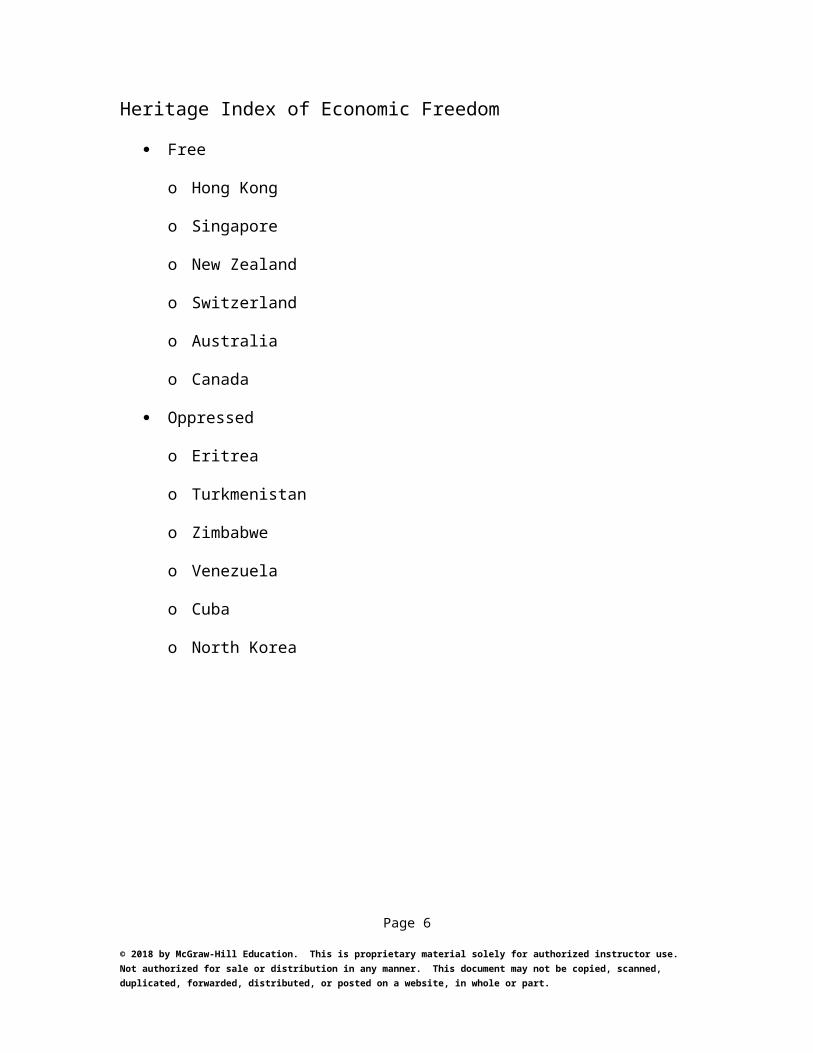
It is worth noting that every industrialized country has an element of a social safety net and that most countries have (legal or illegal) private markets for goods and services. In that sense, there is a spectrum of economic systems and government intervention.
Heritage Index of Economic Freedom
Free
o Hong Kong
o Singapore
o New Zealand
o Switzerland
o Australia
o Canada
Oppressed
o Eritrea
o Turkmenistan
o Zimbabwe
o Venezuela
o Cuba
o North Korea
Page 5
© 2018 by McGraw-Hill Education. This is proprietary material solely for authorized instructor use. Not authorized for sale or distribution in any manner. This document may not be copied, scanned, duplicated, forwarded, distributed, or posted on a website, in whole or part.
Teaching Tips
1) Note that the index comes from the Heritage Foundation and the Wall Street Journal. Refer to their political bent.
2) Note that under President Obama, the United States fell off the “free” list and moved onto the “mostly free” list. This could also be a sign of politically motivated measurement.
3) Use this as an example of the difference between normative and positive analysis.
The Scientific Method and Ceteris Paribus
Scientists
o conduct experiments in laboratories.
o use replication and verification to ensure the accuracy of their conclusions.
Social Scientists
o cannot experiment on their subjects.
o must use models and look at the effects of individual variables within those models.
Economists
o hold variables constant within models to examine the effect of other variables.
o use the Latin phrase ceteris paribus which means “holding other things equal” to identify this is the case.
Demand and Supply
Demand is the relationship between price and quantity demanded, ceteris paribus.
Supply is the relationship between price and quantity supplied, ceteris paribus.
THE SUPPLY AND DEMAND MODEL
Page 6
© 2018 by McGraw-Hill Education. This is proprietary material solely for authorized instructor use. Not authorized for sale or distribution in any manner. This document may not be copied, scanned, duplicated, forwarded, distributed, or posted on a website, in whole or part.
Teaching Tips
1) Discuss how difficult it is to conduct controlled experiments in economics. You can cite, for instance, a Rand Corporation insurance study (from the 1970s) where people were given different health insurance plans to see how they would react (i.e. consuming more, seeing the doctor more).
2) Note for students that a how field of behavioral economics has developed in which experiments
The Demand Schedule
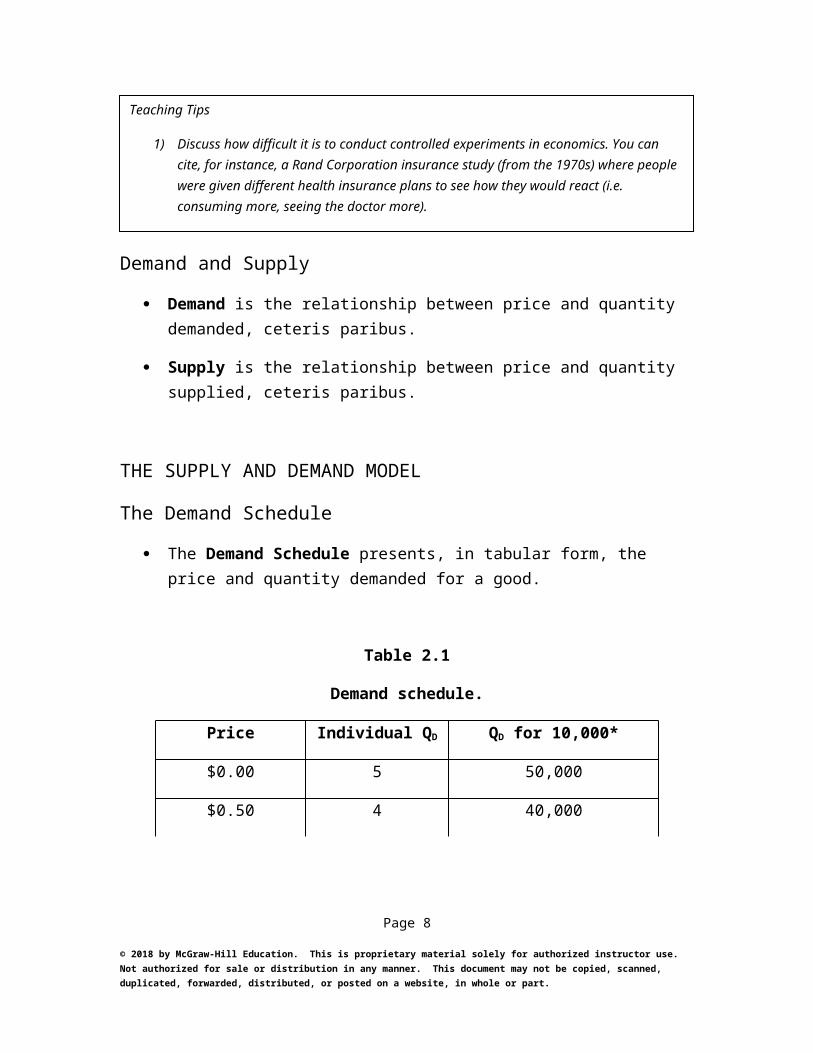
The Demand Schedule presents, in tabular form, the price and quantity demanded for a good.
Table 2.1
Demand schedule.
Price Individual QD QD for 10,000*
$0.00 5 50,000
$0.50 4 40,000
$1.00 3 30,000
$1.50 2 20,000
$2.00 1 10,000
$2.50 0 0
*This is ceteris paribus at work, holding the number and type of people constant.
The Demand Curve
Page 7
© 2018 by McGraw-Hill Education. This is proprietary material solely for authorized instructor use. Not authorized for sale or distribution in any manner. This document may not be copied, scanned, duplicated, forwarded, distributed, or posted on a website, in whole or part.
Drawing Tip
Plot each point individually from the demand schedule.
Page 8
© 2018 by McGraw-Hill Education. This is proprietary material solely for authorized instructor use. Not authorized for sale or distribution in any manner. This document may not be copied, scanned, duplicated, forwarded, distributed, or posted on a website, in whole or part.
The Supply Schedule
The Supply Schedule presents, in tabular form, the price and quantity supplied for a good.
Table 2.2
Supply schedule.
Price Individual Qs Qs for 10 Firms
$0.00 0 0
$0.50 0 0
$1.00 1,000 10,000
$1.50 2,000 20,000
$2.00 3,000 30,000
$2.50 4,000 40,000
The Supply Curve
Page 9
© 2018 by McGraw-Hill Education. This is proprietary material solely for authorized instructor use. Not authorized for sale or distribution in any manner. This document may not be copied, scanned, duplicated, forwarded, distributed, or posted on a website, in whole or part.
Drawing Tip
Plot each point individually from the supply schedule.
Equilibrium, Shortages, and Surpluses
Equilibrium
o is the point where the amount that consumers want to buy and the amount that firms want to sell are the same.
o This occurs where the supply curve and the demand curve cross.
Shortage (Excess Demand): the condition where firms do not want to sell as many as consumers want to buy
Surplus (Excess Supply): the condition where firms want to sell more than consumers want to buy
Table 2.3
Supply and demand schedules with shortage and surplus.
Price Individual Quantity Demanded
Market Quantity Demanded
One Vendor’s Quantity Supplied
Market
Quantity Supplied
Shortage
(Excess Demand)
Surplus
(Excess Supply)
0 5 50,000 0 0 50,000
$0.50 4 40,000 0 0 40,000
$1.00 3 30,000 1,000 10,000 20,000
$1.50 2 20,000 2,000 20,000
$2.00 1 10,000 3,000 30,000 20,000
Page 10
© 2018 by McGraw-Hill Education. This is proprietary material solely for authorized instructor use. Not authorized for sale or distribution in any manner. This document may not be copied, scanned, duplicated, forwarded, distributed, or posted on a website, in whole or part.
$2.50 0 0 4,000 40,000 40,000
The Supply and Demand Model
Page 11
© 2018 by McGraw-Hill Education. This is proprietary material solely for authorized instructor use. Not authorized for sale or distribution in any manner. This document may not be copied, scanned, duplicated, forwarded, distributed, or posted on a website, in whole or part.
Drawing Tip
Draw the demand curve using the data above.
Drawing Tips
1) Draw the supply curve using the data above.
2) Make sure that it crosses at
ALL ABOUT DEMAND
The Law of Demand
o The relationship between price and quantity demanded is a negative or inverse one.
Page 12
© 2018 by McGraw-Hill Education. This is proprietary material solely for authorized instructor use. Not authorized for sale or distribution in any manner. This document may not be copied, scanned, duplicated, forwarded, distributed, or posted on a website, in whole or part.
Teaching Tip
Offer that the “LAW” is not really a law but an observation that almost always holds. In this way, it is similar to Chemistry’s Ideal Gas Law PV=nRT. Just as the ideal gas law works (more or less) most of the time, it is not always precisely true for the non-ideal gases. Demand is not downward sloping for every good, for every person, in every circumstance. Demand by an individual with a broken bone, for
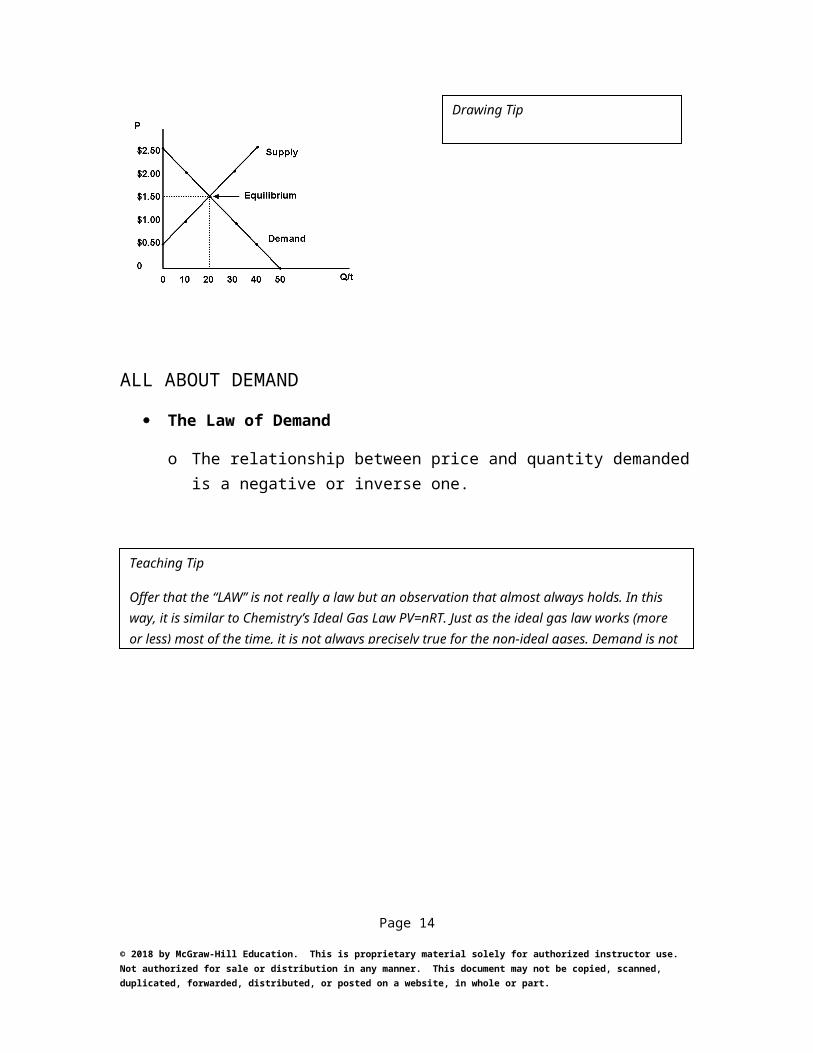
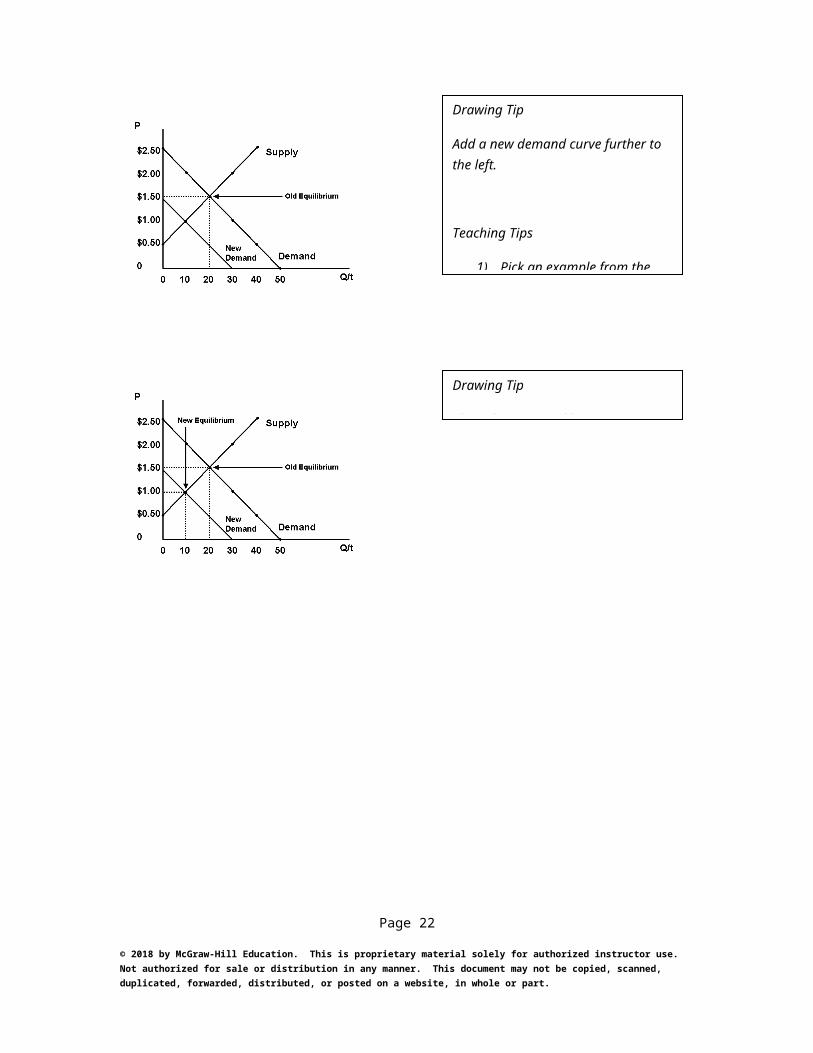
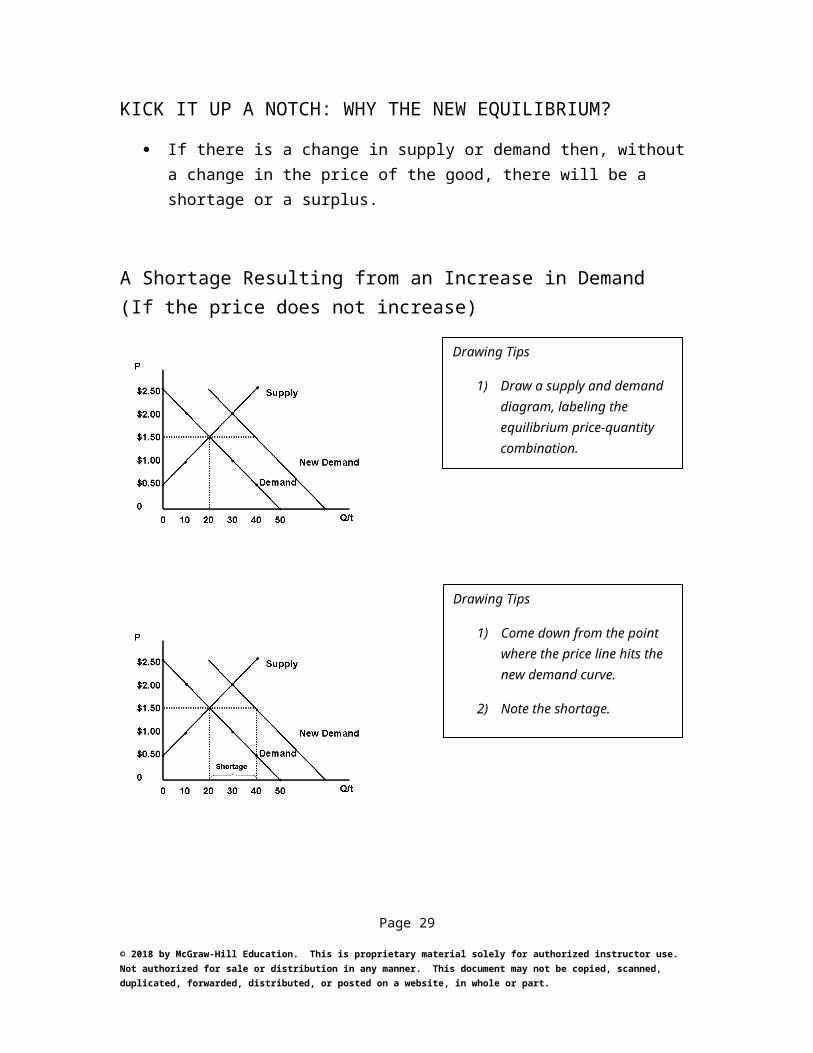
Drawing Tip
Label the equilibrium.
Why Does the Law of Demand Make Sense?
The Substitution Effect
o moves people toward the good that is now cheaper or away from the good that is now more expensive.
The Real Balances Effect
o occurs when a price increases it decreases your buying power causing you to buy less.
The Law of Diminishing Marginal Utility
o is the amount of additional happiness that you get from an additional unit of consumption falls with each additional unit.
ALL ABOUT SUPPLY
The Law of Supply is the statement that there is a positive relationship between price and quantity supplied.
Page 13
© 2018 by McGraw-Hill Education. This is proprietary material solely for authorized instructor use. Not authorized for sale or distribution in any manner. This document may not be copied, scanned, duplicated, forwarded, distributed, or posted on a website, in whole or part.
Teaching Tips
1) Let students discuss their favorite brand of a product and have them specify what they do when that particular brand experiences a price increase.
2) Use an example of food or drink where the first unit of consumption increases happiness a great deal but the fourth, fifth or tenth, increases happiness a trivial amount. Good examples include pizza by the slice, donuts, or onion rings.
3) You may, or may not want to acknowledge that this concept requires a notion of cardinal utility that economists do not favor. If you do, you can also encourage them to become majors
Why Does the Law of Supply Make Sense?
Because of Increasing Marginal Costs firms require higher prices to produce more output.
Because many firms produce more than one good, an increase in the price of good A makes it (at the margin) more profitable so resources are diverted from good B to produce more of good A.
DETERMINANTS OF DEMAND
Page 14
© 2018 by McGraw-Hill Education. This is proprietary material solely for authorized instructor use. Not authorized for sale or distribution in any manner. This document may not be copied, scanned, duplicated, forwarded, distributed, or posted on a website, in whole or part.
Teaching Tips
1) You may choose to use the “believe me, it works this way” approach to avoid the whole explanation of Marginal Cost and Marginal Revenue that follows. You can simply say we’ll prove it in Chapters 5 and 6.
2) If you go forward with the explanation do not try to teach all of Chapters 5 and 6 right here. Just get to the punch line that marginal cost is increasing. Relatively quick example: Farmer has three fields (great, okay, rocky) that require differing levels of water and fertilizer (none, some, a lot). At high prices, all three fields will be used, at modest prices, only the best two, and at low prices, only the “great” one will be planted.
Taste
Income
o Normal Goods
o Inferior Goods
Price of Other Goods
o Complement
o Substitute
Population of Potential Buyers
Expected Price
Excise Taxes
Subsides
Table 2.4
Movements in the demand curve: increases in the values of the determinants.
An Increase inCauses Demand to
Causes the Demand Curve to Move to the
Page 15
© 2018 by McGraw-Hill Education. This is proprietary material solely for authorized instructor use. Not authorized for sale or distribution in any manner. This document may not be copied, scanned, duplicated, forwarded, distributed, or posted on a website, in whole or part.
Teaching Tip
Go through each one of the determinants using your best, culturally-appropriate examples. I have had classes of mostly international students where the typical “peanut butter and jelly” example for complements just did not work. Ramen works well in a classroom of traditional students as an example of an “inferior” good. When dealing with taxes and subsidies, your examples must focus on those that go to the consumer (as those that go to the supplier will be discussed later).
Taste Increase Right
Income, Normal Good Increase Right
Income, Inferior Good Decrease Left
Price of Other Goods, Complement Decrease Left
Price of Other Goods, Substitute Increase Right
Population Increase Right
Expected Future Price Increase Right
Excise Tax Decrease Left
Subsidy Increase Right
Page 16
© 2018 by McGraw-Hill Education. This is proprietary material solely for authorized instructor use. Not authorized for sale or distribution in any manner. This document may not be copied, scanned, duplicated, forwarded, distributed, or posted on a website, in whole or part.
Table 2.5
Movements in the demand curve: decreases in the values of the determinants.
A Decrease inCauses Demand to
Causes the Demand Curve to Move to the
Taste Decrease Left
Income, Normal Good Decrease Left
Income, Inferior Good Increase Right
Price of Other Goods, Complement Increase Right
Price of Other Goods, Substitute Decrease Left
Population Decrease Left
Expected Future Price Decrease Left
Excise Tax Increase Right
Subsidy Decrease Increase
The Effect of an Increase in Demand
Page 17
© 2018 by McGraw-Hill Education. This is proprietary material solely for authorized instructor use. Not authorized for sale or distribution in any manner. This document may not be copied, scanned, duplicated, forwarded, distributed, or posted on a website, in whole or part.
Teaching Tips
1) Emphasize that an increase in demand is a movement to the RIGHT and a decrease is a movement to the LEFT. While “Demand moves UP” is consistent with an increase in demand the same will not be true for supply. If you use the UP and DOWN labels, confusion will reign. Stick with RIGHT and LEFT.
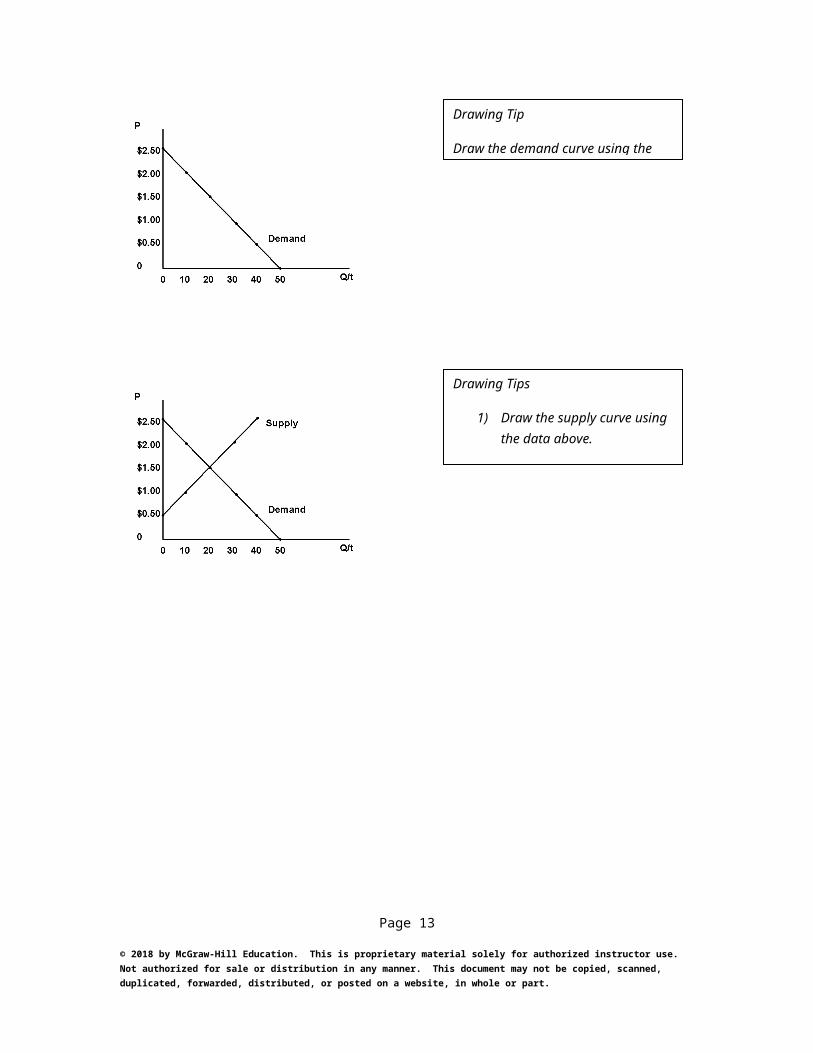
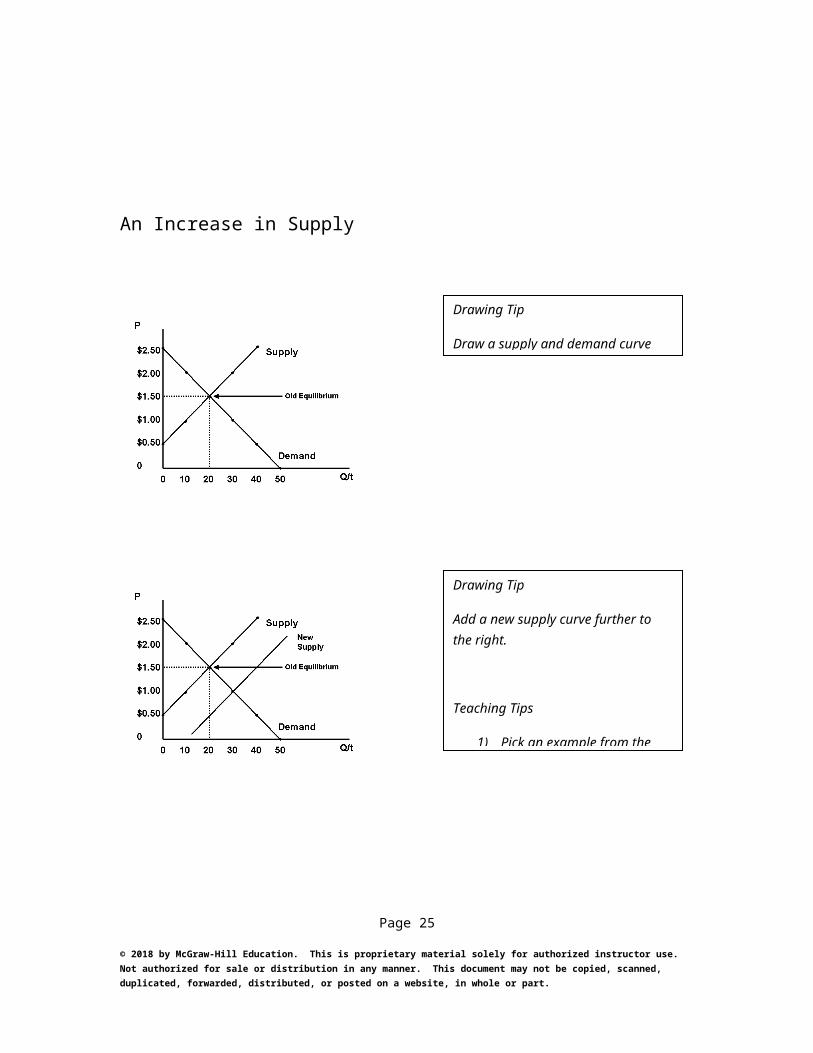
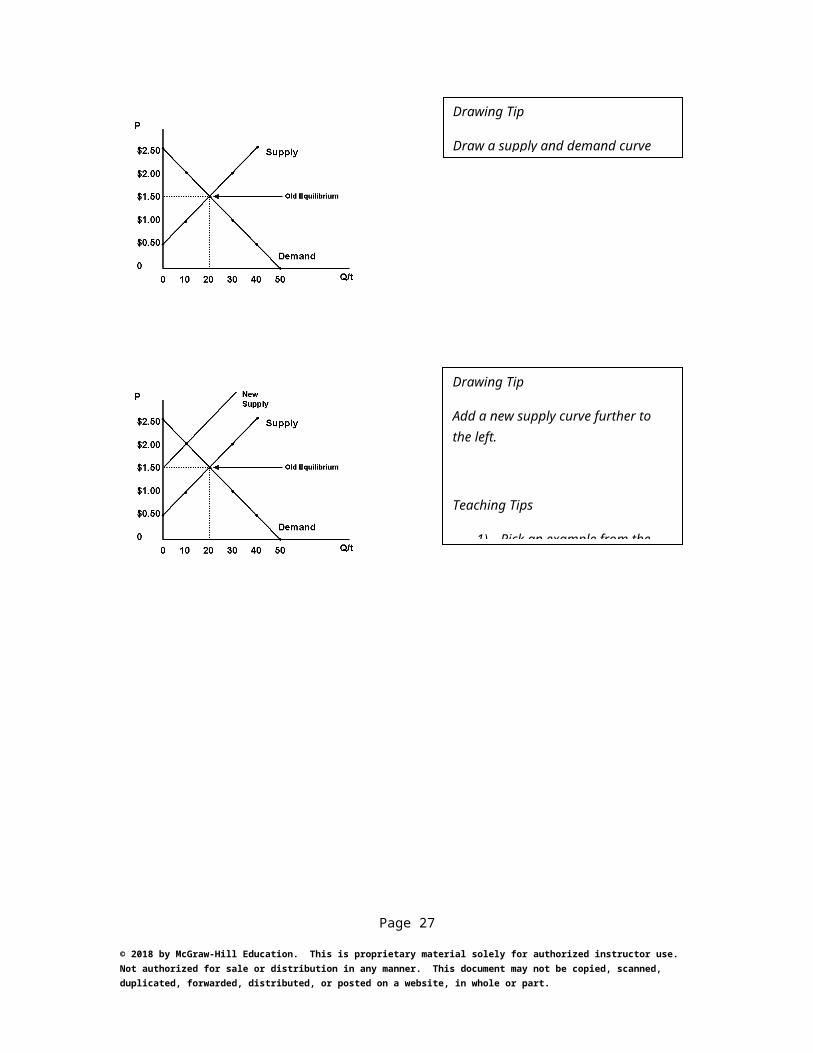
Drawing Tip
Draw a supply and demand curve using the same data as before.
Page 18
© 2018 by McGraw-Hill Education. This is proprietary material solely for authorized instructor use. Not authorized for sale or distribution in any manner. This document may not be copied, scanned, duplicated, forwarded, distributed, or posted on a website, in whole or part.
Drawing Tip
Add a new demand curve further to the right.
Teaching Tips
1) Pick an example from the table.2) Pick a variable and ask
Drawing Tip
Show the new equilibrium.
The Effect of a Decrease in Demand
Page 19
© 2018 by McGraw-Hill Education. This is proprietary material solely for authorized instructor use. Not authorized for sale or distribution in any manner. This document may not be copied, scanned, duplicated, forwarded, distributed, or posted on a website, in whole or part.
Drawing Tip
Draw a supply and demand curve using the same data as before.
Drawing Tip
Add a new demand curve further to the left.
Teaching Tips
1) Pick an example from the table.2) Pick a variable and ask students
Page 20
© 2018 by McGraw-Hill Education. This is proprietary material solely for authorized instructor use. Not authorized for sale or distribution in any manner. This document may not be copied, scanned, duplicated, forwarded, distributed, or posted on a website, in whole or part.
Drawing Tip
Show the new equilibrium.
DETERMINANTS OF SUPPLY
Price of Inputs
Technology
Price of Other Potential Output
Number of Sellers
Expected Future Price
Excise Taxes
Subsidies
Table 2.6
Movements in the supply curve: increases in the values of the determinants.
An Increase inCauses Supply to
Causes the Supply Curve to Move to the
Price of Inputs Decrease Left
Technology Increase Right
Price of other Potential Outputs Decrease Left
Number of Sellers Increase Right
Expected Future Price Decrease Left
Excise Tax Decrease Left
Subsidy Increase Right
Table 2.7
Movements in the supply curve: decreases in the values of the determinants.
Page 21
© 2018 by McGraw-Hill Education. This is proprietary material solely for authorized instructor use. Not authorized for sale or distribution in any manner. This document may not be copied, scanned, duplicated, forwarded, distributed, or posted on a website, in whole or part.
A Decrease in Causes Supply toCauses the Supply Curve to Move to the
Price of Inputs Increase Right
Technology Decrease Left
Price of other Potential Outputs Increase Right
Number of Sellers Decrease Left
Expected Future Price Increase Right
Excise Tax Increase Right
Subsidy Decrease Left
Page 22
© 2018 by McGraw-Hill Education. This is proprietary material solely for authorized instructor use. Not authorized for sale or distribution in any manner. This document may not be copied, scanned, duplicated, forwarded, distributed, or posted on a website, in whole or part.
Teaching Tip
Have students notice that, just like demand, an increase in supply is a movement to the right and a decrease is a movement to the left.
An Increase in Supply
Page 23
© 2018 by McGraw-Hill Education. This is proprietary material solely for authorized instructor use. Not authorized for sale or distribution in any manner. This document may not be copied, scanned, duplicated, forwarded, distributed, or posted on a website, in whole or part.
Drawing Tip
Draw a supply and demand curve using the same data as before.
Drawing Tip
Add a new supply curve further to the right.
Teaching Tips
1) Pick an example from the table.2) Pick a variable and ask
A Decrease in Supply
Page 24
© 2018 by McGraw-Hill Education. This is proprietary material solely for authorized instructor use. Not authorized for sale or distribution in any manner. This document may not be copied, scanned, duplicated, forwarded, distributed, or posted on a website, in whole or part.
Drawing Tip
Drawing Tip
Draw a supply and demand curve using the same data as before.
Page 25
© 2018 by McGraw-Hill Education. This is proprietary material solely for authorized instructor use. Not authorized for sale or distribution in any manner. This document may not be copied, scanned, duplicated, forwarded, distributed, or posted on a website, in whole or part.
Drawing Tip
Show the new equilibrium.
Drawing Tip
Add a new supply curve further to the left.
Teaching Tips
1) Pick an example from the table.
KICK IT UP A NOTCH: WHY THE NEW EQUILIBRIUM?
If there is a change in supply or demand then, without a change in the price of the good, there will be a shortage or a surplus.
A Shortage Resulting from an Increase in Demand (If the price does not increase)
Page 26
© 2018 by McGraw-Hill Education. This is proprietary material solely for authorized instructor use. Not authorized for sale or distribution in any manner. This document may not be copied, scanned, duplicated, forwarded, distributed, or posted on a website, in whole or part.
Drawing Tips
1) Draw a supply and demand diagram, labeling the equilibrium price-quantity combination.
2) Increase demand and extend the
Drawing Tips
1) Come down from the point where the price line hits the new demand curve.
2) Note the shortage.
A Surplus Resulting from a Decrease in Demand (If the price does not fall)
Page 27
© 2018 by McGraw-Hill Education. This is proprietary material solely for authorized instructor use. Not authorized for sale or distribution in any manner. This document may not be copied, scanned, duplicated, forwarded, distributed, or posted on a website, in whole or part.
Drawing Tips
1) Draw a supply and demand diagram, labeling the equilibrium price quantity combination.
Drawing Tip
Note the surplus.
Teaching Tip
A Surplus Resulting from an Increase in Supply (If the price does not fall)
Page 28
© 2018 by McGraw-Hill Education. This is proprietary material solely for authorized instructor use. Not authorized for sale or distribution in any manner. This document may not be copied, scanned, duplicated, forwarded, distributed, or posted on a website, in whole or part.
Drawing Tips
1) Draw a supply and demand diagram, labeling the equilibrium price-quantity combination.
2) Increase supply and extend the price over to the new supply
A Shortage Resulting from a Decrease in Supply (If the price does not rise)
Page 29
© 2018 by McGraw-Hill Education. This is proprietary material solely for authorized instructor use. Not authorized for sale or distribution in any manner. This document may not be copied, scanned, duplicated, forwarded, distributed, or posted on a website, in whole or part.
Drawing Tips
1) Come down from the point where the price line hits the new supply curve.
2) Note the surplus.
Drawing Tips
1) Draw a supply and demand diagram, labeling the equilibrium price-quantity combination.
Page 30
© 2018 by McGraw-Hill Education. This is proprietary material solely for authorized instructor use. Not authorized for sale or distribution in any manner. This document may not be copied, scanned, duplicated, forwarded, distributed, or posted on a website, in whole or part.
Drawing Tip
Note the shortage.
Teaching Tip
End of Chapter Questions
Quiz Yourself
1. The supply and demand model examines how prices and quantities are determined
a) in markets.
b) by governments.
c) by churches.
d) by monopolists.
Explanation: The supply and demand model assumes that there is a market where buyers and sellers get together to trade.
2. A change in the price of eggs will impact
a) the demand for eggs.
b) the supply of eggs.
c) the quantity demanded and the quantity supplied of eggs but neither demand nor supply.
d) both the supply and demand for eggs.
Explanation: Demand shows how much consumers want to buy at all prices. Demand is a relationship, whereas quantity demanded is a particular point in that relationship. Quantity supplied is how much firms are willing and able to sell at a particular price during a particular period of time, whereas supply alone shows how much firms want to sell at all prices.
3. When an economics student draws a supply and demand diagram to model an increase
Page 31
© 2018 by McGraw-Hill Education. This is proprietary material solely for authorized instructor use. Not authorized for sale or distribution in any manner. This document may not be copied, scanned, duplicated, forwarded, distributed, or posted on a website, in whole or part.
in the income, she is assuming this change happens
a) semper fidelis.
b) ceteris paribus.
c) ipso facto.
d) defacto.
Explanation: A Latin phrase most commonly used by economists is ceteris paribus, which means “other things equal.” This phrase, when added to a definition or a conclusion, means that though there are many other factors that could affect a phenomenon in real life, this is focusing on the impact of one while holding those other factors constant.
4. If the supply and demand curves cross at a price of $2, at any price above that there will be
a) an equilibrium.
b) a surplus.
c) a shortage.
d) a crisis.
Explanation: At any price above the equilibrium price, where demand and supply intersect, there will be a surplus of the good or service.
5. If the supply and demand curves cross at a quantity of 100, then the price necessary to get firms to sell more than that will have to be _______ equilibrium.
a) above
b) at
c) below
Page 32
© 2018 by McGraw-Hill Education. This is proprietary material solely for authorized instructor use. Not authorized for sale or distribution in any manner. This document may not be copied, scanned, duplicated, forwarded, distributed, or posted on a website, in whole or part.
d) within 10 percent either way of
Explanation: Since the supply curve is upsloping, firms will sell more as the price rises. So in order for firms to sell more than a quantity of 100, the price would have to be above the equilibrium price.
6. An increase in which of the following determinants of demand will have an ambiguous (uncertain) effect on price?
a) Taste
b) Price of a complement
c) Income
d) Price of a substitute
Explanation: A rise in income can either increase demand if the good is a normal good, or decrease demand if the good is an inferior good.
7. Which of the following will impact both supply and demand?
a) A change in price
b) A change in quantity
c) A change in expected future price
d) A change in income
Explanation: Changes in expected future prices influence the choices of both consumers and producers.
8. An increase in the income of consumers will cause the
a) supply of all goods to rise.
b) demand for all goods to rise.
Page 33
© 2018 by McGraw-Hill Education. This is proprietary material solely for authorized instructor use. Not authorized for sale or distribution in any manner. This document may not be copied, scanned, duplicated, forwarded, distributed, or posted on a website, in whole or part.
c) supply of all goods to fall.
d) the demand for some goods to rise and for others to fall.
Explanation: A rise in income can either increase demand if the good is a normal good, or decrease demand if the good is an inferior good.
9. Without an increase in price, an increase in demand will lead to
a) a shortage.
b) a surplus.
c) socialism.
d) equilibrium.
Explanation: If the price cannot increase when demand increases, there will be a shortage of the good.
Page 34
© 2018 by McGraw-Hill Education. This is proprietary material solely for authorized instructor use. Not authorized for sale or distribution in any manner. This document may not be copied, scanned, duplicated, forwarded, distributed, or posted on a website, in whole or part.
10. The underlying reason for the upward-sloping nature of the supply curve is that
a) the production of most goods comes with increasing marginal benefits.
b) the production of most goods comes with increasing marginal costs.
c) the consumption of most goods comes with decreasing marginal utility.
d) the consumption of most goods comes with increasing marginal utility.
Explanation: As more of a good is produced, the added, or marginal cost, increases. The firm needs to have a higher price to produce more. Therefore, the supply curve is upsloping.
11. If Midwestern grain farmers can plant either soybeans or corn on their land with equal profitability and there is an increase in the price of soybeans, which of the following will result?
a) A movement to the right in the demand for corn
b) A movement to the left in the demand for corn
c) A movement to the right in the supply of corn
d) A movement to the left in the supply of corn
Explanation: Producers are on the supply side of the market. If soybeans are more profitable, farmers will switch from corn to soybeans and the supply of corn will shift to the left (decrease).
12. Part of the Patient Protection and Affordable Care Act involved a tax on indoor tanning that tanning salons are required to collect from tanners and send to the federal government. Which of the following would be the predicted result?
a) A movement to the right in the demand for tanning
b) A movement to the left in the demand for tanning
c) A movement to the right in the supply of tanning
Page 35
© 2018 by McGraw-Hill Education. This is proprietary material solely for authorized instructor use. Not authorized for sale or distribution in any manner. This document may not be copied, scanned, duplicated, forwarded, distributed, or posted on a website, in whole or part.
d) A movement to the left in the supply of tanning
Explanation: Since the tax is collected from tanners, it would affect the demand side of the market. Tanning is now more costly, so demand shifts to the left (decreases).
13. As the baby boom generation (born between 1946 and 1964) ages, which of the following is a likely outcome?
a) A movement to the right in the demand for nursing home beds
b) A movement to the left in the supply for nursing home beds
c) A movement to the right in the supply of nursing home beds
d) A movement to the left in the demand of nursing home beds
Explanation: As the baby boom generation (born between 1946 and 1964) ages, these older people will need more nursing care, hence more nursing home beds. Demand increases, or shifts to the right.
Page 36
© 2018 by McGraw-Hill Education. This is proprietary material solely for authorized instructor use. Not authorized for sale or distribution in any manner. This document may not be copied, scanned, duplicated, forwarded, distributed, or posted on a website, in whole or part.
Short Answer Questions
1. Use your own demand for pizza to illustrate the notion of diminishing marginal utility. Explain why that concept means your demand for pizza-by-the-slice is downward sloping.
2. Suppose you have been given money by your friends and sent to get beverages for a party. Use your demand for those beverages to illustrate why the concept of the “real balance effect” will mean your demand is downward sloping.
3. If there is an alteration to the price of a complement to a good, why is that a change in demand when an alteration in the price of the good itself is a change in the quantity demanded?
4. If there is an alteration in the price of an input used to produce a good, why is that a change in supply when an alteration in the price of the good itself is a change in the quantity supplied?
Think about This
Using simple supply and demand analysis, think about the system of allocating human kidneys. The law that forbids the same of human organs, but allows their voluntary donation, means that there is a bigger shortage of kidneys than there otherwise would be. Does this fact alter your view of the law forbidding the sale of human organs? How about blood?
Talk about This
Are markets always right? List some markets that you think get the production or price of a good wrong. What do these goods have in common?
Page 37
© 2018 by McGraw-Hill Education. This is proprietary material solely for authorized instructor use. Not authorized for sale or distribution in any manner. This document may not be copied, scanned, duplicated, forwarded, distributed, or posted on a website, in whole or part.
Page 38
© 2018 by McGraw-Hill Education. This is proprietary material solely for authorized instructor use. Not authorized for sale or distribution in any manner. This document may not be copied, scanned, duplicated, forwarded, distributed, or posted on a website, in whole or part.
Page 39
© 2018 by McGraw-Hill Education. This is proprietary material solely for authorized instructor use. Not authorized for sale or distribution in any manner. This document may not be copied, scanned, duplicated, forwarded, distributed, or posted on a website, in whole or part.
Page 40
© 2018 by McGraw-Hill Education. This is proprietary material solely for authorized instructor use. Not authorized for sale or distribution in any manner. This document may not be copied, scanned, duplicated, forwarded, distributed, or posted on a website, in whole or part.
Page 41
© 2018 by McGraw-Hill Education. This is proprietary material solely for authorized instructor use. Not authorized for sale or distribution in any manner. This document may not be copied, scanned, duplicated, forwarded, distributed, or posted on a website, in whole or part.
Page 42
© 2018 by McGraw-Hill Education. This is proprietary material solely for authorized instructor use. Not authorized for sale or distribution in any manner. This document may not be copied, scanned, duplicated, forwarded, distributed, or posted on a website, in whole or part.
Page 43
© 2018 by McGraw-Hill Education. This is proprietary material solely for authorized instructor use. Not authorized for sale or distribution in any manner. This document may not be copied, scanned, duplicated, forwarded, distributed, or posted on a website, in whole or part.
Page 44
© 2018 by McGraw-Hill Education. This is proprietary material solely for authorized instructor use. Not authorized for sale or distribution in any manner. This document may not be copied, scanned, duplicated, forwarded, distributed, or posted on a website, in whole or part.
Page 45
© 2018 by McGraw-Hill Education. This is proprietary material solely for authorized instructor use. Not authorized for sale or distribution in any manner. This document may not be copied, scanned, duplicated, forwarded, distributed, or posted on a website, in whole or part.