• That a quality presentation of research findings can have an inordinate effect on a reader’s or a listener’s perceptions of a study’s quality.
• The contents, types, lengths, and technical specifications of research reports.
• That the writer of a research report should be guided by questions of purpose, readership, circumstances/ limitations, and use.
20-3
Learning ObjectivesLearning Objectives
Understand . . .
• That while some statistical data may be incorporated into the text, most statistics should be placed in tables, charts, or graphs.
20-4
Stories Share ResearchStories Share Research
“Accurate information, sound logic, and thefacts are necessary, of course, but trulyeffective leaders in any field—includingtechnical ones—know how to tell “the story”of their particular research endeavor.
Robert McKee author
Story: Substance, Structure, Style and the Principles of Screenwriting
20-5
PulsePoint: Research PulsePoint: Research RevelationRevelation
2.3 The number of gallons of fuel, in billions, that people burn while sitting in traffic.
20-6
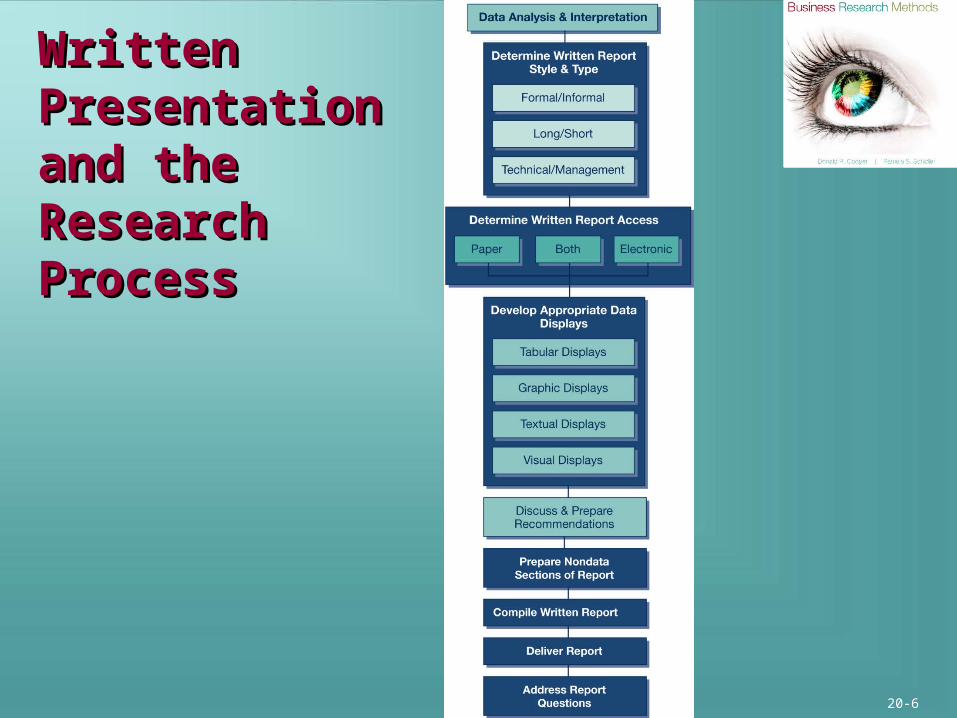
Written Written Presentation Presentation and the and the Research Research ProcessProcess
20-7
Relevance. Not Quantity.Relevance. Not Quantity.
“Focus on relevance. It’s never about the volume of analyzed data or the complexity of an algorithm but about the actionability of derived insight.”
Michael Fassnacht, founderLoyalty Matrix
20-8
The Written Research ReportThe Written Research Report
20-9
Guidelines for Short ReportsGuidelines for Short Reports
Tell reader why you are writingTell reader why you are writing
Remind reader of requestRemind reader of request
Write in an expository styleWrite in an expository style
Write report and hold for reviewWrite report and hold for review
Attach detailed materials in appendixAttach detailed materials in appendix
20-10
Components: Short Report Components: Short Report Memo or Letter-StyleMemo or Letter-Style
Introduction Problem statement Research objectives Background
Conclusions Summary and conclusions Recommendations
20-11
• Prefatory Information (all)
• Introduction (all, plus brief methodology and limitations)
• Findings
• Conclusions
• Appendices
Components: Short Report Components: Short Report TechnicalTechnical
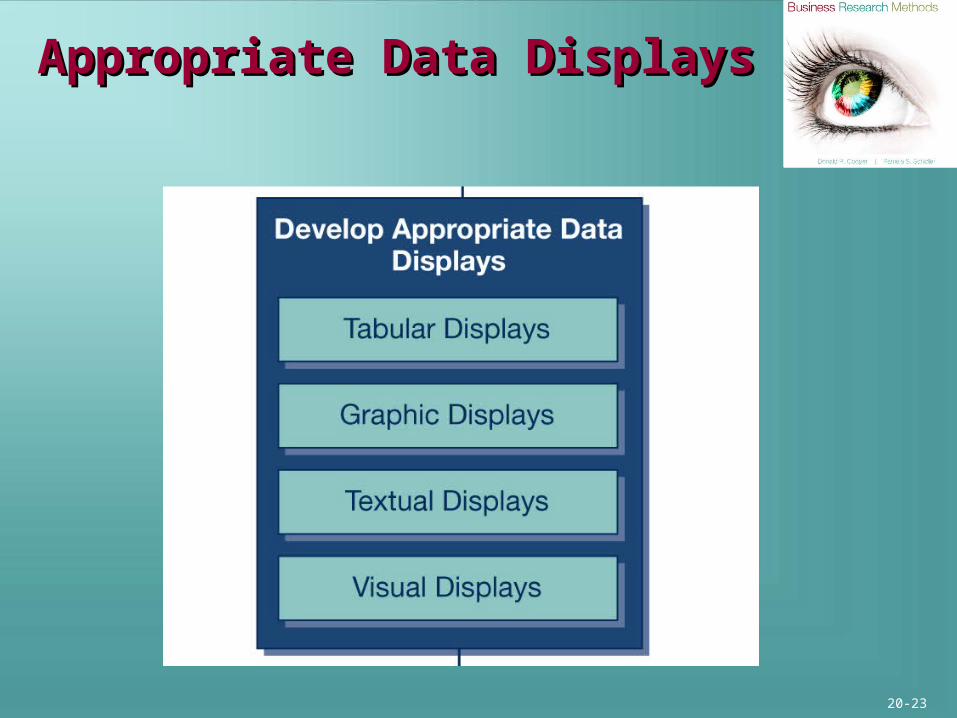
Appropriate Data DisplaysAppropriate Data Displays
20-31
Text PresentationText Presentation
Wal-mart regained its number-1 rank in the Forbes 500 due to its strong sales performance (11% increase; $351.1 billion). Although Wal-mart surpassed number-2-ranked ExxonMobil in sales, Wal-mart’s profitability ($11.2 billion) was far below the oil giant ($39.5 billion).
Some credit several challenging public relations problems with the lower-than-expected level. Number-6-ranked General Electric also outperformed Walmart in profits with $20.8 billion. GE’s robust sales growth (27.4%) is an indication that it will likely challenge both Walmart and ExxonMobil in the future.
20-32
Alternative Text PresentationAlternative Text Presentation
• Oil giant and energy exploration leader ExxonMobil is the most profitable company in the Fortune 500 due to record crude oil prices increasing its profits to $39.5 billion, compared to $11.2 billion for Wal-mart.
• ExxonMobil’s profits jumped 9% on a 2% increase in sales, while Wal-mart’s profits increased a mere 0.5% on an 11% increase in sales.
• General Electric provided a 27.4% increase in profits on a 7.1% increase in sales, and outperformed Wal-mart on profits ($20.8 billion to $11.2 billion).
• Although Wal-Mart regained the top spot in the Fortune 500, its performance shows signs of weakness in profitability.
20-33
Parts of a TableParts of a Table
Body
20-34
Tabular PresentationTabular Presentation
Company Rank
Revenue
($, millions)
Sales Growth Profits
Profit Growth
Wal-Mart 1 $351,139.0 11.2% $11,284.0 0.5%
Exxon Mobil
2 $347,254.0 02.2% $39,500.0 9.3%
General Electric
6 $168,307.0 07.1% $20,829.0 27.4%
Wal-mart regained its number one rank in 2007 by increasing its sales 11 percent over its prior year’s sales. But it still trails in profitability.
20-35
Sample Graphics within ReportSample Graphics within Report
20-36
Sample Line GraphSample Line Graph
201020092008
20-37
Sample Area ChartSample Area Chart
20-38
Sample Pie ChartsSample Pie Charts
20-39
Sample Bar ChartSample Bar Chart
20-40
PictographPictograph
20-41
GeographsGeographs
20-42
3-D Graphs3-D Graphs
20-43
Preparing & Delivering Preparing & Delivering the Written Reportthe Written Report
20-44
Preparing & Delivering Preparing & Delivering the Written Reportthe Written Report
Prefatory InformationPrefatory Information
IntroductionIntroduction
MethodologyMethodology
20-45
Preparing & Delivering Preparing & Delivering the Written Reportthe Written Report
20-46
Preparing & Delivering Preparing & Delivering the Written Reportthe Written Report
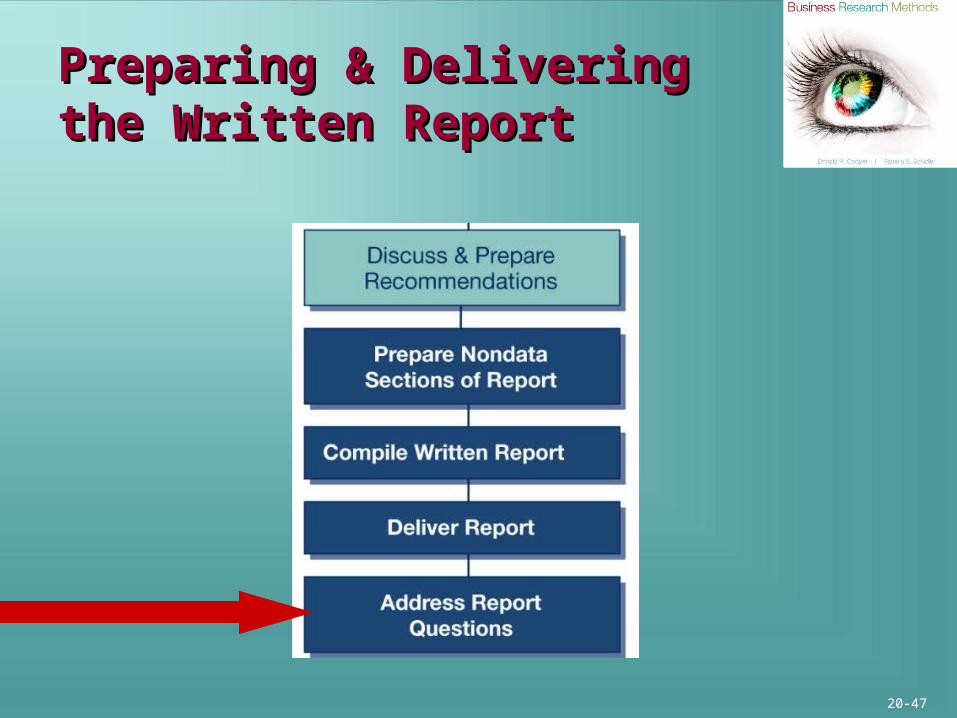
20-47
Preparing & Delivering Preparing & Delivering the Written Reportthe Written Report
20-48
Key TermsKey Terms
• Area chart• Bar chart• Executive summary• Geographic chart• Letter of transmittal• Line graph• Management report• Pace