Chapter 2.1 A comparison of eight nutrition- related tests to predict mortality in hemodialysis patients Camiel L.M. de Roij van Zuijdewijn; Piet M. ter Wee; Isabelle Chapdelaine; Michiel L. Bots; Peter J. Blankestijn; Marinus A. van den Dorpel; Menso J. Nubé; Muriel P.C. Grooteman Journal of Renal Nutrition 25:412-419, 2015
Transcript
Chapter 2.1
A comparison of eight nutrition-related tests to predict mortality in hemodialysis patients
Camiel L.M. de Roij van Zuijdewijn; Piet M. ter Wee; Isabelle Chapdelaine; Michiel L. Bots; Peter J. Blankestijn; Marinus A. van den Dorpel; Menso J. Nubé; Muriel P.C. Grooteman
Journal of Renal Nutrition 25:412-419, 2015
22
Chapter 2.1
aBSTraCT
Introduction
Protein-energy wasting (PEW) describes a state of decreased protein and energy fuels and is highly prevalent in hemodialysis patients. As PEW is associated with mortality, it should be detected accurately and easily. This study investigated which nutrition-related test predicts mortality and morbidity best in hemodialysis patients.
methods
Data were used from CONTRAST, a cohort of end-stage kidney disease patients. Subjective Global Assessment (SGA), Malnutrition Inflammation Score (MIS), Geri-atric Nutritional Risk Index (GNRI), composite score of Protein-Energy Nutritional Status (cPENS), serum albumin, serum creatinine, body mass index (BMI) and nor-malized Protein Nitrogen Appearance (nPNA) rate were assessed at baseline. End points were all-cause mortality, cardiovascular events and infection. Discriminative value of every test was assessed with Harrell’s C statistic and calibration tested using the Hosmer-Lemeshow Goodness-of-Fit Test. Ultimately, in every test, four groups were created to compare (1) hazard ratios (HR, worst versus best group), (2) HR increase per group and (3) HR of worst group versus other groups.
results
In total, 489 patients were analyzed. Median follow-up was 2.97 (interquartile range 1.67-4.47) years. MIS, GNRI, albumin and creatinine discriminated all-cause mortality equally, SGA, cPENS, BMI and nPNA were inferior. cPENS and creatinine were inadequately calibrated. Of the remaining tests, GNRI predicted mortality less when comparing HRs. MIS and albumin predicted mortality equally well. In a subanalysis, these also predicted infection equally well, but MIS predicted cardio-vascular events better.
Conclusion
Of the eight investigated nutrition-related tests, MIS and albumin predict mortality best in hemodialysis patients. As one has no an added value over the other, we conclude that mortality is most easily predicted in hemodialysis patients by serum albumin.
23
2.1
Comparing Nutrition-Related Tests
INTroduCTIoN
Despite continuous improvement in the treatment of hemodialysis (HD) patients, morbidity and mortality remain unacceptably high.1,2 Protein-energy wasting (PEW) is highly prevalent3-7 among HD patients and strongly associated with all-cause mortality8,9 as well as cardiovascular mortality3,10 and morbidity.4 The term PEW was introduced by the International Society of Renal Nutrition and Metabolism (ISRNM) in 2008 to describe the state of decreased body stores of protein and energy fuels. The following diagnostic criteria were proposed: (1) low value of 1 of 3 blood chemistry parameters (albumin, prealbumin or cholesterol), (2) low or decreasing body mass, (3) low or decreasing muscle mass and (4) low dietary intake.11 As patients may benefit from treatment of malnourishment12 by supplementation of proteins and energy,13,14 it appears important to detect PEW accurately and easily.
Several nutrition-related tests have been proposed to assess nutritional status. The three-point scaled Subjective Global Assessment (SGA-3)15 scores patients as A (well nourished), B (moderately malnourished) or C (severely malnourished). Although this test was validated in HD patients,16,17 its semi-quantitative character and the fact that it does not adequately detect the degree of malnutrition16 led to modifications like the seven-point scaled SGA (SGA-7)18,19 and the Malnutri-tion Inflammation Score (MIS).20-22 Other clinical nutritional scores or parameters that have been related to mortality in HD patients include the Geriatric Nutritional Risk Index (GNRI),23-26 the composite score of Protein-Energy Nutritional Status (cPENS),27,28 serum albumin,17,29-31 normalized Protein Nitrogen Appearance (nPNA) rate32,33 and Body Mass Index (BMI).34 It is currently unknown which test should be used to assess PEW most adequately.19,35 Therefore, we investigated which nutrition-related test or parameter predicts all-cause mortality best in patients with end-stage kidney disease (ESKD). In a subanalysis, we also investigated which test predicts cardiovascular events and infections best.
meTHodS
A prospective cohort study was performed using data from the CONvective TRAns-port STudy (CONTRAST, NCT00205556). Methods are described elsewhere.36,37 In brief, CONTRAST was a randomized controlled trial evaluating the survival effect of post-dilution online hemodiafiltration compared to low-flux HD. In total, 714 ESKD patients were enrolled in 29 facilities in three countries: the Netherlands (n=26), Canada (n=2) and Norway (n=1). Adult patients (≥18) were eligible if treated for
24
Chapter 2.1
>2 months with HD two or three times per week. Exclusion criteria were severe incompliance to dialysis prescription, treatment with HDF or high-flux HD in the six months preceding randomization, or a life expectancy ≤3 months due to non-renal disease. Written informed consent was obtained from all participants prior to randomization. The study was conducted in accordance with the Declaration of Helsinki and Good Clinical Practice Guidelines and approved by a central medical ethics review board.
Patients from the CONTRAST cohort were selected for this analysis if all nutrition-related tests could be assessed. For this, data at baseline had to be complete on the following items: SGA-7, answers to questions on stomach problems (‘do you experience nausea or other gastro-intestinal problems?’) and functional capac-ity (‘can you do simple tasks in and around the house?’), gender, BMI, dry body weight, medical history, dialysis vintage, albumin, creatinine, nPNA and total iron binding capacity (TIBC).
assessment of nutrition-related tests
SGA-7 In this score, first described as a nutritional tool in 1987 in non-renal hospital-ized patients pre-operatively,15 four items were scored 1 (severely abnormal) to 7 (normal): (1) change in dry body weight, (2) dietary intake change and gastro-intestinal symptoms, (3) decrease of subcutaneous fat and (4) muscle atrophy. Patients were subjectively scored 1 (severely malnourished) to 7 (well nourished).
MISThe MIS, a modified version of the SGA, was developed for maintenance HD pa-tients and contains 10 items: (1) change in weight after dialysis, (2) dietary intake, (3) gastro-intestinal symptoms, (4) functional capacity, (5) co-morbidity/dialysis vintage, (6) decreased fat stores or loss of subcutaneous fat, (7) signs of muscle wasting, (8) BMI, (9) serum albumin and (10) serum TIBC. Each item was scored 0 (normal) to 3 (severely abnormal), resulting in a score between 0 (well nourished) and 30 (severely malnourished). The SGA-7 items mentioned above (MIS items 1, 2, 6 and 7) were converted to a score of 0-3. GI symptoms (MIS item 3) and functional capacity (MIS item 4) were assessed on a five-point scaled question-naire and were also converted to a score between 0 and 3. MIS items 5, 8, 9 and 10 (dialysis vintage/co-morbidity, BMI, serum albumin and serum TIBC) were all assessed and converted to a score of 0-3 as described previously.20 Conversions of the subjective scores were independently performed by two investigators (CdRvZ
25
2.1
Comparing Nutrition-Related Tests
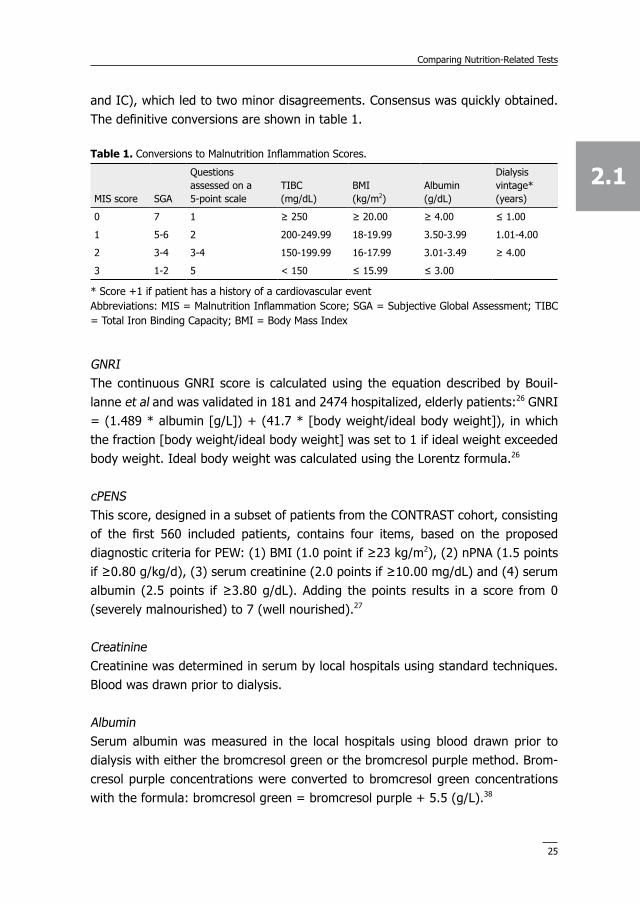
and IC), which led to two minor disagreements. Consensus was quickly obtained. The definitive conversions are shown in table 1.
GNRI The continuous GNRI score is calculated using the equation described by Bouil-lanne et al and was validated in 181 and 2474 hospitalized, elderly patients:26 GNRI = (1.489 * albumin [g/L]) + (41.7 * [body weight/ideal body weight]), in which the fraction [body weight/ideal body weight] was set to 1 if ideal weight exceeded body weight. Ideal body weight was calculated using the Lorentz formula.26
cPENS This score, designed in a subset of patients from the CONTRAST cohort, consisting of the first 560 included patients, contains four items, based on the proposed diagnostic criteria for PEW: (1) BMI (1.0 point if ≥23 kg/m2), (2) nPNA (1.5 points if ≥0.80 g/kg/d), (3) serum creatinine (2.0 points if ≥10.00 mg/dL) and (4) serum albumin (2.5 points if ≥3.80 g/dL). Adding the points results in a score from 0 (severely malnourished) to 7 (well nourished).27
Creatinine Creatinine was determined in serum by local hospitals using standard techniques. Blood was drawn prior to dialysis.
Albumin Serum albumin was measured in the local hospitals using blood drawn prior to dialysis with either the bromcresol green or the bromcresol purple method. Brom-cresol purple concentrations were converted to bromcresol green concentrations with the formula: bromcresol green = bromcresol purple + 5.5 (g/L).38
Table 1. Conversions to Malnutrition Inflammation Scores.
MIS score SGA
Questions assessed on a 5-point scale
TIBC (mg/dL)
BMI (kg/m2)
Albumin (g/dL)
Dialysis vintage* (years)
0 7 1 ≥ 250 ≥ 20.00 ≥ 4.00 ≤ 1.00
1 5-6 2 200-249.99 18-19.99 3.50-3.99 1.01-4.00
2 3-4 3-4 150-199.99 16-17.99 3.01-3.49 ≥ 4.00
3 1-2 5 < 150 ≤ 15.99 ≤ 3.00
* Score +1 if patient has a history of a cardiovascular eventAbbreviations: MIS = Malnutrition Inflammation Score; SGA = Subjective Global Assessment; TIBC = Total Iron Binding Capacity; BMI = Body Mass Index
26
Chapter 2.1
BMI BMI (kg/m2) was calculated using dry body weight.
nPNASamples for determining urea were drawn before and after dialysis. nPNA (g/kg/d) was calculated and adjusted for residual kidney urea clearance as described by Depner.39
The various components of the different nutrition-related tests and their final scores are summarized in supplementary table 1.
follow-up
Survival time was calculated as the number of days between randomization and death due to any cause or end of the study. No patients were lost to follow-up as patients who, for example, received renal transplantation, switched to peritoneal dialysis or moved to a non-participating center were still followed for mortality. An independent Endpoint Adjudication Committee reviewed source documentation for all deaths, cardiovascular events and infections.
Statistical analysis
Patients in whom all tests were available, were eligible for analysis. All-cause mortality was used as primary end point. As right-censored time-to-event data is analyzed, Harrell’s C statistic was calculated for every test to assess discrimination.40 95% Confidence intervals (CIs) of Harrell’s C statistic were compared to determine the best test. When the upper bound of the 95% CI of a C statistic is beneath the lower bound of the 95% CI of another C statistic, the first is considered to have inferior discriminative value. The Hosmer-Lemeshow Goodness-of-Fit Test (HL-test) was used to test calibration.41 It examines if the model fits the data by determining whether the expected event rate matches the observed event rate. A p≤0.1 was considered as a significant difference between these rates, indicating an inadequate fit. For the logistic model (the HL-test) and for Harrell’s C statistic, continuous values could be used, i.e. the different ranges of the tests posed no problem.
In survival data, hazard ratios (HR) are relevant. In order to compare the various HRs, all scores were categorized into four groups of increasing severity. The fol-lowing example is a nice illustration of the necessity of this approach: a decrease of one point in SGA-7 (an ordinal seven-point scaled score) may influence survival more than a decrease of one point in BMI (a continuous score with normal values between 20-25). Due to the limited range of some tests, the four groups differed
27
2.1
Comparing Nutrition-Related Tests
somewhat in size. The numbers of patients at risk in each group are shown in figures 1-3.
Table 2. Baseline patient characteristics.
DeterminantEntire cohort (n=714)
Investigated patients (n=489)
Demographic characteristics Age (years) Gender (male) BMI (kg/m2) Region Netherlands Canada Norway
64.1 (13.7)445 (62.3%)25.4 (4.8)
597 (83.6%)102 (14.2%)15 (2.1%)
63.3 (13.8)296 (60.5%)25.4 (4.9)
420 (85.9%)65 (13.3%)4 (0.8%)
Medical history Diabetes (yes) History of renal transplantation (yes) History of cardiovascular event (yes) Mean predialysis systolic blood pressure (mmHg) Residual kidney function* (yes)
Characteristics are shown as mean (sd), median (IQR) or number (%), when appropriate* Defined as diuresis ≥ 100 mL/24h# Bromcresol green valuesAbbreviations: SD = standard deviation; IQR = interquartile range; BMI = Body Mass Index; ACE = angiotensin converting enzyme; AT = angiotensin
28
Chapter 2.1
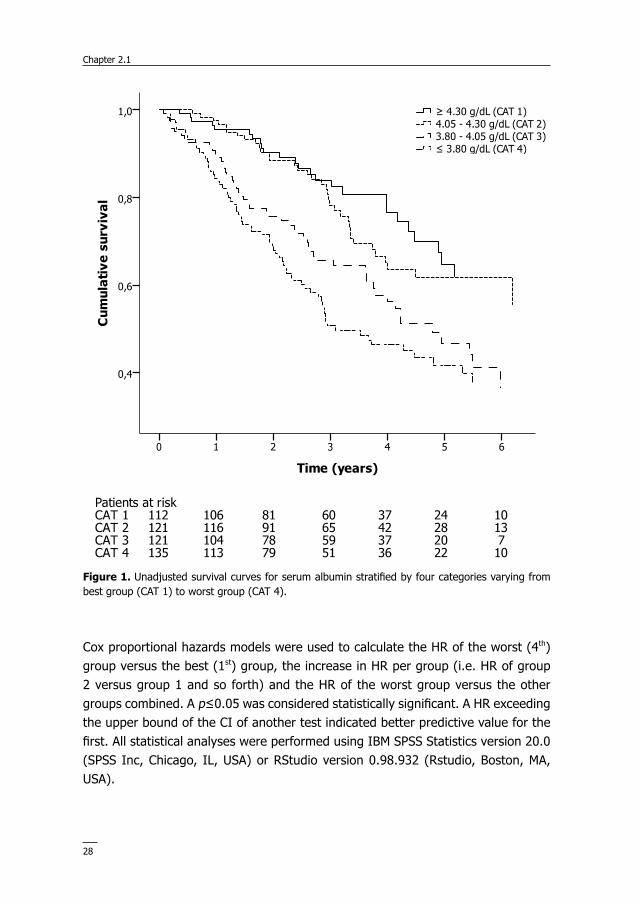
Cox proportional hazards models were used to calculate the HR of the worst (4th) group versus the best (1st) group, the increase in HR per group (i.e. HR of group 2 versus group 1 and so forth) and the HR of the worst group versus the other groups combined. A p≤0.05 was considered statistically significant. A HR exceeding the upper bound of the CI of another test indicated better predictive value for the first. All statistical analyses were performed using IBM SPSS Statistics version 20.0 (SPSS Inc, Chicago, IL, USA) or RStudio version 0.98.932 (Rstudio, Boston, MA, USA).
figure 1. Unadjusted survival curves for serum albumin stratified by four categories varying from best group (CAT 1) to worst group (CAT 4).
29
2.1
Comparing Nutrition-Related Tests
Subanalysis
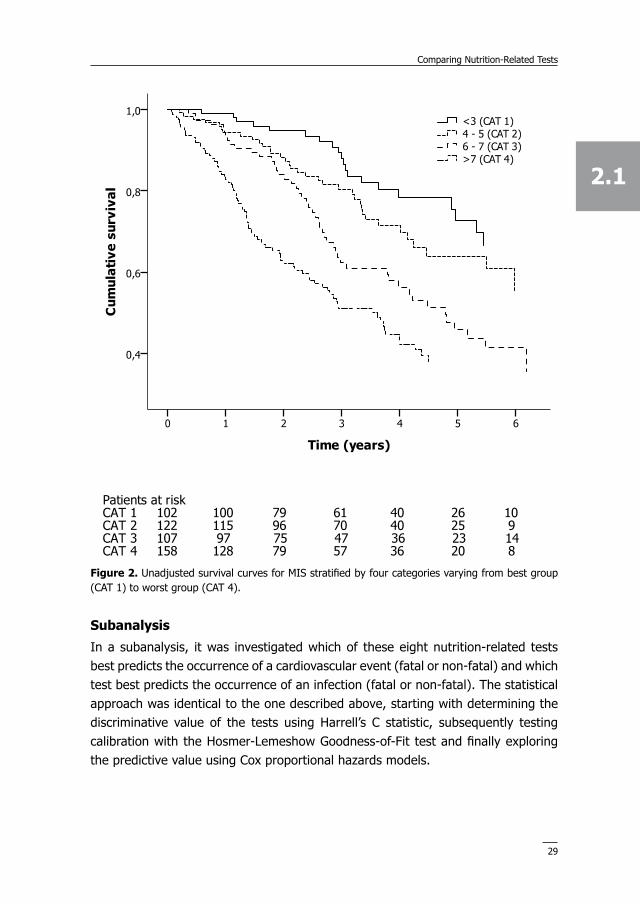
In a subanalysis, it was investigated which of these eight nutrition-related tests best predicts the occurrence of a cardiovascular event (fatal or non-fatal) and which test best predicts the occurrence of an infection (fatal or non-fatal). The statistical approach was identical to the one described above, starting with determining the discriminative value of the tests using Harrell’s C statistic, subsequently testing calibration with the Hosmer-Lemeshow Goodness-of-Fit test and finally exploring the predictive value using Cox proportional hazards models.
figure 2. Unadjusted survival curves for MIS stratified by four categories varying from best group (CAT 1) to worst group (CAT 4).
30
Chapter 2.1
reSuLTS
Baseline characteristics of the entire cohort (n=714) and 489 analyzed patients are shown in table 2. Investigated patients did not differ from the whole cohort. Most unanalyzed patients had missing values of nPNA (n=120) or a MIS item (n=125). Mean age was 63.3 years and 60.5% of patients were male. Patients were adequately dialyzed with a mean spKt/V of 1.39.
all-cause mortality discrimination and calibration
In all tests but one (MIS), higher scores indicate higher probability of survival. Harrell’s C statistics and the HL-test p-values of the eight tests are shown in table 3. While seven tests yielded a significant discriminative value (p<0.001) regarding mortality, BMI did not. Of the seven discriminative tests, C statistics varied between
figure 3. Unadjusted survival curves for GNRI stratified by four categories varying from best group (CAT 1) to worst group (CAT 4).
31
2.1
Comparing Nutrition-Related Tests
0.56 and 0.68. As the lower bound of the 95% CI of the C statistic of MIS (0.66) exceeded the upper bound of the CI of the C statistics of SGA (0.63), cPENS (0.66) and nPNA (0.58), these tests have an inferior discriminative value for all-cause mortality when compared to MIS. The remaining four tests demonstrated equal discriminative power. With respect to creatinine however, the HL-test showed a significant difference between observed and expected event rates, which indicates that this test has an inadequate fit and is hence inferior to the remaining three tests (MIS, GNRI and albumin).
Comparing groups - mortality
Kaplan-Meier curves for mortality of the four groups of albumin, MIS and GNRI are shown in figures 1-3. Median follow-up was 2.97 years (interquartile range 1.67-4.47 years). 183 Patients died during follow-up. First, the HR per group was evaluated. As can be seen in table 4, a change between two subsequent groups resulted in a HR of 1.56 for MIS. In GNRI and albumin, HRs per group were 1.35 and 1.44, respectively. As the HR of MIS (1.56) exceeded the upper limit of the CI of the HR of GNRI (1.55), MIS appears a better predictor of mortality than GNRI. HRs of MIS and albumin did not differ.
Second, the HR of the worst (4th) group versus the best (1st) group was calculated. This was 3.75 for MIS, 2.76 for albumin and 2.35 for GNRI. Again, the HR of MIS exceeded the upper limit of CI of GNRI, which indicates a better predictive value regarding mortality for MIS compared to GNRI. No difference was observed between MIS and albumin.
Table 3. Results of Harrell’s C statistic and Hosmer-Lemeshow Goodness-of-Fit Test (end point mortality).
Nutritional test Harrell’s C statistic (95% CI) p Harrell’s C statistic p Hosmer-Lemeshow Goodness- of-Fit Test
SGA 0.61 (0.59-0.63) <0.001 0.42
MIS 0.68 (0.66-0.70) <0.001 0.65
GNRI 0.64 (0.62-0.66) <0.001 0.73
cPENS 0.63 (0.61-0.66) <0.001 0.002
Albumin 0.64 (0.62-0.66) <0.001 0.95
Creatinine 0.65 (0.63-0.67) <0.001 0.007
BMI 0.50 (0.48-0.53) 0.90 0.07
nPNA 0.56 (0.54-0.58) 0.01 0.41
Abbreviations: CI = Confidence Interval; SGA = Subjective Global Assessment; MIS = Malnutrition Inflammation Score; GNRI = Geriatric Nutritional Risk Index; cPENS = composite score of Protein-Energy Nutritional Status; BMI = Body Mass Index; nPNA = normalized Protein Nitrogen Appearance
32
Chapter 2.1
Finally, the difference in HR of the worst (4th) group versus the other groups com-bined was investigated. HRs were 2.25, 1.90 and 1.77 for MIS, albumin and GNRI, respectively. No difference between any tests was found.
Subanalysis
None of the six tests which had an inferior predictive value regarding mortality predicted either cardiovascular events or infections better compared to MIS or albumin (data not shown).
Results of the sub-analyses for MIS and albumin are shown in supplementary tables 2 and 3. MIS and albumin predicted infection equally well (median follow-up 2.14 (interquartile range 1.19-3.24 years; number of events = 169). The Cox regression models showed no difference between these tests either as the HRs of MIS and albumin are within the HR CIs of each other in every comparison.
MIS appeared to be the only test able to have discriminative value for fatal and non-fatal cardiovascular events (median follow-up 2.37 (interquartile range 1.19-3.98) years, no. of events = 154, p Harrell’s C statistic = 0.03). Calibration appeared adequate. Moreover, in the Cox regression models, the HRs of the MIS showed a predictive value for this test. Albumin had no predictive value regarding this end point.
dISCuSSIoN
The present study compared eight different nutrition-related tests in a large ESKD cohort to investigate which assessment best predicts all-cause mortality. Out of these tests, six should not be used (SGA, BMI, nPNA, cPENS, serum creatinine and GNRI) due to inadequate discrimination, calibration or a lower predictive value for mortality compared to serum albumin and MIS, which predicted mortality equally well. In a subanalysis, these two tests also appeared to predict infection equally
Table 4. Results of Cox proportional hazard models (end point mortality).
Test Status 4th group
Increase HR per group (95% CI)
HR 4th group versus 1st group (95% CI)
HR 4th group versus other groups combined (95% CI)
MIS Highest 1.56 (1.35-1.79) 3.75 (2.30-6.12) 2.25 (1.68-3.02)
Albumin Lowest 1.44 (1.25-1.65) 2.76 (1.75-4.36) 1.90 (1.41-2.56)
Abbreviations: HR = Hazard Ratio; CI = Confidence Interval; MIS = Malnutrition Inflammation Score; GNRI = Geriatric Nutritional Risk Index
33
2.1
Comparing Nutrition-Related Tests
well, but MIS predicted cardiovascular events better. To the best of our knowledge, this is the first study evaluating these eight well described nutrition-related tests in a large ESKD cohort with multiple end points.
A limited number of studies compared the predictive value for mortality of multiple nutrition-related tests in ESKD patients. In a small American study (n=83), serum albumin, serum creatinine, SGA-3 and the MIS were compared over a 12 month period. Based on a relative risk (RR) for death of 10.43 for every 10-unit increase in MIS compared to a RR of 3.90 for death for every one-unit increase in SGA-3, it was concluded that MIS may have some added value over SGA-3. However, the low number of deaths (n=9) led to very wide CIs and hence, inconclusive results. In this study, albumin also appeared to be an important predictor of mortality (RR 7.21 for every 1 g/dL decrease [95% CI 2.47-20.99]), whereas creatinine did not.20 More recently, 378 American HD patients were investigated over 12 months of follow-up. MIS, albumin, creatinine and nPNA were used as nutrition-related tests and subdivided into four groups of increasing severity. From this study it ap-peared that MIS and albumin predicted mortality equally well, whereas creatinine and nPNA did not. Again, the small number of events (n=39) resulted in wide CIs and hence low reliability.21 Lately, a European study with a follow-up of three years, encompassing 90 HD patients, investigated SGA-3, MIS, BMI and albumin. From this study it appeared that albumin, SGA-3 and MIS predicted mortality when categorized, whereas BMI did not. However, the small number of events (n=36) in combination with the categorization of tests makes it hard to interpret the results adequately.42 Finally, a small (n=75), longitudinal study compared GNRI to MIS. As GNRI did not predict mortality while MIS did, the latter score system was pre-ferred.23 Of note, in a previous study on 560 patients from the CONTRAST cohort, neither cPENS nor SGA-7 predicted mortality better than its individual components creatinine and albumin. This study was performed while CONTRAST was ongoing with 105 deaths and a mean follow-up of 1.4 years.27
Literature comparing nutrition-related tests with regard to morbidity is scarce. The few available studies include the two American studies described above comparing SGA, MIS, albumin and creatinine for mortality and hospitalisation rate.20,21 MIS and albumin predicted hospitalisation equally in one study, but MIS predicted hos-pitalisation better in the other. Another study investigated the predictive value of albumin, nPNA and BMI in 37 South-African patients for hospitalisation and found no predictive value for nPNA and some predictive value for BMI and albumin.4 Studies comparing nutrition-related tests with cardiovascular events or infections as end points were not found.
34
Chapter 2.1
Thus, in agreement with existing literature, we found that SGA, GNRI, MIS and albumin predict mortality.21,23 In our study, MIS was preferred over both SGA and GNRI, the first being inferior due to a lower discriminative value for mortality and the latter having inferior predictive value for mortality when comparing HRs. As discrimination was not tested in previous studies,20 this may explain why SGA was considered a predictor in these investigations. Our analysis showed a predictive value for cPENS as previously described,27 but we found an inadequate fit, which was not tested before. MIS and albumin predicted mortality equally.
The present analysis adds evidence to the question which nutritional test best pre-dicts all-cause mortality and is the first to investigate these eight tests in parallel. The primary interest of the present paper is to compare the investigated nutrition-related tests. Obviously, all-cause mortality can only partially be explained by PEW and is influenced by a large number of other factors as well, such as age, sex and dialysis vintage. However, as in all investigated subjects every investigated nutrition-related test was available, patient characteristics are equal between the tests, ensuring an adequate comparison. Other strengths of our study are the magnitude of the cohort (n=489), the large number of deaths (n=183) and the long period of follow-up for mortality (median 2.97 years, interquartile range 1.67-4.47 years). Moreover, this study is the first to approach this question with tests for discrimination, calibration and Cox regression, to compare nutrition-related tests in various ways and hence, as adequately as possible. Finally, the use of cardiovascular events and infections as end points in a sub-analysis has, to the best of our knowledge, never been per-formed before. The number of events and duration of follow-up (154 cardiovascular events, median follow-up 2.37 years; 169 infections, median follow-up 2.14 years) was sufficient to compare the tests using these end points adequately as well.
Our study has some limitations. First, MIS was not prospectively collected and was calculated by converting parts of the baseline case report form. We met with this objection by converting all subjective items twice, by two independent investiga-tors. Second, in every test, four groups were created. Given the limited range of some of these tests, it was not possible to create four exactly equal sized groups in every test. Although the groups were sized as equal as possible, this small imbal-ance may have influenced the results. Third, no anthropometric measurements were available besides weight and BMI. As such measurements can also indicate nutritional status, our analysis would have been even stronger if, for example, hand grip strength was included. Finally, the external validity of the present findings depends on the representativeness of the investigated cohort on the HD population worldwide. In this respect, it should be noted that the prevalence of diabetes
35
2.1
Comparing Nutrition-Related Tests
mellitus in our cohort is comparable to other European countries and Japan, but is lower than that in the United States.43 Furthermore, the post-transplantation prevalence differs between countries as well. To extrapolate the results of the present analysis to other populations, the results should be confirmed in various cohorts across the globe.
A major issue in determining PEW is the lack of a gold standard.44 Although many nutrition-related parameters and tools have been investigated, it is still not clear which test should be used. Many studies examined tests by investigating how well these predict either morbidity and/or mortality. Since the relevance of PEW mainly seems the risk of a bad outcome and various markers of PEW showed an indepen-dent association with mortality,8 all-cause mortality was primarily used as end point and the end points cardiovascular events and infection occurrence as secondary end points. We realize that neither all-cause mortality, nor cardiovascular events nor infection occurrence perfectly reflects PEW and therefore, this study also does not provide the definitive answer on how to detect PEW best.
A nutritional test should be quick, easy, cheap, have a good intra- and interobserver reproducibility, an adequate fit and sufficient discrimination. As MIS and albumin predicted mortality equally well, mortality seems to be most easily predicted by albumin. Subanalysis revealed a better predictive value for cardiovascular events for MIS compared to albumin, but this can possibly be explained by the fact that MIS includes the medical history of a cardiovascular event and dialysis vintage. Furthermore, the single parameter serum albumin is far more easy compared to the composite 10-item score MIS, which includes albumin. The added value of MIS over albumin, solely based on a better predictive value for the secondary end point cardiovascular events, seems therefore premature and requires additional research. However, as many factors may contribute to hypoalbuminemia10,31,45 and PEW encompasses a broad spectrum of abnormalities,12,43,44 measurement of multiple parameters may help to assess the nutritional state.
Our findings should be confirmed in other studies. Future research could investi-gate tests longitudinally to examine whether the absolute score or the course of the score is more relevant. Furthermore, it could be interesting to investigate the value of tests regarding other end points, such as quality of life or cause-specific death. Finally, it is interesting to investigate whether intervention improves results of the mentioned tests, therefore decreasing the degree of PEW and possibly im-proving clinical outcome. Combined with the present analysis, these studies could demonstrate which nutrition-related test should be used in clinical practice.
36
Chapter 2.1
SuPPLemeNTary TaBLeS
Supplementary table 1. Components of the various nutrition-related tests.
Test Items Score
SGA-7 •Change in post-dialysis weight (past 3-6 months)•Dietary intake/gastro-intestinal symptoms•Decrease of subcutaneous fat•Signs of muscle atrophy
0-7 (higher is better)
MIS •Change in post-dialysis weight (past 3-6 months)•Dietary intake•Gastro-intestinal symptoms•Decreased fat stores/loss of subcutaneous fat•Signs of muscle wasting•Functional capacity•Co-morbidity/dialysis vintage•Serum albumin•BMI•Serum TIBC
0-30(lower is better)
GNRI •Serum albumin•Body weight•Ideal body weight
Continuous(higher is better)
cPENS •Serum albumin•Serum creatinine•BMI•nPNA
0-7(higher is better)
Albumin •Individual serum marker (pre-dialysis) Continuous(higher is better)
Creatinine •Individual serum marker (pre-dialysis) Continuous (higher is better)
BMI •Post-dialysis body weight•Height
Continuous (higher is better)
nPNA •Two times BUN (pre- & post-dialysis) Continuous (higher is better)
Abbreviations: SGA-7 = 7-point scaled Subjective Global Assessment; MIS = Malnutrition Inflam-mation Score; GNRI = Geriatric Nutritional Risk Index; cPENS = composite score on Protein-Energy Nutritional Status; BMI = Body Mass Index; nPNA = normalized Protein Nitrogen Appearance; TIBC = Total Iron Binding Capacity; BUN = Blood Urea Nitrogen
37
2.1
Comparing Nutrition-Related Tests
Supplementary table 2. Results of Harrell’s C statistics and Hosmer-Lemeshow Goodness-of-Fit Test (end points cardiovascular events and occurrence of infection).
End point; nutrition-related test Harrell’s C statistic (95% CI) p Harrell’s C statistic
p Hosmer-Lemeshow Goodness- of-Fit Test
End point: CVE MIS Albumin
56.0 (51.0-61.3)51.6 (46.1-57.0)
0.030.58
0.170.66
End point: infection MIS Albumin
60.1 (54.9-65.2)55.7 (50.3-61.2)
<0.0010.04
0.500.18
Abbreviations: CI = Confidence Interval; CVE = cardiovascular event; MIS = Malnutrition Inflamma-tion Score
Supplementary table 3. Results of Cox proportional hazards models (end points cardiovascular events and occurrence of infection).
TestStatus 4th group
Increase HR per group (95% CI)
HR 4th group versus 1st group (95% CI)
HR 4th group versus other groups combined (95% CI)
End point: CVE MIS Albumin
HighestLowest
1.29 (1.11-1.48)1.14 (0.81-1.62)
2.47 (1.48-4.13)1.36 (0.86-2.15)
1.45 (1.04-2.02)1.10 (0.96-1.27)
End point: infection MIS Albumin
HighestLowest
1.43 (1.24-1.65)1.30 (1.13-1.51)
3.12 (1.91-5.10)2.10 (1.37-3.22)
2.10 (1.54-2.87)2.18 (1.58-3.00)
Abbreviations: HR = Hazard Ratio; CI = Confidence Interval; CVE = cardiovascular event; MIS = Malnutrition Inflammation Score
38
Chapter 2.1
refereNCe LIST
1. Yoshino M, Kuhlmann MK, Kotanko P , Greenwood RN, Pisoni RL, Port FK, Jager KJ, Homel P, Augustijn H, de Charro FT, Collart F, Erek E, Finne P, Garcia-Garcia G, Grönhagen-Riska C, Ioannidis GA, Ivis F, Leivestad T, Løkkegaard H, Lopot F, Jin DC, Kramar R, Nakao T, Nandakumar M, Ramirez S, van der Sande FM, Schön S, Simpson K, Walker RG, Zaluska W, Levin NW: International differences in dialysis mortality reflect background general popula-tion atherosclerotic cardiovascular mortality. J Am Soc Nephrol 17:3510-3519, 2006
2. Cheung AK, Sarnak MJ, Yan G, Berkoben M, Heyka R, Kaufman A, Lewis J, Rocco M, Toto R, Windus D, Ornt D, Levey AS, HEMO Study Group: Cardiac diseases in maintenance hemodialysis patients: results of the HEMO Study. Kidney Int 65:2380-2389, 2004
3. de Mutsert R, Grootendorst DC, Axelsson J, Boeschoten EW, Krediet RT, Dekker FW: Excess mortality due to interaction between protein-energy wasting, inflammation and cardiovas-cular disease in chronic dialysis patients. Nephrol Dial Transplant 23:2957-2964, 2008
4. Herselman M, Moosa MR, Kotze TJ, Kritzinger M, Wuister S, Mostert D: Protein-energy malnutrition as a risk factor for increased morbidity in long-term hemodialysis patients. J Ren Nutr 10:7-15, 2000
5. Aparicio M, Cano N, Chauveau P, Azar R, Canaud B, Flory A, Laville M, Leverve X: Nutritional status of haemodialysis patients: a French national cooperative study. French Study Group for Nutrition in Dialysis. Nephrol Dial Transplant 14:1679-1686, 1999
6. Qureshi AR, Alvestrand A, Danielsson A, Divino-Filho JC, Gutierrez A, Lindholm B, Bergström J: Factors predicting malnutrition in hemodialysis patients: a cross-sectional study. Kidney Int 53:773-782, 1998
7. Gracia-Iguacel C, Gonzalez-Parra E, Perez-Gomez MV, Mahillo I, Egido J, Ortiz A, Carrero JJ: Prevalence of protein-energy wasting and its association with mortality in haemodialysis patients in a centre in Spain. Nefrologia 33:495-505, 2013
8. Kovesdy CP, George SM, Anderson JE, Kalantar-Zadeh K: Outcome predictability of biomark-ers of protein-energy wasting and inflammation in moderate and advanced chronic kidney disease. Am J Clin Nutr 90:407-414, 2009
9. Carrero JJ, Stenvinkel P, Cuppari L, Ikizler TA, Kalantar-Zadeh K, Kaysen G, Mitch WE, Price SR, Wanner C, Wang AY, ter Wee PM, Franch HA: Etiology of the protein-energy wasting syndrome in chronic kidney disease: a consensus statement from the International Society of Renal Nutrition and Metabolism (ISRNM). J Ren Nutr 23:77-90, 2013
10. Kalantar-Zadeh K, Ikizler TA, Block G, Avram MM, Kopple JD: Malnutrition-inflammation complex syndrome in dialysis patients: causes and consequences. Am J Kidney Dis 42:864-881, 2003
11. Fouque D, Kalantar-Zadeh K, Kopple J, Cano N, Chauveau P, Cuppari L, Franch H, Guarnieri G, Ikizler TA, Kaysen G, Lindholm B, Massy Z, Mitch W, Pineda E, Stenvinkel P, Treviño-Becerra A, Wanner C: A proposed nomenclature and diagnostic criteria for protein-energy wasting in acute and chronic kidney disease. Kidney Int 73:391-398, 2008
12. Fouque D, Vennegoor M, ter Wee PM, Wanner C, Basci A, Canaud B, Haage P, Konner K, Kooman J, Martin-Malo A, Pedrini L, Pizzarelli F, Tattersall J, Tordoir J, Vanholder R: EBPG guideline on nutrition. Nephrol Dial Transplant 22 Suppl 2:ii45-ii87, 2007
13. Kalantar-Zadeh K, Ikizler TA: Let them eat during dialysis: an overlooked opportunity to improve outcomes in maintenance hemodialysis patients. J Ren Nutr 23:157-163, 2013
39
2.1
Comparing Nutrition-Related Tests
14. Ikizler TA, Cano NJ, Franch H, Fouque D, Himmelfarb J, Kalantar-Zadeh K, Kuhlmann MK, stenvinkel P, ter Wee PM, Teta D, Wang AY, Wanner C, International Society of Renal Nutri-tion and Metabolism: Prevention and treatment of protein energy wasting in chronic kidney disease patients: a consensus statement by the International Society of Renal Nutrition and Metabolism. Kidney Int 84:1096-1107, 2013
15. Detsky AS, McLaughlin JR, Baker JP, Johnston N, Whittaker S, Mendelson RA, Jejeebhoy KN: What is subjective global assessment of nutritional status? JPEN J Parenter Enteral Nutr 11:8-13, 1987
16. Cooper BA, Bartlett LH, Aslani A, Allen BJ, Ibels LS, Pollock CA: Validity of subjective global assessment as a nutritional marker in end-stage renal disease. Am J Kidney Dis 40:126-132, 2002
17. Chan M, Kelly J, Batterham M, Tapsell L: Malnutrition (subjective global assessment) scores and serum albumin levels, but not body mass index values, at initiation of dialysis are independent predictors of mortality: a 10-year clinical cohort study. J Ren Nutr 22:547-557, 2012
18. Adequacy of dialysis and nutrition in continuous peritoneal dialysis: association with clini-cal outcomes. Canada-USA (CANUSA) Peritoneal Dialysis Study Group. J Am Soc Nephrol 7:198-207, 1996
19. Steiber AL, Kalantar-Zadeh K, Secker D, McCarthy M, Sehgal A, McCann L: Subjective Global Assessment in chronic kidney disease: a review. J Ren Nutr 14:191-200, 2004
20. Kalantar-Zadeh K, Kopple JD, Block G, Humphreys MH: A malnutrition-inflammation score is correlated with morbidity and mortality in maintenance hemodialysis patients. Am J Kidney Dis 38:1251-1263, 2001
21. Kalantar-Zadeh K, Kopple JD, Humphreys MH, Block G: Comparing outcome predictability of markers of malnutrition-inflammation complex syndrome in haemodialysis patients. Nephrol Dial Transplant 19:1507-1519, 2004
22. Ho LC, Wang HH, Peng YS, Chiang CK, Huang JW, Hung KY, Hu FC, Wu KD: Clinical utility of malnutrition-inflammation score in maintenance hemodialysis patients: focus on identifying the best cut-off point. Am J Nephrol 28:840-846, 2008
23. Beberashvili I, Azar A, Sinuani I, Kadoshi H, Shapiro G, Feldman L, Averbukh Z, Weissgarten J: Comparison analysis of nutritional scores for serial monitoring of nutritional status in hemodialysis patients. Clin J Am Soc Nephrol 8:443-451, 2013
24. Kobayashi I, Ishimura E, Kato Y, Okuno S, Yamamoto T, Yamakawa T, Mori K, Inaba M, Nishzawa Y: Geriatric Nutritional Risk Index, a simplified nutritional screening index, is a significant predictor of mortality in chronic dialysis patients. Nephrol Dial Transplant 25:3361-3365, 2010
25. Yamada K, Furuya R, Takita T, Maruyama Y, Yamaguchi Y, Ohkawa S, Kumagai H: Simpli-fied nutritional screening tools for patients on maintenance hemodialysis. Am J Clin Nutr 87:106-113, 2008
26. Bouillanne O, Morineau G, Dupont C, Coulombei I, Vincent JP, Nicolis I, Benazeth S, Cynober L, Aussei C : Geriatric Nutritional Risk Index: a new index for evaluating at-risk elderly medical patients. Am J Clin Nutr 82:777-783, 2005
27. Mazairac AH, de Wit GA, Grooteman MP, Penne EL, van der Weerd NC, van den Dorpel MA, Nubé MJ, Lévesque R, ter Wee PM, Bots ML, Blankestijn PJ, CONTRAST investigators: A composite score of protein-energy nutritional status predicts mortality in haemodialysis
40
Chapter 2.1
patients no better than its individual components. Nephrol Dial Transplant 26:1962-1967, 2011
28. Toledo FR, Antunes AA, Vannini FC, Silveira LV, Martin LC, Barretti P, Caramori JC: Validity of malnutrition scores for predicting mortality in chronic hemodialysis patients. Int Urol Nephrol 45:1747-1752, 2013
29. Kalantar-Zadeh K, Kilpatrick RD, Kuwae N, McAllister CJ, Alcorn H Jr, Kopple JD, Greenland S: Revisiting mortality predictability of serum albumin in the dialysis population: time dependency, longitudinal changes and population-attributable fraction. Nephrol Dial Trans-plant 20:1880-1888, 2005
30. Pupim LB, Caglar K, Hakim RM, Shyr Y, Ikizler TA: Uremic malnutrition is a predictor of death independent of inflammatory status. Kidney Int 66:2054-2060, 2004
31. Gama-Axelsson T, Heimburger O, Stenvinkel P, Barany P, Lindholm B, Qureshi AR: Serum albumin as predictor of nutritional status in patients with ESRD. Clin J Am Soc Nephrol 7:1446-1453, 2012
32. Ravel VA, Molnar MZ, Streja E, Kim JC, Victoroff A, Jing J, Benner D, Norris KC, Kovesdy CP, Kopple JD, Kalantar-Zadeh K: Low protein nitrogen appearance as a surrogate of low dietary protein intake is associated with higher all-cause mortality in maintenance hemodi-alysis patients. J Nutr 143:1084-1092, 2013
33. Kalantar-Zadeh K, Supasyndh O, Lehn RS, McAllister CJ, Kopple JD: Normalized protein ni-trogen appearance is correlated with hospitalization and mortality in hemodialysis patients with Kt/V greater than 1.20. J Ren Nutr 13:15-25, 2003
34. Kalantar-Zadeh K, Streja E, Molnar MZ, Lukowsky LR, Krishnan M, Kovesdy CP, Greenland S: Mortality prediction by surrogates of body composition: an examination of the obesity paradox in hemodialysis patients using composite ranking score analysis. Am J Epidemiol 175:793-803, 2012
35. Riella MC: Nutritional Evaluation of Patients Receiving Dialysis for the Management of Protein-Energy Wasting: What is Old and What is New? J Ren Nutr 23:195-198, 2013
36. Penne EL, Blankestijn PJ, Bots ML, van den Dorpel MA, Grooteman MP, Nubé MJ, van der Tweel I, ter Wee PM, the CONTRAST study group: Effect of increased convective clearance by on-line hemodiafiltration on all cause and cardiovascular mortality in chronic hemodialy-sis patients - the Dutch CONvective TRAnsport STudy (CONTRAST): rationale and design of a randomised controlled trial [ISRCTN38365125]. Curr Control Trials Cardiovasc Med 6:8, 2005
37. Grooteman MP, van den Dorpel MA, Bots ML, Penne EL, van der Weerd NC, Mazairac AH, den Hoedt CH, van der Tweel I, Lévesque R, Nubé MJ, ter Wee PM, Blankestijn PJ, CONTRAST investigators: Effect of online hemodiafiltration on all-cause mortality and cardiovascular outcomes. J Am Soc Nephrol 23:1087-1096, 2012
38. Clase CM, St Pierre MW, Churchill DN: Conversion between bromcresol green- and bromcre-sol purple-measured albumin in renal disease. Nephrol Dial Transplant 16:1925-1929, 2001
39. Depner TA, Daugirdas JT: Equations for normalized protein catabolic rate based on two-point modeling of hemodialysis urea kinetics. J Am Soc Nephrol 7:780-785, 1996
40. Pencina MJ, D’Agostino RB Sr., Song L: Quantifying discrimination of Framingham risk func-tions with different survival C statistics. Stat Med 31:1543-1553, 2012
41. Hosmer DW, Hosmer T, Le CS, Lemeshow S: A comparison of goodness-of-fit tests for the logistic regression model. Stat Med 16:965-980, 1997
41
2.1
Comparing Nutrition-Related Tests
42. Fiedler R, Jehle PM, Osten B, Dorligschaw O, Girndt M: Clinical nutrition scores are superior for the prognosis of haemodialysis patients compared to lab markers and bioelectrical impedance. Nephrol Dial Transplant 24:3812-3817, 2009
43. Lopes AA, Bragg-Gresham JL, Elder SJ, Ginsberg N, Goodkin DA, Pifer T, Lameire N, Marshall MR, Asano Y, Akizawa T, Pisoni RL, Young EW, Port FK: Independent and joint associations of nutritional status indicators with mortality risk among chronic hemodialysis patients in the Dialysis Outcomes and Practice Patterns Study (DOPPS). J Ren Nutr 20:224-234, 2010
44. Kovesdy CP, Kalantar-Zadeh K: Accuracy and limitations of the diagnosis of malnutrition in dialysis patients. Semin Dial 25:423-427, 2012
45. de Mutsert R, Grootendorst DC, Indemans F, Boeschoten EW, Krediet RT, Dekker FW: As-sociation between serum albumin and mortality in dialysis patients is partly explained by inflammation, and not by malnutrition. J Ren Nutr 19:127-135, 2009


![URINARY EXCRETION OF ALBUMIN - nephro-necker.org · urinary excretion of albumin ... tojo and endou [12], ... 105, 1353-1361 2000. renal albumin handling in megalin knock out mice](https://static.documents.pub/doc/80x56/5c4a0c7693f3c317653c31ff/urinary-excretion-of-albumin-nephro-urinary-excretion-of-albumin-tojo.jpg)


