26
Chapter 23 Monetary Policy Theory
Chapter 23
Monetary Policy Theory
© 2013 Pearson Education, Inc. All rights reserved. 23-2
Response of Monetary Policy to Shocks
• Monetary policy should try to minimize the difference between inflation and the inflation target
• In the case of both demand shocks and permanent supply shocks, policy makers can simultaneously pursue price stability and stability in economic activity
• Following a temporary supply shock, however, policy
makers can achieve either price stability or economic activity stability, but not both. This tradeoff poses a dilemma for central banks with dual mandates

© 2013 Pearson Education, Inc. All rights reserved. 23-3
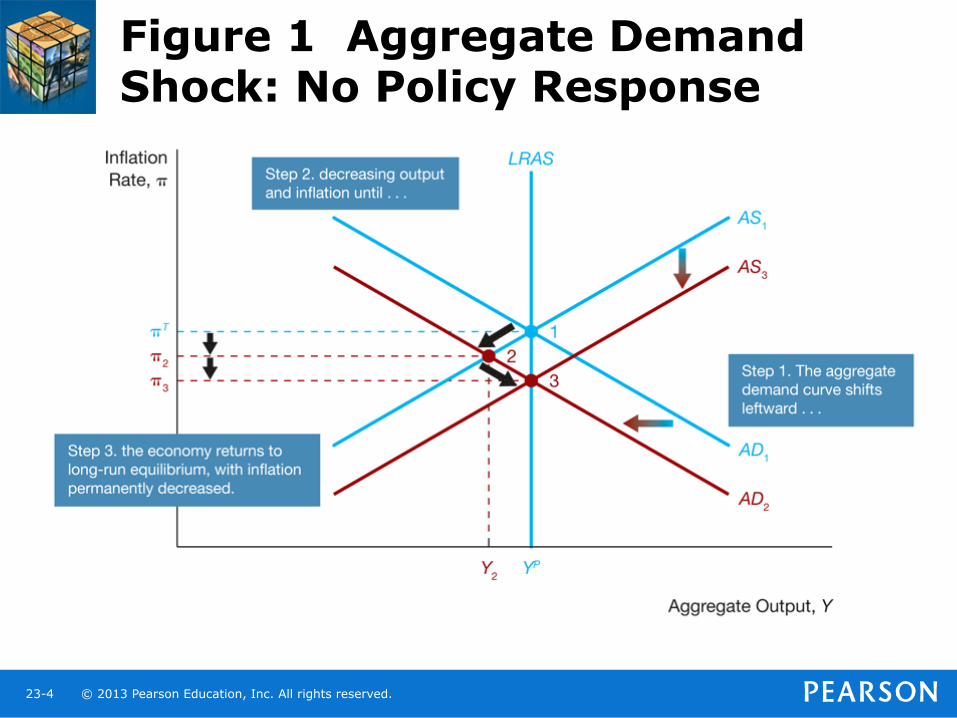
Response to an Aggregate Demand Shock
• Policy makers can respond to this shock in two possible ways: – No policy response – Policy stabilizes economic activity and inflation in
the short run
• In the case of aggregate demand shocks, there is no tradeoff between the pursuit of price stability and economic activity stability
© 2013 Pearson Education, Inc. All rights reserved. 23-4
Figure 1 Aggregate Demand Shock: No Policy Response

© 2013 Pearson Education, Inc. All rights reserved. 23-5
Figure 2 Aggregate Demand Shock: Policy Stabilizes Output and Inflation in the Short Run

© 2013 Pearson Education, Inc. All rights reserved. 23-6
APPLICATION Quantitative (Credit) Easing to Respond to the Global Financial Crisis
• Sometimes the negative aggregate demand shock is so large that at some point the central bank cannot lower the real interest rate further because the nominal interest rate hits a floor of zero, as occurred after the Lehman Brothers bankruptcy in late 2008
• In this situation when the zero-lower-bound problem arises, the central bank must turn to nonconventional monetary policy

© 2013 Pearson Education, Inc. All rights reserved. 23-7
APPLICATION Quantitative (Credit) Easing to Respond to the Global Financial Crisis (cont’d)
• Though the Fed took action, the negative aggregate demand shock to the economy from the global financial crisis was so great that the Fed’s quantitative (credit) easing was insufficient to overcome it, and the Fed was unable to shift the aggregate demand curve all the way back and the economy still suffered a severe recession
© 2013 Pearson Education, Inc. All rights reserved. 23-8
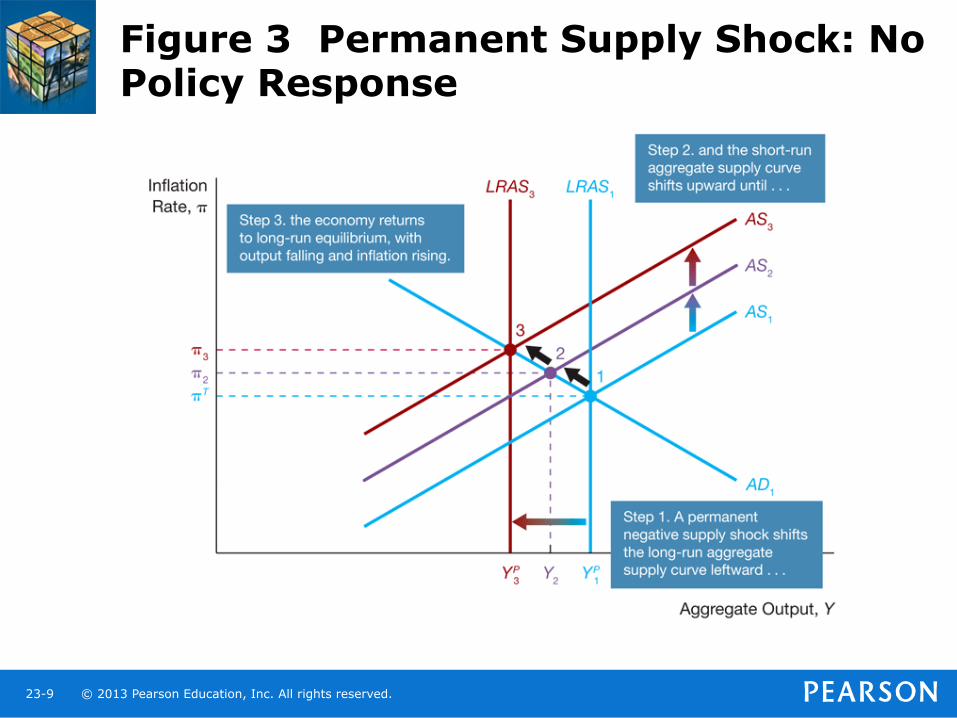
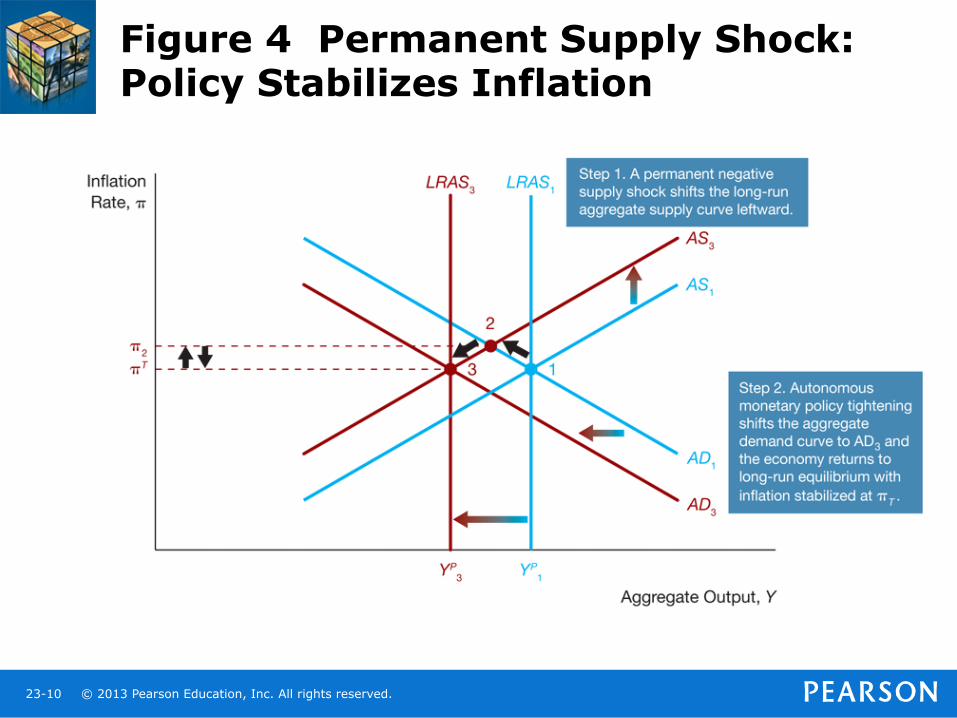
Response to a Permanent Supply Shock
• There are two possible policy responses to a permanent supply shock: -No policy response -Policy stabilizes inflation
© 2013 Pearson Education, Inc. All rights reserved. 23-9
Figure 3 Permanent Supply Shock: No Policy Response
© 2013 Pearson Education, Inc. All rights reserved. 23-10
Figure 4 Permanent Supply Shock: Policy Stabilizes Inflation

© 2013 Pearson Education, Inc. All rights reserved. 23-11
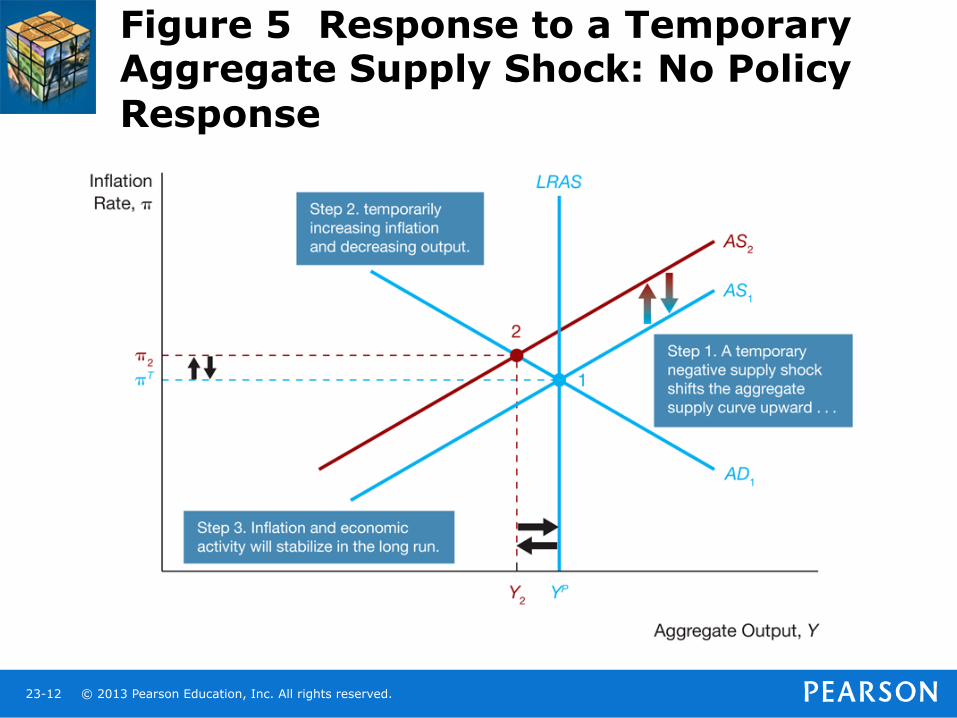
Response to a Temporary Supply Shock
• When a supply shock is temporary, policymakers face a short-run tradeoff between stabilizing inflation and economic activity
• Policymakers can respond to the temporary supply shock in three possible ways: – No policy response – Policy stabilizes inflation in the short run – Policy stabilizes economic activity in the short
run
© 2013 Pearson Education, Inc. All rights reserved. 23-12
Figure 5 Response to a Temporary Aggregate Supply Shock: No Policy Response

© 2013 Pearson Education, Inc. All rights reserved. 23-13
Figure 6 Response to a Temporary Aggregate Supply Shock: Short-Run Inflation Stabilization

© 2013 Pearson Education, Inc. All rights reserved. 23-14
Figure 7 Response to a Temporary Aggregate Supply Shock: Short-Run Output Stabilization
© 2013 Pearson Education, Inc. All rights reserved. 23-15
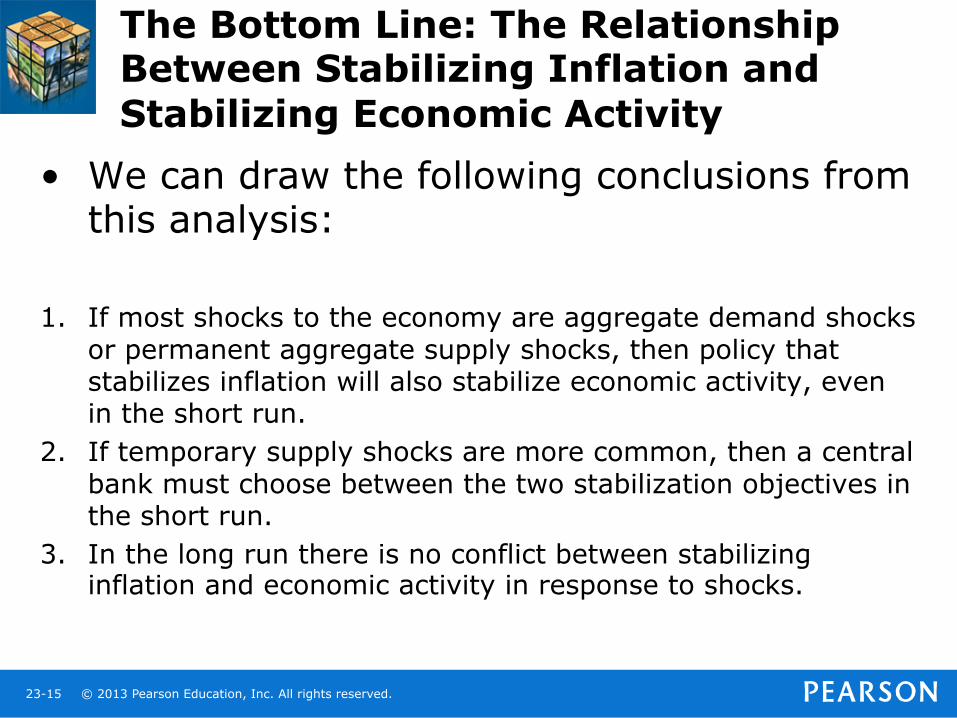
The Bottom Line: The Relationship Between Stabilizing Inflation and Stabilizing Economic Activity
• We can draw the following conclusions from this analysis:
1. If most shocks to the economy are aggregate demand shocks or permanent aggregate supply shocks, then policy that stabilizes inflation will also stabilize economic activity, even in the short run.
2. If temporary supply shocks are more common, then a central bank must choose between the two stabilization objectives in the short run.
3. In the long run there is no conflict between stabilizing inflation and economic activity in response to shocks.
© 2013 Pearson Education, Inc. All rights reserved. 23-16
How Actively Should Policy Makers Try to Stabilize Economic Activity?
• All economists have similar policy goals (to promote high employment and price stability), yet they often disagree on the best approach to achieve those goals
• Nonactivists believe government action is
unnecessary to eliminate unemployment • Activists see the need for the government to
pursue active policy to eliminate high unemployment when it develops
© 2013 Pearson Education, Inc. All rights reserved. 23-17
Lags and Policy Implementation
• Several types of lags prevent policymakers from shifting the aggregate demand curve instantaneously – Data lag: the time it takes for policy makers to
obtain data indicating what is happening in the economy
– Recognition lag: the time it takes for policy makers to be sure of what the data are signaling about the future course of the economy
© 2013 Pearson Education, Inc. All rights reserved. 23-18
Lags and Policy Implementation (cont’d)
– Legislative lag: the time it takes to pass legislation to implement a particular policy
– Implementation lag: the time it takes for policy makers to change policy instruments once they have decided on the new policy
– Effectiveness lag: the time it takes for the policy actually to have an impact on the economy

© 2013 Pearson Education, Inc. All rights reserved. 23-19
FYI The Activist/Nonactivist Debate Over the Obama Fiscal Stimulus Package
• Many activists argued that the government needed to do more by implementing a massive fiscal stimulus package
• On the other hand, nonactivists opposed the fiscal stimulus package, arguing that fiscal stimulus would take too long to work because of long implementation lags
• The Obama administration came down squarely on the side of the activists and proposed the American Recovery and Reinvestment Act of 2009, a $787 billion fiscal stimulus package that Congress passed on February 13, 2009
© 2013 Pearson Education, Inc. All rights reserved. 23-20
Inflation: Always and Everywhere a Monetary Phenomenon
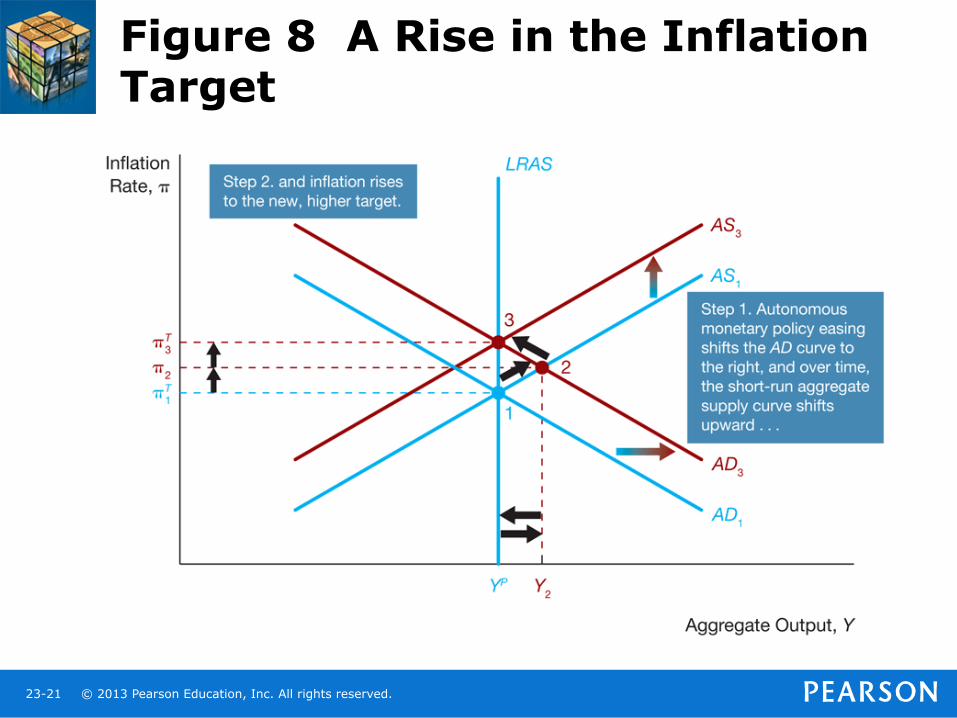
• This adage is supported by our aggregate demand and supply analysis because it shows that monetary policy makers can target any inflation rate in the long run by shifting the aggregate demand curve with autonomous monetary policy
© 2013 Pearson Education, Inc. All rights reserved. 23-21
Figure 8 A Rise in the Inflation Target
© 2013 Pearson Education, Inc. All rights reserved. 23-22
Causes of Inflationary Monetary Policy
• High Employment Targets and Inflation
– Cost-push inflation results either from a temporary negative supply shock or a push by workers for wage hikes beyond what productivity gains can justify
– Demand-pull inflation results from policy makers pursuing policies that increase aggregate demand

© 2013 Pearson Education, Inc. All rights reserved. 23-23
Figure 9 Cost-Push Inflation

© 2013 Pearson Education, Inc. All rights reserved. 23-24
Figure 10 Demand-Pull Inflation
© 2013 Pearson Education, Inc. All rights reserved. 23-25
APPLICATION The Great Inflation
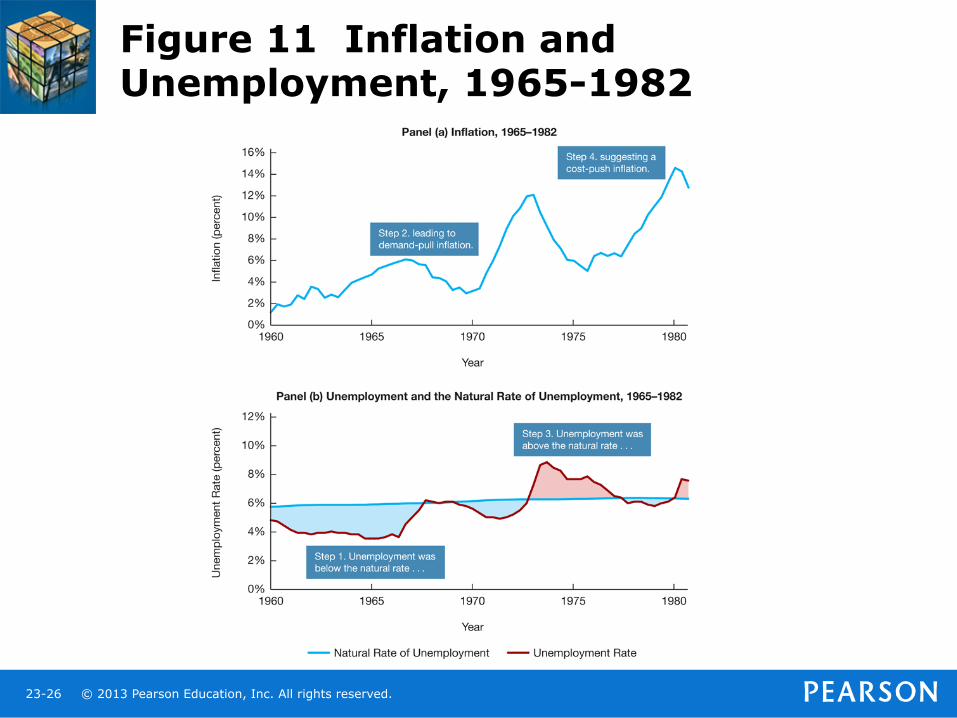
• Now that we have examined the roots of inflationary monetary policy, we can investigate the causes of the rise in U.S. inflation from 1965 to 1982, a period dubbed the “Great Inflation”
• Panel (a) of Figure 11 documents the rise in inflation during those years. Just before the Great Inflation started, the inflation rate was below 2% at an annual rate; by the late 1970s, it averaged around 8% and peaked at nearly 14% in 1980 after the oil price shock in 1979
• Panel (b) of Figure 11 compares the actual unemployment rate to estimates of the natural rate of unemployment
© 2013 Pearson Education, Inc. All rights reserved. 23-26
Figure 11 Inflation and Unemployment, 1965-1982


