Electrochemical and thermo-fluid modeling of atubular solid oxide fuel cell with accompanyingindirect internal fuel reforming
K. Suzuki1, H. Iwai2 & T. Nishino21Department of Machinery and Control Systems,Shibaura Institute of Technology, Japan.2Department of Mechanical Engineering, Kyoto University, Japan.
Abstract
Development of fuel cells has been boosted by global and regional environmentalissues. Among others, the solid oxide fuel cell (SOFC) has been drawing muchattention as a unit for distributed energy generation. Numerical analysis is used as apowerful tool in research and development of fuel cells, especially of the SOFC forwhich important and necessary thermal management information has scarcely beensupplied experimentally. A central issue for achieving maximum benefit from thenumerical analysis is how to properly model the complex phenomena occurring inthe fuel cells. This chapter presents a numerical model for a tubular SOFC includinga case with indirect internal reforming. In this model, the velocity field in the air andfuel passages and heat and mass transfer in and around a tubular cell are calculatedwith a two-dimensional cylindrical coordinate system adopting the axisymmetricassumption. Internal reforming and electro-chemical reactions are both taken intoaccount in the model. Electric potential field and electric current in the cell are alsocalculated simultaneously allowing their nonuniformity in the peripheral direction.A previously developed quasi-two-dimensional model was adopted to combine theassumed axisymmetry of velocity, heat and mass transfer fields and the periph-eral nonuniformity of electric potential field and electric current. Details of thosenumerical procedures are described and examples of the calculated results are dis-cussed. After presenting a few fundamental results, several strategies to reduce themaximum temperature and temperature gradient of the cell are examined for a casewith indirect internal fuel reforming.
One of the most important global issues in the present world is the suppressionof global warming. Global warming is proceeding related to the increase of atmo-spheric concentration of carbon dioxide. Discharge of carbon dioxide into the atmo-sphere occurs in the eruption of volcanoes but the largest emission rate of carbondioxide originates from power plants and from vehicles both of which support themodern world. Since drastic depression of energy demand and usage of automo-biles cannot be accepted easily by people living in the modern society, developmentof energy conversion systems being free from the emission of carbon dioxide or,at least, of a system having a lower emission rate of carbon dioxide is important.Fuel cells are one of the prospective power generation systems for this purpose.There are five types of fuel cells characterized by the difference in materials for theelectrolyte and in this relation by the difference in operation temperature. They arealkaline fuel cells, phosphoric acid fuel cells, polymer electrolyte fuel cells, moltencarbonate fuel cells and solid oxide fuel cells (SOFCs). In this chapter, attention ispaid to the last one, the SOFC.
Solid oxide fuel cells (SOFCs) have an advantage in that not only hydrogen butalso a variety of hydrocarbons can be used as fuels. This is because solid oxides usedfor the electrolyte, are oxygen-ion conducting materials. In the case of fuel cellsusing hydrogen-ion conducting or proton conducting materials as the electrolyte, thefuel should in principle be hydrogen only but, in the case of the SOFC, a variety offuels including carbon monoxide in addition to hydrocarbons can react with oxygen-ions conducted across the electrolyte. High operation temperature provides anotheradvantage of SOFCs. No catalyst is needed for the electrochemical reaction if theyare operated at a reasonably high temperature except in the case of low temperatureSOFCs [1]. In addition to this, high quality thermal energy of the effluent fromthe SOFCs can be recovered in various ways. Construction of a hybrid system thatfuses the SOFC to a gas turbine to obtain high electricity generation efficiency is oneof them [2–4]. In addition, steam reforming of hydrocarbon fuels is possible in oraround the cells with the aid of high operation temperature.Avariety of commercialmaterials can be used as a catalyst for the reforming reaction. Fuel reformingsupplies hydrogen and carbon monoxide from methane as fuel, which makes thefuel cell operation simpler and additionally provides a means to cool and thereforeto control the high temperature fuel cell. When the reforming reaction takes place onthe anode with heat supplied directly from the electrochemical reaction, it is referredto as direct internal reforming (DIR). In this case, the cell structure is simple becauseno additional catalyst except the anode is needed. However, there are still difficultiesin proper control both of reforming and electrochemical reactions within the anodeitself [5–7]. On the other hand, the case in which the reforming reaction takes placeon catalysts that are positioned apart from the anode is referred to as indirect internalreforming (IIR). This is the case treated in this chapter as will be discussed later.
Another advantage of SOFCs is that the electrolyte is solid.This results in geomet-rical flexibility of the cell design. Several types of SOFCs having different geometryhave been proposed, tested and developed so far. They are tubular SOFCs, planar
Figure 1: Schematics of three types of SOFC having different geometry.
SOFCs and disk type SOFCs. Schematics of the three types of SOFC are illus-trated in Fig. 1. Planar SOFCs and disk type SOFCs are prospective in a pointthat they can be stacked in a compact way and that they can have higher electricpower density. Therefore, they are the subject of keen research and developmentactivities [8–11]. On the other hand, tubular SOFCs are one of the most developedtowards practical use. The two major advantages of the tubular cells are that theyhave relatively good thermal shock resistance and that there is no need for specialsealing treatment. Owing to these advantages, a thousands-hour-long operation testof an atmospheric pressure 100-kW tubular SOFC system has successfully beenperformed [12]. In this system, cathode-supported SOFCs are used, in which airflows inside the tubular cell structure and fuel flows around the tubular cell alongits axis. Natural gas is used as fuel and it is fully reformed in “in-stack reformers”,which are placed between the rows of cell bundles composed of many tubular cells.Reformers are heated indirectly by the cells. The cell structure is simpler in thiscase but the stack structure is rather complicated. On the other hand, in the caseof anode-supported SOFCs, fuel flows inside the tubular cell and air flows out-side the tubular cell. In this case, a fuel feed tube mounted inside the tubular cell,through which fuel is injected into the tubular cell, can be used as a reformer. Thefeed tube is filled with the catalyst material and indirect but internal fuel reforming(IIR) proceeds while fuel flows through it. This is the concept of indirect internalreforming type tubular SOFCs (IIR-T-SOFCs) to be discussed in this chapter. In this
case, although the cell structure is a little more complicated due to the catalyst tobe embedded in it, the stack structure becomes fairly simple. There is no in-stackreformer so that the size and geometry of the stack can be designed more easilyand more flexibly for various SOFC electricity generation systems having differentpower output capacity. In addition, there is a chance to control the local thermalfield in the cell by adjusting the distribution density of the fuel reforming catalyst.This is one of the achievements of earlier numerical analyses [13, 14]. At present,development of this type of SOFC is just in a conceptual design stage. So it is mean-ingful to study its feasibility right now and numerical simulation is considered tobe an effective tool for this purpose.
Numerical simulation has become a useful means in research and developmentin various engineering fields. Fuel cells are no exception and various numericalsimulations of fuel cells have been conducted by several research groups. Numer-ical modeling of fuel cells is complicated due to a variety of phenomena occurringin the cells such as multi-component gas flows with heat and mass transfer, elec-trochemical reactions between fuel and air, and electric potential field and ionicand electric current in the cell. Numerical simulation is especially important forSOFCs. They need good thermal management because the operation temperatureis high. However, the detailed information necessary for management is not eas-ily supplied from measurement. Numerical simulation is a sole means to supplysuch information. There are two types of numerical simulations applied to SOFCs.One is for a single cell [15–20] and another for a stacked-cell module [21–24]. Inthis chapter, the former type of numerical simulation is treated and in particulardescription is given to a numerical model developed for a tubular SOFC includinga case of IIR-T-SOFC based on the model for the cathode-supported tubular SOFCreported in [15, 16]. Finally, some results are also presented as examples of thesimulations made with the described model.
2 General remarks on the mechanism of IIR-T-SOFC
Prior to describing the numerical modeling and simulated results, general remarkswill be given to the phenomena in the indirect internal reforming tubular solid oxidefuel cells, the IIR-T-SOFCs, in this section. Except for the part related to internal fuelreforming, description to follow can be applied to a general case without internalfuel reforming including the case of a conventional cathode-supported tubular solidoxide fuel cell.
2.1 Tubular cell
Figure 2 shows schematic views of two types of a tubular SOFC. One is a conven-tional Siemens-Westinghouse type cathode-supported tubular cell [25] and anotheris a single cell to be used in the IIR-T-SOFC stack. The latter type of fuel cellconsists of a tubular cell and a feed tube inserted in it, basically similar to a design of
Figure 2: Schematic view of a conventional tubular SOFC and IIR-T-SOFC.
Figure 3: Schematic view of a cell stack.
conventional tubular SOFCs. The cell tube is composed of two electrodes sand-wiching an electrolyte layer. Electrochemical reactions take place at both theseelectrodes, anode and cathode. The difference between the two cases illustrated inFig. 2 is that the hydrocarbon to be used as fuel flows inside the feed tube and thatthe feed tube is filled with porous catalysts in the case of the IIR-T-SOFC. So fuel isreformed “indirectly” in each tubular cell. That is to say, fuel is reformed inside thefeed tube, changes flow direction at the closed end of the cell tube, reacts electro-chemically on the anode and then flows out of the cell. On the other hand, air flowsoutside the cell tube and reacts on the cathode. One drawback of this cell design isthat the interconnects are exposed to the high-temperature air so that serious oxi-dization of the interconnects may occur. However, this problem is being resolveddue to the development of new interconnect materials such as the doped-lanthanumchromite series in recent years [26, 27].
The tubular cell can be stacked either electrically in series or electrically inparallel as shown in Fig. 3. The number of the tubular cells in the stack is adjusted so
as to fit the required electricity capacity. When the number of the cells is sufficientlylarge, most of the cells in the core region of the stack should be in the same thermaland operating conditions. Therefore, attention is paid in the present study to a singlerepresentative tubular cell in the core region of the stack.
2.2 Internal reforming process
One of the important phenomena occurring in the IIR-T-SOFCs is the internalreforming of fuel and it takes place, as mentioned above, inside the feed tube.Although a variety of hydrocarbons can be used as fuel, description is given hereas an example for the case where methane, a major component of natural gas, isused as fuel.
For methane, the steam reforming process is widely known as a conventionalprocess for producing hydrogen [28, 29] and it proceeds on catalysts such as nickel-alumina through the following two chemical reactions:
Reforming reaction:
CH4 + H2O ←→ 3H2 + CO. (1)
Shift Reaction:
CO + H2O ←→ H2 + CO2. (2)
The equilibrium constant of the steam reforming reaction described by eqn (1) isreasonably large so that methane can almost totally be reformed if the system is keptat the operation temperature 700 ◦C or higher. However, a supply of thermal energyis needed for the reforming reaction to proceed since it is strongly endothermic.Therefore, how methane is reformed inside the feed tube is highly dependent onthe local conditions including not only temperature but also partial pressure of eachchemical species and density of the catalysts. On the other hand, the water-gas shiftreaction described by eqn (2) is a weak exothermic reaction. The important pointis that the shift reaction is almost in equilibrium in the entire fuel passage becauseits reaction rate is much faster than that of the steam reforming reaction.
2.3 Electrochemical process
The most important phenomenon occurring in the tubular cell is a series of eventsassociated with the electrochemical reaction. In the case where methane is used asfuel and is totally reformed inside the feed tube, the electrochemical processes onthe anode and cathode can be described by the following reactions:
Figure 4: Basic concept of the electrochemical process.
Overall reactions are equivalent to the following:
H2 + 12 O2 → H2O, (6)
CO + 12 O2 → CO2. (7)
Figure 4 illustrates the mechanism of the electrochemical processes in the tubularcell. On the cathode side, oxygen ions are produced by the combination of oxygenmolecules in the air flow with electrons. The produced oxygen ions move throughthe electrolyte to the anode side. Electrons are released from the oxygen ions at theanode and the produced oxygen molecules react with hydrogen or carbon monox-ide molecules there. The electrons released through the anode reactions move tothe cathode of the neighbouring cell through the interconnect or return to the orig-inal cathode via an external circuit – i.e. electric current is generated through thetubular cells.
The magnitude of the electric current directly relates to the rates of the electro-chemical reactions and depends on a variety of factors. These factors can be clas-sified into three groups: electromotive force, internal resistance, and external loadof the cell. The electromotive force is an ideal cell terminal voltage to be achievedat zero electric current or when the electrochemical reaction proceeds very slowly.The internal resistance causes the loss of terminal voltage and includes three differ-ent types of overpotentials; namely ohmic overpotential, activation overpotentialand concentration overpotential. Finally, the external load of the cell regulates theelectric current to be realized with the fuel cell under operation and is actually equalto the cell terminal voltage divided by the magnitude of electric current.
The electromotive force is largely determined by the concentration of fuel. Ingeneral, it decreases as hydrogen and carbon monoxide are consumed and thereforeas their concentrations become lower.As for the ohmic overpotential, ionic conduc-tivity of the electrolyte is one of the important factors. It has a tendency to decreaseas the temperature rises. This is the main reason why operation temperature mustbe high in the case of SOFCs. Electric conductivity of the electrodes also affects themagnitude of the ohmic loss of terminal voltage. Electric current flows through theelectrodes basically in the circumferential direction as shown in Fig. 4. Activationoverpotential occurs related to the sluggishness of electrochemical reaction andtends to decrease as the cell temperature rises. Concentration overpotential is alsoan important factor affecting the cell performance and is related to the radial con-centration nonuniformity of participating chemical species, i.e. fuel and oxygen.At the reaction sites, their concentrations are lower so that the real electromotiveforce to be attained under such concentrations is lower than the counterpart thatwould be achieved using the concentration in the core flow regions. This differenceis the concentration overpotential. These electromotive forces and internal resis-tances vary from place to place because temperature and gas composition are notuniform in the cell. Finally, as for the external load, electric current becomes largerand terminal voltage becomes lower as it decreases. Therefore, the output powerof the cell, which is the product of the electric current and the terminal voltage,reaches a peak at a certain value of the electric current or of the external load.
2.4 Purpose and key points of the analysis
In the development of good SOFCs, in particular, good IIR-T-SOFCs, there are threefundamental problems to be solved: how to improve the power generation perfor-mance, how to prevent thermal crack failure, and how to reduce the cost of produc-tion. Numerical analysis is expected to contribute to the solution of these issues.Among them, the thermal crack issue is an especially suitable one to be tackled withnumerical analysis. Thermal crack failure is caused by a combination of several ther-mal conditions including the appearance of a hot spot or of excessively high temper-ature, the generation of excessively large spatial temperature gradients, the timechanging rate of temperature in start-up of the fuel cells and the frequency of loadchange or of thermal conditions in practical operation. Cell temperature or electroc-hemical and other chemical reactions governing the cell temperature cannot be mea-sured and such detailed information can only be supplied from numerical analysis.
The thermal field in the cell is determined by the balance of several fundamentalphenomena: heat generation accompanied with the electric current and the electro-chemical processes, heat transfer among different parts of the cell having differenttemperature, heat absorption by the endothermic internal fuel reforming process,and heat removal by the air flow. Therefore, we must integrate all of the calcula-tion for the gas flow fields, temperature fields both in gas flow passages and solidparts, electrochemical and fuel reforming processes and related mass transfer fieldsof participating chemical species, and ionic and electric current fields. This mustbe done with some assumptions to keep the computation load within the reach ofengineering workstations but certainly must be done as accurately as possible in
order to establish reasonable databases for the thermal field of the cell. As for thegas flow velocity, temperature and mass transfer fields, at least two-dimensionalaxisymmetric analysis would be required to study heat and mass transfer at a rea-sonably accurate level. Meanwhile, consideration of peripheral nonuniformity isrequisite for the electric potential field. This is because, although ionic currentoccurs in radial direction across the electrolyte, electric current flows basically inthe circumferential direction in the electrodes as shown in Fig. 4. Of course it is bet-ter if three-dimensionality is taken into account for all related fields, but it requiresan extremely large CPU time. Hence what to assume and how to integrate thosecalculations are the key points of the numerical analysis on tubular SOFCs includ-ing the IIR-T-SOFCs. In this study, a previously developed quasi-two dimensionaltreatment [15, 16] is adopted as a base to develop the new model. This quasi-twodimensional model combines the assumed axisymmetry of the velocity, heat andmass transfer fields with the peripheral nonuniformity of the electric potential andelectric current fields.
3 Numerical modeling
This section presents the details of the numerical modeling of a tubular SOFC,particularly of an IIR-T-SOFC. This model is based on a previously developedmodel for a cathode-supported tubular SOFC to be operated with reformed fuelor especially with hydrogen [15, 16]. Therefore, the main parts of the model arecommon to both cases with and without accompanying internal fuel reforming.However, some general parts common to both cases will be outlined for simplicityreferring to the references and other parts specific to the case with indirect internalreforming will be emphasized.
As mentioned in the preceding section, various phenomena occur in the tubularcell such as gas flows, heat and mass transfer, internal reforming, electrochemicalreaction, non-uniform electric potential field and ionic and electric currents and gen-eration of heat and electricity. These phenomena are closely related to one another,thus they should be considered simultaneously in the numerical analysis. For thesake of the reader’s convenience, geometry of the cell and general assumptionsadopted in the present model are described as a preparation to read the followingparts. After this, modeling for the most basic phenomena in fuel cells, i.e. electro-chemical reactions, will be described first. Next, reforming and shift reactions aredescribed. Then, the modeling for the velocity, temperature and concentration fieldswill be discussed. Description will be made of the modeling for electric potentialfields, electric current and ohmic heating. Finally, an overall picture of the modelis given at the end of the section.
3.1 Computational domain and general assumptions for heat andmass transfer
A longitudinal sectional view of the tubular cell is shown in Fig. 5 with the dimen-sions and the chemical reaction equations to be considered in this study. In theexamples for IIR-T-SOFCs, of which results will be discussed later, the cell tube
Figure 5: Longitudinal cross sectional view of a tubular fuel cell.
geometry is assumed to be 500 mm long and to have a 6.9 mm inner radius and a9.6 mm outer radius. For computational convenience, air is taken to flow throughan annular space between a tubular fuel cell outer surface and a co-axial confiningcylindrical wall of which the radius is 14.6 mm. A square drawn with a fine dot-ted line in Fig. 3 illustrates the average air flow space in a stack. The surface ofthis artificial confining wall is assumed to be thermally adiabatic and the area ofthe annular space is equated with the average air flow space for a single cell in astack. This treatment is reasonable for a tubular cell located in the core of stack. Thehemi-spherical tube end is replaced by a flat end in the model and the computationaldomain is indicated by the broken line in Fig. 5. The cell tube and fuel feed tubeare solid and the feed tube is assumed to be filled with porous catalytic material,and the other areas are gas flow passages.
In this study, except in a case of a hydrogen-fuelled cathode-supported tubularSOFC, fuel is assumed to be a mixture of fresh methane and recirculated effluentexhausted from the fuel cell, namely a mixture of hydrogen, steam, CO, CO2 andmethane, and air is treated as a mixture of oxygen and nitrogen. All gas componentsare treated as ideal gases in the calculation of density and electromotive force. Inthe calculation of thermal fields, temperature is adopted as a variable to solve butthe thermodynamic properties like specific heat at constant pressure, enthalpy andGibb’s free energy and transport properties like viscosity and heat conductivityare treated variable with temperature. Their local values are evaluated at localtemperature by consulting the tables of properties included in the program [30, 31].Properties of mixture are evaluated with mixing laws by making use of the partialpressure of each chemical species [32]. Gaseous fluids are treated to be Newtonianand Reynolds number is lower than two hundred so that both air and fuel flows
are assumed to be laminar, steady and axisymmetric. The effect of gravity is notconsidered.
3.2 Model for electrochemical reactions
The most basic phenomena in the fuel cell are the electrochemical processes bywhich chemical energy of the fuel is directly converted into electricity. In this rela-tion, consumption of fuel and oxygen occurs. In addition to electricity generation,heat is generated as an ineffective part of the used chemical energy of the fuel. Hereit is first discussed how they are modelled.
As mentioned in the preceding section and shown in Fig. 5, the electro-chemicalreactions of hydrogen and CO, described by eqns (6) and (7), are considered inthis study. The local electromotive forces to be generated by these reactions arecalculated based on the following Nernst equation:
EH2/O2 = E0H2/O2
− R0T
2Fln
(PH2O
PH2 P0.5O2
), (8)
ECO/O2 = E0CO/O2
− R0T
2Fln
(PCO2
PCO2 P0.5O2
), (9)
where
E0H2/O2
=(−�G0
H2/O2
)2F
, (10)
E0CO/O2
=(−�G0
CO/O2
)2F
. (11)
The subscripts “H2/O2” and “CO/O2” indicate the reactions of eqns (6) and (7),respectively. �G0
H2/O2and �G0
CO/O2are the changes of the standard Gibbs free
energy accompanied with the reactions, and F is the Faraday constant. It is notedhere that the local partial pressures of chemical species at the surface of eachelectrode are assigned to the partial pressures in the above equations. This meansthat the concentration overpotential related to the concentration non-uniformityexisting in the fuel and air flow passages is automatically taken into account in theelectromotive forces described by eqns (8) and (9).
The overall electrochemical reactions described by eqns (6) and (7) can be dividedinto the electrode reactions described by eqns (3), (4) and (5). It is necessary toconsider the activation overpotential for each electrode reaction. In this study,the following equations suggested by Achenbach [18] are used to describe theactivation overpotentials:
where kH2 , kCO and kO2 are the coefficients of each equation: kH2 = 2.13 × 10⁸,kCO = 2.98×10⁸ and kO2 = 1.49×10¹⁰ A/m2. Aa and Ac are the activation energy:Aa = 1.1 × 10⁵ and Ac = 1.6 × 10⁵ J/mol. In addition, iH2/O2 and iCO/O2 are thecurrent densities in the electrolyte arising from the reactions of eqns (6) and (7),respectively, which are related to the consumption rates of hydrogen and carbonmonoxide as will be discussed later. They are also related to the local current densityi as follows:
i = iH2/O2 + iCO/O2 . (15)
Here the following relations exist between the electromotive force, activationoverpotential, ionic current density across the electrolyte, and the electric potentialof the anode and cathode, Va and Vc:
EH2/O2 − (ηH2 + ηO2 ) − iRehe = Vc − Va, (16)
ECO/O2 − (ηCO + ηO2 ) − iRehe = Vc − Va, (17)
where Re is the ionic resistivity of the electrolyte, which can be estimated consid-ering temperature dependency as suggested by Bessette et al. [19], and he is thethickness of the electrolyte. From the above relationships, the local current densityi is obtained if the local potential difference Vc − Va is given, or vice versa. In thepresent model, interconnects are assumed to work ideally and potential differenceVc − Va is therefore assumed to be constant along the tube axis. It is thereforeequal to the cell terminal voltage. As will be explained later, the cell terminal volt-age is given to start the computation and both the current density and potentialfields are calculated by making use of an equivalent electrical circuit model, detailsof which will be discussed later. In eqns (16) and (17), note that concentrationoverpotential to occur in relation with the nonuniform distributions of participat-ing chemical species in air and fuel flow passages has been taken into account ineqns (8) and (9). However, the concentration overpotential to be generated by thediffusion resistance of participating chemical species inside thin anode and cathodelayers has been ignored. An approximate method to treat this type of concentrationoverpotential has been proposed in [33]. However, microstructure of the porouselectrodes, or more specifically tortuosity as well as porosity and permeability ofthe porous electrodes, is not normally available. The authors found that the magni-tude of the ignored concentration overpotential is not large for a case without theindirect internal fuel reforming but in future this must be revisited more carefullywhen appropriate data for the structure of the cell supporting material and porouselectrodes become available.
Steam reforming of methane proceeds in the fuel feed tube preceding the electro-chemical reactions at the electrodes in the case of the IIR-T-SOFC. Therefore themodeling of internal fuel reforming is now discussed. As shown in Fig. 5, the steamreforming reaction described by eqn (1) and water-gas shift reaction described byeqn (2) are considered inside the feed tube, and the shift reaction is considered tofurther proceed outside the feed tube too. In this study, the reaction rates of the tworeactions, Rst and Rsh, are locally calculated as follows:
Rst = 1.75P1.2CH4
Wcat exp
(−57840
R0T
), (18)
Rsh = k+shPCOPH2O − k−
shPH2 PCO2 . (19)
Equation (18) is based on an empirical formula suggested by Odegard et al. whichis referred to in reference [34]. Wcat is the filling mass density of the catalyst forthe steam reforming and it is an important parameter in a sense that control ofits distribution can be used as a means to change the distribution pattern of celltemperature. In some examples to be discussed later, it is actually demonstratedhow this control is effective. R0 is the universal gas constant. k+
sh and k−sh denote
the rate constants of forward and backward water-gas shift reactions and the valueof Rsh is determined following the method suggested by Lehnert et al. [35]. Theirvalues vary from one place to another because of the nonuniform distribution ofcell temperature. An important point is that these constants are so large that the shiftreaction is always close to its equilibrium. Chemical equilibrium is represented bythe equilibrium constant which is a function of temperature and is equal to the ratiobetween the reactant partial pressures and the product partial pressures as follows:
Ksh = k+sh
k−sh
= pCO2 pH2
pCOPH2O= exp
(−�G0
sh
R0T
), (20)
where �G0sh is the change of the standard Gibbs free energy accompanied with the
shift reaction. This equilibrium constant is introduced into eqn (19) to calculate therate of the shift reaction.
3.4 Governing equations of velocity, temperature and concentrationfields and boundary conditions
Air and fuel are continuously supplied to a fuel cell to keep its appropriate operationand they flow through their respective flow passages in and around the fuel cell.Electrochemical reactions are supplied by diffusion of the participating chemicalspecies from the core flow region toward the reaction sites. Generated heat in the cellis partly used as a source to supply the energy to support the endothermic reformingreaction proceeding in the fuel feed tube but its main portion is transferred to andremoved by fuel and air flows. Heat generation is an ineffective part of chemical
energy converted in the fuel cell and therefore occurs at a rate related to the rateof electricity generation. Electricity generation results from the electrochemicalreaction of the fuel. The fuel consumption rate is related to the electric charge orionic transfer rate across the electrolyte. Electric current occurs in the electrodeswhere the transferred electric charge is collected. Electric current occurs in a patternconsistent with the electric potential fields to be established in the electrodes. Ohmicheat generation occurs in accordance with the electric current in the electrodesand ionic current across the electrolyte. All these phenomena are interrelated toeach other in a complicated manner. Therefore, all of the equations governingthe phenomena must be integrated in a consistent manner and must be solvedsimultaneously in an iterative procedure.
The most basic governing equations to be solved in the numerical model arethe ones for the velocity field, temperature field and concentration field in the fuelcell. They are different among the three kinds of areas: gas area, solid area andporous area. For the gas area, the following two-dimensional continuity, momen-tum, energy and mass transfer equations for laminar flows apply:
∂ρUx
∂x+ 1
r
∂rρUr
∂r= 0, (21)
ρUx∂Ux
∂x+ ρUr
∂Ux
∂r= −∂P
∂x+ ∂
∂x
(µ
∂Ux
∂x
)+ 1
r
∂
∂r
(rµ
∂Ux
∂r
), (22)
ρUx∂Ur
∂x+ ρUr
∂Ur
∂r= −∂P
∂r+ ∂
∂x
(µ
∂Ur
∂x
)+ 1
r
∂
∂r
(rµ
∂Ur
∂r
)− µUr
r2, (23)
ρCpUx∂T
∂x+ ρCpUr
∂T
∂r= ∂
∂x
(λ
∂T
∂x
)+ 1
r
∂
∂r
(rλ
∂T
∂r
)+ Q, (24)
ρUx∂Yj
∂x+ ρUr
∂Yj
∂r= ∂
∂x
(ρDjm
∂Yj
∂x
)+ 1
r
∂
∂r
(rρDjm
∂Yj
∂r
)+ Sj. (25)
In the above equations, Ux and Ur are the x- and r-components of the velocityand T is the temperature. Yj is the mass fraction of chemical species j and Djm is themass diffusivity of species j in the multicomponent mixture of gases. As describedabove, all of the thermodynamic and transport properties of each chemical speciesare treated as local variables varying with temperature and the properties of themixture are evaluated based on mixing laws by making use of the mass fractionof each chemical species. The terms Q and Sj in eqns (24) and (25) denote thesource terms to be described later. The effects of the electrochemical and reformingreactions on the thermal and concentration fields are included in these source terms.The effect of radiative heat transfer appears in the matching conditions at gas-solid interfaces. However, viscous dissipation in the energy equation is neglected.Thermal diffusion in mass transfer and enthalpy transfer due to species mass transferare not considered either in the present model.
For the solid part, the governing equation to be solved is the following heatconduction equation:
0 = ∂
∂x
(λs
∂T
∂x
)+ 1
r
∂
∂r
(rλs
∂T
∂r
)+ Q, (26)
where λs is the thermal conductivity of the solid. Values of λs of each material aretreated to be constant and specific values used in the present study are shown inTable 1 [34].
For the porous area, the governing equations derived by the method of volume-averaging are applied because the microstructure of porous media is generallytoo complicated to be considered directly in computations. In the adopted method,physical values are locally-averaged for a representative elementary volume, whichis sufficiently larger than the scale of the fine structure of the porous medium andis sufficiently smaller than the scale of the porous body itself [36]. Consequently,the following transport equations of the averaged physical values are used in thepresent model:
∂ρUx
∂x+ 1
r
∂rρUr
∂r= 0, (27)
1
ε2
{ρUx
∂Ux
∂x+ ρUr
∂Ux
∂r
}= −∂P
∂x+ 1
ε
{∂
∂x
(µ
∂Ux
∂x
)+ 1
r
∂
∂r
(rµ
∂Ux
∂r
)}
− µ
KUx − ρf√
KUx
√U 2
x + U 2r , (28)
1
ε2
{ρUx
∂Ur
∂x+ ρUr
∂Ur
∂r
}= −∂P
∂r+ 1
ε
{∂
∂x
(µ
∂Ur
∂x
)+ 1
r
∂
∂r
(rµ
∂Ur
∂r
)− µUr
r2
}
− µ
KUr − ρf√
KUr
√U 2
x + U 2r , (29)
ρCpUx∂T
∂x+ ρCpUr
∂T
∂r= ∂
∂x
(λeff
∂T
∂x
)+ 1
r
∂
∂r
(rλeff
∂T
∂r
)+ Q, (30)
ρUx∂Yj
∂x+ ρUr
∂Yj
∂r= ∂
∂x
(ρDjm,eff
∂Yj
∂x
)+ 1
r
∂
∂r
(rρDjm,eff
∂Yj
∂r
)+ Sj.
(31)
In principle, the physical values in the above equations represent the local“intrinsic” phase average of the gas (average over the gas volume, rather than the
total volume). This is the case for Ux and Ur which denote the gas phase averageof the local gas velocity components. However, this is not the case for temperature.A two-equation model for the thermal field [37] is not adopted in this study so thatlocal thermal equilibrium between the two phases is assumed. Therefore, T denotesthe local average both over the gas and solid phases. In addition, ε and K are theporosity and permeability of the porous medium, respectively. f is the inertia coef-ficient that depends on the Reynolds number and the microstructure of the porousmedium [38], while λeff and Djm,eff are the effective thermal conductivity and theeffective mass diffusivity of species j, respectively. Values of these parameters usedin this study are shown in Table 2.
The above three pairs of governing equations are properly conjugated to match atthe boundaries between different areas. No-slip condition is applied for the velocityfield at solid surfaces and gas-electrode interfaces. Impermeable condition is alsoapplied to the artificial confining wall of air flow and the inner and outer surfaces ofthe fuel feed tube. At the gas-electrode interfaces, the normal velocity componentis set equal to a value incurred by non-zero mass flow rate at the electrode due to theelectrochemical reaction [16]. The artificial air-flow-confining wall is assumed to bethermally adiabatic and continuity of heat flux is applied at all of other solid surfacesand gas-electrode interfaces. At the gas-electrode interfaces, mass production orconsumption rate of each chemical species is equated to a value regulated by theelectrochemical reaction, which will be briefly discussed later. Other solid surfacesare treated as unreactive. In starting computation, inlet conditions must be givenfor air and fuel flows. In addition, the cell terminal voltage is given as an externalcondition to start the computation and electric current density to be achieved underthe given terminal voltage is calculated. Through iteration, velocity, temperatureand concentration fields are determined as their converged solutions.
3.5 Discretization scheme
All the above governing equations can be solved only numerically and introductionof some sort of discretization is indispensable. So, a short description is given hereabout the discretization scheme adopted in the present model just as a hint for somereaders who may want to develop their own home-made program. However, it maybe worth noting that a number of commercial codes available for general use in avariety of thermo-fluid problems may be transformed into one applicable for fuelcell simulation.
All the above governing equationsl listed in section 3.4, eqn (21) througheqn (31), and eqns (38) and (39) to appear in section 3.6 also can be expressed in
Table 3: Variables and coefficients of each governing equation.
Eqn φ ρ � S
(22) Ux ρ µ −∂P
∂x
(23) Ur ρ µ −∂P
∂r− µUr
r2
(24) T ρCp λ Q
(25) Yj ρ ρDjm Sj
(26) T 0 λs Q
(28) Uxρ
ε2
µ
ε−∂P
∂x− µ
KUx − ρf√
KUx
√U 2
x + U 2r
(29) Urρ
ε2
µ
ε−∂P
∂r− µUr
εr2− µ
KUr − ρf√
KUr
√U 2
x + U 2r
(30) T ρCp λeff Q
(31) Yj ρ ρDjm,eff Sj
the following general form:
ρUx∂φ
∂x+ ρUr
∂φ
∂r= ∂
∂x
(�
∂φ
∂x
)+ 1
r
∂
∂r
(r�
∂φ
∂r
)+ S, (32)
where φ represents the variable of interest. ρ and � are the coefficients of theconvection term and the diffusion term, respectively, while S denotes the sourceterm. Specific values of these factors are summarized in Table 3 for several equa-tions. Although there are a variety of discretization schemes available, the finitevolume method is adopted in the present model with the staggered grid system. Inthe staggered grid system, two types of grid arrangements are provided: the velocitygrids to store the velocity components and the normal grids for the other scalarssuch as pressure, temperature and concentrations. The velocity grids are shifted inposition from the normal grids as illustrated in Fig. 6 to stably couple the velocityand pressure fields [39].
Integrating over each control volume for the normal grids, painted grey in Fig. 6,eqn (32) can be discretized into the following form:
Figure 6: Staggered grid for the Finite Volume Method.
in which the subscripts e, w, n and s indicate the positions of four faces of the controlvolume under consideration, and rm denotes the arithmetic mean of rn and rs. Notethat the control volume for velocity components is different from the counterpartfor a scalar because the staggered grids are employed. In order to interpolate thefluxes of convection and diffusion at the interfaces expressed by e, w, n and s,the Power-Law scheme suggested by Patankar [39] is adopted here. As a result,the fluxes on the interfaces can be represented by the values on the grid points asfollows: (
ρUxφ − �∂φ
∂x
)e
rm�r = aE(φP − φE), (34)
where aE is a coefficient determined by the Power-Law scheme. This is an exam-ple for the interface e, and similar expression can be adopted on the other inter-faces. Consequently, eqn (33) can be transformed into the following algebraicequation:
aPφP = aEφE + aW φW + aN φN + aSφS + b, (35)
where
aP = aE + aW + aN + aS , (36)
b = S · rm�r�x. (37)
The above discretized equations for velocity, temperature and concentration haveto be solved simultaneously since gas properties are dependent on temperatureand concentration of each gas component. To solve for velocity, the pressure fieldmust be determined because the pressure gradient is included in the momentumequations. In order to solve both the velocity and pressure fields concurrently,
the SIMPLE algorithm put forward by Patankar et al. [39] is adopted in this model.Other details of discretization may be found in [39].
3.6 Equations for electric potential and electric circuit
Here is described the method to calculate the electric potential fields to be generatedin electrodes and accompanying flow of electric current. The mathematical descrip-tion in this section is given directly in discretized form for the reader’s convenience.In the present model, it is assumed that ionic current flows only radially across theelectrolyte but electric current through electrode layers only in the circumferential(θ) direction as shown in Fig. 4 based on the fact that the electric resistivities of theelectrodes are much smaller than the ionic resistivity of the electrolyte. In addition,the interconnect is treated to act ideally so that the potential difference betweenits position attaching the anode, θ = 0◦, and its position attaching the cathode,θ = 180◦, is taken to be equal to the cell terminal voltage.
Figure 7 illustrates the grid system adopted in the calculation of the electricpotential field in the cell tube and accompanying electric current. According toKirchhoff’s law, the following discretized equations can be derived for both of thetwo electrodes:
(iu − id )ha − iPP′ · re�θ = 0, (38)
(iu′ − id ′ )hc + iPP′ · re�θ = 0, (39)
where iPP′ is the current density given by eqn (15) along a particular line connectingthe grid points P and P′ located across the electrolyte as illustrated in Fig. 7. iu,id , iu′ and id ′ are the values of current density to occur respectively along thefour lines connecting the two grid points separated in the circumferential direction,U and P and P and D in the anode layer and U ′ and P′ and P′ and D′ in thecathode layer. re is the radius of the mid surface of the cylindrical electrolyte shelllayer.
Figure 7: Grid for the equivalent electrical circuit.
According to Ohm’s law, the electric current in the electrodes can be related to thedifference in the electric potential between the related grid points:
iuha = ha
Raraδθu(VU − VP), id ha = ha
Raraδθd(VP − VD), (40)
iu′hc = hc
Rcrcδθu′(VU ′ − VP′ ), id ′hc = hc
Rcrcδθd ′(VP′ − VD′ ), (41)
where Ra and Rc are the electric resistivities of the anode and cathode, respectively.They are estimated by the empirical formula suggested by Bessette et al. [19] inthis model. Rewriting eqn (15) with E defined by the following equation:
the electric current across the electrolyte iPP′ can be represented by the potentialdifference and E as follows:
iPP′re�θ = re�θ
Rehe{EPP′ − (VP′ − VP)}. (43)
Hence eqns (40) through (43) can be rewritten into the following algebraic equa-tions:
aPVP = aU VU + aDVD + aPP′VP′ − b, (44)
aP′VP′ = aU ′VU ′ + aD′VD′ + aPP′VP + b, (45)
where
aU = ha
Raraδθu, aD = ha
Raraδθd, aU ′ = hc
Rcrcδθu, aD′ = hc
Rcrcδθd, (46)
aPP′ = re�θ
Rehe, b = re�θ
ReheE, (47)
aP = aU + aD + aPP′ , (48)
aP′ = aU ′ + aD′ + aPP′ , (49)
eqns (44) and (45) can be solved numerically with a scheme similar to the one tosolve momentum, heat and mass transfer equations described in the Section 3.5.
3.7 Mass production or consumption rate of each chemical species throughelectrochemical and reforming reactions
The mass production rate of each chemical species by the electrochemical reactionsis directly related to the electric current density caused by each of the electrochemi-cal reactions, eqns (6) and (7), and its value, sj, is tabulated in Table 4. For example,the mass consumption rate of hydrogen, sH2 , is equal to the product of the molecular
Table 4: Mass production or consumption rate of each species by the reactions(6) and (7).
Eqn sH2 sH2O sCO sCO2 sO2
(6) − iH2/O2
2FMH2
iH2/O2
2FMH2O 0 0 − iH2/O2
4FMO2
(7) 0 0 − iCO/O2
2FMCO
iCO/O2
2FMCO2 − iH2/O2
4FMO2
Table 5: Mass production or consumption rate of each species by the reactions(1) and (2).
Eqn SH2 SH2O SCO SCO2 SCH4
(1) 3RstMH2 −RstMH2O RstMCO 0 −RstMCH4
(2) RshMH2 −RshMH2O −RshMCO RshMCO2 0
weight MH2 and the molar consumption rate of hydrogeniH2/O2
2F , where the Faradayconstant F designates the electric charge of one mole of electrons. It must be notedhere that two moles of electrons participate into the electrochemical reaction ofone mole of hydrogen as seen in Fig. 5. These species mass production rates havenonuniform distributions in the circumferential direction because the current den-sity is nonuniform in that direction. In the present quasi-two-dimensional model,therefore, they are peripherally averaged before being introduced into axisymmetrictwo dimensional mass transfer equations for the concentration fields.
The production or consumption rate of each chemical species by the reformingand shift reactions is also calculated as shown in Table 5. The value of mass produc-tion or consumption rate for each chemical species is introduced into the speciesmass transfer equation as a part of its source term.
3.8 Model for thermodynamic heat generation rates
The thermodynamic heat generation rates related to the electrochemical reactionsare equal to the generation rate of the ineffective part of the input energy, whichcannot be converted into electricity, and are calculated as follows:
qH2/O2 ={
(−�HH2/O2 )
2F− E
}iH2/O2 , (50)
qCO/O2 ={
(−�HCO/O2 )
2F− E
}iCO/O2 . (51)
These heat generation rates are included in the calculations of the energy equation asa part of its source term. The thermodynamic heat generation rate by the reforming
reactions, are calculated based on the reaction rates discussed in the Sections 3.3and 3.7, as follows:
Qst = −�HstRst, (52)
Qsh = −�HshRsh, (53)
where �Hst and �Hsh are the enthalpy change accompanied with each reaction.
3.9 Ohmic heat generation
With the current density and electric potential fields obtained in Section 3.6, ohmicheat generation rates in the electrodes and electrolyte are calculated as follows:
QP = i2uδθu + i2
d δθd
δθu + δθdRa, QP′ = i2
u′δθu + i2d ′δθd
δθu + δθdRc, (54)
QPP′ = i2PP′Re. (55)
These heat generation rates are nonuniform in the θ-direction. In the present quasi-two-dimensional method, they are peripherally averaged before they are introducedinto the source term of the axisymmetric two-dimensional energy equation for thethermal field [15, 16]. Averaged results for the heat generation rates read as follows:
Qa =∑π
θ=0 qP�θ
π, Qc =
∑πθ=0 qP′�θ
π, (56)
Qe =∑π
θ=0 qPP′�θ
π. (57)
3.10 Radiation model
Now modeling of radiation heat transfer will be discussed. In the present model,the radiation heat transfer between the inner surface of the cell tube and the outersurface of the feed tube is considered. In the case of the IIR-T-SOFC, this plays animportant role in transferring the heat generated by the electrochemical reactionsat the tubular cell to the feed tube, and therefore, to the reaction site of endothermicfuel reforming.
In the case of a tubular SOFC, the cell tube is slender in geometry. For example, inthe case of a tubular IIR-T-SOFC to be studied in this chapter, the fuel flow passageis an annular space between two cylindrical surfaces facing to each other, i.e. anodesurface and fuel feed tube outer surface. The width of the annular space is 2.4 mm.This is quite small compared to the cell tube length, 500 mm. This slenderness ofthe tubular cell has important implications for thermal radiation.
The first of the implications to note here is that the optical length of the gasmedia flowing through the annular space is small. Emittance of the gas layer isgiven as the product of the optical length and absorption coefficient of gas which isan increasing function of the partial pressure of each chemical species participating
in radiation. So absorption into or emission from gaseous media can be neglectedor the annular space can be treated transparent to radiation so long as the operationpressure is not very high.
Description of the modeling of radiation heat transfer will begin with an expla-nation about the computation method of radiation heat transfer for general use.Certainly, the first feature of thermal radiation in a tubular fuel cell just notedabove is taken into account. For more details of this part of discussion, refer to thereference [40]. Now consideration is given to an enclosure covered by the innersurface of the anode and the outer surface of the fuel feed tube and this enclosureis considered to consist of N diffusely emitting and diffusely reflecting gray sur-faces. The surfaces are each isothermal. Surface j has temperature Tj and emittanceεj. The net rate of heat loss flux qi from a surface i is equal to the difference betweenthe emitted radiation and absorbed portion of the incident radiation. Therefore, itis given as:
qi = εiσT 4i − εiIi, (58)
where Ii is the radiation incident on surface i per unit time and unit area andabsorptance of the surface i is replaced by the emittance εi taking into accountKirchhoff’s law of radiation.
Here is introduced the radiosity Bj of a surface j. The radiosity is the sum of thereflected and emitted radiant fluxes. So the following relationship holds:
Bj = εjσT 4j + (1 − εj)Ij. (59)
A fraction of Bj is directed to the surface i and contributes to the incident radiationon the surface i. Such contribution from the surface j to the incident radiation onsurface i per unit area is now calculated as:
Iji = FjiBjAj/Ai = FijBj, (60)
where Fji and Fij are the shape factors and the reciprocity rule AjFji = AiFij hasbeen used. Now similar contributions come from every surface so that Ii is finallyexpressed as follows:
Ii =N∑
j=1
FijBj =N∑
j=1
Fij(εjσT 4j + (1 − εj)Ij). (61)
Iterative calculation is needed to determine the value of Ii or the value of qi withthe determined value of Ii. However, this iterative procedure needs a large com-putational load if a large number is assigned to N . Actually the computation isexcessively large for the present purpose of using the result for optimum designor thermal management of a tubular SOFC. Therefore, introduction of a certaindegree of approximation into the modeling is desirable. The procedure followed isto reduce the number of surfaces considered in the computation.
The approximation adopted in the present model is again based on the slendernessof the tubular cell. For just an example, attention is paid to a geometrical situation
illustrated in Fig. 8. Two small elementary surfaces having 20 mm length, surfaces1 and 2, are positioned in parallel to each other at a distance of 2.4 mm in thisfigure. An angle viewing one of them, say surface 1, from a point M on anothersurface 2 is about 153 degrees. The viewing angle of other parts, say surface 3,outside the surface 1 from the point M is only 27 degrees. So, the value of F21 isclose to 1 and both of F23 and F32 are close to zero. Naming the surfaces situatedon both sides of the surface 2 as surface 4, F24 = 0 and F22 = 0 hold. From thesame reasoning as above both of F14 and F41 are close to zero too. So, based onthe slender geometry of the tubular cell, radiation heat transfer between the twosurfaces 1 and 2, directly facing each other, is considered. Then, it can be assumedthat only two shape factors F21 and F12 take a non-zero value. Under this treatment,eqn (61) can be very much simplified. Certainly, by increasing the number of thesurfaces, a better approximation is obtained but at the cost of computational time.Now assigning the suffix 1 to the anode inner surface and 2 to the fuel feed tubeouter surface, F21 = 1, F12 = A2/A1 and F11 = 1 − A2/A1 hold under the adoptedassumption. Thus eqn (61) can be approximated as:
I1 =2∑
j=1
F1jBj = F11B1 + F12B2, (62)
I2 =2∑
j=1
F2jBj = F21B1 (63)
and eqn (60) as:B1 = ε1σT 4
1 + (1 − ε1)I1, (64)
B2 = ε2σT 42 + (1 − ε2)I2. (65)
Similarly, eqn (58) can finally be approximated as:
q1 = ε1σT 41 − ε1I1, (66)
q2 = ε2σT 42 − ε2I2. (67)
In the present model, these equations are locally used at each axial position andthese radiant fluxes are included in the calculation of heat transfer as a part of theheat flux both at the inner surface of the anode and at the outer surface of the fuelfeed tube.
Monochromatic radiation properties of ceramics are highly dependent on wave-length [41, 42]. Pore size of the electrodes and support materials is close to thewavelength of thermal radiation. Thinning the electrodes creates a similar situa-tion that the electrode thickness comes closer to the wavelength too. This situationmakes the problem complicated. Pore microstructure affects the wavelength depen-dency of the radiation properties of the fuel cell element materials and thin elementlayer can become semi-opaque. Therefore, sophisticated treatment of the radiationproperties of the electrode and support materials is desirable. However, radiationproperties of such materials have not been thoroughly studied yet. Therefore, forsimplicity, the absorption coefficient of the solid materials of the fuel cell is assumedto be constant in the present model. This assumption however must be revisitedwhen the micro structure and radiation properties of the fuel cell element materialshave been thoroughly studied.
Radiation heat transfer among the tubular cells in the module can be anotherfactor affecting the performance of the fuel cell. This is very true in the case of themodule having an “in-stack reformer”. However, in the case of the present IIR-T-SOFC or a tubular SOFC using fuel reformed outside the module, every singletubular fuel cell located in the core of the module is surrounded by other tubularfuel cells similar in conditions including the temperature distribution on the outersurface of the cell tube. Again, the space between neighbouring tubular cells issmall since tubular cells are stacked in a compact way in the module. So neglectingradiation heat transfer between the outer surfaces of neighbouring tubular cells isless serious in such cases of a tubular SOFC. However, it must be studied moreseriously in the case of the module having an in-stack reformer and this heat transferis a problem to be carefully studied in the modeling of cell stack modules.
3.11 Overall picture of the model
In closing this section, an overall picture of the model is presented in Fig. 9. One ofthe main parts of this computation is the calculation of the temperature and concen-tration fields assuming their two-dimensionality. Based on the calculated tempera-ture and species concentrations, the electromotive force and several resistances arecalculated for the calculation of electric current and potential fields allowing theircircumferential nonuniformity, which is another main part of this model. Based onthe results of the electric fields, the peripheral average of the ohmic heat generationis calculated. Local current density is related to the mass production rate of partici-pating chemical species. The heat generation rates and species mass production ratesthus calculated are fed back to the calculation of the temperature and concentration.
The gas properties and the reforming reaction rate are also interrelated with thetemperature and concentration fields. Therefore, all of the above calculations areiterated simultaneously. As a result of iteration, all of the temperature, concen-tration and electric fields of the cell are obtained. Finally the cell performance,such as average current density, output power or energy conversion efficiency, isobtained. A more detailed description of this overall scheme can be found in thereferences [8, 15, 16].
Figure 9: Overall picture of the IIR-T-SOFC model.
4 Results and discussion
In this section, some calculation results obtained by making use of the numericalmodel described in the preceding sections are discussed. In section 4.1, discussionis first given to some results of the model applied to a conventional hydrogen-fuelled tubular SOFC and its validation is presented by comparing some results withpublished experimental data. How this model is powerful as a tool for optimumdesign and thermal management of a tubular SOFC is also demonstrated in thissection. In sections 4.2 and 4.3, discussion will be given to some results obtainedby applying the model to an IIR-T-SOFC. In section 4.2, the results for a “Basecase” will be presented so as to illustrate the essence of the phenomena in a tubularcell accompanying the indirect internal fuel reforming. Then, methods to lowerand/or to make more uniform the temperature of the cell will be discussed alongwith other results in section 4.3.
4.1 Results for a cathode-supported tubular SOFC without accompanyingindirect internal reforming [16, 43, 44]
In this type of tubular SOFC, as shown in Fig. 2, air is supplied inside the tubular cellthrough the air feed tube and fuel flows around the tubular cell in the axial direction.So the innermost layer of the cell is the cathode and outermost layer is the anode.Electrolyte material is assumed to be Yttrium-stabilized Zirconia (YSZ) and thefuel is pure hydrogen. So the parts of the present model concerning fuel reformingand electrochemical reaction of carbon monoxide are inactivated. In this case, heatabsorption by the fuel reforming does not exist either and heat transfer from thecathode inner surface to the outer surface of the air feed tube is less important.For this reason, radiation heat transfer between the two surfaces is ignored in this
Inner side of air-inducing tube 8.0 mmOuter side of air-inducing tube 9.0 mmInner side of supporting tube 13.8 mmOuter side of anode 19.2 mmOuter diameter of fuel channel 29.2 mmφ
Length of cell unit 500 mm
particular example. Inlet conditions of air and fuel flows are tabulated in Table 6(a).Geometry of a tubular cell is kept to be the one given in Table 6(b) unless otherwisestated. Fuel and air utilization factors are set to be 0.85 and 0.167 respectively.Illustration of local quantities shown in Figs 14–16 is for the case of an electriccurrent density of 3500 A/m2. Other details are found in reference [16].
Figure 10 illustrates the current-voltage (I-V) diagram of the studied tubularSOFC. Calculated results agree fairly well with the experiments performed byHagiwara et al. [45]. For small current density conditions, simulated results are alittle higher than the experiments. This over-prediction may be related to a simpletreatment of activation overpotential. It is assumed in this particular computationthat the activation polarization is proportional to current density and the valueof the proportionality constant is adjusted at an optimum current density around3000A/m2. However, at smaller current density, the cell temperature is lower, anda larger activation overpotential or a larger proportionality constant should havebeen adopted. In the examples to be discussed in the Section 4.2 and 4.3, moresophisticated treatment of activation overpotential is adopted as already discussed
Figure 11: Conversion efficiency and output power.
in Section 3.2. Except for this point, obtained results look reasonable and the presentmodel is basically validated.
Figure 11 illustrates the cell electricity generation efficiency and the power tobe achieved with a single tubular cell. With an increase of current density, powerto be obtained increases up to a certain value but efficiency decreases. This isthe normal tendency and optimum current density is determined by a trade-offbetween the two quantities having opposite tendency. Figure 12 shows the cellterminal voltage for four cases of tubular SOFCs having different tube length.All the calculated results almost overlap. In this computation, the fuel utilizationfactor is kept constant. This means that both air and fuel are supplied at a rateproportional to the cell tube length. Larger air flow rates enhance the cooling ofthe cell but this is countered by larger ohmic heating at lower temperatures. Underthe same electric current density, therefore, both the concentrations of fuel andoxygen decrease at a rate proportional to the tube length almost keeping similarity
Figure 12: Effect of cell length on output voltage at constant fuel utilization factor.
Figure 13: Effects of tube diameter on energy efficiency.
in the temperature field among the three cases. This results in such a condition thatboth electrochemical reaction and heat generation proceed similarly or in a mannerproportional to the cell tube length. Figure 13 shows the effects of the cell tubediameter. In the case of a cell tube having larger diameter, the length not only ofelectrolyte but also of electrodes is larger. Then larger ohmic loss occurs, reducingthe terminal voltage, and ohmic heat generation also becomes larger because ofthe larger collection of electric current per unit length of interconnect. Therefore,a thinner tubular cell can have a higher performance. Figure 14 shows the axialdistributions of the local EMF and current density. Both quantities show the sametendency to decrease in the downstream direction. Concentrations of hydrogen andoxygen in the first half of the cell are still high so that the EMF in that region is hightoo. Similarity between the current density distribution and the EMF distributionindicates that the axial electric current is minor compared to the peripheral one orthat interconnect works well.
Figure 14: Distribution of EMF and current density.
Figure 15: Temperature distribution in a cell.
Figure 15 shows the temperature distribution in the tubular SOFC unit. As for thefuel flow temperature, it rises downstream of the inlet and approaches 1000 ◦C, thenkeeps an almost uniform value in the middle part of the cell and slightly decreasestoward the exit end. In the air feed tube, air is heated after it flows into the tube.A noticeable transverse gradient of air temperature is found to exist in the annularspace over the whole length of the air feed tube. This gradient drives heat transferfrom the cell structure, where heat generation occurs, to the air flow in the annularspace. This ensures effective cooling of the cell. Radiative heat transfer, ignored inthe present computation, may flatten the streamwise temperature non-uniformitybut is not expected to change the trend of the temperature distribution significantly.This is because the convective heat transfer considered in the present study is effec-tive already to reduce the differences in surface temperature among various parts ofthe cell. So air acts as a coolant of the cell. One point related to the convective heattransfer should be noted here. In various numerical models proposed so far, a con-stant value for the Nusselt number is used in evaluating the local heat removal rateto the air flow. However, this is not a good assumption and actually the heat transfercoefficient is significantly nonuniform along the axial direction [46]. In relation tothe discussion of the concentration polarization, distributions of hydrogen and oxy-gen concentrations are presented in Fig. 16. In the fuel passage, the concentration ofhydrogen decreases downstream, especially steeply in the first part after the inlet.However, the radial non-uniformity of the hydrogen concentration is not significant
so that the related concentration polarization is judged to be minor. In contrast tothis, radial non-uniformity of oxygen concentration is noticeable. This difference isattributed to the difference in the diffusivity, i.e. the diffusivity of hydrogen is muchhigher than that of oxygen. Therefore, concentration polarization induced by thenonuniform distribution of species concentration in the flow space is not negligibleat the cathode side but it can be ignored on the anode side.
4.2 Results for the Base case with accompanying indirectinternal reforming
In the examples for which results will be discussed here, cell tube geometry isassumed as is shown in Fig. 5 to be of 500 mm length, 6.9 mm inner radius and9.6 mm outer radius. An adiabatic cylindrical wall artificially introduced to confineair flow for computational convenience has 14.6 mm in radius. Other details of cellgeometry are tabulated in Table 7.
The inlet and outlet conditions of the fuel and air are summarized in Table 8 andcomputational conditions for the Base case are shown in Table 9. In the presentstudy, fuel mean velocity at the inlet is set equal to such a value that the limitingvalue of the average current density is about 5000A/m2 (e.g. 0.923 m/s when theinlet temperature is 800 ◦C). In contrast, the air mean velocity at the inlet is setto be 2.0 m/s except for some special cases to be specified later. The fuel andair temperatures at the inlets are changed from one case to another as will bedescribed in a later section but unless otherwise stated they are the values givenin the table. The temperature at the closed end of the cell tube is set equal to theair inlet temperature. Catalyst distribution “U-20” means that the catalyst massdensity, Wcat, is set at 2.0 × 10⁶ g/m3 uniformly inside the feed tube. This is such avalue that the supplied methane fuel can be fully reformed even when the electricalcircuit is open. In this case, fuel reforming is thermally supported just by the heattransferred from hot air and fuel flows.
The case number for the Base case 2-800U20 indicates that the inlet velocity ofthe air is 2 m/s, the inlet temperature of the fuel and air is 800 ◦C, and the catalystdistribution is the pattern U-20. “Neuman” appearing in the table means that zeroaxial gradient is assumed at the outlet for the variable under concern as its boundarycondition. As mentioned before, the cell terminal voltage is given at the start of thecomputation as a condition to calculate the electric current and potential fields in
Inner side of feed tube 8.0 mmOuter side of feed tube 9.0 mmInner side of supporting tube 13.8 mmOuter side of cathode 19.2 mmOuter diameter of fuel channel 29.2 mm
Length of cell unit 500 mm
Table 8: Gas inlet and outlet conditions.
Velocity Temperature Molar fraction [−] Total pressure [Pa]
order to identify the given external load of the cell. Unless otherwise stated, theresults of the Base case are shown with particular emphasis on the condition inwhich the cell terminal voltage is set at 0.55 V and accordingly the average currentdensity becomes 3926A/m2.
4.2.1 Thermal and concentration fieldsFigure 17 shows velocity vectors inside and outside the cell tube. Note that thisfigure is not to scale: the radial (r) direction is magnified ten times larger thanthe axial (x) direction. The fuel flow is accelerated inside the feed tube due to anincrease in the total number of moles caused by the steam reforming. Fuel flowsinto the cell tube from the open end of feed tube and flows back to the tube outletthrough annular fuel flow passage. Fuel flow inside the tube is almost in a stagnantcondition at the bottom end.
Temperature contours for the same case are shown in Fig. 18. Note that the darkertone corresponds to the higher local temperature. The temperature in and aroundthe cell basically becomes higher downstream in relation to the air flow becauseof the heat generation accompanying the electrochemical process. However, thetemperature is noticeably lower near the inlet of the fuel due to the endothermiceffect of the steam reforming reaction.
Here the x-direction distributions of the temperature inside the electrolyte and thefeed tube are shown in Fig. 19. Conspicuous non-uniformity of temperature existsas seen in the figure. This is not the case of Siemens-Westinghouse type hydrogen-fuelled tubular fuel cell [16] and must be avoided because it can lead to thermalcrack failures of the cell. Furthermore, the maximum temperature of the electrolyte
Figure 17: Velocity vectors around the cell for an average current density of3926A/m2 in the Base case (2-800U20).
Figure 18: Temperature field in and around the cell for an average current densityof 3926A/m2 (2-800U20).
Figure 19: Local temperature of the electrolyte and the feed tube for an averagecurrent density of 3926A/m2 (2-800U20) and that in a similar case butnot considering the effect of radiation.
reaches about 1050 ◦C, which is the hot spot temperature to be avoided from thematerial view point. By the way, the broken lines in Fig. 19 show the result in whichthe effect of radiation described in section 3.4 is excluded. From this result, it isconfirmed that the radiation contributes noticeably to the heat transfer between thecell tube and the feed tube in this case with accompanying indirect internal fuelreforming.
Figure 20 shows mole fraction contours of hydrogen, steam, CO, CO2, methaneand O2, respectively. Note that the grey tone levels differ among each chemicalspecies. Inside the feed tube, hydrogen and CO are produced while steam andmethane are consumed by the steam reforming. Methane is rapidly reformed nearthe feed tube inlet because the amount of the catalyst is excessive for the operatingcondition of the cell under study. Meanwhile, outside the feed tube, hydrogen andCO are consumed while steam and CO2 are produced mainly by the electrochemi-cal reactions. The reason for the considerable change of the mole fraction occurringat the bottom of the cell is that the fuel flow stagnates while the electrochemicalreactions take place there. As for the air side, oxygen is consumed by the electro-chemical reaction. However, variation of its mole fraction is not so large becausethe flow rate of air is adjusted so as to effectively remove the generated heat andis normally in excess of that required to complete the electrochemical reactions. Inother words, the oxygen utilization factor is set normally as low as 0.2 or 0.3.
The molar flow rates of each chemical species inside and outside the feed tubeare shown in Figs 21(a) and (b), respectively. Characteristics of the electrochemicaland reforming reaction described above can be confirmed in these figures.
4.2.2 Electric potential and current fieldsDistribution of electromotive force (EMF) is shown in Fig. 21. Although two dif-ferent values of EMF, EH2/O2 and ECO/O2 , are calculated in this study as described
Figure 20: Mole fraction distributions of each chemical species for an averagecurrent density of 3926A/m2 (2-800U20).
in section 3.6, these two differ very slightly from each other by the reason thatthe shift reaction is very close to equilibrium everywhere in the cell. Hence onlyEH2/O2 is plotted here as the EMF. As seen in this figure, the EMF strongly dependson the mole fraction of hydrogen at the anode surface: the EMF has a peak near theoutlet of the feed tube and becomes lower toward the cell tube outlet. However, itbecomes a little higher near the cell tube outlet again due to the larger change ofGibb’s free energy, �G, at lower temperature.
Figure 21: Molar flow rate of each chemical species of fuel for an average currentdensity of 3926A/m2 (2-800U20).
Figure 22: Electromotive force and current density distributions for an averagecurrent density of 3926A/m2 (2-800U20).
Distribution of current density is also shown in Fig. 22. Note that the distributionplotted in this figure is the peripheral average of local current density at eachaxial position. This figure indicates that the distribution of current density is notsimilar in shape to that of EMF. This is because the current density is also relatedto the activation overpotential and the ohmic loss which depend strongly on thetemperature. As shown in Fig. 23, both the activation and ohmic overpotentials aresignificantly reduced around x = 0.4, where the cell temperature takes a peak value(see Figs 18 and 19). That is to say, the current density distribution depends on thethermal field as well as, or more than, on the concentration field. At the same time,it is also true that the temperature tends to become higher where the large currentis generated, so that a kind of enhancement due to a mutually assisting interactionexists between the cell temperature and the electric current.
Incidentally, the ohmic loss in the anode and cathode is closely related to the dis-tribution of the current density in the θ-direction, which is essentially non-uniform.Details can be found in the references [13, 14].
Figure 23: Activation overpotential and ohmic loss in the electrolyte for an averagecurrent density of 3926A/m2 (2-800U20).
Figure 24: Temperature of the electrolyte for several different average currentdensities (2-800U20).
4.2.3 Power generation characteristicsBefore moving into the discussion on the power generation characteristics of thefuel cell, results of the electrolyte temperature for several cases of different averagecurrent densities are given here. Figure 24(a) shows the x-direction distribution ofelectrolyte temperature for the cases of average current density 2191, 3081 and3926A/m2. All the three distributions have similar features as those described insection 4.1.1, but temperature becomes higher on the whole as the average currentdensity becomes larger. The relation between the average current density and themaximum and average temperatures of the electrolyte is shown in Fig. 24(b).
The power generation characteristics of the cell are significantly affected by thecell temperature. Figure 25 shows the cell-averaged EMF, activation overpotentialand ohmic loss in the electrolyte for various values of average current density. Thecell terminal voltage, which is practically given as the external condition to startthe calculation in this study, is also plotted here. From this figure, the following
Figure 25: Average EMF and overpotentials vs. average current density(2-800U20).
Figure 26: Output power and energy conversion efficiency vs. average currentdensity (2-800U20).
things are confirmed. First, the cell-averaged EMF goes down at a nearly con-stant rate as the average current density increases. This is largely because the localconcentrations of hydrogen and CO decrease due to their larger consumption rates.The activation overpotential does not increase proportionally to the average currentdensity countered by the rise in temperature as mentioned above. The ohmic lossin the electrolyte also does not increase for the same reason. However, the ohmicloss in the anode and cathode, which is basically larger than that in the electrolytebecause the electric current flows long distances there in the θ-direction as men-tioned in section 3.7, increases nearly in proportion to the average current density.
From these results, the output power and energy conversion efficiency of thecell are also obtained as shown in Fig. 26. Here the efficiency is calculated basedon the lower heating value (LHV) of the fuel consumed in the cell. Judging from
these calculated results, fairly high performance seems to be achieved under theconditions for the Base case.
4.3 Strategies for the ideal thermal field
As described in section 4.1.1, the thermal field in the cell obtained for the Basecase is undesirable in a sense that the thermal field is seriously non-uniform and themaximum temperature is rather high. Hence the strategies to flatten and/or lowerthe distribution of cell temperature are discussed here.
Decreasing the inlet temperatures of the gases is a primary method to lower thecell temperature. Increasing the air flow rate also seems to be effective when thecell temperature is higher than the inlet temperature of the air. To achieve a near-uniform thermal field, controlling the density distribution of catalyst inside the feedtube should be useful. In order to examine those effects, calculations for the fourcases summarized in Table 10 have been conducted.
In Case 2–750U20, the inlet temperatures of the gases are decreased down to750 ◦C and accordingly the fuel inlet velocity is reduced to 0.880 m/s to keep itsmolar flow rate at the same value as the Base case. In Case 4-800U20, the air flowrate is doubled from the Base case. In Case 2-800U02 and 2-800L02, the densitydistribution of catalyst is changed to “U-02” and “L-02”, which are describedin Fig. 27. The amounts of the catalyst in U-02 and L-02 are optimised for theconditions of average current density about 4000A/m2. That is, fuel is completelyreformed just near the end of the feed tube under such conditions. The calculationresults for the above four cases are discussed below in sequence.
4.3.1 Effect of gas inlet temperatureThe temperature contours obtained at the average current density 4043A/m2 inCase 2-750U20 are shown in Fig. 28, and the electrolyte temperature distributionin the x-direction is shown in Fig. 29. Owing to the lower gas inlet temperatures, thecell temperature decreases on the whole. However, the maximum temperature is notso reduced, and thus the non-uniformity of the temperature becomes more serious.This is because the activation overpotential becomes drastically larger where the celltemperature drops below 850 ◦C and accordingly the current density distribution
Figure 27: Mass density distribution of the catalyst inside the feed tube.
Figure 28: Temperature field in and around the cell for an average current densityof 4043A/m2 (2-750U20).
Figure 29: Effect of the gas inlet temperature on the electrolyte temperature dis-tribution.
becomes more noticeably non-uniform as shown in Fig. 30.Additionally, electricityconversion efficiency decreases by more than 5% compared to the Base case (seeTable 11) due to the increase in activation overpotential caused by the decrease intemperature.
Figure 30: Effect of the gas inlet temperature on the local current density dis-tribution.
Table 11: Calculation results for the Base case and the additional cases.
Case & Maximum AverageAverage current Terminal Output Efficiency temperature temperaturedensity voltage power (LHV) (electrolyte) (electrolyte)[A/m2] [V] [W] [%] [◦C] [◦C]
4.3.2 Effect of air flow rateThe temperature contours obtained for the average current density 3920A/m2 inCase 4-800U20 are shown in Fig. 31, and the electrolyte temperature distributionin the x-direction is shown in Fig. 32. Owing to the increased flow rate of air,the coolant, the cell temperature, especially the maximum, is fairly reduced incomparison with the Base case, and accordingly the temperature gradient is alsoreduced. Therefore, to increase the air flow rate is quite effective for flattening thecell temperature distribution, though often it should be adjusted so as to fulfil therequirements to optimize the performance of a topping or bottoming device.
4.3.3 Effect of density distribution of catalystThe temperature contours obtained for the average current density 3911A/m2 ofthe Case 2-800U02 are shown in Fig. 33. Since the amount of the catalyst inside thefeed tube is optimised, the maximum temperature becomes lower and a sharp fallof the cell temperature near the fuel inlet observed in the Base case is mitigated.
Figure 31: Temperature field in and around the cell for an average current densityof 3920A/m2 (4-800U20).
Figure 32: Effect of the air flow rate on the electrolyte temperature distribution.
Figure 33: Temperature field in and around the cell for an average current densityof 3911A/m2 (2-800U02).
The contours for the average current density 4051A/m2 of the Case 2-800L02are shown in Fig. 34. The thermal field becomes almost uniform in a large areaof the cell by arranging the catalyst density in a linear distribution rather than inthe uniform distribution. These effects of the density distribution of the catalyston the thermal field are seen more clearly in Fig. 35, which shows the electrolytetemperature distribution in the x-direction.
Figure 34: Temperature field in and around the cell for an average current densityof 4051A/m2 (2-800L02).
Figure 35: Effect of the catalyst distribution on the electrolyte temperature distri-bution.
Figure 36 shows the mole flow rate of methane inside the feed tube for the abovecases. As shown in this figure, the difference in the catalyst density distributiongreatly affects how the internal reforming takes place inside the feed tube, whichmeans how the heat generated by the electrochemical process is absorbed there.However, the total heat absorption rate inside the feed tube is not so changedaccompanying the change in the catalyst density distribution because reformingis almost 100% accomplished in all of the above cases. Therefore, the averageelectrolyte temperature scarcely decreases and accordingly the power generationperformance is little affected by the change of the catalyst density distribution(see Table 11).
5 Conclusions
This chapter has presented a numerical model for a single tubular SOFC including acase with accompanying indirect internal fuel reforming or for an IIR-T-SOFC. Themodel developed is useful to analyze not only its electricity generation performancebut also the details of the phenomena inside the cell.Avariety of phenomena such as
Figure 36: Effect of the catalyst distribution on the molar flow rate of methaneinside the feed tube.
heat and mass transfer, internal reforming, electrochemical reaction, heat generationand production of chemical species, and generation of electric field proceed insidethe cell in a three dimensional manner.All of them are taken into consideration in thedeveloped model but in a quasi-two dimensional way. All aspects of the numericalmodel and numerical procedures have been described in the first half of this chapter.
Some numerical results obtained by using the developed numerical model havebeen presented, first for a conventional type tubular SOFC and then for an IIR-T-SOFC. In the first part, it was demonstrated how the developed model worksin analyzing not only the fuel cell performance but also the details of the phe-nomena in and around the tubular cell. In the second part, how to reduce the celltemperature gradient has been discussed. The thermal field of the cell is largelydetermined by the balance of three fundamental phenomena: heat generation withthe electrochemical process, heat absorption with the internal reforming process,and heat removal by the air flow. In the electrochemical process, a kind of mutuallyenhancing interaction has been observed between the rise in cell temperature andincrease in electric current. It has been confirmed that increasing the air flow rateor decreasing the air utilization factor is effective to flatten the temperature distri-bution. It has been also demonstrated that changing the density distribution of thecatalyst inside the feed tube greatly affects how the reforming reaction takes placeand therefore how the cell is cooled.
Acknowledgements
This study has been carried out as one of the CREST projects titled “Micro GasTurbine and Solid Oxide Fuel Cell Hybrid Cycle for Distributed Energy System”under the support of the Japan Science and Technology Agency (JST). The authorswould like to extend their appreciation also to Dr. Peter Woodfield, Saga University,who gave us valuable discussions and critiques in finishing this chapter.
[1] Zhu, B., Advanced ceramic fuel cell R&D. Proc. 2nd Int. Conf. Fuel CellScience, Engineering and Technology, Rochester, pp. 409–417, 2004.
[2] Suzuki, K., Teshima, K. & Kim, J.-H., Solid oxide fuel cell and micro gasturbine hybrid cycle for a distributed energy generation system. Proc. 4thJSME-KSME Thermal Engineering Conference, 3, pp. 1–8, 2000.
[3] Suzuki, K., Iwai, H., Kim, J.-H., Li, P.-W. & Teshima, K., Keynote paper:solid oxide fuel cell and micro gas turbine hybrid cycle and related fluidflow and geat transfer. Proc. 12th International Heat Transfer Conference,Grenoble, pp. 403–414, 2002.
[4] Suzuki, K., Song, T.W. & Iwai, H., Micro gas turbine – solid oxide fuel cellhybrid system for distributed energy generation. Proc. Int. Symposium onDistributed Energy Systems in the 21st Century, Tokyo, 2002.
[5] Dicks, A.L., Advances in catalyst for internal reforming in high temperaturefuel cells. J. Power Sources, 71, pp. 111–122, 1998.
[6] Ahmed, K. & Foger, K., Kinetics of internal reforming of methane onNi/YSZ-based anodes for solid oxide fuel cells. Catalysis Today, 63, pp.479–487, 2000.
[7] Takeguchi, T., Kikuchi, R., Yano, T., Eguchi, K. & Murata, K., Effect of pre-cious metal addition to Ni-YSZ cermet on reforming of CH4 andelectrochemical activity as SOFC anode. Catalysis Today, 84, pp. 217–222,2003.
[8] Ahmed, S., McPheeters, C. & Kumar, R., Thermal-hydraulic model of amonolithic solid oxide fuel cell. Journal of Electrochemistry, 138(9),pp. 2712–2718, 1994.
[9] Nabielek, H., GT-SOFC coupling work at julich tesearch venter. Proc. Work-shop on Development of High Efficiency Gas Turbine/Fuel Cell HybridPower Generation System, pp. 111–138, 2004.
[10] Amaha, S., Baba, Y., Yakabe, H. & Sakurai, T., Improvement of the perfor-mance for the anode-supported SOFCs. Proc. of 2nd Int. Symposium on FuelCell Science, Engineering and Technology, Rochester, pp. 45–48, 2004.
[11] Dang, Z., Iwai, H. & Suzuki, K., Numerical modelling of a disk shape planarSOFC. Proc. of 2nd Int. Symposium on Fuel Cell Science, Engineering andTechnology, Rochester, pp. 361–368, 2004.
[12] George, R.A., Status of tubular SOFC field unit demonstrations. J. PowerSources, 86, pp. 134–139, 2000.
[13] Nishino, T., Komori, H., Iwai, H. & Suzuki, K., Development of a com-prehensive numerical model for analyzing a tubular-type indirect internalreforming SOFC. Proc. of the 1st Int. Conf. on Fuel Cell Science, Engineer-ing and Technology, eds R.K. Shah & S.G. Kandlikar, ASME: Rochester, pp.521–528, 2003.
[14] Nishino, T., Development and numerical prediction of a comprehensive ana-lytical model of an indirect–internal–reforming tubular SOFC. Master Thesisin Dept. Mechanical Engineering, Kyoto University, 2004.
[15] Suzuki, K., Li, P.W., Komori, H. & Nishino, T., Internal Report at HeatTransfer Laboratory. Kyoto University, HT2002-01-01, 2002.
[16] Li, P.-W. & Suzuki, K., Numerical model and performance study of a tubularoxide fuel cell. Journal of Electrochemistry, 151(4), A548–557.
[17] Aguiar, P., Chadwick, D. & Kershenbaum, L., Modelling of an indirectinternal reforming solid oxide fuel cell. Chemical Engineering Science, 57,pp. 1665–1677, 2002.
[18] Achenbach, E., Three-dimensional and time-dependent simulation of a pla-nar solid oxide fuel cell stack. J. Power Sources, 49, pp. 333–348, 1994.
[19] Bessette II, N.F., Wepfer, W.J. & Winnick, J., A mathematical model of asolid oxide fuel cell. J. Electrochem. Soc., 142(11), pp. 3792–3800, 1995.
[20] Ferguson, J.R., Fiard, J.M. & Herbin R., Three-dimensional numerical sim-ulation for various geometries of solid oxide fuel cells. J. Power Sources,58, pp. 109–122 , 1996.
[21] Bessette II, N.F. & Wepfer, W.J., Prediction of solid oxide fuel cell power sys-tem performance through multi-level modeling. Journal of Energy ResourcesTechnology, 117, pp. 307–317, 1995.
[22] Song, T.W., Kim, J.H., Ro, S.T. & Suzuki, K., Quasi-2D model of IIR-SOFCstack for SOFC/MGT hybrid system. Proc. ICOPE – 3, Kobe, 2003.
[23] Song, T.W., Sohn, J.L., Kim, J.H., Kim, T.S., Ro, S.T. & Suzuki, K., Para-metric studies for a performance analysis of a SOFC/MGT hybrid powersystem based on a quasi-2D model. Proc. ASME Turbo Expo 2004, 2004.
[24] Song, T.W., Sohn, J.L., Kim, J.H., Kim, T.S., Ro, S.T. & Suzuki, K., Detailedperformance analysis of a solid oxide fuel cell – micro gas turbine hybridpower system. ASME Heat Transfer/Fluid Engineering Summer Conference,North Carolina, 2004.
[25] Singhal, S.C.,Advances in solid oxide fuel cell technology. Solid State Ionics,135, pp. 305–313, 2000.
[26] Hatchwell, C., Sammes, N.M., Brown, I.W.M. & Kendall, K., Current col-lectors for a novel tubular design of solid oxide fuel cell. J. Power Sources,77, pp. 64–68, 1999.
[27] Mori, M. & Sammes, N.M., Sintering and thermal expansion characterizationof Al-doped and Co-doped lanthanum strontium chromites synthesized bythe Pechini method. Solid State Ionics, 146, pp. 301–312, 2002.
[28] Xu, J. & Froment, G.F., Methane steam reforming, methanation and water-gas shift: I. intrinsic kinetics. AIChE Journal, 35(1), pp. 88–96, 1989.
[29] Xu, J. & Froment, G.F., Methane steam reforming: II. Diffusional limitationsand reactor simulation. AIChE Journal, 35(1), pp. 97–103, 1989.
[30] Sonntag, R.E. & Van Wylen, G.J., Introduction of Thermodynamics, 3rd edn,John Wiley & Sons, 1991.
[31] Poling, B.E., Prausnitz, J.M. & O’connell, J.P., The Properties of Liquids &Gases, 5th edn, McGraw-Hill: New York, 2000.
[32] Wilke, C.R., Diffusional properties of multicomponent gases. ChemicalEngineering Progress, 46(2), pp. 95–104, 2000.
[33] Kim, J.W. et al., Polarization effects in intermediate temperature, anode-supported solid oxide fuel cells. Journal of the Electrochemical Society,146(1), pp. 69–78, 1999.
[34] Nagata, S., Momma, A., Kato, T. & Kasuga, Y., Numerical analysis of outputcharacteristics of tubular SOFC with internal reformer. J. Power Sources,101, pp. 60–71, 2001.
[35] Lehnert, W., Meusinger, J. & Thom, F., Modelling of gas transport phenom-ena in SOFC anodes. J. Power Sources, 87, pp. 57–63, 2000.
[36] Carbonell, R.G. & Whitaker, S., Heat and mass transfer in porous media.Fundamentals of Transport Phenomena in Porous Media, eds J. Bear &M.Y. Corapcioglu, Martinus Nijhoff Publishers: Dordrecht, pp. 123–198,1984.
[37] Muralidhar, K. & Suzuki, K., Analysis of flow and heat transfer in a rect-angular mesh using a non-Darcy thermally non-equilibrium model. Int. J.Heat Mass Transfer, 44, pp. 2493–2504, 2001.
[38] Vafai, K. & Tien, C.L., Boundary and inertia effects on flow and heat transferin porous media. Int. J. Heat Mass Transfer, 24, pp. 195–203, 1981.
[39] Patankar, S.V., Numerical Heat Transfer and Fluid Flow, Hemisphere Pub-lishing Corporation: Washington, 1980.
[42] Makino, T., Present research on thermal radiation properties and charac-teristics of materials. International Journal of Thermophysics, 11(2), pp.339–352, 1990.
[43] Li, P.W. & Suzuki, K., Numerical study of the performance of a tubular solidoxide fuel cell – effects of geometric parameters and thermal conditions.Proceedings of Symposium on 2000/2001 Achievement of CREST Projecton SOFC – MGT Hybrid System for a Distributed Energy Generation, pp.15–20, 2002.
[44] Dang, Z., Nishino, T., Iwai, H. & Suzuki, K., Progress on numerical simu-lation of heat and mass transfer within tubular and planar type solid oxidefuel cells. Proceedings of Symposium on 2002/2003 Achievement of CRESTProject on SOFC – MGT Hybrid System for a Distributed Energy Genera-tion, pp. 53–64, 2003.
[45] Hagiwara, A., Michibata, H., Kimura, A., Jaszcar, M.P., Tomlins, G.W. &Veyo, S.E., Proceedings of the 3rd International Fuel Cell Conference,p. 365, 1999.
[46] Suzuki, K., Kimijima, S., Dang, Z. & Iwai, H., Heat and mass transfer in atubular solid oxide fuel cell. 6th KSME-JSME Thermal and Fluid Engineer-ing Joint Conference, Jeju, CD-ROM, KJ04, 2005.
a coefficient in the discretized equationsA activation energy [J/mol]b source term in the discretized equationsCp specific heat at constant pressure [J/kg K]Djm mass diffusivity of species j in
multicomponent gas [m2/s]e emissivity [–]E electromotive force [V]E0 standard electromotive force [V]E substantial electromotive force defined
by eqn (42) [V]f inertia coefficient [–]F Faraday constant [C/mol]F11, F12, F21, F22 configuration factors [–]h thickness [m]i electric current density [A/m2]J radiosity [W/m2]kH2 , kCO, kO2 coefficients in eqns (12), (13) and (14) [A/m2]k+
sh, k−sh velocity constants of the water-gas
shift reaction [mol/m3Pa2s]K permeability [m2]Ksh equilibrium constant of the water-gas
shift reaction [–]M molecular weight [kg/mol]P pressure [Pa]q radiant flux [W/m2]q heat generation per unit area of the
electrolyte [W/m2]Q heat generation [W/m3]r radial coordinate [m]R resistivity [� m]Rst, Rsh reaction rates of the reforming reactions [mol/m3s]R0 universal gas constant [Pa m3/mol K]s mass generation per unit area of the
electrolyte [kg/m2s]Sj mass generation of species j [kg/m3s]S source term in the general transport equationT temperature [K]Ux, Ur velocity components [m/s]V electric potential [V]Wcat catalyst mass density [g/m3]x axial coordinate [m]Yj mass fraction of species j [–]
a anodec cathodecat catalyste electrolyteeff effectives solidst steam reforming reaction: eqn (1)sh water-gas shift reaction: eqn (2)1 cell tube side in the radiation model2 feed tube side in the radiation modelH2/O2 electrochemical reaction of hydrogen: eqn (6)CO/O2 electrochemical reaction of CO: eqn (7)e, w, n, s interfaces on a control volume shown in Fig. 6E, W , N , S grid points in a control volumes shown in Fig. 6u, u′, d , d ′ interfaces on a control volume shown in Fig. 7U , U ′, D, D′ grid points in a control volumes shown in Fig. 7P, P′ grid points on the intended control volumesPP′ electrolyte between the grid points P and P′
Greek symbols
� diffusivity in the general transport equation�G0 standard Gibbs free energy change [J/mol]�H enthalpy change [J/mol]�r control volume size for r direction [m]�x control volume size for x direction [m]�θ control volume size for θ direction [rad]δr distance between grid points for r direction [m]δx distance between grid points for x direction [m]δθ distance between grid points for θ direction [rad]ε porosity [–]η activation overpotential [V]θ circumferential coordinate [rad]λ thermal conductivity [W/m K]µ viscosity [Pa s]ρ density [kg/m3]ρ density in the general transport equationσ Stefan-Boltzmann constant [W/m2K4]φ variable in the general transport equation


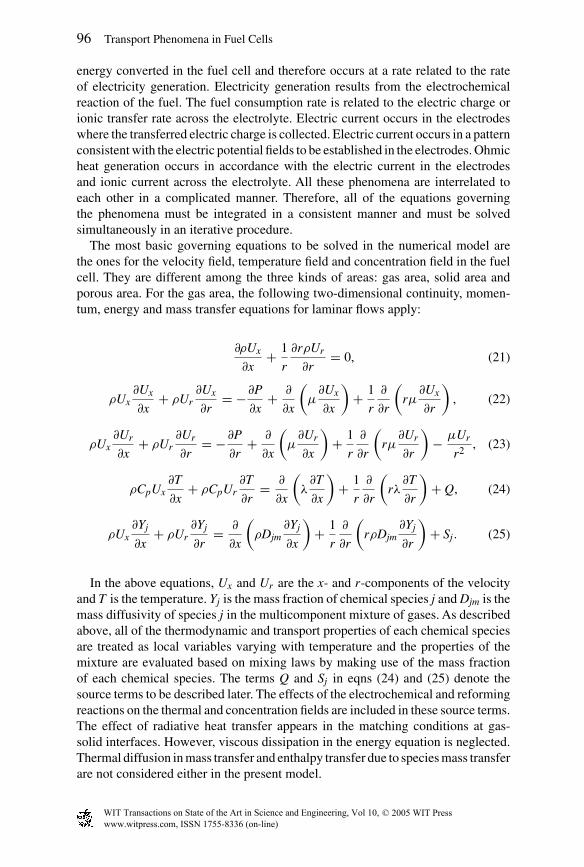


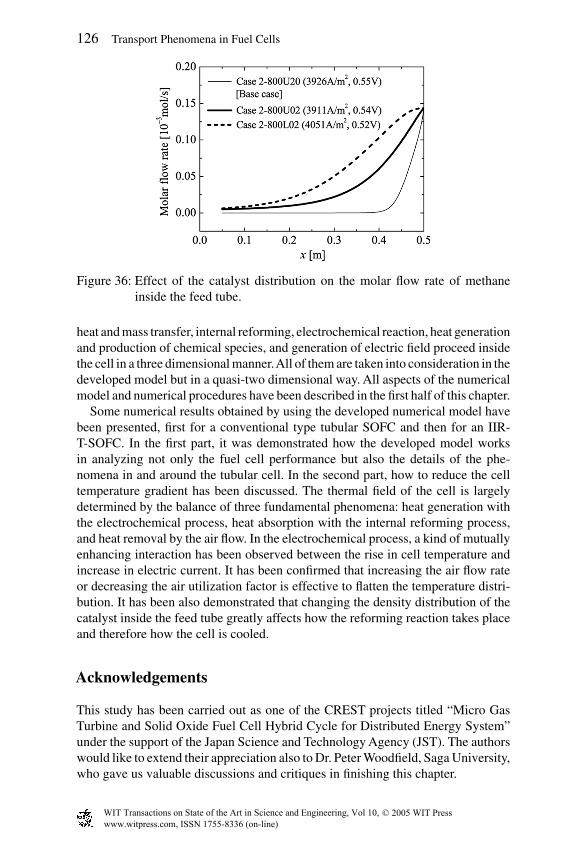


![Pageflex Server [document: D-Aalto-E144C5AE 00001]lib.tkk.fi/Diss/2011/isbn9789526044330/article4.pdf · 2011-12-12 · Thermo-hydrodynamics of boiling in a van der Waals fluid T.](https://static.documents.pub/doc/80x56/5ea483bb56ff086f1a271bb9/pageflex-server-document-d-aalto-e144c5ae-00001libtkkfidiss2011isbn9789526044330.jpg)


![Hybrid Thermo-Electrochemical In Situ Instrumentation for … · Rohit Bhagat[a] Current “state-of-the-art” monitoring and control techniques for cells during manufacture and](https://static.documents.pub/doc/80x56/5ff0723285a8de43e1718f1f/hybrid-thermo-electrochemical-in-situ-instrumentation-for-rohit-bhagata-current.jpg)


