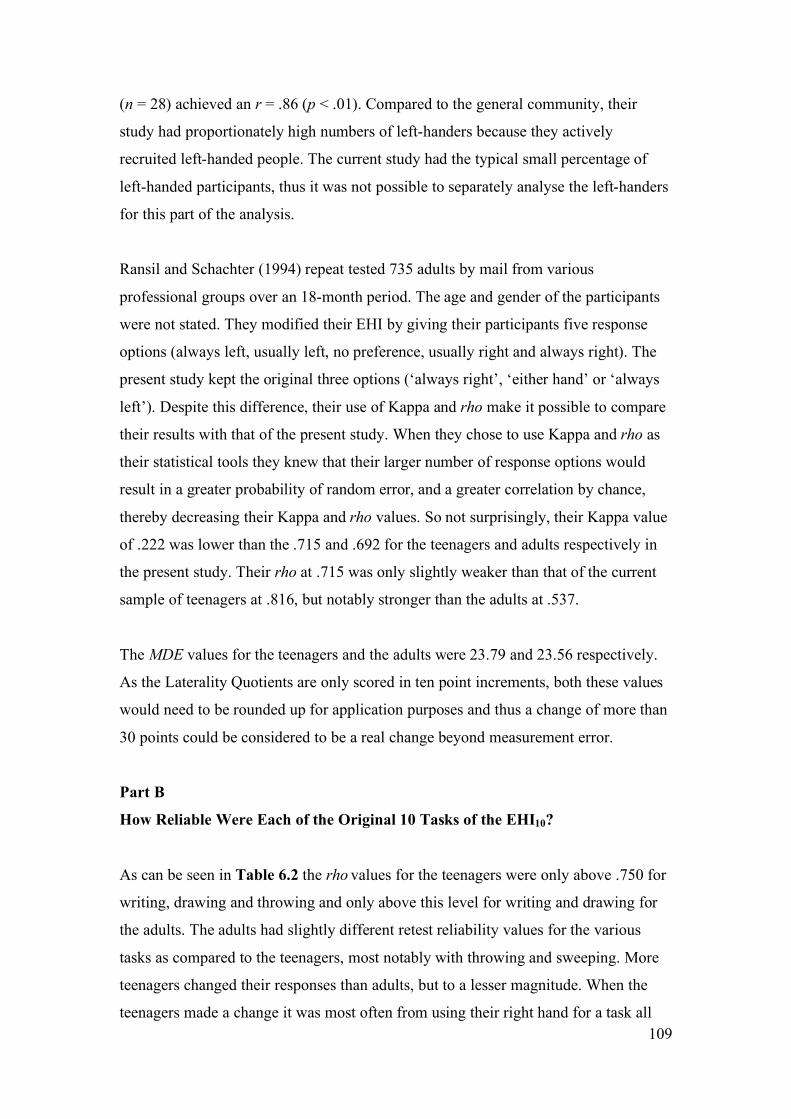
52 CHAPTER 3 GENDER DIFFERENCES Males and females are inherently different in many ways. In this chapter a brief examination of the anthropometric differences in their hands, and an in-depth examination of their neuro-muscular differences will be provided. These two aspects of gender differences are relevant to the performance of grip strength tests with Jamar TM and Jamar TM -like (JLD) handgrip dynamometers. The neuromuscular differences in dexterity, neural control of muscles, muscle anatomy, muscle architecture and perceived exertion levels will be given. Despite the documented differences in these areas, they do not provide a clear answer individually, in combination, or collectively, as to why males are stronger than females of comparable size. Also, they do not give an answer to the question of why there have been documented variations in reliability of maximal grip strength performances between the genders. There is presently a lack of studies involving the upper limb that have related forearm and hand neuro-muscular factors to maximal isometric grip strength. ANTHROPOMETRIC DIFFERENCES OF THE HAND BETWEEN THE GENDERS Once puberty commences, a significant gender difference in the size of male and female hands develops. Hand size naturally relates to grip strength: the longer the bones, the longer the muscles and hence the greater the number of contractile units (sarcomeres) that can be incorporated. Lengthening muscle by adding sarcomeres in series is typically associated with only increasing the speed of a muscle contraction and not its force. However, this relationship changes if the velocity of the contraction of a short muscle and a long muscle are maintained equally. In this case the additional sarcomeres in series allow each sarcomere to contract at a slower absolute contraction velocity, allowing it to generate greater force. Thus for any given shortening velocity, the muscle with longer fibres maintains higher force than the short muscle, especially as the velocity increases (Lieber, 2002). This relationship holds true, providing that
Transcript
52
CHAPTER 3
GENDER DIFFERENCES
Males and females are inherently different in many ways. In this chapter a brief
examination of the anthropometric differences in their hands, and an in-depth
examination of their neuro-muscular differences will be provided. These two aspects
of gender differences are relevant to the performance of grip strength tests with
JamarTM and JamarTM-like (JLD) handgrip dynamometers. The neuromuscular
differences in dexterity, neural control of muscles, muscle anatomy, muscle
architecture and perceived exertion levels will be given. Despite the documented
differences in these areas, they do not provide a clear answer individually, in
combination, or collectively, as to why males are stronger than females of comparable
size. Also, they do not give an answer to the question of why there have been
documented variations in reliability of maximal grip strength performances between
the genders. There is presently a lack of studies involving the upper limb that have
related forearm and hand neuro-muscular factors to maximal isometric grip strength.
ANTHROPOMETRIC DIFFERENCES OF THE HAND
BETWEEN THE GENDERS
Once puberty commences, a significant gender difference in the size of male and
female hands develops. Hand size naturally relates to grip strength: the longer the
bones, the longer the muscles and hence the greater the number of contractile units
(sarcomeres) that can be incorporated. Lengthening muscle by adding sarcomeres in
series is typically associated with only increasing the speed of a muscle contraction
and not its force. However, this relationship changes if the velocity of the contraction
of a short muscle and a long muscle are maintained equally. In this case the additional
sarcomeres in series allow each sarcomere to contract at a slower absolute contraction
velocity, allowing it to generate greater force. Thus for any given shortening velocity,
the muscle with longer fibres maintains higher force than the short muscle, especially
as the velocity increases (Lieber, 2002). This relationship holds true, providing that
53
other factors, such as muscle architecture, length of the moment arm and tendon
length proportions are kept unchanged.
There is consensus that the hand lengths of 13-year-old males and females are not
significantly different, but by the age of 17 males have significantly longer hands than
females (Pheasant, 1996). Kulaksiz and Gozil (2002) found that young adult males
have significantly longer hands (p < .001) in relation to their body height than
females, and these males have squarer shaped hands than age-matched females. From
the middle of the adolescent years onwards the hands of males are significantly wider
than those of females (Kulaksiz & Gozil, 2002; Pheasant, 1996). A detailed analysis
of hand dimensions is given in Chapter 7, Part 1a. There is a positive correlation
between hand surface area and grip strength which is examined in Chapter 7, Part 3.
GENDER AND DEXTERITY
If the greater muscular strengths of males were due to a more efficient motor control
system, it would be expected that men would also possess greater dexterity than
women. Only studies involving adult participants were located. MacDermid, Fehr and
Lindsay (2002) found that gender was “inconsistently related to dexterity times, but
women tended to be faster than men” (p. 115).
GENDER DIFFERENCES IN MUSCLES THAT RELATE TO
GRIP STRENGTH
The literature has consistently found that on average males are stronger than females
(MacDermid et al., 2002; Massey-Westropp et al., 2004; Mathiowetz, Wiemer &
Federman, 1986). It is generally thought that this is because males have greater
muscle bulk. Due to a larger amount of contractile tissue, greater muscle bulk results
in greater strength, providing that the architecture of the muscle fibres within the
muscles being compared is similar (Lieber, 2002). However, the study of Aghazadeh,
Lee and Waikar (1993) found that in a sample of 33 females and 59 males, aged
between 18 and 71 years, when the fat free cross sectional area (FFCSA) of the
54
forearm muscles was taken into account it “alone could not explain the differences in
the grip strengths of males and females” (p. 80).
The strength of a muscle can be expressed in kilograms per unit of cross-sectional
area, creating a ratio that corrects for differences in CSA. In relation to grip strength,
the magnitude of the difference between the genders, for this ratio has been
determined by Padmavathi, Bharathi & Vaz, 1999. They found a significant
difference of about 22% between the males and females in the ratio of the maximum
voluntary isometric grip strength to forearm muscle area (kg/cm2). Ages of the 70
males and 53 females ranged from 17 to 30 years old. Thus an examination of the
gender differences in skeletal muscle structure and function during the adolescent
years may help explain the grip strength and the reliability of the grip strength
differences consistently seen between the genders in the literature. To consider the
skeletal muscle function, it is appropriate to review the neural mechanisms controlling
it, namely the motor units.
Motor unit physiology
The motor unit (MU) consists of a single alpha-motor neuron and the colony of
muscle fibres it innervates. The cell bodies of the alpha-motor neurons reside in the
ventral horn of the spinal cord. The strength of a voluntary or reflex contraction
depends on the number of participating motor units (McComas, 1998). All muscle
fibres (cells) within a MU are of the same type in mature mammals though there can
be a large range in their lengths. For example, in 1991 Ounjian et al. (as cited in
Lieber, 2002) found that muscle fibres within a MU can range from 8 mm to 50 mm
in the cat tibilias anterior. The muscles themselves consist of a heterogeneous group
of muscle fibres, with properties varying from fast twitch (i.e., fast contracting) to
slow twitch, and from fatigue resistant to fatigue sensitive types. Although muscle
fibres can be classified into 8 different types based on histo-chemical techniques,
more than 95% of muscle fibres belong to only three types, namely fast oxidative
glycolytic (FOG) also called type 2A or IIA, fast glycolytic (FG) also called type 2B
or IIB and slow oxidative (SO) also called type I (Lieber, 2002). These three types of
muscle fibres relate to three types of MUs. McComas (1998) has presented a review
of studies indicating that the above sharply divided categories of motor unit types
55
might not be so applicable to humans, who may have types reflecting more of a
continuum of properties. Although all muscle fibres within a MU are of the same
type, they can still exhibit a range of oxidative capabilities, based on a study of cat
tibialis anterior muscle by Martin, Bodin-Fowler, Roy, Eldred and Edgerton (1988).
The proportions of these fibre types in a given muscle appear to be set early in
embryogenesis, based on avian myoblast studies conducted in 1986 (Miller &
Stockdale, 1986). Also during embryogenesis each individual motor neuron appears
to innervate selectively only those muscle fibres that are of the same type (Miller &
Stockdale, 1987).
Muscle fibre type proportions in humans is varied, with about a quarter of fair-
skinned north American men and women having either less than 35% or more than
65% of slow twitch type I fibres in their vastus lateralis muscle. It appears that about
40% of the phenotype variance is influenced by environmental factors (such as levels
of muscular contractile activity), and a further 45% is associated with hereditary
factors. These estimates suggest that a difference of about 30% or less in type I fibres
among individuals could be explained exclusively by differences in the levels of
muscular contractile activity (Simoneau & Bouchard, 1995). Hormonal influences on
these proportions will be discussed later in this chapter.
Force generation and motor units
A review of McComas in 1998 noted that a typical muscle within the thenar eminence
group in the human hand has about 70 to 100 motor units. Some large muscles such as
the biceps may also have 100 motor units, but can obviously generate much greater
forces than the thenar muscles. Thus the number of motor units is important in force
generation, but so are many other aspects of our musculoskeletal architecture.
However with regard to motor units, McComas (1998) stated that there appeared to be
a genetic basis for the range of motor units per muscle, as individuals with
comparatively large numbers of motor units in one muscle also had large numbers in
other muscles.
56
There are two strategies used to generate increasing force by a muscle. The first is
rate coding, whereby motor units are stimulated with increasing frequency so that the
tension developed by each resultant muscle twitch is superimposed onto the next
muscle twitch while the tension is still lingering from the first twitch (Jones & Round,
1990).
The second strategy to increase muscle force is to recruit more motor units. This is
based on a pattern called the Henneman’s size principle that states that small motor
units are utilized when the muscle is required to generate small forces, and
progressively larger motor units are activated concomitantly with the need to generate
larger muscle forces (Jones & Round, 1990). This in turn appears to relate to the
larger motor units having motor neurons with higher excitation thresholds. The small
motor units are typically those involving fatigue resistant slow twitch muscle fibres,
namely the slow oxidative type I fibres. The large MUs typically incorporate rapidly
fatiguing, fast twitch muscle fibres namely the fast glycolytic type IIB fibres (Lieber,
2002).
Concerning the above two strategies, which strategy is used is partially dependent on
proprioceptive feedback from the musculo-tendinous unit in question. Little research
work appears to have been done with forearm muscle behaviour. However, a recent
lower limb study by Pasquet, Carpentier and Duchateau (2005) examined how both
MU recruitment and the discharge rate of individual MUs were influenced by changes
in tibialis anterior fascicular length at various intensities of isometric strength. They
demonstrated in 8 humans that by changing the degree of ankle dorsi-flexion and
plantar-flexion, and thus the fascicular length, both motor unit recruitment and
discharge rate were altered. When the ankle angle was moved from 10 degrees of
plantar-flexion to 10 degrees of dorsi-flexion, the torque produced during maximal
voluntary contraction (MVC) was significantly reduced and the average surface EMG
increased. The latter increase was associated with the motor units being activated at
lower recruitment thresholds with short, compared with long muscle fascicle length,
either when expressed in absolute values measured in Nm or in percentage terms
relative to their respective MVC. Increased rate coding was mainly present at low
torque levels (<10% MVC), when the muscle-tendon complex was compliant
(relatively relaxed), whereas recruitment of additional motor units played a dominant
57
role at higher torque levels with decreased compliance (10-35% MVC). Thus the
amount of stretch applied to a muscle influenced which strategy was used.
Interestingly, changes in discharge rate due to changes in fascicular length may not be
consistently applied to all the MUs in a muscle. Christova, Kossev and Radicheva
(1998) studied 138 superficial and deep MUs in the biceps brachii of five healthy
subjects during isometric contractions at three different elbow angles. Changes in the
elbow angle resulted in changes in the fascicular length. They noted that when the
fascicular length was shortened, only about 50% of the MUs increased their discharge
rate at a given torque compared to the rates observed at two other longer fascicular
lengths. The remaining MUs either lowered, or did not alter their rates. It is possible
that gender differences exist in the systems influencing MU recruitment and discharge
rate, but no research is available which has compared the genders.
Gender differences in motor units
There are gender-related differences in strategies used for force generation. When a
muscle contracts the resultant electrical signal can be collected by EMG and studied
by statistical methods such as power spectral analysis. Cioni, Giannini, Paradiso,
Battistini, Navona & Starita (1994) studied the EMG activity of the tibialis anterior
muscle of 15 men and 15 women. The median frequency of the power spectrum
(MedPF) increased in both genders with increasing torque developed by the muscle,
but women exhibited a slower increase in torque than men. Cioni et al. suggested
from this result and other factors, that the recruitment of new motor units takes
precedence over rate coding in women at low torque levels during voluntary muscle
contractions.
Motor unit activation reflects the proportion of motor units that are stimulated by a
maximum voluntary contraction compared to the total number available. In relation to
motor units of the elbow flexors (biceps brachii) and knee extensors (vastus medialis),
Miller, MacDougall, Tarnopolsky and Sale (1993) found that there were no
significant differences between the genders in terms of the number of motor units, the
size of the motor units (i.e. the number of muscle fibres per motor unit) and the motor
unit activation for these muscles. As these two muscles were disparate, it is possible
that these findings are relevant to all other peripheral skeletal muscles. These findings
58
indicate that men do not have a physiological advantage with their ability to
maximally activate their motor units, as confirmed by Belanger and McComas (1981).
GENDER DIFFERENCES AND MUSCLE FIBRES
Following discussion of gender differences in the neural control of muscles, the next
section considers gender differences in the muscles themselves.
Muscle fibre numbers
The number of muscle fibres a person possesses appears to be set by about the age of
2 years, when the transformation of some of the type 2 fibres to type 1 is completed
(Oertel 1988). The consistent number of muscle fibres in later years has been
supported by several studies comparing bodybuilders with controls. MacDougall,
Sale, Always and Sutton (1984) found that 5 elite body builders, 7 intermediate body
builders and 13 age-matched controls had numbers of muscle fibres that did not
correlate with biceps brachii strength. They concluded that heavy resistance training
did not increase muscle fibre numbers, although it did increase muscle cross-sectional
size. When comparing males and females Miller et al. (1993) concluded that the
greater strength of males was due to larger fibre sizes, not greater numbers of fibres.
The smaller muscle fibre sizes of women have also been used to help explain various
EMG findings. Cioni et al. (1994) found that the median frequency of the power
spectrum (MedPF) from EMG readings of the tibialis anterior muscle increased in
both genders with increasing torque developed by the muscle. However, women
displayed significantly lower MedPF values for any given percentage of their
maximum voluntary contraction as compared to men. This was said to be consistent
with women having less larger sized muscle fibres as found by Henriksson-Larsén
(1985). Ryushi, Hakkinen, Kauhanen and Komi (1988) also noted that women had
smaller fibre sizes for each of the three muscle fibre types studied compared to males.
Bilodeau, Arsenault, Gravel and Bourbonnais (1992) also found that EMG power
spectrum readings (in particular median frequency and mean power frequency) were
also significantly lower in women as compared to men when the muscles were being
59
exerted in the range of 10 to 80% of the maximal voluntary contraction of the triceps,
biceps and anconeus muscles. Skin fold thickness and fibre type characteristics were
theorized as the reasons for the gender differences. Thus the findings from these
various muscles may well apply to many other skeletal muscles in the two genders.
Gender differences in relation to hypertrophy training
Bell and Jacobs (1990) found that during training designed to increase muscle size,
males increased their fast twitch muscle fibre area over and above that of the slow
twitch fibre area, whereas women increased both proportionately.
Gender differences in electro-mechanical response times
A gender difference in the strength of elbow flexors is partially due to differences in
electro-mechanical response times (Bell & Jacobs, 1986). These response times refer
to the delay between the arrival of a stimulus to a research participant, for example a
visual stimulus upon which the participant is expected to flex a certain muscle, and
the resultant change in the EMG reading; and the delay between the change in the
EMG reading and the actual development of force. The former delay has been named
the pre-motor time (PMT) and the latter named the electro-mechanical delay (EMD).
In a study by Bell and Jacobs (1986) 46 males and 40 females did not significantly
differ in their PMT but the males had shorter EMD times. Bell and Jacobs stated that
it was possible that the EMD difference between the genders was simply a function of
their different strengths. However, it was also postulated that it was due to inherent
differences in the series elastic component within the muscle tissue. This in turn
would have influenced the rate of force generation. It was possible that the EMD
related to lateral force generation and therefore could help explain not only longer
times to generate force, but also total force produced.
Gender differences in the relationship between muscle cross-sectional area
(CSA) and force generation
The maximum force that a muscle produces depends in part on its maximum CSA.
60
Maughan and Nimmo (1984) found a correlation of r = .70 (p < .01) between the
maximum voluntary isometric strength of knee extensors and their CSA in 15 healthy,
young, adult, male volunteers. Strength per muscle CSA increases with age in boys
from 7 to 18 years, but not necessarily in direct proportion (Kanehisa, Ikegawa,
Tsunoda & Fukunaga, 1995). Data from 130 boys indicated that the ratio of isokinetic
strength to CSA in their elbow flexors increased during these years. The proposed
reason was that the children were maturing in their ability to activate these muscles
voluntarily.
Other factors have been found that affect this relationship during these growing years.
In a study by Ramsay, Blimkie, Smith, Garner, MacDougall and Sale (1990),
prepubertal boys increased their isometric and isokinetic strength during resistance
training without corresponding increases in their muscle CSA, as determined by
computerized axial tomography (CAT) scans. Their suggested explanations for these
strength gains included increases in percentage motor unit activation, improved motor
unit co-ordination within muscles, increased co-ordination between muscles and
increased firing frequencies. The boys also demonstrated significant increases in
evoked twitch torque, which is a method used for measuring the intrinsic force
producing capacity of muscles, in this case the elbow flexors and knee extensors.
According to Ramsay et al. the most likely explanations for these increases, were
various improvements in the excitation-coupling within the myofibrils. Their other
suggestions included myofibril packing density increases, and muscle compliance. It
is possible that these explanations for differences in strength in the absence of
differences in CSA, may also help explain the differences between the genders.
Ryushi et al. (1988) noted that nine physically active men had nearly twice the
isometric force production per unit of cross-sectional area in their leg extensors than
ten physically active women. In contrast to this Ichinose, Kanehisa, Ito, Kawakami
and Fukunaga (1998) noted that there were no significant gender differences in the
relationship between isokinetic force measured at two velocities and CSA in the
triceps brachii of their Japanese Olympic athletes.
61
Gender and muscle fibre type proportions
Gender differences in the proportions of the different muscle fibre types have been
found to exist. From autopsies, Henriksson-Larsén (1985) noted that in the tibialis
anterior muscle, the females had significantly smaller cross sectional areas of type 1
and type 2 fibres than the males. However Henriksson-Larsén also noted that the
relative number of type 2 fibres was not different between the genders. Another
gender difference was that females had 25% less of their muscle cross-sectional area
occupied by muscles fibres than males, and that females had a greater concentration
of type 2 fibres in the anterior surface of the muscle as compared to the males. The
earlier described study by Cioni et al. (1994) considered that the lower mean root
mean square (RMS) values of the EMG in females could be explained by these
anatomical differences.
Differences in the proportions of the muscle fibre types appear to partially relate to
hormonal factors. Post-mortems of the deltoid and vastus lateralis muscles of humans
aged from 1 week old to 20 years old revealed that before the age of 15 years (and
thus presumably the full effects of puberty), there are no gender differences in the
diameters of type 1 and 2 muscle fibres (Oertel, 1988). Also both genders had the
percentage of type I fibres in the deltoid increase from approximately 48% at less than
6 months of age to 62% at the age of two years. These proportions then remained
constant until around the ages of 10 to 15 years. Oertel (1988) found that type 2 fibres
tended to be smaller than type 1 until the age of 15. Then for the males, from ages 15
to 20, the type 2 fibres became thicker than the type 1 fibres, whereas for the females
of that age, type 2 fibres tended to be of a smaller diameter than type 1 fibres.
Administration of testosterone to healthy young men increased their myofibril protein
synthesis (Ferrando, Tipton & Doyle, 1998, as cited in Wolfe, Ferrando, Sheffield-
Moore and Urban, 2000). The experiment was repeated with elderly men and the
same result was achieved (Urban, Bodenburg & Gilksion, 1995, as cited in Wolfe et
al., 2000). The elderly men significantly increased their strength without increasing
their muscle mass. This finding led to the speculation that increased protein synthesis
per se can result in increased strength (Wolf, et al., 2000). Again, this may help to
62
explain the gender differences that occur despite similar muscle CSAs.
A longitudinal study of plasma testosterone and elbow flexor isometric strength in 50
boys and 50 girls from the ages of 8 to 17 years demonstrated that increases in
testosterone in the boys coincided with the divergence in strength between the boys
and the girls (Round, Jones, Honour & Nevill, 1999). It was theorized that
testosterone was responsible for the selective increase in size of the bony upper girdle
compared to the lower girdle. The data showed quantitative and qualitative
differences between the genders in the pattern of growth of the upper arm, suggesting
that the proportionately longer humeri of males were partially responsible for the
strength differences. Despite such seemingly strong evidence, there were findings that
conflicted with the above results in regard to the link between testosterone and muscle
Over the last five decades, various designs for isometric strain gauges have been
proposed and these were discussed in Chapter 2, Part 4 (the history of grip strength
assessment tools). In that section it was established that the JamarTM1 or JamarTM-like
dynamometers (JLD) have become commonly used handgrip dynamometers in
clinical and research settings. The American Society of Hand Therapists (1992) and
the American Medical Association (American Medical Association, 1993;
Cocchiarella & Andersson, 2000) recommended the use of JLD to assess grip
strength. For ease of comparison between studies and the previously described
reasons, the discussion in this chapter is limited to an examination of grip strength
research that has used JLD, to determine whether hand dominance has an effect on the
grip strength performance of the left and right hands.
JLD have been described in Chapter 2, Part 4. From 1954 to 2005, many studies were
published that advanced normative data using these types of dynamometers. The
largest and most cited of these are considered here. For the estimation of the loss of
grip strength after an injury, the American Society of Hand Therapists (1992)
recommend comparison of grip strength scores with the contralateral hand, or
longitudinal comparison with earlier values from the patient. The Guides to the
1 J.A. Preston Corporation, 60 Page Road, Clifton, New Jersey 07102.
70
Evaluation of Permanent Impairment (Cocchiarella & Anderson, 2000) also
recommend direct comparisons with the uninjured contralateral hand for unilateral
injuries, or data base comparisons for bilateral injuries. This topic has been expanded
in Chapter 2, Part 3.
The concept that no significant difference exists between the grip strengths of the left
and right hands for all persons has been challenged by several studies. Among right-
hand dominant people (dextralists) and left-hand dominant people (sinistralists), a
wide range of grip strength differences can exist between the dominant and the non-
dominant hand (Balogun & Onigbinde, 1992; Bechtol, 1954). Studies such as that of
Crosby and Wehbé (1994), found that left-handed adults had a grip strength ratio
(expressed as a percentage difference) of up to 40% between their two healthy hands.
Many studies have concurred that the right hand is commonly the strongest hand by
approximately 10%. The left hand of sinistralists is not often stronger than their right
hand, but it is commonly equal in strength to the right hand. Incel, Ceceli, Durukan,
Erdem and Yorgancioglu (2002) found that for adults, the right hand was on average
8.2% stronger than the left hand in dextralists, but for sinistralists the left hand was on
average only 3.2% stronger. This general trend has also been found to apply to
school-aged children (Häger-Ross & Rösblad, 2002). To be able to examine the effect
of handedness on the grip strength ratio of the two hands, the dominant hand must
first be clearly and consistently identified with the aid of highly reliable and valid
handedness assessment tools.
DEFINING HANDEDNESS
Handedness can be viewed from three different aspects: (a) the relative preference for
one hand in the execution of various unimanual tasks (Annett, 1970a, 1970b; Brown,
Roy, Rohr, Snider & Bryden, 2004; Peters, 1998); (b) the greater skillfulness or
proficiency of one hand in the performance of these tasks (Annett, 1970a; Peters,
1998; Triggs, Calvanio, Levine, Heaton & Heilman, 2000); or (c) the greater strength
of one hand (Bowman & Katz, 1984; Chau, Petry, Bourgkard, Huguenin, Remy &
Andre, 1997). Thus depending on the specific definition, the dominant hand may not
71
always be the preferred hand for performing certain tasks such as writing, or be the
most skilful or dexterous hand (Brown et al., 2004; Mathiowetz et al., 1986); or be the
strongest hand (Crosby & Wehbé, 1994; Hanten et al., 1999; Provins, Milner & Kerr,
1982; Zverev & Kamadyaapa, 2001). Also the dominant hand is not necessarily the
steadiest hand (Simon, 1964).
When handedness is viewed as a combination of all these dimensions, the concept can
be seen as multi-dimensional. It could be argued that if handedness is considered in
this manner, the dimensions of handedness need to be studied separately, because a
weak dextralist in one dimension could be a strong sinistralist in another. For
example, it is well-documented that there are older adults who, when they were
children, were forced to learn to write with their right hand, but have always preferred
to execute most other fine motor tasks with their left hand. Chronic pain in the
dominant hand may force a person to use their non-dominant hand for resistive tasks,
such as opening jars. The author has heard reports from adults who recalled being
unable to use their dominant hand due to prolonged immobilization from an injury
during the critical phase of learning to write when they were children, and so taught
themselves to write with their non-dominant hand. Such exceptions to any rule will
always need consideration.
Handedness, defined as the hand preferred for performing certain unimanual tasks, is
a common way of defining hand dominance. However, the number and nature of the
tasks in any handedness inventory designed to determine a global handedness
preference with high validity and reliability is central to any definition (Provins et al.,
1982). Many researchers have found that as a general trend hand preference
distribution in humans is J shaped, wherein the majority of people can be classified as
preferring to use their right hand for various common tasks and the minority as
preferring to use their left hand. This differentiation is fully established in right-
handed children between 5 and 7 years of age and in left-handed children by 9 years
of age (Mandell, Nelson & Cermak, 1984). More recently, real-time ultrasound
research has shown that this process of differentiation begins in utero (see Figure
4.1), with the right hand being preferentially sucked from 15 weeks of gestation in
children who at the age of 10-12 years were dextralist; the converse was weakly
72
correlated for the fifteen 10 to 12 year old sinistralists in the study (Hepper, Wells &
Lynch, 2005).
If it is accepted that handedness preferences lie along a continuum from people who
are consistently left-handed for all one-handed tasks, to people who are consistently
right-handed for these same tasks (Annett, 1970a; Hardyck & Petrinovich, 1977) the
terms ‘degrees of laterality’, or synonymously ‘degrees of handedness’ can be used.
Within this linear continuum, are mixed-handed people who prefer to do some tasks
with one hand and other tasks with the other hand; such people are not uncommon
(Annett, 1970a). In contrast, Annett considers that ambidexterity, in the sense of equal
preference for both hands when performing skilled actions such as writing, is rare.
Figure 4.1. Child at 14 weeks gestation sucking thumb. This image was taken by a sonographer who was able to view the sucking motions of the baby on the ultrasound monitor. This picture is a side profile of the head, nose pointing upward and thumb in mouth, as indicated by the white arrow.
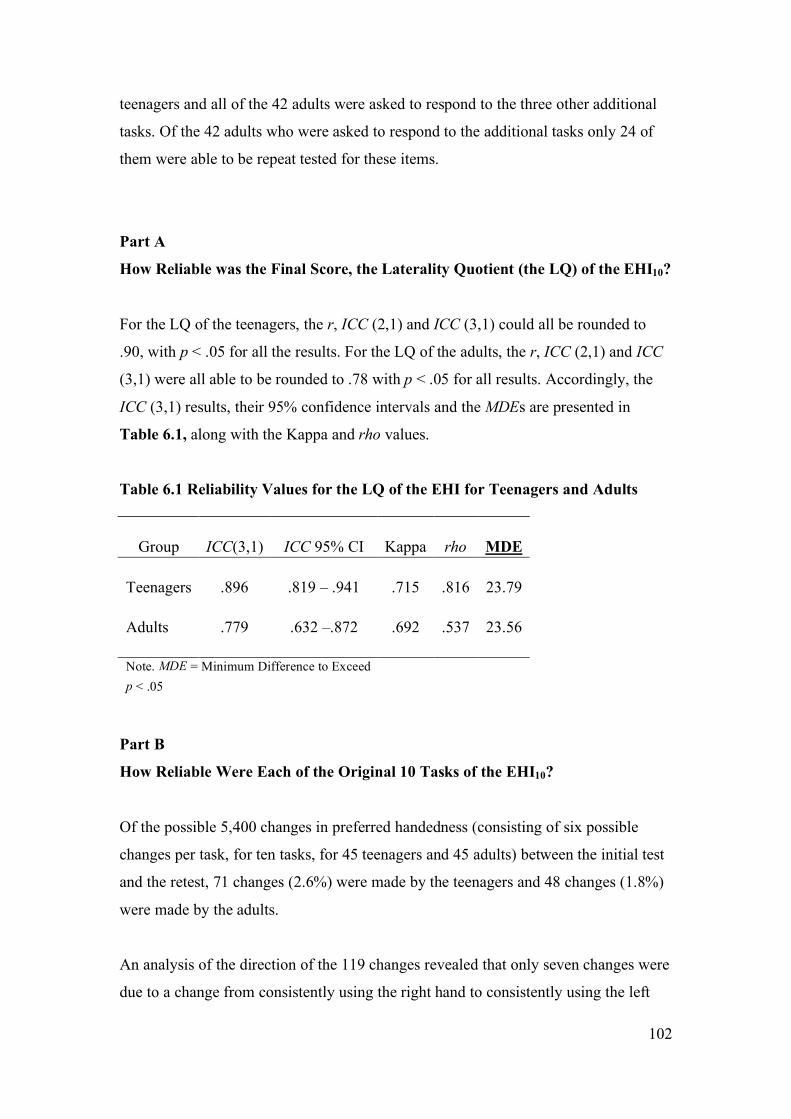
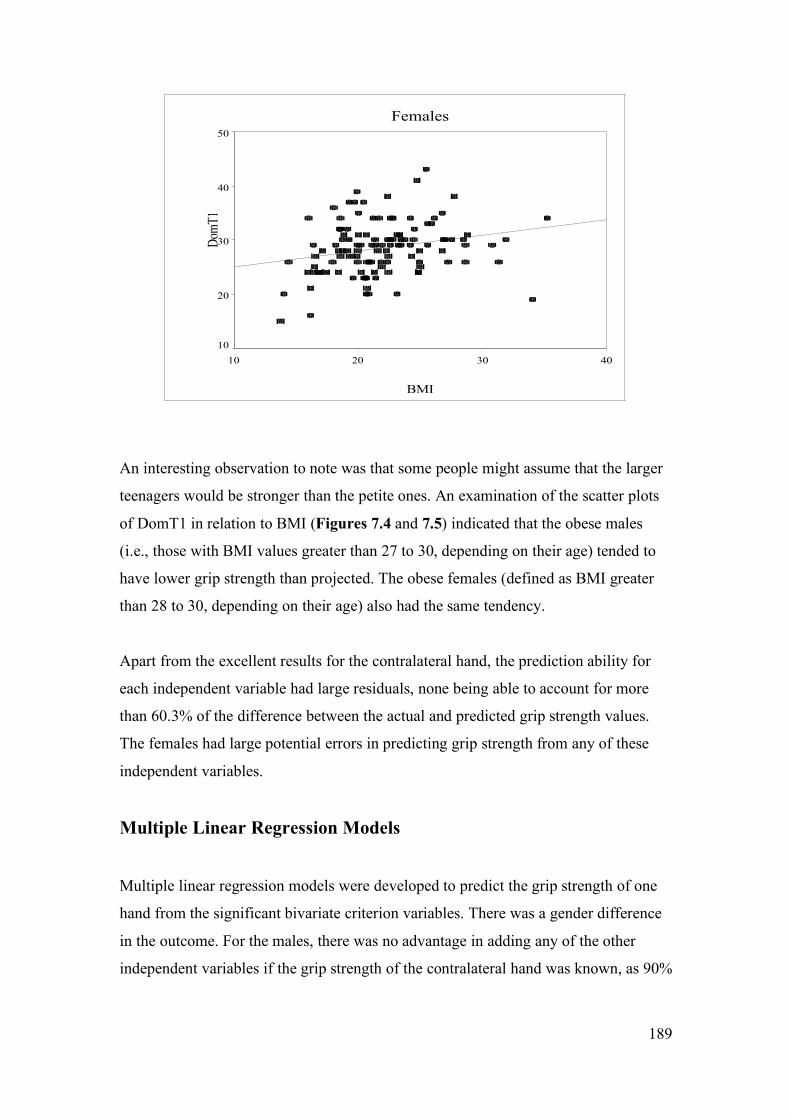
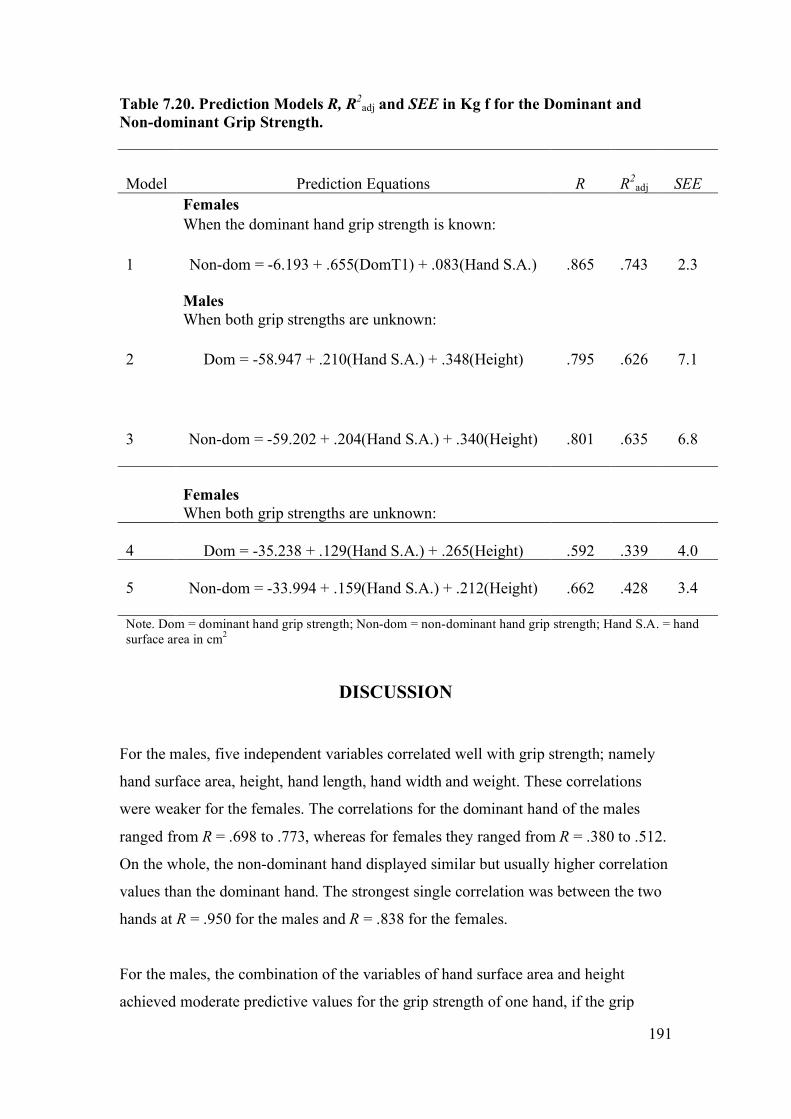
HANDEDNESS & GRIP STRENGTH RESEARCH Many grip strength researchers have classified their research participants as either
*Indicates a significant difference between gender groups of the same age. !Indicates a significant difference between age groups of the same gender.
126
Table 7.2. Number (%) of Students That Where Over-Weight and Obese
Group
Overweight (%)
Obese (%) 13 y.o. males
14 (20.8)
1 (1.5)
13 y.o. females
13 (24.5)
3 (5.6)*
17 y.o. males
7 (12.9)
1 (1.9)*
17 y.o. females
13 (20.6)
2 (3.2)*
Note. Based on the BMI criteria of Cole et al. (2000). *One teenager from each of the groups in Table 7.6 was considered to be an outlier in the population comparison, but has been left in this present tally.
HAND DIMENSIONS
Hand measurements were unable to be obtained for five of the 13-year-old students.
Hand length
See Table 7.3 for hand length results. There was no significant difference between the
hand lengths of the 13-year-old males and the 13-year-old females
(t = 1.261, p = .210). The 17-year-old females had hand lengths that were not
significantly longer than the 13-year-old females (t = 0.467, p = .642). The 17-year-
old males had hands that were significantly longer than the next longest group, the 13-
year-old males (t = 9.121, p < .001, eta square = .418), although the strength of this
difference (at 41.8% of the hand length accounted for by the age of the males) was
weaker than the difference in height, which was 62.7%.
Hand width
See Table 7.3 for hand width results. The hands of the 13-year-old males were
significantly wider than those of the 13-year-old females (t = 3.787, p < .001, eta
square = .113) and the 17-year-old females (t = 5.620, p < .001, eta square = .202).
There was a significant difference between the widths of the 13-year-old males and
the 17-year-old males (t = 6.247, p < .001, eta square = .252). There was no
127
significant difference in widths between the 13-year-old females and the 17-year-old
females (t = 0.698, p = .093).
Surface area of the hands
See Table 7.3 for hand surface area results. There was no significant difference in the
surface area of the hands of the 13-year-old males and the 13-year-old females,
even though the hands of the males were significantly wider. There was no significant
difference in the surface area of the hands of the 13-year-old females and the 17-year-
old females (t = 0.765, p = .446). There was a significant increase in the surface area
of the hand between the 13 and 17-year-old males (t = 8.246, p < .001, eta square =
.370). There was 37.0% of the variance in the surface area of the hands of the males
that was accounted for by their age. There was a significant and even stronger
difference between the surface areas of the hands of the 17-year-old males and the 17-
year-old females (t = 15.357, p < .001, eta square = .672).
Table 7.3. Means of Hand Length in cm, Hand Width in cm, Hand Surface Area in cm2 and Hand Length/Body Height Ratio for all Groups Group
n
Hand Length
(SD)
Hand Width
(SD)
Hand Surface
Area (SD)
Hand Length /Body Height
(SD)
13 y.o. males
64
17.7 (1.3)!
9.8 (0.7)*!
174.1 (23.4)!
0.111 (0.004)
13 y.o. females
51 17.5 (0.9)
9.4 (0.5)*
164.3 (14.3)
0.110 (0.004)!
17 y.o. males
54 19.5 (0.9)*!
10.5 (0.5)*!
205.6 (17.3)*!
0.110 (0.004)*
17 y.o. females
62 17.6 (0.9)*
9.2 (0.4)*
162.4 (12.3)*
0.108 (0.004)*!
*Indicates a significant difference between gender groups of the same age at p = < .001. !Indicates a significant difference between age groups of the same gender.
128
THE RELATIONSHIP OF HAND DIMENSIONS WITH OTHER
VARIABLES
Hand length versus body height
Hand length and body height were linearly related for all groups. For the 13-year-old
males r = .883, adjusted R2 = .777; 13-year-old females r = .642, adjusted R2 = .400;
17-year-old males r = .646, adjusted R2 = .406; and 17-year-old females r = .638,
adjusted R2 = .397. Thus 77.7%, 40.0%, 40.6% and 39.7% of the variance in hand
length was accounted for by body height in these four groups respectively, the most
notable group being the 13-year-old males.
Hand length/body height ratio
The hand length/body height ratio was created by dividing each participant’s hand
length by their body height, as done previously (Kulaksiz & Gozil, 2002), see Table
7.3. The only group that was significantly different to the others was the 17-year-old
females, who had slightly but significantly shorter hands in relation to their body
heights.
Hand width versus hand length
Hand widths were most strongly correlated with hand lengths for the 13-year-old
males. The other three groups had weaker but significant correlations, see Table 7.4.
129
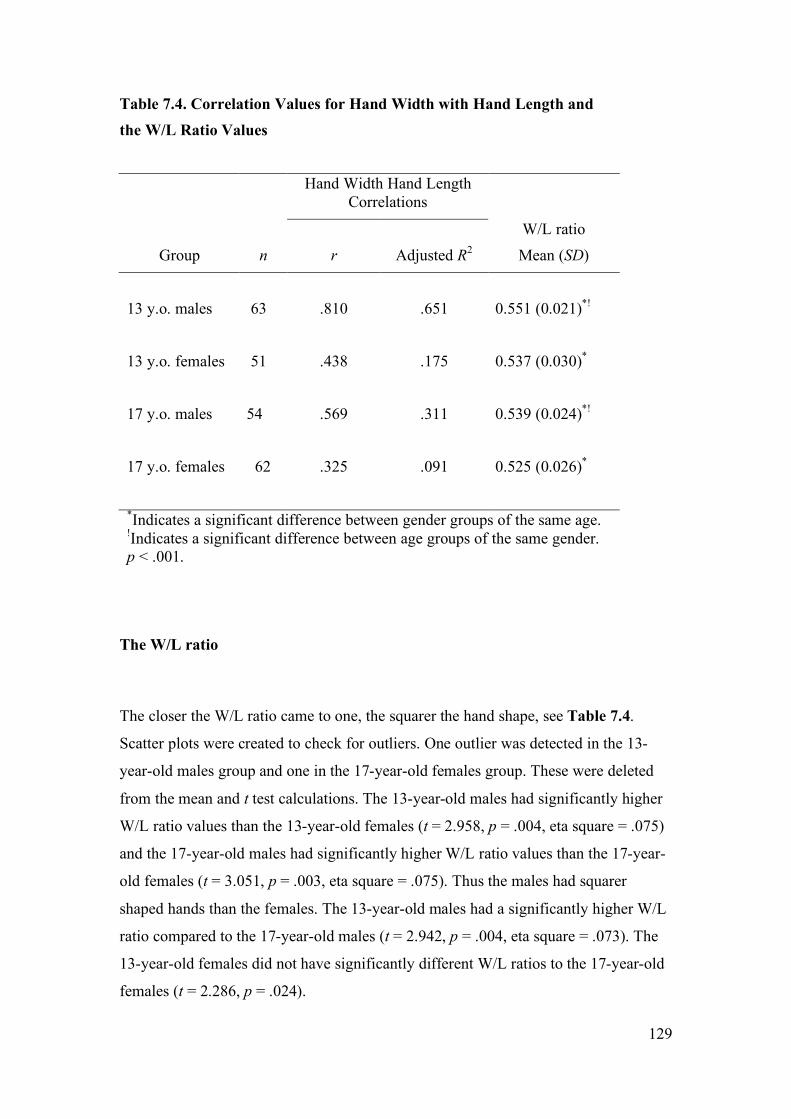
Table 7.4. Correlation Values for Hand Width with Hand Length and the W/L Ratio Values
Hand Width Hand Length Correlations
Group
n
r
Adjusted R2
W/L ratio Mean (SD)
13 y.o. males
63
.810
.651
0.551 (0.021)*!
13 y.o. females
51
.438
.175
0.537 (0.030)*
17 y.o. males
54
.569
.311
0.539 (0.024)*!
17 y.o. females 62
.325
.091
0.525 (0.026)*
*Indicates a significant difference between gender groups of the same age. !Indicates a significant difference between age groups of the same gender. p < .001.
The W/L ratio
The closer the W/L ratio came to one, the squarer the hand shape, see Table 7.4.
Scatter plots were created to check for outliers. One outlier was detected in the 13-
year-old males group and one in the 17-year-old females group. These were deleted
from the mean and t test calculations. The 13-year-old males had significantly higher
W/L ratio values than the 13-year-old females (t = 2.958, p = .004, eta square = .075)
and the 17-year-old males had significantly higher W/L ratio values than the 17-year-
old females (t = 3.051, p = .003, eta square = .075). Thus the males had squarer
shaped hands than the females. The 13-year-old males had a significantly higher W/L
ratio compared to the 17-year-old males (t = 2.942, p = .004, eta square = .073). The
13-year-old females did not have significantly different W/L ratios to the 17-year-old
females (t = 2.286, p = .024).
130
DISCUSSION From the above results it can be seen that males keep growing in all the measured
parameters between the ages of 13 and 17 years, but females tend to cease growth of
their hands, although they continue to grow in height and weight between these two
age groups. These results are consistent with the existing local and international
literature with regards to these parameters.
Height
When compared to the CDC height charts, the mean heights of the sample of
teenagers was slightly taller than that of the height charts. The 13-year-old males were
3.2 cm taller, the 13-year-old females were 1.9 cm taller, the 17-year-old males were
2.4 cm taller, and the 17-year-old females were 0.6 cm taller. This data is consistent
with the reported national trends for height increases over the last three decades
(Booth et al., 2003).
Weight
When compared to the CDC weight charts, the mean weights for all the sample
groups were heavier than the 50th percentile readings for the normative data, as
predicted in the introduction of this chapter. The 13-year-old males were 4.5 kg
heavier, the 13-year-old females were 6.3 kg heavier, the 17-year-old males were 4.7
kg heavier and the 17-year-old females were 4.7 kg heavier. Although 50th percentiles
do not always equal mean scores, in a population with an assumedly normal shaped
curve, these two figures should theoretically be equal. Based on data cited in Booth et
al. (2003) the mean weight of teenage males and females has increased by 3.9 kg and
2.0 kg respectively, over this time period.
The greater mean weights of the teenagers in the present data set are a little higher
than the national average, which was based on surveys by Booth et al. (2003)
compiled from data originating in the more southerly states, excluding Queensland.
The mean difference between the sample and teenage populations of these other
131
States mirrors the comparatively higher prevalence of being overweight or obese as an
adult living in Brisbane, as compared to adults living in the southern states (NHMRC,
1997). This comparison is justified as trends in adulthood weight gains have been
shown to typically commence in childhood (Wang, Patterson & Hills, 2002).
Body Mass Index
When compared to the prevalence of being overweight, or obese from a large survey
conducted in New South Wales (NSW) in 1997 (Booth et al., 2003) (n = 1,458 for the
13-year-old age group), the prevalence of being overweight in the current sample of
13-year-old males was greater by 5.3%, but the prevalence of being obese was less by
3.3%. The prevalence of being overweight or obese in the current sample of 13-year-
old females was greater by 9.9%, and 2.3% respectively. The prevalence of being
overweight or obese increased from 1985 to 1997 (Booth et al., 2003), but the
increase in the current sample does not reflect a further increase, as this data was
collected in 1997 and 1998.
Depending on whether the adult, or younger teenager norms are taken, the current
sample of 17-year-olds has either relatively slightly greater, or slightly lower
prevalence, of being overweight or obese, as compared to the only available norms
which are based on either 15-year-olds (Booth et al., 2003), or adults (NHMRC,
1997).
The current study found that the mean BMI for 13-year-old females of 21.08 (SD
4.49) was within the range published by Sydney-based researchers (O’Dea &
Abraham, 1995).
Hand dimensions and ethnicity
As hand dimensions are linked to ethnicity (Reeves, Varakamin & Henry, 1996),
errors can be made in attempting to make tight comparisons between Australian and
overseas populations. Even within the one ethnic group there can be differences in
hand sizes, as found in one study which surveyed the hand sizes of women working
132
on farms in three areas of Nigeria (Okunribido, 2000). Also periodic revision of all
Australian growth percentiles have been advocated, due to the changing mix of the
population and the socio-economic factors in urban Australia (Guaran, Wein, Sheedy,
Walstab & Beischer, 1994). With regard to Australian teenagers, W/L ratio databases
have not been previously published, so this new survey data may serve as a database
for the shape of the hands of the average Australian teenager.
Hand length
The 17-year-old males had hand lengths that were significantly longer than all of the
other groups. All of the other groups had hand lengths that were not significantly
different to each other. The comparative relationship between the four groups was
consistent with the research from overseas, as presented earlier in this chapter.
Of greater relevance to the grip strength aspect of the study, the mean hand lengths
were comparable to matched age and gender samples from another grip strength study
of Swedish children by Häger-Ross & Rösblad (2002). Their 13-year-old males (n =
20) and 13-year-old females (n = 22) had mean hand lengths that were 0.70 cm and
0.39 cm shorter than the matched groups in the present study. The mean hand lengths
of their 16-year-old males (n = 22) and 16-year-old females (n = 16) were 0.06 cm
and 0.03 cm longer than their matched groups in the present study, respectively. Thus
although the hands of their 13-year-olds were shorter than those of the 13-year-olds in
the present study, by the age of 16 they had surpassed that of the 17-year-olds in the
current study. They used a hand length measurement derived from hand tracings,
using the radial styloid process as their proximal landmark. This difference in
measurement technique and their smaller sample size may explain most, if not all, of
the differences between the two samples. Thus the grip strength comparisons will still
be valid.
In comparison to the 50th percentile for heights reported by Pheasant (1996), the mean
heights of the teenagers in the current study were consistently taller by a range of 1.5
to 4.1 cm. As hand length is proportional to body length (Abdel-Malek et al., 1990)
133
and the height of Australian teenagers have increased over the last three decades
(Booth et al., 2003), these results give a consistent and valid picture of the current
sample of teenagers being representational of urban Australian teenagers for hand
length.
Hand width
In the current sample, the 13-year-old males had hand widths that were significantly
wider than either of the female groups. The 17-year-old males had significantly wider
hands. There are no local databases for comparison.
The 50th percentile hand widths for male and female British 13 and 17-year-olds
(Pheasant, 1996) were between 1.55 cm and 1.88 cm narrower than the age and
gender matched present teenagers. The widths of the current sample were derived
from half of the circumferences. Pheasant did not take hand thickness into account
when measuring widths, thus these seemingly greater widths in all of the present
groups may not be so if hand thickness was subtracted from the results. In one study
of rural farming women, the average hand thickness was found to be between 2 and 3
cm (Okunribido, 2000). Thus a difference of approximately 2 cm between the data of
Pheasant and the current study is consistent with this disparity.
A study in the Netherlands reported the hand circumferences of 40 males and 41
females grouped in the one age span of 13 to 19 years of age (Merkies et al., 2000).
Their mean hand circumferences were 0.77 cm and 0.18 cm greater for males and
females respectively, than those of the combined age groups of the present study.
There were similar ranges and standard deviation values between the two groups.
Thus again the present results can be said to be reasonable.
134
Hand surface area
Amirsheybani et al. (2001) reported hand surface areas (as calculated from hand
length and hand width graphs) that were less than that of the present study. This was
probably due to the different methods for calculating hand widths and the effect of
averaging their male and female results. They found that the surface area of the hand
for the 13-year-olds and 17-year-olds was approximately 135 cm2 and 142.5 cm2
respectively, which was notably less than the values of the current study. See Table
7.3 for comparison. The relationship between the surface area of a hand and its ability
to generate grip strength is examined in Part 3 of this chapter.
Hand length and body height correlations
The relationship between hand length and body height is dynamic over the adolescent
years, especially during growth spurts that are noted to occur earlier in females than
males. The low correlation coefficients for the body height versus hand length
relationship in the current study may well be due to these factors. It is interesting to
note that the correlation was greatest with the 13-year-old males, who may not have
started, or only just commenced these “uneven” growth spurts (Taranger & Hagg,
1980).
Hand length/body height ratio
When comparing only the dominant hands of the 17-year-olds in the current study
with the right hands of the young adults in the study of Kulaksiz and Gozil (2002)
(which was not split by age), the two studies concur that males have significantly
longer hands (p < .001) in relation to their body height, than females. Thus in the
current study the 17-year-old males who were of the same height as the 17-year-old
females, may have been able to generate greater grip strength with their relatively
longer hands and thus greater lever arms. The biomechanics of this has been discussed
in the anatomy section of Chapter 1.
135
Hand width versus hand length and the W/L ratio
The males in the current study had squarer shaped hands than the females. This
gender difference in hand shape, is in agreement with a larger overseas study
(n = 393) (Kulaksiz & Gozil, 2002). The hands of the males became squarer, as they
became older teenagers. As some of them became significantly stronger, their muscle
bulk would have expanded their hand widths, but not their hand lengths. The females
had greater variation in their ratios of hand widths to hand lengths, as expressed by
their lower correlation values and higher SDs. This variation in hand width being
independent of hand length was also found in an Egyptian study (Abdel-Malek et al.,
1990). In contrast to the present study, they found no significant gender difference in
their adults. The impact of the relationship between hand shape, grip strength force,
and the reliability of the grip strength force, are dealt with in Chapter 10 and also
reported in Clerke et al. (2005) in Appendix B.
Reliability of the anthropometric measurements
Height, weight, hand circumference and hand length were taken slowly and with care,
but they were not repeat tested for three reasons. Firstly, it was considered that these
parameters would not change significantly within a retest period of 1 to 4 weeks, as
the proportionality of the length and width of the upper limb bones stabilises from
mid-adolescence (Ackland & Bloomfield, 1996). For hand widths to increase the
teenagers would need to be performing intense upper limb training to increase the
muscle mass of the intrinsic muscles of the hand. Significant changes within a four-
week period are considered unlikely (M. Henneberg, personal communication 10th
June 2004). Also all these teenagers were in school full-time, and no student reported
going on a sports camp between the first and the second test dates. This is note worthy
as intense physical education classes over a three-week period, have been shown to
increase the grip strength of 16 year-old females (Pujol, et al., 2005).
Secondly, extreme accuracy for these particular parameters was not deemed to be
necessary for this study, as previously published paediatric grip strength research
published reference ranges for grip strength by height in 10 cm increment groups
136
(Rauch et al., 2002). Others have accepted height and hand length with accuracies of
+0.25 cm and weight with an accuracy of +0.1 kg, (Häger-Ross & Rösblad, 2002).
Thirdly, the instruments and methods used were considered to be the ‘benchmark’ for
highly reliable and valid anthropometric measurements (Booth et al., 2003). The hand
dimensions were not repeat-measured because studies have found other upper limb
measurements to be stable with high levels of reliability (Green & Briggs, 1989;
Henneberg et al., 2001).
STUDY LIMITATIONS
Reliability
It could be argued that ideally the reliability of the methods should have been
examined by repeat testing every teenager within a short time period, such as 4 weeks.
Other researchers (as cited in Booth et al., 2001) have taken height readings to the
nearest 0.1 cm. This could have been done in the current study in which the heights
were recorded to the nearest 0.5 cm. Ideally measurements of subcutaneous fat, such
as skin fold calliper measurements, could also have been included for the assessment
of obesity.
Ethnicity
Ethnicity has an influence on anthropometric ratios (Reeves et al., 1996) and may
therefore impact upon grip strength generation with JamarTM-like dynamometers.
Thus recording the ethnicity of each of the teenagers may have been of value.
Henneberg and George (1993) write that anatomical and anthropometric differences
between people should not be based on racial groups (such as ‘black’ or ‘white’), but
“on nationality, territorial origin or socio-economic parameters.” In light of this, the
terms ‘ethnicity’ or ‘ethnic background’ seem to be reasonable when wishing to
describe a population, as the reader needs to know if the surveyed population is
representative of and can be generalised to the local populus. This current sample
appeared to be mainly of an Anglo-Saxon origin. Also all students were able to
communicate fluently in English during the grip strength tests and the form filling
sessions, and so were assumed to have lived in Australia for at least a number of
137
years, as opposed to recent refugees, who may have issues of malnutrition and growth
retardation.
The classification into territorial origin may have been regarded as a sensitive matter
by some of the students. Also in our Australian multicultural society, teenagers of
mixed ethnic background would have been difficult to classify. Thus classification of
healthy urban teenagers into groups with similar ethnic origins within our
multicultural society is not deemed necessary.
Pubertal stage
As pubertal stage has an effect on BMI for females (O’Dea & Abraham, 1995) and
grip strength for males (Kreipe & Gewanter, 1985), pubertal stage could have been
recorded with a reliable, self-evaluation method, such as the Tanner method (Kreipe
& Gewanter, 1985). Formal written guardian consent (rather than passive consent)
would have been considered necessary to help ensure that the teenagers did not feel
that the project was an inappropriate invasion of their privacy. Rather than the sole
female researcher (the author) presenting the Tanner photos of the stages of male
genitalia maturation to the male students, a male researcher would have been viewed
as a more appropriate person to do this within our society, as done previously (Kreipe
& Gewanter, 1985). The usefulness of this information needed to be weighed against
its possible negative ramifications. It could be argued that the recording of this self-
evaluation method may have been seen to be personally threatening, and this in turn
may have reduced the participation rate, or even jeopardised the support of the school
for the research.
Hand dimensions and right-left asymmetry
Some paediatric studies have found a statistically significant asymmetry between the
lengths of the two hands in children aged 4 to 9 years (Means & Walters, 1982).
Others have found no differences in the surface areas of the two hands in 800 people
in the broader age range of 2 to 89 year olds (Amirsheybani et al., 2001). Upper arm
asymmetry in post-pubescence, right-handed teenagers, has been reported, but not in
an = 66. bn = 54. cn = 53. dn = 63. *Indicates a significant difference between gender groups of the same age. !Indicates a significant difference between age groups of the same gender.
162
Non-dominant Hand Grip Strength (Non-domT1) For All Groups
For each age and gender group Table 7.9 presents the Non-domT1 mean grip strength
values, their standard deviations and standard error of the means. In a manner similar
to that for the dominant hands, each of the non-dominant hand groups were strength-
ranked in the following order: 17-year-old males, 13-year-old males, 17-year-old
females, 13-year-old females, with the following t test results: the 13-year-old males
were significantly stronger than the 13-year-old females (t = 3.630, p < .001), but they
were not significantly stronger than the 17-year-old females (t = 1.410, p = .161). The
17-year-old females were significantly stronger than the 13-year-old females
(t = –2.998, p = .003). The SDs and the SEM were again greater for the males than the
females.
Comparison of the Mean Grip Strength of the Dominant Hand to the Non-dominant Hand and the Left and Right Hands
When using paired t tests to compare the dominant hand with the non-dominant hand
for each of the four groups, all groups had a significant difference between the mean
strength of their two hands. The strength of the relationship between the two hands
was weaker for the older teenagers as compared to the 13-year-olds as judged by their
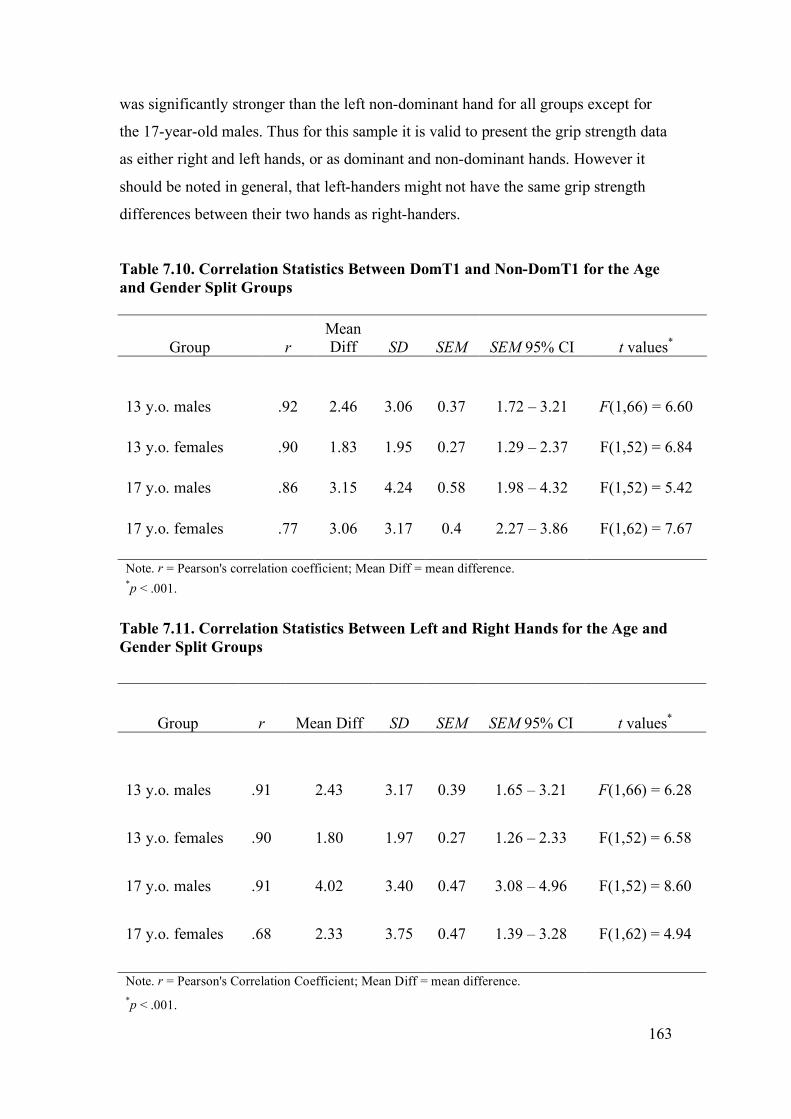
r values, with a correspondingly greater mean difference, see Table 7.10. Paired t
tests results were similar for the right and left hand comparison, see Table 7.11.
Paired t tests results for the right hand compared with the dominant hand, showed that
there was no significant difference between these two hands for the 13-year-olds, but
they were significantly different at the .05 level for the 17-year-old males, whilst they
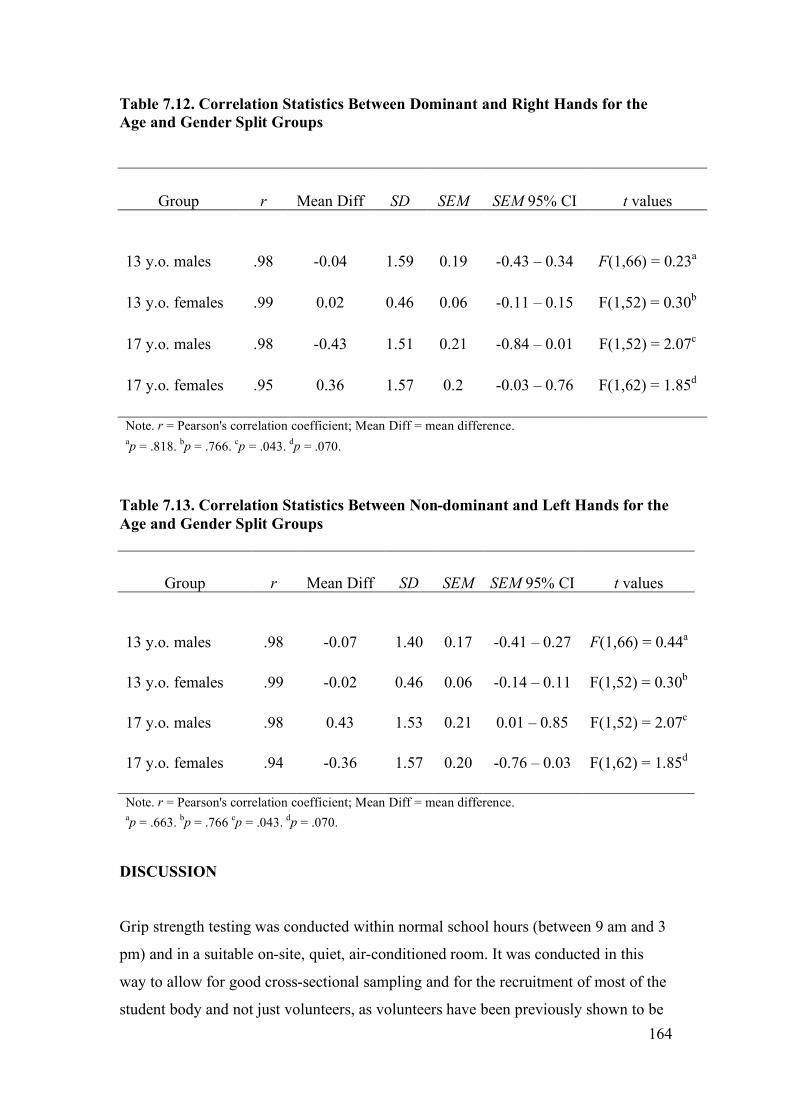
approached significance for the 17-year-old females, see Table 7.12. Paired t tests
results for the left hand compared with the non-dominant hand, were almost identical
to the results of the right versus the dominant hand (see Table 7.13).
When the hands were simply divided into left or right dominant determined according
to a positive or a negative Laterality Quotient on the EHI, the right hand was the
dominant hand in 87% of the teenagers and the dominant hand was the strongest hand
in 76% of the teenagers, with 81% of the right-handers having the right hand as the
strongest hand. There were 37% of the left-handers who had their left hand as their
strongest hand. The paired sample t tests demonstrated that the right dominant hand
163
was significantly stronger than the left non-dominant hand for all groups except for
the 17-year-old males. Thus for this sample it is valid to present the grip strength data
as either right and left hands, or as dominant and non-dominant hands. However it
should be noted in general, that left-handers might not have the same grip strength
differences between their two hands as right-handers.
Table 7.10. Correlation Statistics Between DomT1 and Non-DomT1 for the Age and Gender Split Groups
aDominant Hand. bNon-dominant Hand. c Combined right and left hand data. dResults for right dominant subjects only, excluded 5 left-handed males in the 13-year-old age group.
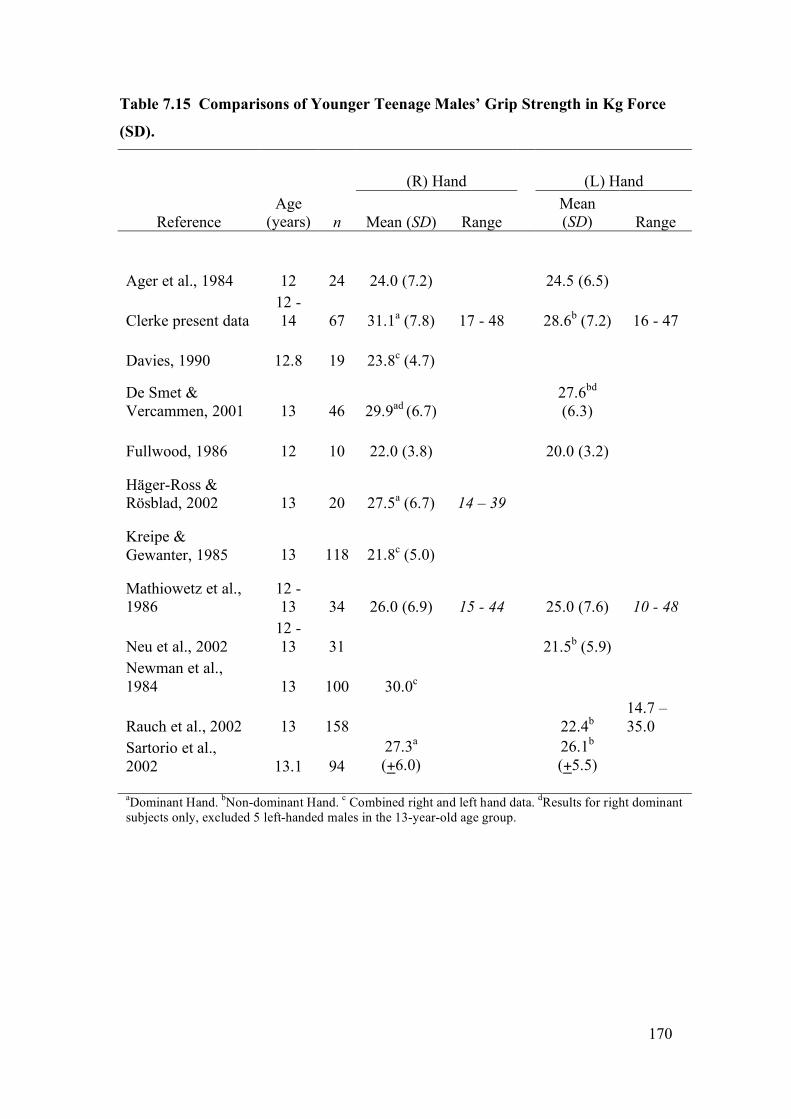
171
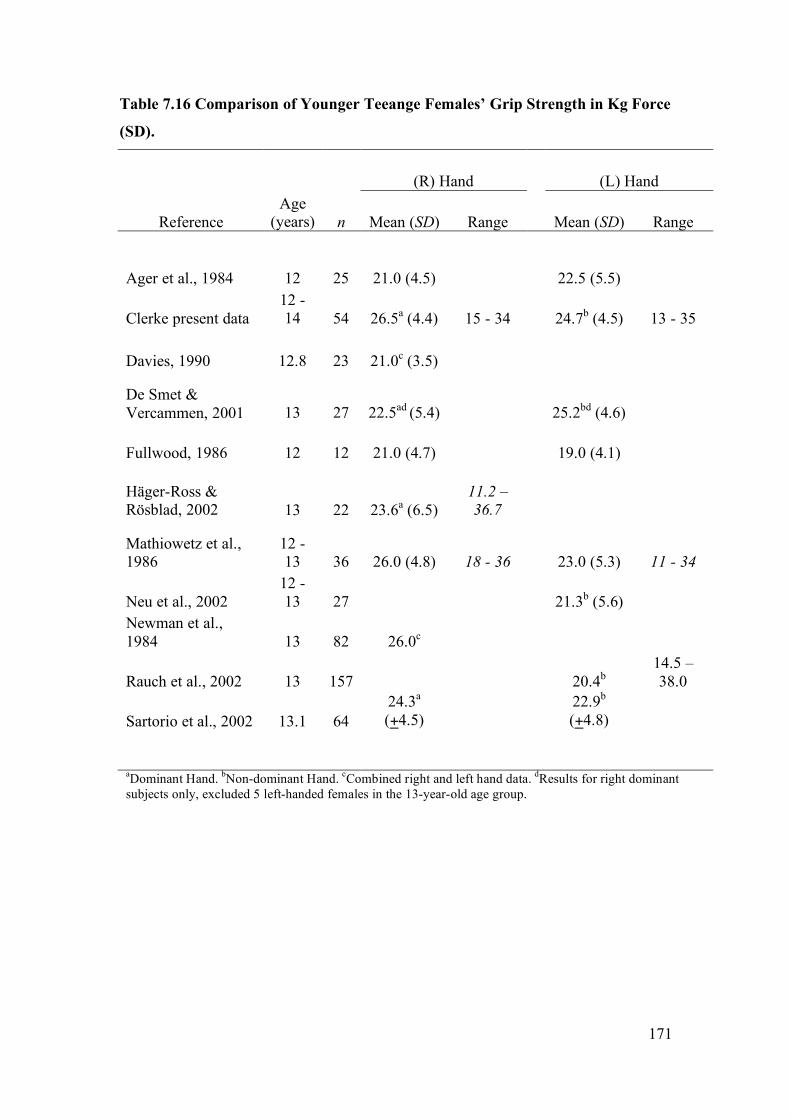
Table 7.16 Comparison of Younger Teeange Females’ Grip Strength in Kg Force
aDominant Hand. bNon-dominant Hand. cCombined right and left hand data. dResults for right dominant subjects only, excluded 5 left-handed females in the 13-year-old age group.
172
Table 7.17. Comparisons of Older Teeanger Males’ Grip Strength in Kg Force
(SD).
(R) Hand (L) Hand
Reference Age
(years) n Mean (SD) Range Mean (SD) Range
Agnew & Maas, 1982 16 - 25 33 39.6a (7.96)
Bäckman et al, 1995 17 - 18 10
47.9a (2.34)
Clerke present data 16 - 18 54 48.2b(8.1)
29 - 67
45.3c (8.2)
29 - 61
Davies, 1988 17 - 23 37 50.6b (7.6)
Fike & Rousseau, 1982 16 - 20 16 44.1 (10.0)
39.1 (8.0)
Häger-Ross & Rösblad, 2002 16 22 49.8b (7.5)
Kreipe & Gewanter, 1985 17 246 38.6a (5.5)
Mathiowetz et al, 1986 16 - 17 31 42 (8.7)
29 - 67 35 (8.6)
18 - 55
Neu et al., 2002 16 - 17 32
39.5b (8.1)
Newman et al, 1984 17 31 43.3a
Rauch et al., 2002 17 158 41.8b 26 - 69
aCombined right and left hand data. bDominant Hand. cNon-dominant Hand.
173
Table 7.18. Comparisons of Older Teenage Females’ Grip Stregth in Kg Force
(SD).
(R) Hand (L) Hand
Reference Age
(years) n Mean (SD) Range Mean (SD) Range
Agnew & Maas, 1982 16 - 25 35 29.4a (4.24)
Bäckman et al, 1995 17 - 18 10 27.7a (5.5)
Clerke present data 16 - 18 62 30.3b(4.7)
16 - 39
27.1c (4.2)
15 - 36
Davies, 1988 17 - 23 42 30.4b (4.9)
Fike & Rousseau, 1982 16 - 20 17 26.6 (4.9)
223.9 (4.0)
0 16 16 32.4b (5.7)
Mathiowetz et al, 1986 16 - 17 35 30 (7.4)
10 - 57
25.6 (6.3)
10 - 39
Neu et al., 2002 16 - 17 22
28.9c (4.8)
Newman et al, 1984 17 42 29a
Rauch et al., 2002 17 157 27.5c 18 - 45
aCombined right and left hand data. bDominant Hand. cNon-dominant Hand.
174
CHAPTER 7
PART 7.3
VARIABLES AFFECTING GRIP STRENGTH
The rapidly changing biomechanical and psychosocial stresses of the teenage years
are inherent risk factors for musculoskeletal injuries (Lewin, Davis & Hops, 1999).
The number of serious injuries in these years is increasing due to the number and
nature of high velocity, or extreme sports, such as snow boarding (Sutherland,
Holmes & Myers, 1996) and so a greater number of these teenagers will be seen in
hand clinics and will require rehabilitation. In the USA it is estimated that one in
fourteen teenagers will visit a hospital for a sports-related injury (Auringer &
Anthony, 1999). When a unilateral upper limb injury occurs, the pre-injury grip
strength of that hand can often be estimated from the grip strength of the uninjured
hand (Häger-Ross and Rösblad, 2002; Hanten et al., 1999; Newman et al., 1984).
A wide range of bilateral injuries have been reported in the literature, such as
carpometacarpal dislocations of both thumbs (Khan, Ryan & Teplitz, 2003), bilateral
ulnar stress fractures due to inappropriate use of weight-bearing crutches (McGoldrick
& O’Brien, 1988), median nerve palsies in cyclists (Braithwaite, 1992) and stress
injuries to distal growth plates of the radii in young gymnasts (Di Fiori &
Mandelbaum, 1996). When bilateral injuries occur, the pre-injury grip strength of
these two hands needs to be estimated from other variables.
In a sample of 10 to 69 year olds, age and gender have certainly been found to be
excellent indicators of premorbid grip strength (Montoye & Lamphiear, 1977).
However within the genders, any particular age group has a wide range of normal grip
strength values. For example in the current research, the grip strength of a healthy 13-
year-old male ranged from 17 to 48 kg f, although the mean grip strength for this
group was 31.1 kg f, with a standard deviation of 7.8 kg f. Thus it is most likely that
his grip strength would fall between 23.3 kg f and 38.9 kg f. This estimation could be
narrowed down further if other variables could be found which would point to which
175
end of this range he was likely to fall within. Häger-Ross and Rösblad (2002) found
that knowing his height improved the ability to narrow down the range, because tall
13-year-old males were found to be stronger than short 13-year-old males. These
researchers achieved prediction models in which 81% of the variance between the
actual and predicted grip strength was accounted for by using height as the only
independent variable, in their sample of 4 to 16-year-old males. Rauch et al. (2002)
found that for 6 to 19-year-old males, 85% of the variance in grip strength could be
accounted for by height. Such predictive models that incorporate height look
promising for assisting clinicians with pre-morbid grip strength estimations. But the
wide childhood height range that naturally occurred within these two studies was
critical to the strong and positive relationship that height had with grip strength.
In contrast to these paediatric studies, Everett and Sills (1952) found that for 14 to 29-
year-old males, they could only account for 35.6% of the variance in grip strength by
height (r = .597, R2 = .356). They had a residual of .644 meaning that 64.4% of the
difference between their actual and their predicted grip strength scores could not be
explained by the variable of height. This low level of predictability probably arose
because they only collected data from a narrower height range, the heights of 14 to
29-year-olds. Thus although the idea of estimating grip strength from consulting only
height and gender appears attractive as a time saver for a clinician, it can lead to low
levels of predictability and high levels of error, or residuals.
When Everett and Sills (1952) considered the combined variables of hand width,
height, hand length, finger length and mesomorphy the multiple correlations model
resulted in a much higher correlation value of r = .784, and a stronger prediction
model of R2 = .615. These combined variables accounted for 61.5% of the variance
between the actual and predicted grip strength. But that still left 38.5% of the variance
unaccounted for in their males.
Many variables influence grip strength. Finding a perfect correlation and subsequent
prediction model between one or more independent variables and grip strength is near
impossible (Portney & Watkins, 2000; Tilley, 1999). However the variables most
strongly associated and predictive of grip strength values, whether in isolation or in
combination, have not been fully investigated for urban Australian teenagers. To have
176
these variables identified and to narrow the residuals (or error of prediction) would be
helpful in rehabilitation and medico-legal assessments.
Prediction models
When discussing the prediction models the independent variables were
interchangeably named as predictor variables and the dominant and non-dominant
handgrip strength values were interchangeably named the dependent or criterion
variables.
Gender Effect on Grip Strength
Men have significantly stronger grip strength than women, although women have
greater grip endurance (Padmavathi et al., 1999). This grip strength difference persists
after correction for forearm muscle area (Padmavathi et al., 1999). These gender
differences are not seen until pubertal changes (measured by testosterone levels)
commence at 11 to 14 years of age (Ramos, Frontera, Llopart & Feliciano, 1998),
with one recent study finding the exception. Yim et al. (2003) used the mean of two
trials on handle position 2 of a JamarTM dynamometer to find that 370 Korean boys in
the young age range of 5 to 12 years had significantly stronger grip strength means
than 342 age-matched females, within every yearly age group.
The current study found that teenage males have different body shapes and have
significantly stronger grip strength abilities than age-matched females, see Chapter 7,
Parts 1 and 2. So now the variables affecting grip strength will be presented as gender
split groups.
Variables and predictive abilities
Experiments were carried out to: (a) measure the ability of the grip strength score of
one hand to predict the grip strength score of the other hand; (b) evaluate the
influence that a number of other variables have upon the grip strength of a healthy
hand; and (c) to determine the predictive abilities of these variables for grip strength.
177
It was expected that the combination of gender, age, exercise levels and hand surface
area would give the most accurate prediction equations abilities for grip strength,
when both hands were injured. It was also expected that these four variables would
add power to the prediction models that used the grip strength of the contralateral
hand. These approaches were previously undertaken by a number of researchers, as
will be discussed below, but first some statistical terms are defined in relation to their
use here.
STATISTICAL TERMS
Association versus prediction
Correlation statistics have been used in several sections of this thesis to describe the
size and direction of the linear relationship (association) between two variables. Now
regression is to be used to predict a score on one variable from the score on one or
more variables. Thus bivariate linear regression equations are to be used to predict
the grip strength of one hand, the criterion variable, based on a single independent
variable, the predictor variable, associated with it in a linear fashion, such as the
opposite hand. The grip strength of the dominant hand is expected to increase linearly
and in proportion with the grip strength of the non-dominant hand. The use of
multiple linear regression equations allowed the prediction of the grip strength
readings of one hand from a set of multiple independent variables. These relationships
do not have causal implications. That is, the independent variables do not cause or
determine the size of the dependent variable (Tabachnick & Fidell, 2001).
Outliers
Bivariate scatter plots assisted in determining whether the assumption of a linear
relationship between grip strength and each independent variable was valid, because
these particular correlation and regression models can only be conducted with
variables that have a linear (as opposed to a curved, or quadratic) relationship with
each other. The spread of the data points on the scatter plots assisted in the visual
observation of the association between the two. Outliers were also identified via this
178
method. If their value was greater than 3 SDs from the mean of that value they were
discarded from the analysis. An outlier is a case (data point) with such extreme value
on a variable that it distorts the statistics. As outliers were deleted at the stage of the
bivariate analysis, screening the data at the level of the multivariate analysis was not
needed. More information about how and why outliers were treated is detailed in the
statistical analysis section.
Least squares regression lines
Least squares regression lines, or the ‘lines of best fit’ were drawn on scatter plots.
These are lines that ‘best’ describe the orientation of all data points in a scatter plot
(Portney & Watkins, 2000). The slopes of such lines give information about the
strength of association and direction of the relationship between any two variables.
Multiple linear regression analysis – stepwise model
Performing these multiple linear regression analyses in a stepwise fashion (also
known as statistical regression) allowed the SPSS software to calculate which
variables, or combination of variables, were the most important in predicting the
criterion variable. Ensuring the representativeness of the sample (as demonstrated in
Chapter 7, Parts 1 and 2) and deleting the outliers assisted in being able to do this
particular type of analysis that was needed to achieve useful prediction equations for
grip strength (Tabachnick & Fidell, 2001).
When independent variables are highly correlated (such as hand length and body
height, see Chapter 7, Part 1A) the apparent importance of a particular variable to the
prediction equation can be reduced, “whittled away”, or “essentially knocked … out
of the solution” (Tabachnick & Fidell, 2001, p. 9). Thus when Häger-Ross and
Rösblad stated that “the contribution of age, weight and hand length were significant
for both girls and boys (p < .001 in all cases), while height did not add anything to the
model for the boys” (2002, ¶ 14) the complexity of the correlation of the independent
variables with the dependent variable can be appreciated. When “variables are
correlated, the overall relationship remains the same, but the apparent importance of
179
variables to the solution changes depending on … the strategy used” (Tabachnick &
Fidell, 2001, p. 10).
Residuals
As the prediction equations generated from regression models cannot be expected to
fully predict a criterion variable from one or more predictor variables, the results have
an inherent degree of error. Häger-Ross and Rösblad (2002) had 13% of the variance
in the grip strength of their boys not accounted for when they had considered age,
height, weight and hand length. This error between the predicted grip strength values
and the actual values is the residual. In the current study the residual represented the
difference between the actual grip strength values and the predicted values. The
greater the residual, the further the estimates of grip strength will be from the actual
values.
Selecting a criterion variable
Researchers have been inconsistent in which hands are to be used for grip strength
studies, the right and left, or the dominant and non-dominant hands. Initially, two
pairs of criterion variables for this non-experimental study were examined:
1a. The strongest grip strength score (out of three squeezes of the GripTrackTM
handle on five handle positions) of the dominant hand (DomT1) on the initial,
or the only, grip strength testing session;
1b. The strongest grip strength score of the right hand on the initial, or the only
grip strength testing session;
2a. The strongest grip strength score (out of three squeezes of the GripTrackTM
handle on five handle positions) of the non-dominant hand (Non-domT1) on
the initial, or the only, grip strength testing session;
2b. The strongest grip strength score of the left hand on the initial, or the only grip
strength testing session.
The right and left hands correlated very highly with the dominant and non-dominant
hands, respectively, both pairs at r = .99. Using a paired sample t test also
180
demonstrated that there were no significant differences between the means of the
strongest grip strength score of the dominant hand and that of the right hand
(t = -0.09, p = .93). Also the dominant hand generated the greatest grip strength in
93.3% of the students and for 87% of the teenagers the dominant hand was the right
hand. There was no significant difference between the mean grip strength of the non-
dominant hand and the left hand (t = -0.288, p = .774).
Computing an Effect Size
When using correlation and regression models an effect size has been defined as a
measure of the magnitude of association or predictive abilities, between two or more
variables. The larger the effect size, the more likely it was that these variables had a
significant impact on the dependent, or criterion variable (Portney & Watkins, 2000).
Green et al. (2000) applied this to regression models by explaining that “there are two
types of effect sizes for multiple regression analysis: multiple correlation indices to
assess the overall effect of the predictors on the dependent variable, and part and
partial correlations to asses the relative effects of individual predictors” (p. 266).
METHODS
Maximal voluntary, isometric, grip strength tests (grip strength tests) were performed
by 238 healthy teenagers (122 males, 116 females), using the standard ASHT
protocols. Further details of the sample and testing methodology have been given in
the methods section of Chapter 5.
There were 12 predictor variables; gender, age (rounded to 0.1 of a year) at date of
test (TESTage), height, weight, body mass index (BMI), hand length, hand width,
hand surface area (Hand S.A.), hand shape as expressed by the hand width/length
ratio (W/L ratio), average hours of sport or regular exercise per week, hours of bicycle
riding per week, and the grip strength of either the dominant hand (DomT1), or the
non-dominant hand (Non-domT1), depending on which hand was being examined.
These variables were chosen because research and clinical reasoning considered them
to have a significant correlation with grip strength, and had found them to have
181
positive predictive relationships with grip strength. For example, hand size (Bear-
Lehmann, Kafko, Mah, Mosquera & Reilly, 2002) and hand length (Häger-Ross and
Rösblad, 2002) have correlated positively and strongly with grip strength in children
and teenagers.
With regard to the physical fitness variable, although some studies have shown that
some forms of physical exercise (martial arts and some gym programmes) do not
correlate with increased grip strength in adults compared to controls (Douris, Chinan,
Gomez, Steffens & Weiss, 2004; Sinaki, Canvin, Phillips & Clarke, 2004), some other
Hand Width .698 (.483) .702 (.488) .380 (.137) .438 (.185)
BMI .505 (.249) .489 (.232) .240 (.049)* .303 (.084) Note. DOMT1 = dominant handgrip strength; Non-domT1 = non-dominant handgrip strength; Hand S.A. = hand surface area; TESTage = age in years to the nearest 0.1 years; BMI = body mass index. NS = not significant at .01 level, *p = .01, all other p < .01.
Figure 7.4. Relationship between body mass index (BMI) and dominant handgrip strength in kilograms force (DomT1) for all males.
Males
BMI
40302010
DomT1
70
60
50
40
30
20
10
Figure 7.5. Relationship between body mass index (BMI) and dominant handgrip strength in kilograms force (DomT1) for all females.
189
Females
BMI
40302010
DomT1
50
40
30
20
10
An interesting observation to note was that some people might assume that the larger
teenagers would be stronger than the petite ones. An examination of the scatter plots
of DomT1 in relation to BMI (Figures 7.4 and 7.5) indicated that the obese males
(i.e., those with BMI values greater than 27 to 30, depending on their age) tended to
have lower grip strength than projected. The obese females (defined as BMI greater
than 28 to 30, depending on their age) also had the same tendency.
Apart from the excellent results for the contralateral hand, the prediction ability for
each independent variable had large residuals, none being able to account for more
than 60.3% of the difference between the actual and predicted grip strength values.
The females had large potential errors in predicting grip strength from any of these
independent variables.
Multiple Linear Regression Models
Multiple linear regression models were developed to predict the grip strength of one
hand from the significant bivariate criterion variables. There was a gender difference
in the outcome. For the males, there was no advantage in adding any of the other
independent variables if the grip strength of the contralateral hand was known, as 90%
190
of the variance in the known hand was accounted for in the other hand, with a SEE of
3.7 Kg f and F(1, 117) = 1090.1, p < .01.
Because the correlation of the two hands was not that high for the females (r = .838,
R2adj .702), with a SEE of 2.7 Kg f, with F(1, 110) = 262.0, p < .01, there was a small
improvement in the prediction of the grip strength of the non-dominant hand when
Hand S.A. was added to the equation (r = .865, R2adj .743, F(2, 109) = 161.5, p < .01).
The SEE was then decreased to 2.3 Kg f. The Z score of the dominant hand (Z = .716)
was naturally greater than that of Hand S.A. (Z = .242). For the prediction of the
dominant hand’s grip strength none of these other independent variables contributed.
Bilateral hand injuries
If the grip strength of the other hand was not known, as in the case of bilateral hand
injuries, there were some criterion variables that contributed to the prediction of grip
strength for both genders. For predicting the grip strength of the dominant hands of
the males, height and Hand S. A. accounted for 62.6% of the variance between the
actual and the predicted grip strengths, with a SEE of 7.05 Kg f (F(2, 113) = 97.2,
p < .01). For predicting the grip strength of the non-dominant hands of the males,
height and Hand S. A. accounted for 63.5% of the variance, with a SEE of 6.8 Kg f
(F(2, 112) = 100.3, p < .01). Hand S.A. was slightly more important than height for
the models of both the dominant and non-dominant hands. For the dominant hand,
Hand S.A. Z = .468 and height Z = .358. For the non-dominant hand Hand S.A.
Z = .470 and height Z = .361.
For the females, when predicting the grip strength of the dominant hand Hand S. A.
(Z = .344) and height (Z = .344) contributed equally and accounted for only 33.9% of
the variance, with a SEE of 4.0 Kg f (F(2, 109) = 29.5, p < .01). For predicting the
grip strength of the non-dominant hand Hand S. A. (Z = .462) contributed a little more
than height (Z = .301), and together they accounted for 42.8% of the variance, with a
SEE of 3.4 Kg f. Refer to the prediction models in Table 7.20 for the formulae.
191
Table 7.20. Prediction Models R, R2adj and SEE in Kg f for the Dominant and
Non-dominant Grip Strength. Model Prediction Equations R R2
adj SEE Females When the dominant hand grip strength is known: