Chapter 3 - Habitat Assessment Chapter 2 discussed how water quality is a reflection of the land use in the watershed. However, the condition of land within and along the stream channel is also critical to the health of the stream and its ability to support aquatic life. What is a Healthy Stream Habitat? A natural stream channel does not flow in a straight line; it meanders. Rivers meander as they flow because this pattern releases the kinetic energy of the water in the most even or uniform manner. Meanders also provide a variety of habitats for many species of plants and animals. Pools, riffles, undercut banks and snags (fallen limbs or small log piles) all provide different types of habitat. The more types of habitat present in a stream system, the greater the potential for aquatic plant and animal diversity. A uniformly straight or deep channel provides less potential habitat than a stream with variable flows and depths. Examples of healthy and unhealthy stream habitats are shown in Figures 10 and 11. www.idem.IN.gov /riverwatch 22 Figure 10
Transcript
Chapter 3 - Habitat Assessment
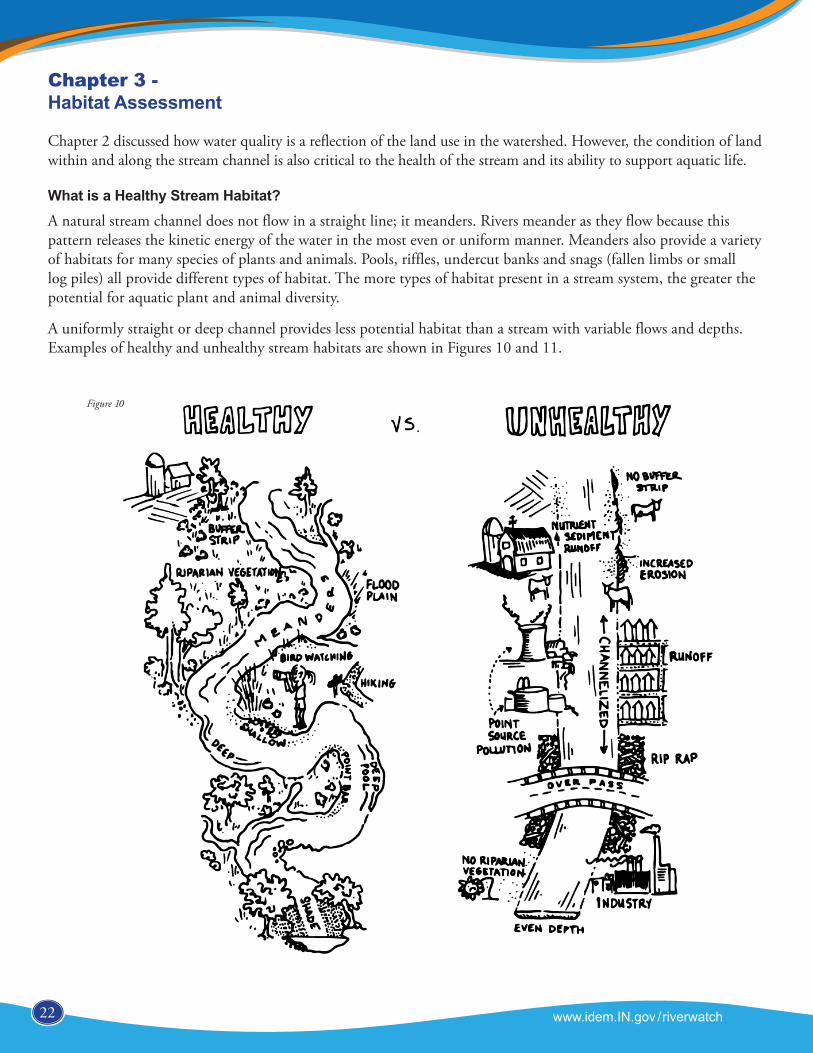
Chapter 2 discussed how water quality is a reflection of the land use in the watershed. However, the condition of land within and along the stream channel is also critical to the health of the stream and its ability to support aquatic life.
What is a Healthy Stream Habitat?A natural stream channel does not flow in a straight line; it meanders. Rivers meander as they flow because this pattern releases the kinetic energy of the water in the most even or uniform manner. Meanders also provide a variety of habitats for many species of plants and animals. Pools, riffles, undercut banks and snags (fallen limbs or small log piles) all provide different types of habitat. The more types of habitat present in a stream system, the greater the potential for aquatic plant and animal diversity.
A uniformly straight or deep channel provides less potential habitat than a stream with variable flows and depths. Examples of healthy and unhealthy stream habitats are shown in Figures 10 and 11.
www.idem.IN.gov /riverwatch22
Figure 10
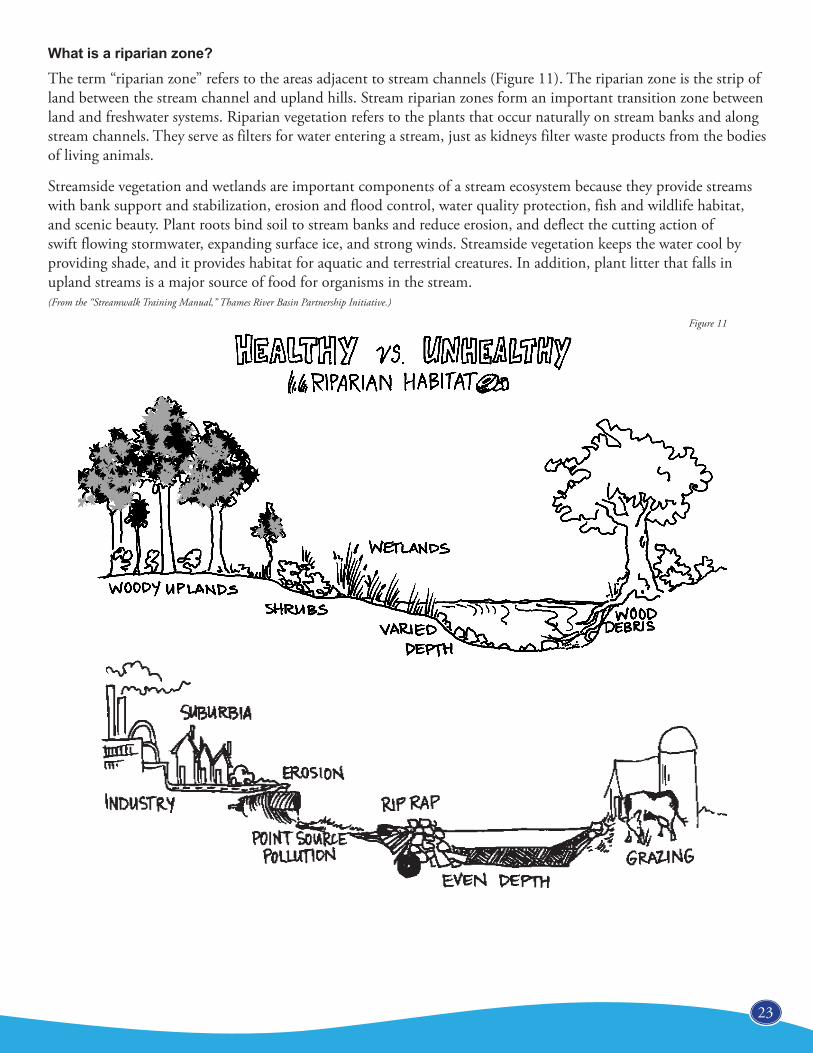
What is a riparian zone?The term “riparian zone” refers to the areas adjacent to stream channels (Figure 11). The riparian zone is the strip of land between the stream channel and upland hills. Stream riparian zones form an important transition zone between land and freshwater systems. Riparian vegetation refers to the plants that occur naturally on stream banks and along stream channels. They serve as filters for water entering a stream, just as kidneys filter waste products from the bodies of living animals.
Streamside vegetation and wetlands are important components of a stream ecosystem because they provide streams with bank support and stabilization, erosion and flood control, water quality protection, fish and wildlife habitat, and scenic beauty. Plant roots bind soil to stream banks and reduce erosion, and deflect the cutting action of swift flowing stormwater, expanding surface ice, and strong winds. Streamside vegetation keeps the water cool by providing shade, and it provides habitat for aquatic and terrestrial creatures. In addition, plant litter that falls in upland streams is a major source of food for organisms in the stream. (From the “Streamwalk Training Manual,” Thames River Basin Partnership Initiative.)
23
Figure 11
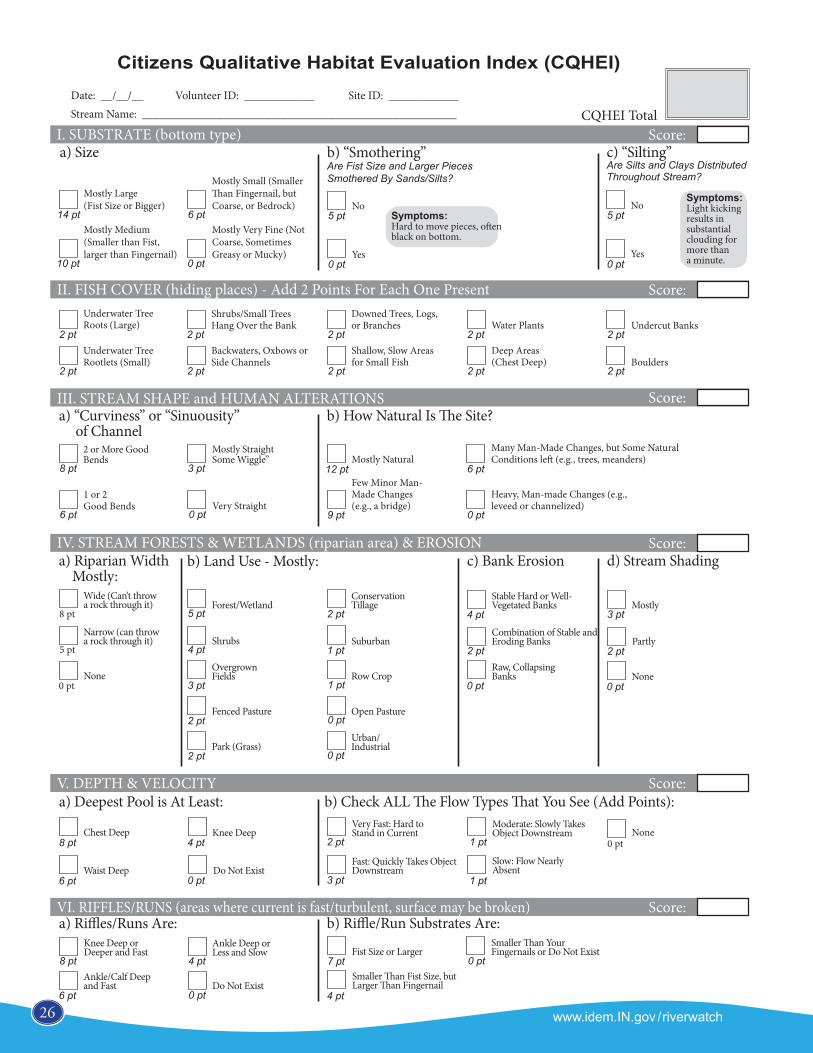
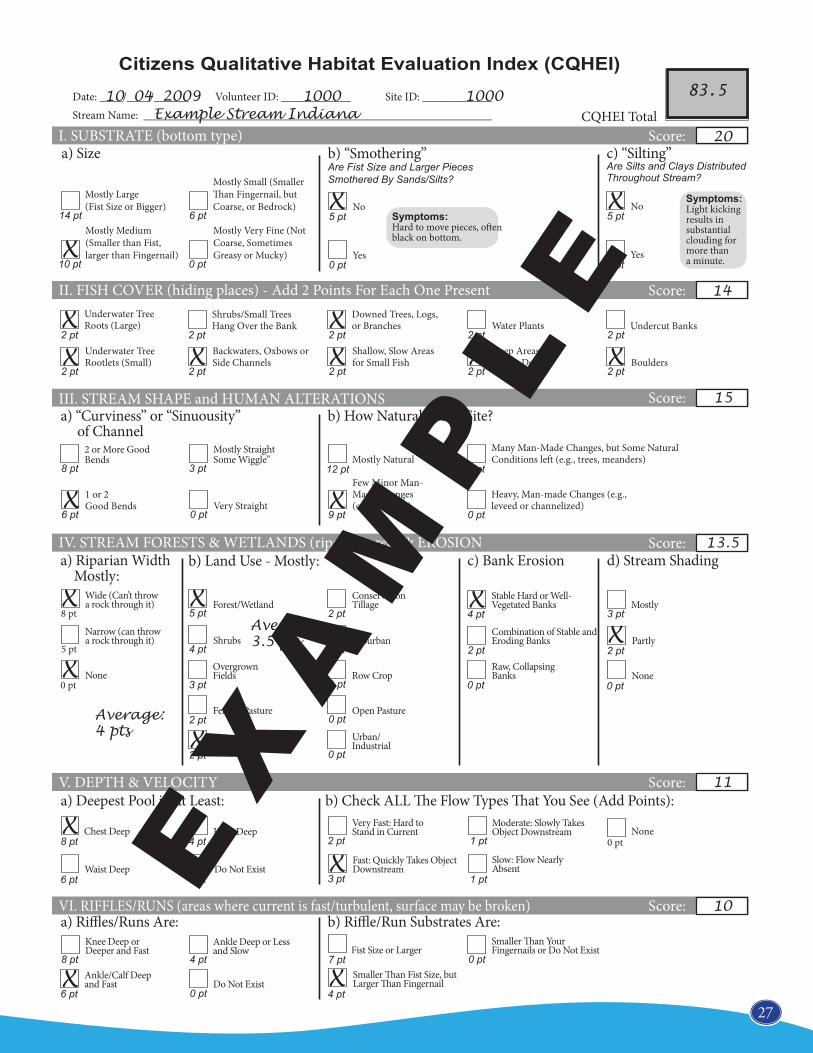
Citizens Qualitative Habitat Evaluation Index (CQHEI)
This index was developed by the Ohio Environmental Protection Agency as a “Citizens” companion to the Qualitative Habitat Evaluation Index (QHEI) used by the state’s professional staff. The diagram’s data sheet on pages 26-27 were modified from information provided by the Ohio EPA. The purpose of the index is to provide a measure of the stream habitat and riparian health that generally corresponds to physical factors affecting fish and other aquatic life (i.e., macroinvertebrates). The CQHEI produces a total score that can be used to compare changes at one site over time or to compare two different sites.
NOTE: The CQHEI data sheet was designed to be used primarily in wadeable streams. The index scores do not necessarily reflect the conditions found in intermittent streams or large rivers.
When completing the CQHEI, evaluate your entire stream site (200’ section).In each category choose the most predominant answer. If sections of the stream or stream banks have completely different characteristics, you may check two boxes and average the points to obtain a score for the subsection (a), (b) or (c). An example is provided on page 27.
I. Substrate (Bottom Type) - Max 24 pts (Note: “smothering” is the same as “embeddedness.” See Figure 8 on page 17. Check “yes” for smothering, if the stream bottom is more than 50% embedded.)
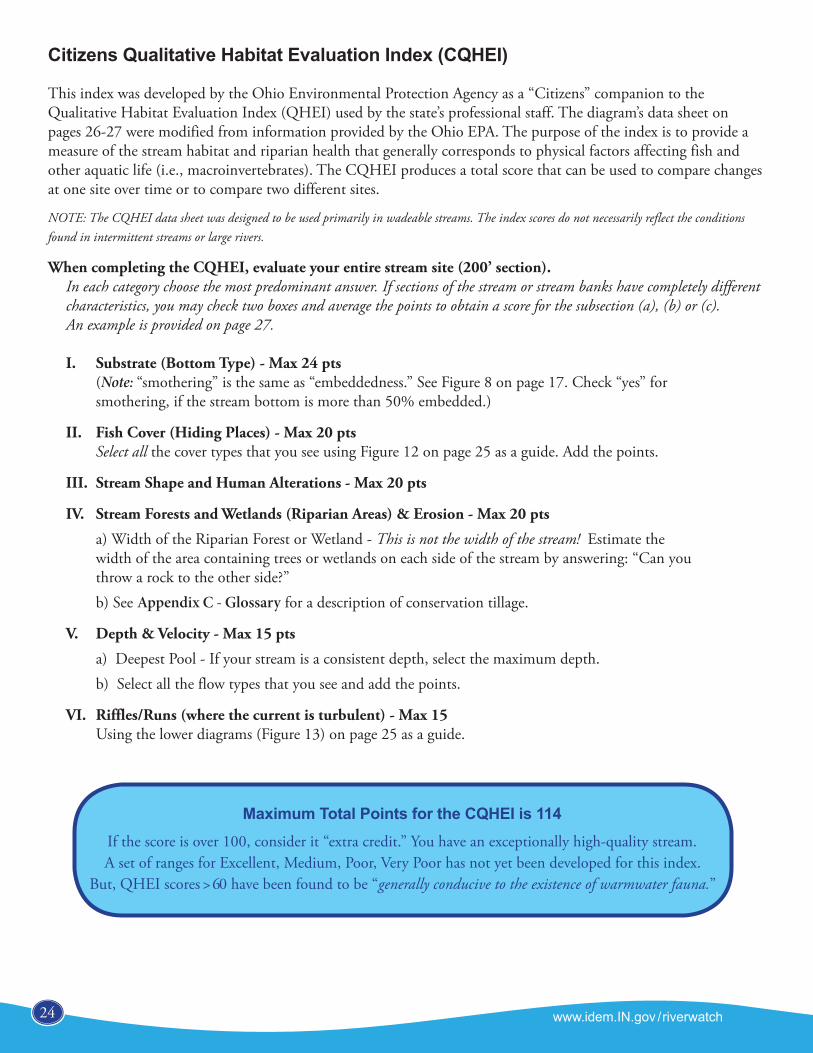
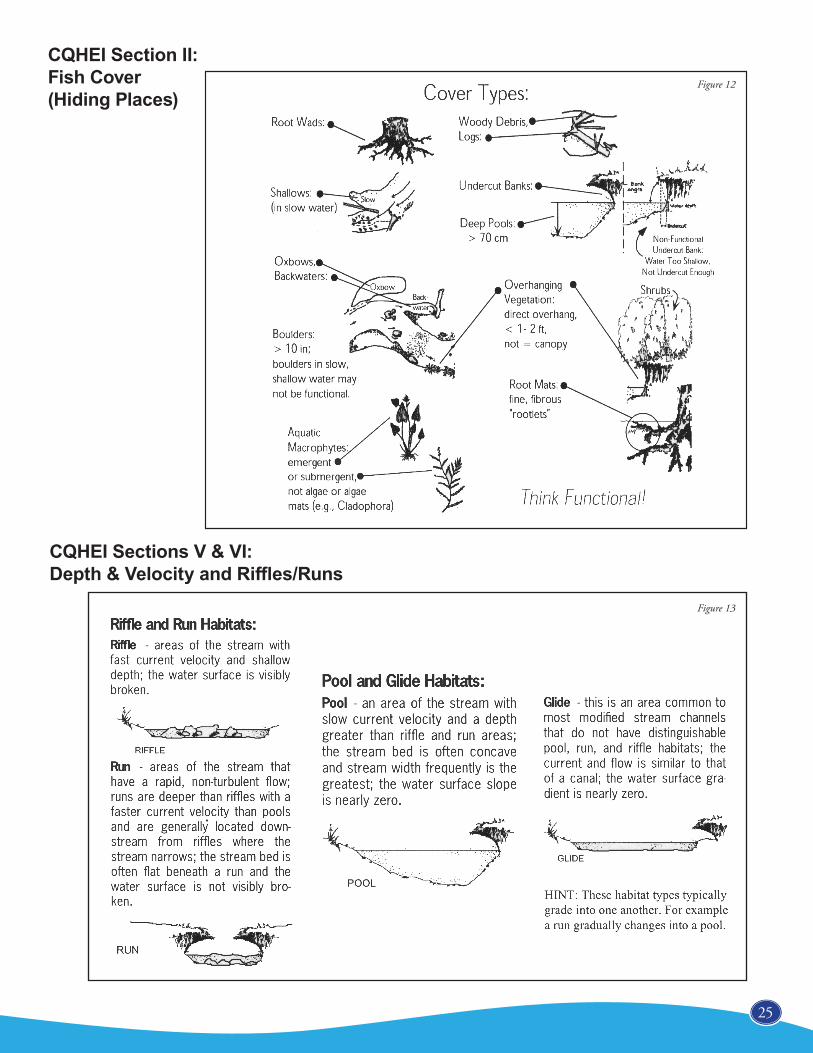
II. Fish Cover (Hiding Places) - Max 20 pts Select all the cover types that you see using Figure 12 on page 25 as a guide. Add the points.
III. Stream Shape and Human Alterations - Max 20 pts
IV. Stream Forests and Wetlands (Riparian Areas) & Erosion - Max 20 pts
a) Width of the Riparian Forest or Wetland - This is not the width of the stream! Estimate the width of the area containing trees or wetlands on each side of the stream by answering: “Can you throw a rock to the other side?”b) See Appendix C - Glossary for a description of conservation tillage.
V. Depth & Velocity - Max 15 pts
a) Deepest Pool - If your stream is a consistent depth, select the maximum depth.b) Select all the flow types that you see and add the points.
VI. Riffles/Runs (where the current is turbulent) - Max 15 Using the lower diagrams (Figure 13) on page 25 as a guide.
Maximum Total Points for the CQHEI is 114If the score is over 100, consider it “extra credit.” You have an exceptionally high-quality stream.A set of ranges for Excellent, Medium, Poor, Very Poor has not yet been developed for this index.
But, QHEI scores > 60 have been found to be “generally conducive to the existence of warmwater fauna.”
www.idem.IN.gov /riverwatch24
CQHEI Section II: Fish Cover (Hiding Places)
CQHEI Sections V & VI: Depth & Velocity and Riffles/Runs
Mostly Medium(Smaller than Fist,larger than Fingernail)
Mostly Very Fine (Not Coarse, Sometimes Greasy or Mucky)
Mostly Small (Smaller Than Fingernail, but Coarse, or Bedrock)
Symptoms: Hard to move pieces, often black on bottom.
5 pt
0 pt
Citizens Qualitative Habitat Evaluation Index (CQHEI)
I. SUBSTRATE (bottom type) Score:
II. FISH COVER (hiding places) - Add 2 Points For Each One Present Score:
III. STREAM SHAPE and HUMAN ALTERATIONS Score:
IV. STREAM FORESTS & WETLANDS (riparian area) & EROSION Score:
V. DEPTH & VELOCITY Score:
VI. RIFFLES/RUNS (areas where current is fast/turbulent, surface may be broken) Score:
a) “Curviness” or “Sinuousity” of Channel
a) Riparian Width Mostly:
b) Land Use - Mostly:
Underwater Tree Roots (Large)
Underwater Tree Rootlets (Small)
Shrubs/Small Trees Hang Over the Bank
Backwaters, Oxbows or Side Channels
Downed Trees, Logs, or Branches
Shallow, Slow Areas for Small Fish
Water Plants
Deep Areas (Chest Deep)
Undercut Banks
Boulders
14 pt
10 pt 0 pt
6 pt
2 pt
2 pt
2 pt
2 pt
2 pt
2 pt
2 pt
2 pt
b) “Smothering” Are Fist Size and Larger Pieces Smothered By Sands/Silts?
c) “Silting” Are Silts and Clays Distributed Throughout Stream?
5 pt
0 pt
Symptoms: Light kicking results in substantial clouding for more than a minute.
2 pt
2 pt
CQHEI Total
b) How Natural Is The Site?
c) Bank Erosion d) Stream Shading
8 pt
6 pt 0 pt
3 pt 12 ptMostly Natural
Very Straight1 or 2Good Bends
2 or More Good Bends
Mostly Straight Some Wiggle”
Few Minor Man-Made Changes (e.g., a bridge)
Many Man-Made Changes, but Some Natural Conditions left (e.g., trees, meanders)
Heavy, Man-made Changes (e.g., leveed or channelized)
9 pt 0 pt
6 pt
8 pt
0 pt
0 pt
0 pt
1 pt
1 pt
2 pt
2 pt
2 pt
3 pt
4 pt
5 pt
5 pt
8 pt
8 pt
a) Deepest Pool is At Least:
a) Riffles/Runs Are: b) Riffle/Run Substrates Are:
b) Check ALL The Flow Types That You See (Add Points):
None
Forest/Wetland
Shrubs
Overgrown Fields
Fenced Pasture
Park (Grass)
Conservation Tillage
Suburban
Urban/Industrial
Row Crop
Open Pasture
Combination of Stable and Eroding Banks
Stable Hard or Well-Vegetated Banks
Raw, Collapsing Banks
Very Fast: Hard to Stand in Current
0 pt
2 pt
4 pt
2 pt
0 pt
3 ptMostly
Partly
None
Moderate: Slowly Takes Object Downstream
Slow: Flow Nearly Absent
0 ptNone
1 pt
1 pt
Fast: Quickly Takes Object DownstreamDo Not Exist
Knee Deep
Waist Deep
Chest Deep
6 pt
4 pt
0 pt
6 pt
4 pt
0 pt
Ankle/Calf Deep and Fast
Knee Deep or Deeper and Fast
Ankle Deep or Less and Slow
Do Not ExistSmaller Than Fist Size, but Larger Than Fingernail
Fist Size or LargerSmaller Than YourFingernails or Do Not Exist
4 pt
7 pt 0 pt
2 pt
3 pt
Wide (Can’t throw a rock through it)
Narrow (can throw a rock through it)
Date: __/__/__ Volunteer ID: ____________ Site ID: ____________Stream Name: ______________________________________________________
No
Yes
No
Yes
27www.idem.IN.gov/riverwatch24
a) Size
Mostly Large(Fist Size or Bigger)
Mostly Medium(Smaller than Fist,larger than Fingernail)
Mostly Very Fine (Not Coarse, Sometimes Greasy or Mucky)
Mostly Small (Smaller Than Fingernail, but Coarse, or Bedrock)
Symptoms: Hard to move pieces, often black on bottom.
5 pt
0 pt
Citizens Qualitative Habitat Evaluation Index (CQHEI)
I. SUBSTRATE (bottom type) Score:
II. FISH COVER (hiding places) - Add 2 Points For Each One Present Score:
III. STREAM SHAPE and HUMAN ALTERATIONS Score:
IV. STREAM FORESTS & WETLANDS (riparian area) & EROSION Score:
V. DEPTH & VELOCITY Score:
VI. RIFFLES/RUNS (areas where current is fast/turbulent, surface may be broken) Score:
a) “Curviness” or “Sinuousity” of Channel
a) Riparian Width Mostly:
b) Land Use - Mostly:
Underwater Tree Roots (Large)
Underwater Tree Rootlets (Small)
Shrubs/Small Trees Hang Over the Bank
Backwaters, Oxbows or Side Channels
Downed Trees, Logs, or Branches
Shallow, Slow Areas for Small Fish
Water Plants
Deep Areas (Chest Deep)
Undercut Banks
Boulders
14 pt
10 pt 0 pt
6 pt
2 pt
2 pt
2 pt
2 pt
2 pt
2 pt
2 pt
2 pt
b) “Smothering” Are Fist Size and Larger Pieces Smothered By Sands/Silts?
c) “Silting” Are Silts and Clays Distributed Throughout Stream?
5 pt
0 pt
Symptoms: Light kicking results in substantial clouding for more than a minute.
2 pt
2 pt
CQHEI Total
b) How Natural Is The Site?
c) Bank Erosion d) Stream Shading
8 pt
6 pt 0 pt
3 pt 12 ptMostly Natural
Very Straight1 or 2Good Bends
2 or More Good Bends
Mostly Straight Some Wiggle”
Few Minor Man-Made Changes (e.g., a bridge)
Many Man-Made Changes, but Some Natural Conditions left (e.g., trees, meanders)
Heavy, Man-made Changes (e.g., leveed or channelized)
9 pt 0 pt
6 pt
8 pt
0 pt
0 pt
0 pt
1 pt
1 pt
2 pt
2 pt
2 pt
3 pt
4 pt
5 pt
5 pt
8 pt
8 pt
a) Deepest Pool is At Least:
a) Riffles/Runs Are: b) Riffle/Run Substrates Are:
b) Check ALL The Flow Types That You See (Add Points):
None
Forest/Wetland
Shrubs
Overgrown Fields
Fenced Pasture
Park (Grass)
Conservation Tillage
Suburban
Urban/Industrial
Row Crop
Open Pasture
Combination of Stable and Eroding Banks
Stable Hard or Well-Vegetated Banks
Raw, Collapsing Banks
Very Fast: Hard to Stand in Current
0 pt
2 pt
4 pt
2 pt
0 pt
3 ptMostly
Partly
None
Moderate: Slowly Takes Object Downstream
Slow: Flow Nearly Absent
0 ptNone
1 pt
1 pt
Fast: Quickly Takes Object DownstreamDo Not Exist
Knee Deep
Waist Deep
Chest Deep
6 pt
4 pt
0 pt
6 pt
4 pt
0 pt
Ankle/Calf Deep and Fast
Knee Deep or Deeper and Fast
Ankle Deep or Less and Slow
Do Not ExistSmaller Than Fist Size, but Larger Than Fingernail
Fist Size or LargerSmaller Than YourFingernails or Do Not Exist
4 pt
7 pt 0 pt
2 pt
3 pt
Wide (Can’t throw a rock through it)
Narrow (can throw a rock through it)
Date: ____/____/______ Volunteer ID: ____________ Site ID: ____________Stream Name: ____________________________________________________________
No
Yes
No
Yes
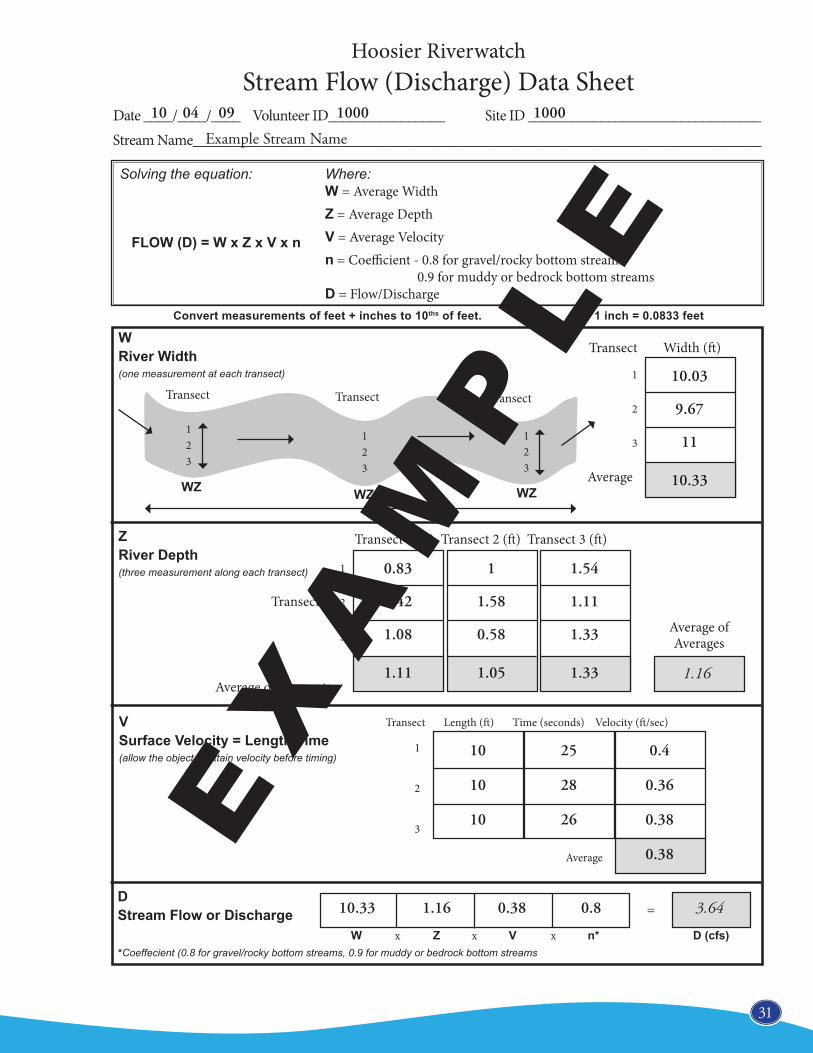
10 04 2009 1000 1000Example Stream Indiana
85.5
20
14
15
13.5
11
10
Average:4 pts
Average:3.5 pts
X
X X
X
X XXX X X
X X
X
X
X
X
XX
X
X
X X
EX
AM
PL
E
83.5
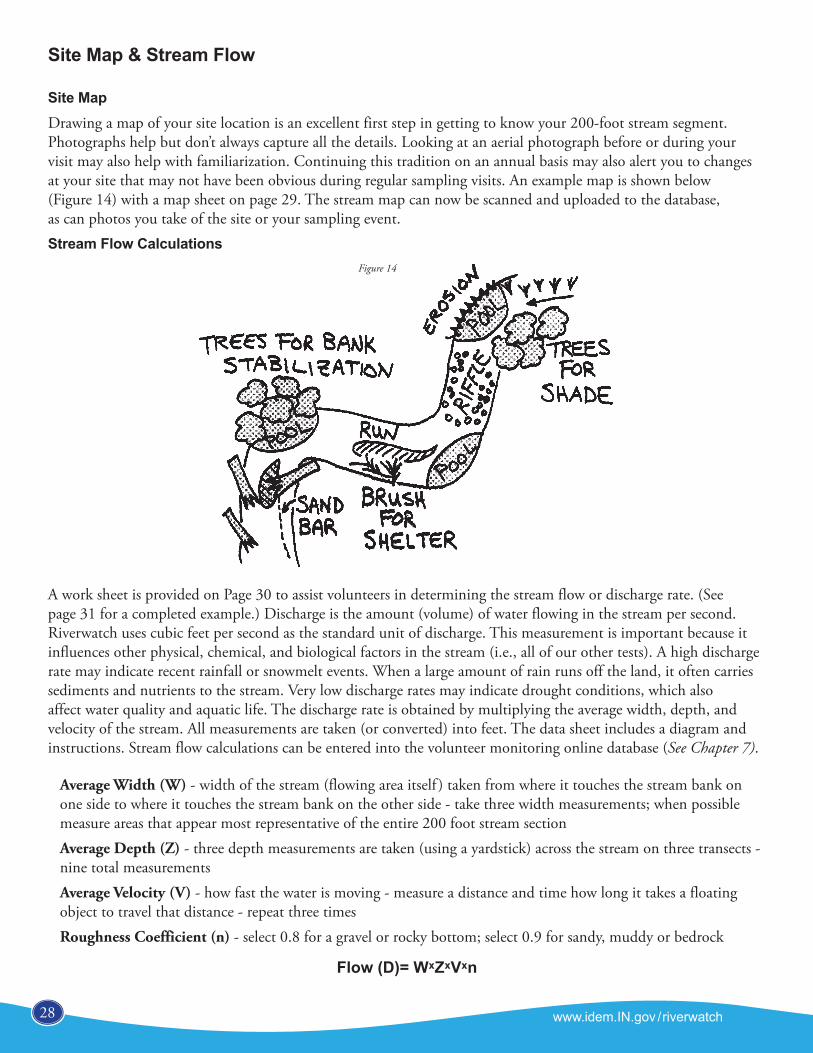
Site Map & Stream Flow
Site MapDrawing a map of your site location is an excellent first step in getting to know your 200-foot stream segment. Photographs help but don’t always capture all the details. Looking at an aerial photograph before or during your visit may also help with familiarization. Continuing this tradition on an annual basis may also alert you to changes at your site that may not have been obvious during regular sampling visits. An example map is shown below (Figure 14) with a map sheet on page 29. The stream map can now be scanned and uploaded to the database, as can photos you take of the site or your sampling event.Stream Flow Calculations
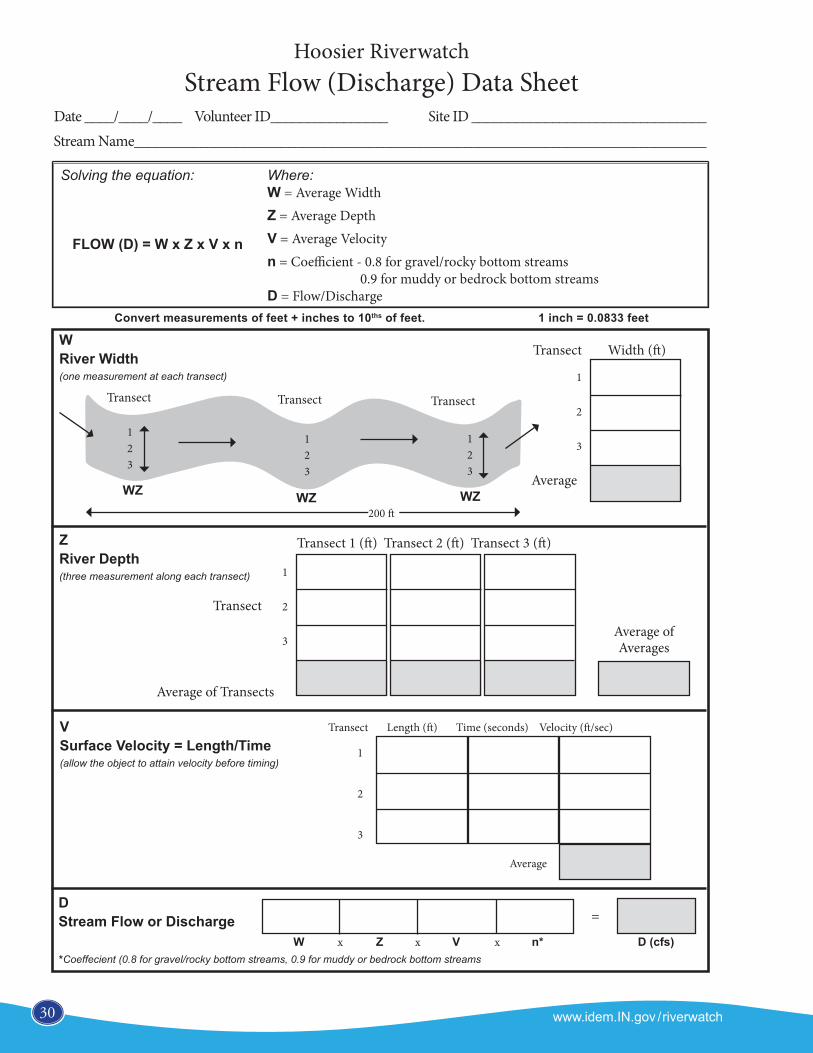
A work sheet is provided on Page 30 to assist volunteers in determining the stream flow or discharge rate. (See page 31 for a completed example.) Discharge is the amount (volume) of water flowing in the stream per second. Riverwatch uses cubic feet per second as the standard unit of discharge. This measurement is important because it influences other physical, chemical, and biological factors in the stream (i.e., all of our other tests). A high discharge rate may indicate recent rainfall or snowmelt events. When a large amount of rain runs off the land, it often carries sediments and nutrients to the stream. Very low discharge rates may indicate drought conditions, which also affect water quality and aquatic life. The discharge rate is obtained by multiplying the average width, depth, and velocity of the stream. All measurements are taken (or converted) into feet. The data sheet includes a diagram and instructions. Stream flow calculations can be entered into the volunteer monitoring online database (See Chapter 7).
Average Width (W) - width of the stream (flowing area itself ) taken from where it touches the stream bank on one side to where it touches the stream bank on the other side - take three width measurements; when possible measure areas that appear most representative of the entire 200 foot stream sectionAverage Depth (Z) - three depth measurements are taken (using a yardstick) across the stream on three transects - nine total measurementsAverage Velocity (V) - how fast the water is moving - measure a distance and time how long it takes a floating object to travel that distance - repeat three timesRoughness Coefficient (n) - select 0.8 for a gravel or rocky bottom; select 0.9 for sandy, muddy or bedrock
Convert measurements of feet + inches to 10ths of feet. 1 inch = 0.0833 feet
Hoosier Riverwatch Stream Flow (Discharge) Data Sheet
Date ____/____/____ Volunteer ID________________ Site ID ________________________________Stream Name______________________________________________________________________________
Solving the equation:
FLOW (D) = W x Z x V x n
Where: W = Average WidthZ = Average DepthV = Average Velocityn = Coefficient - 0.8 for gravel/rocky bottom streams
0.9 for muddy or bedrock bottom streams D = Flow/Discharge
WRiver Width(one measurement at each transect)
Transect Transect Transect
200 ft
WZ WZ WZ
123
123
123
Transect Width (ft)
1
2
3
Average
ZRiver Depth(three measurement along each transect)
VSurface Velocity = Length/Time(allow the object to attain velocity before timing)
DStream Flow or Discharge
*Coeffecient (0.8 for gravel/rocky bottom streams, 0.9 for muddy or bedrock bottom streamsW x Z x V x n* D (cfs)
Transect Length (ft) Time (seconds) Velocity (ft/sec)
1
2
3
Average
Transect 1 (ft) Transect 2 (ft) Transect 3 (ft)
1
2
3
Transect
Average of Transects
Average of Averages
=
31
www.idem.IN.gov/riverwatch 27
Convert measurements of feet + inches to 10ths of feet. 1 inch = 0.0833 feet
Hoosier Riverwatch Stream Flow (Discharge) Data Sheet
Date ____/____/____ Volunteer ID________________ Site ID ________________________________Stream Name______________________________________________________________________________
Solving the equation:
FLOW (D) = W x Z x V x n
Where: W = Average WidthZ = Average DepthV = Average Velocityn = Coefficient - 0.8 for gravel/rocky bottom streams
0.9 for muddy or bedrock bottom streams D = Flow/Discharge
WRiver Width(one measurement at each transect)
Transect Transect Transect
200 ft
WZ WZ WZ
123
123
123
Transect Width (ft)
1
2
3
Average
ZRiver Depth(three measurement along each transect)
VSurface Velocity = Length/Time(allow the object to attain velocity before timing)
DStream Flow or Discharge
*Coeffecient (0.8 for gravel/rocky bottom streams, 0.9 for muddy or bedrock bottom streamsW x Z x V x n* D (cfs)
Transect Length (ft) Time (seconds) Velocity (ft/sec)