Page 1
65
CHAPTER-3
MIX DESIGN AND STRENGTH PROPERTIES OF GPC
3.0 IMPORTANCE OF MIX DESIGN
Many parameters are involved in the production of GPC, out of
which alkaline liquid mineral admixtures ratio and superplasticiser are
important. Sulphonated Naphthalene based dispersing agents are
adopted as super plasticizers to obtain better mechanical properties of
GPC. Low calcium flyash gives better results from the point of view of
chemical composition. GGBS is used to fill the voids between flyash and
fine aggregate and this helps in the degree of particle aggregation, nature
and quantity of impurities and basic particle size. Sodium hydroxide and
sodium silicate solutions used as alkaline liquids react with flyash and
GGBS to form the geopolymer gel binding the aggregates to produce GPC.
The final product was cured in steam curing chamber at 60°C for 24
hours.
Based on review of literature, Rangan’s method [18] has been
adopted to produce M60 GPC. TVC mix design has been carried out
using Perumal’s method [112].
3.1 MATERIALS CHARACTERISTICS
3.1.1 Fly Ash
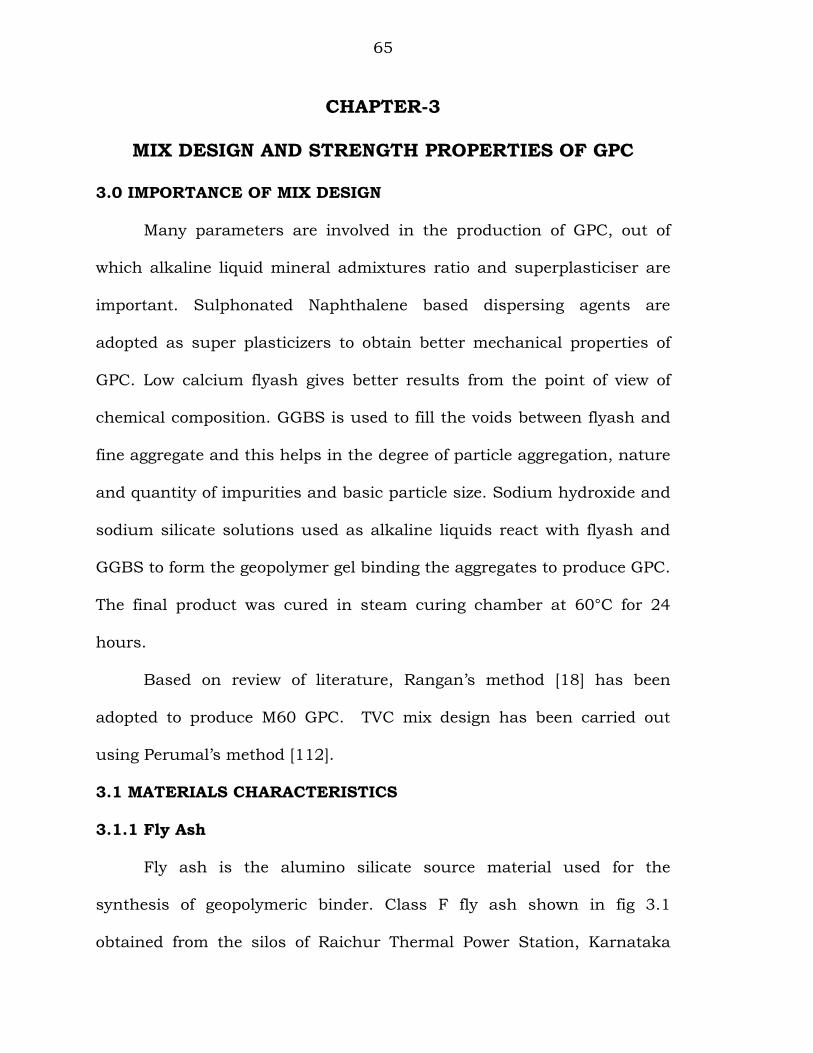
Fly ash is the alumino silicate source material used for the
synthesis of geopolymeric binder. Class F fly ash shown in fig 3.1
obtained from the silos of Raichur Thermal Power Station, Karnataka
Page 2
66
was used for the experimental work. The percentage of fly ash passing
through 45µm IS Sieve was found to be 95%. The physical characteristics
are as shown in table 3.1
Fig. 3. 1 - Low calcium Fly Ash (ASTM Class F)
Table 3. 1 - Physical Characteristics of Fly Ash
Properties Values
Specific gravity 2.40
Blaine’s fineness (m2 / kg) 439
3.1.2 Ground granulated blast furnace slag
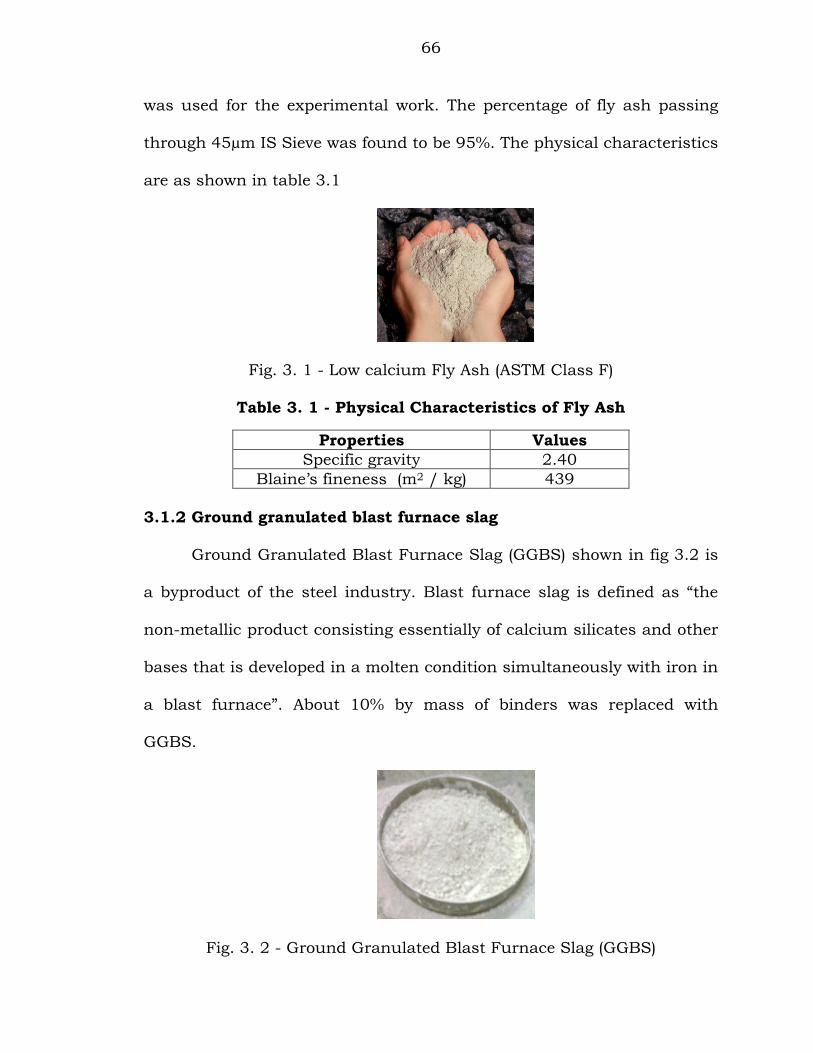
Ground Granulated Blast Furnace Slag (GGBS) shown in fig 3.2 is
a byproduct of the steel industry. Blast furnace slag is defined as “the
non-metallic product consisting essentially of calcium silicates and other
bases that is developed in a molten condition simultaneously with iron in
a blast furnace”. About 10% by mass of binders was replaced with
GGBS.
Fig. 3. 2 - Ground Granulated Blast Furnace Slag (GGBS)
Page 3
67
3.1.3 Coarse and Fine Aggregates
The fine aggregate used in the study was river sand and coarse
aggregate are crushed angular granite stone passing 12.5 mm sieve. The
sieve analysis of fine and coarse aggregate are shown in table 3.2 & 3.3
Table 3. 2 - Sieve Analysis Results of Fine Aggregate
Sieve size (mm)
Wt. retained
(gms)
Cum. % Wt.
retained
% Wt. passing
Specifications as per IS 383: 1993 [133] for % passing with different
zones
I II III IV
4.75 001 00.10 99.9 90 - 100 90 - 100 90 - 100 90 – 100
2.36 023 02.40 97.6 60 - 95 75 - 100 85 - 100 95 – 100
1.18 129 15.30 84.7 30 - 70 55 - 90 75 - 100 90 – 100
0.60 328 48.10 51.9 15 - 34 35 - 59 60 - 79 80 – 100
0.30 406 88.70 11.3 5 - 20 8 - 30 12 - 40 15 – 50
0.15 094 98.10 01.9 0 - 10 0 - 10 0 - 10 0 – 15
Table 3. 3 - Sieve Analysis Results of Coarse Aggregate
Sl. No
Sieve Size (mm)
Wt. Retained
% Wt. Retained
Cum. % Wt.
Retained
% Wt passing
Grading limits as per IS 383:
1993 [133]
1 20 0 0 0 100 100
2 12.5 200 4 4 96 90 – 100
3 10 1280 25.6 29.6 70.4 40 – 85
4 4.75 3200 64 93.6 6.4 0 – 10
Coarse and fine aggregate tested conforms to the specifications as
per IS 383: 1970 [110] with fine aggregate belonging to zone II as per the
specifications. The physical characteristics of coarse and fine aggregates
are shown in table 3.4 and 3.5
Table 3. 4 - Physical Characteristics of Coarse Aggregates
Sl. No. Specific Gravity
Fineness Modulus
Flakiness Index
Density (kg/m3)
Loose Rodded
1 2.65 7.04 28.3% 1373 1535
Page 4
68
Table 3. 5 - Physical characteristics of Fine Aggregates
Sl. No. Specific Gravity
Fineness Modulus
Flakiness Index
Density (kg/m3)
Loose Rodded
1 2.56 2.429 4.1% 1500 1675
3.1.4 Alkaline Liquids
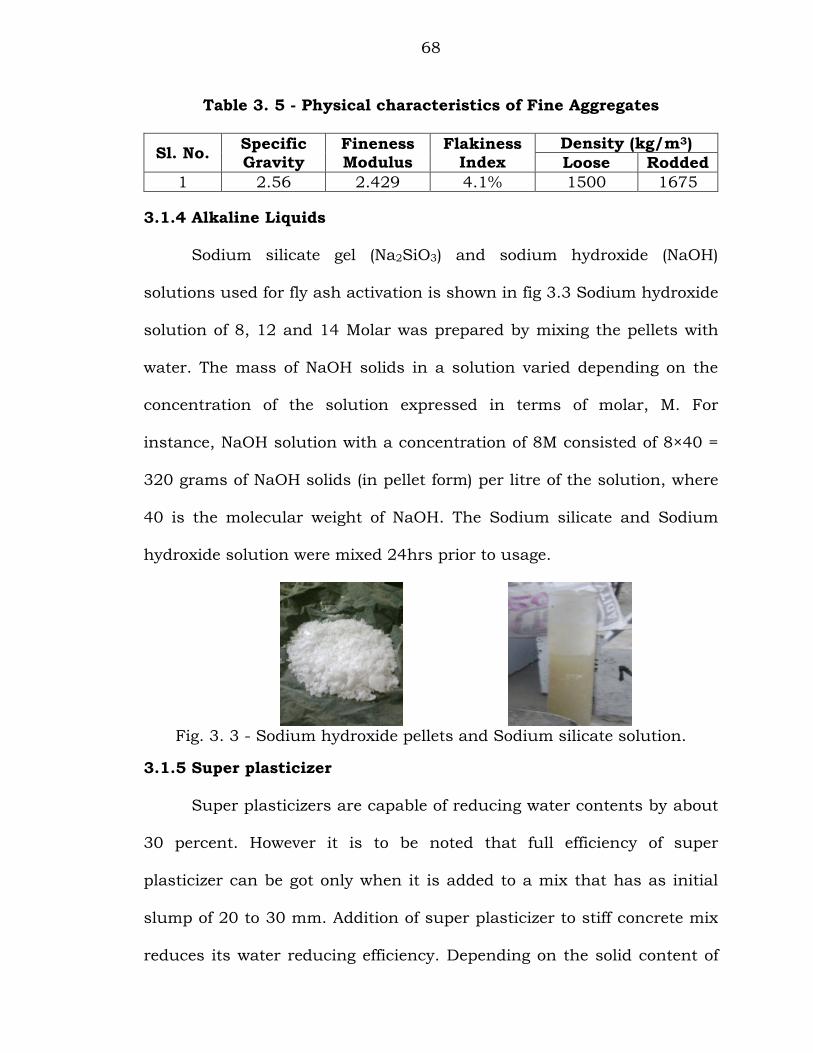
Sodium silicate gel (Na2SiO3) and sodium hydroxide (NaOH)
solutions used for fly ash activation is shown in fig 3.3 Sodium hydroxide
solution of 8, 12 and 14 Molar was prepared by mixing the pellets with
water. The mass of NaOH solids in a solution varied depending on the
concentration of the solution expressed in terms of molar, M. For
instance, NaOH solution with a concentration of 8M consisted of 8×40 =
320 grams of NaOH solids (in pellet form) per litre of the solution, where
40 is the molecular weight of NaOH. The Sodium silicate and Sodium
hydroxide solution were mixed 24hrs prior to usage.
Fig. 3. 3 - Sodium hydroxide pellets and Sodium silicate solution.
3.1.5 Super plasticizer
Super plasticizers are capable of reducing water contents by about
30 percent. However it is to be noted that full efficiency of super
plasticizer can be got only when it is added to a mix that has as initial
slump of 20 to 30 mm. Addition of super plasticizer to stiff concrete mix
reduces its water reducing efficiency. Depending on the solid content of
Page 5
69
the mix, a dosage of 1 to 3 percent by weight is recommended. For the
present investigation, a super plasticizer namely CONPLAST SP 430 has
been used for obtaining workable concrete at low a/m ratio. CONPLAST
SP 430 complies with IS 9103: 1999 [130] and BS: 5075 part 3 and
ASTM C 494, TYPE ‘B’ as a HR WRA. CONPLAST SP 430 is based on
Sulphonated naphthalene formaldehyde (NSF) condensates with chloride
content.
3.1.6 Water
Potable drinking water was used.
3.2 NORMAL CONCRETE
3.2.1 Cement
The cement used in the study is ordinary Portland cement (53
Grade) conforming to IS 12269: 1987 [131] with the physical
characteristics as shown in table 3.6
Table 3. 6 - Physical Characteristics of Cement
Properties Values
Specific gravity 3.07
Blaine’s fineness (m2 / kg) 310
3.2.2 Silica fume
Silica fume is a by-product of silicon metal or ferrosilicon alloy
production. 42 kg/m3 of silica fumes was used in M60 concrete.
Page 6
70
3.3 GPC MIX DESIGN AND EXPERIMENTAL DATA
3.3.1 Ingredients Required
The range of ingredients for M60 concrete based on Rangan’s [18]
Is listed below.
Fly ash – Low calcium (ASTM Class F)
GGBS – 10% of flyash
Ratio of Na2SiO3 Solution to NaOH Solution, by mass – 0.4 to 2.5
Molarity of NaOH Soln – 8M to 14M.
Alkaline liquid to Binders ratio – 0.3 and 0.45.
Aggregates – 75 to 80% of mass of concrete
Super plasticizer – 2.5 to 3% of flyash and GGBS
GPC mix design based on trial mix design and the following quantities
are arrived for M60 concrete as given in table 3.13
3.4 MIX DESIGN FOR TRADITIONALLY VIBRATED CONCRETE
PROCEDURE
3.4.1 Target Mean Strength
Target mean strength ������� is calculated as follows:
�������= fck + (t × s) with usual IS notations. When adequate data are not
available to establish, the fck value can be determined from the following
table 3.7 given by ACI report 318.
Page 7
71
Table 3. 7 - Target Mean Strength when Data are not available
to establish a Standard Deviation
Specified Characteristic Compressive Strength, fck (MPa)
Target mean Compressive
Strength,������� (MPa)
Less than 20.5 20.5 – 34.5
More than 34.5
fck + 6.9 fck + 8.3 fck + 9.7
3.4.2 Selection of maximum size of coarse aggregate
The maximum size of the coarse aggregate is selected from the
following table 3.8 as given by ACI Report 211.4R.93.
Table 3. 8 - Maximum Size of Coarse Aggregate
Characteristic Comp. Strength, fck (MPa)
Maximum aggregate size (mm)
Less than 62 Greater than or equal to 62
20 - 25 10 - 12.5
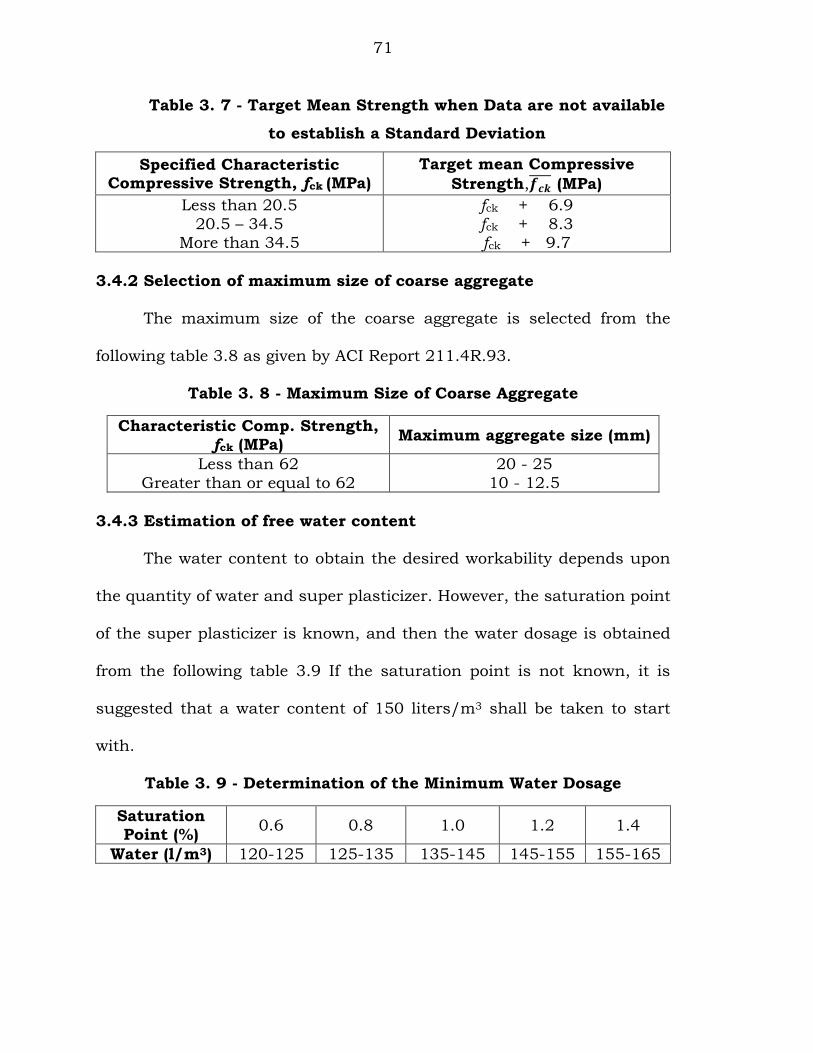
3.4.3 Estimation of free water content
The water content to obtain the desired workability depends upon
the quantity of water and super plasticizer. However, the saturation point
of the super plasticizer is known, and then the water dosage is obtained
from the following table 3.9 If the saturation point is not known, it is
suggested that a water content of 150 liters/m3 shall be taken to start
with.
Table 3. 9 - Determination of the Minimum Water Dosage
Saturation Point (%)
0.6 0.8 1.0 1.2 1.4
Water (l/m3) 120-125 125-135 135-145 145-155 155-165
Page 8
72
3.4.4 Super plasticizer dosage
The super plasticizer dosage is obtained from the dosage at the
saturation point. If the saturation point is not known, it is suggested that
a trial dosage of 1.0% shall be taken to start with.
3.4.5 Estimation of air content
The air content (approximate amount of entrapped air) is obtained
from the table 3.10 as given ACI Report 311.4R.93. However, it is
suggested that an initial estimate of entrapped air content shall be taken
as 1.5% or less, and then adjusting it on the basis of the result obtained
with the trial mix.
Table 3. 10 - Approximate Entrapped Air Content
Nominal maximum size of Coarse aggregate (mm)
Entrapped air, as percent of Volume of concrete
10 12.5 20 25
2.5 2.0 1.5 1.0
3.4.6 Selection of coarse aggregate content
The coarse aggregate content is obtained from the table 3.11 as a
function of the particle shape. If there is any doubt about the shape of
the CA or if its shape is not known, it is suggested that a CA content of
1050 kg/m3 shall be taken to start with. The CA so selected should
satisfy the requirements of grading and other requirements of IS 383:
1970 [110].
Page 9
73
Table 3. 11 - Coarse Aggregate Content
CA Particle shape
Elongated or Flat
Average Cubic Rounded
CA Dosage (kg/m3)
950-1000 1000-1050 1050-1100 1100-1150
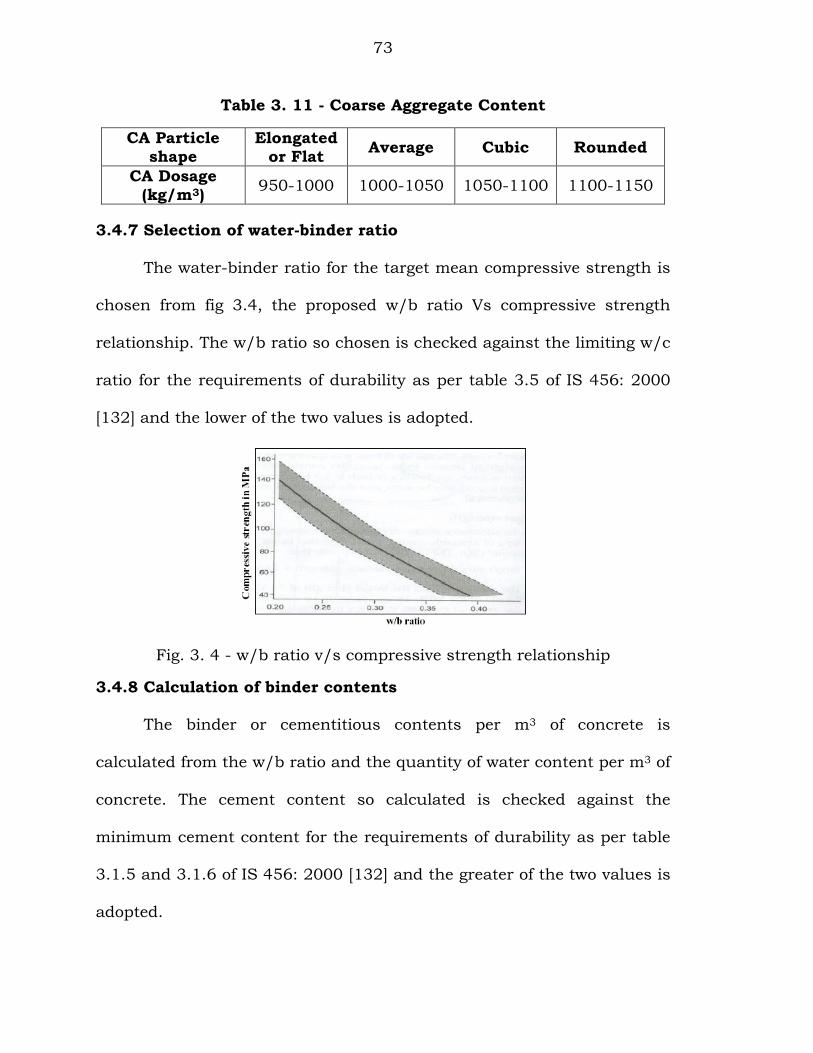
3.4.7 Selection of water-binder ratio
The water-binder ratio for the target mean compressive strength is
chosen from fig 3.4, the proposed w/b ratio Vs compressive strength
relationship. The w/b ratio so chosen is checked against the limiting w/c
ratio for the requirements of durability as per table 3.5 of IS 456: 2000
[132] and the lower of the two values is adopted.
Fig. 3. 4 - w/b ratio v/s compressive strength relationship
3.4.8 Calculation of binder contents
The binder or cementitious contents per m3 of concrete is
calculated from the w/b ratio and the quantity of water content per m3 of
concrete. The cement content so calculated is checked against the
minimum cement content for the requirements of durability as per table
3.1.5 and 3.1.6 of IS 456: 2000 [132] and the greater of the two values is
adopted.
Page 10
74
3.4.9 Estimation of fine aggregate content
The absolute volume of FA is obtained from the following equation:
Vfa = 1000 - [Vw + (Mc / Sc) + (Msf / Ssf) + (Mca / Sca) + Vsol + Vea]
Where,
Vfa = absolute volume of FA in liters per m3 of concrete
Vw = volume of water (liters) per m3 of concrete
Mc = mass of cement (kg) per m3 of concrete
Sc = specific gravity of cement
Msf, Mca = Total masses of the SF and CA (kg) per m3 of concrete
respectively
Sca, Ssf = specific gravities of saturated surface dry coarse aggregate
and silica fume respectively, and
Vea = Volume of the entrapped air (liters) per m3 of concrete
respectively.
The fine aggregate content per unit volume of concrete is obtained
by multiplying the absolute volume of fine aggregate and the specific
gravity of the fine aggregate.
3.4.10 Moisture Adjustments
The actual quantities of CA, FA and water content are calculated
after allowing necessary corrections for water absorption and free
(surface) moisture content of aggregates. The volume of water included in
the liquid super plasticizer is calculated and subtracted from the initial
mixing water.
Page 11
75
3.4.11 Unit Mass of Concrete
The mass of concrete per unit volume was calculated by adding the
masses of the concrete ingredients. Trial mixes were done to obtain
mixes having suitable consistency and workability. The results of the
trials are indicated in table 3.12 for GPC mix 2 was adopted and the final
proportions for M60 is indicated in table 3.13 (GPC and TVC).
Table 3. 12 – Trial Mixes (GPC)
Materials
Mass, kg/m3
Mix1, Al/Fa=0.3
Mix2, Al/Fa=0.35
Mix3, Al/Fa=0.4
Mix4, Al/Fa=0.45
Coarse aggregates 1295 1295 1295 1295
Fine sand 555 555 555 555
Fly ash 382 366 355 342
GGBS 42 40 39 38
Na2SiO3 solution 90 103 112 122
NaOH solution 36 41 44 48
Super plasticizer 3% 3% 3% 3%
Extra water 3% 3% 3% 3%
Table 3. 13 – Mix proportion for M60 concretes
GPC TVC Materials
Cement kg/m3 - 375
Fly ash kg/m3 366 -
GGBS kg/m3 40 -
Silica fume kg/m3 - 42
Coarse aggregate kg/m3 1295 1050
Fine aggregate kg/m3 555 716
NaOH solution (8M) kg/m3 41 - Na2SiO3 solution kg/m3 103 - Water l/m3 16.24 150
Super plasticizer (%) 3 2.5
The present investigation shows that high strength GPC mix
proportioning can be done on similar guide lines given by Rangan’s
method. Further investigations are to be carried out to validate the
Page 12
76
author investigation for generality of the Rangan’s method for all grades
of geopolymer concrete.
3.5 PRODUCTION METHODOLOGY
3.5.1 Introduction
Fly ash-based geopolymer concrete using low calcium (ASTM Class
F) requires trial and error process was used. The focus of the study is to
identify the salient parameters that influence the mix proportions and
the properties of GPC. The current practice used in the manufacture and
testing of TVC was followed.
In order to simplify the development process compressive strength
is selected as the benchmark parameter. This is not unusual because
compressive strength has an intrinsic importance in the structural
design of concrete structures.
3.5.2. Materials for GPC and TVC
The material for GPC and TVC described in article 3.1
3.6 SPECIMEN PREPARATION
Six cubical moulds of size 100mm, six cylindrical moulds of size
100×200mm and six prisms of size 75×75×450mm were used to prepare
specimen of GPC and TVC.
3.7 MIXING
3.7.1 Geopolymer Concrete
Fly ash, GGBS and aggregates were mixed dry in the 100 kg
capacity pan mixer for 3 minutes. The alkaline solution that was
Page 13
77
prepared one day prior with super plasticizer and extra water were added
into the blend and mixed for 4 minutes.
3.7.2 Test on Fresh Concrete
The fresh fly ash-based geopolymer concrete was light in colour
and shiny in appearance (fig 3.5). The mixtures were usually cohesive.
The workability of both geopolymer and traditionally vibrated concrete
were measured by means of the conventional slump test.
Fig. 3. 5 - Slump test on fresh concrete to assess the workability 3.7.3 Casting
The fresh concrete was then cast into standard cylindrical moulds,
cubes and prisms, which was compacted using vibrating table are shown
in figs 3.6 to 3.8
Fig. 3. 6 - Concrete being poured to a tray
Fig. 3. 7 - Moulds on vibrating table
Page 14
78
Fig. 3. 8 - Concrete in moulds after compaction
3.7.4 Curing
After demoulding GPC specimens were then transferred to a steam
curing chamber, having a temperature of 60°C inside the chamber for 24
hours. A boiler was used to produce the steam, which was let in to the
chamber (fig 3.9). At the end of the curing regime, the specimens were
allowed to cool in air, kept in open till the day of testing.
TVC specimens were demoulded after 24 hours and cured in water
pond till the day of testing.
Fig. 3. 9 - Steam Boiler with curing chamber
Page 15
79
3.8 STRENGTH STUDIES
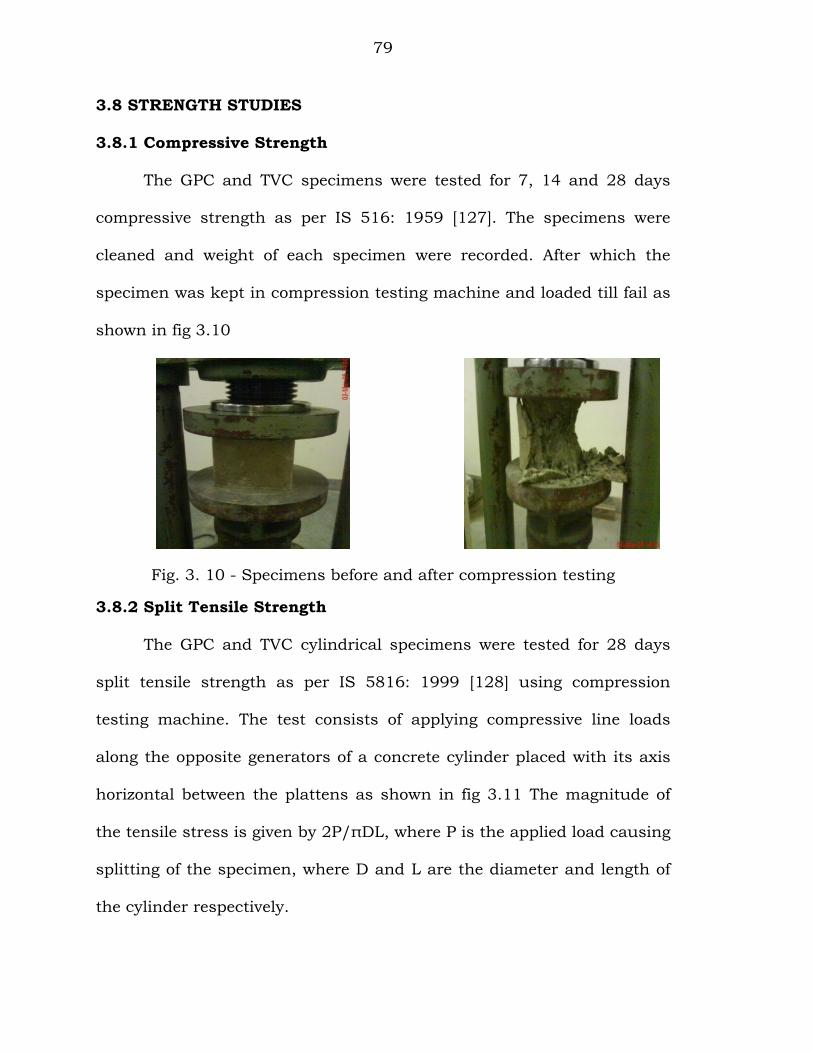
3.8.1 Compressive Strength
The GPC and TVC specimens were tested for 7, 14 and 28 days
compressive strength as per IS 516: 1959 [127]. The specimens were
cleaned and weight of each specimen were recorded. After which the
specimen was kept in compression testing machine and loaded till fail as
shown in fig 3.10
Fig. 3. 10 - Specimens before and after compression testing
3.8.2 Split Tensile Strength
The GPC and TVC cylindrical specimens were tested for 28 days
split tensile strength as per IS 5816: 1999 [128] using compression
testing machine. The test consists of applying compressive line loads
along the opposite generators of a concrete cylinder placed with its axis
horizontal between the plattens as shown in fig 3.11 The magnitude of
the tensile stress is given by 2P/πDL, where P is the applied load causing
splitting of the specimen, where D and L are the diameter and length of
the cylinder respectively.
Page 16
80
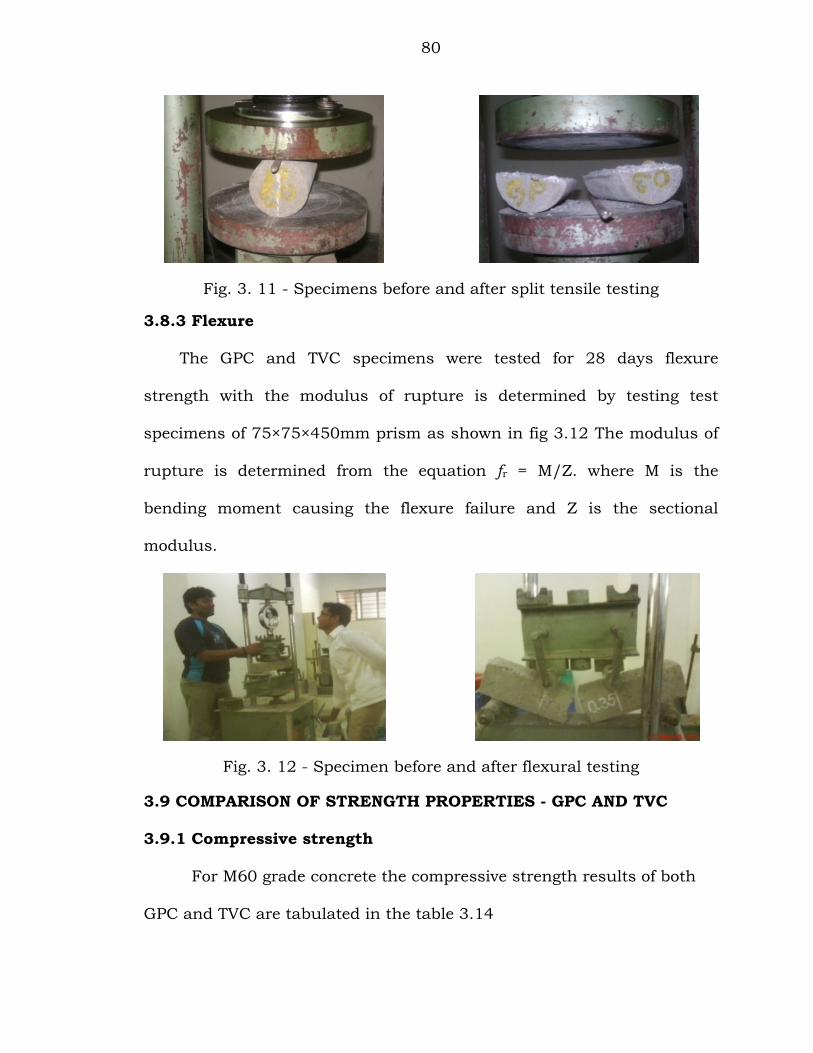
Fig. 3. 11 - Specimens before and after split tensile testing
3.8.3 Flexure
The GPC and TVC specimens were tested for 28 days flexure
strength with the modulus of rupture is determined by testing test
specimens of 75×75×450mm prism as shown in fig 3.12 The modulus of
rupture is determined from the equation fr = M/Z. where M is the
bending moment causing the flexure failure and Z is the sectional
modulus.
Fig. 3. 12 - Specimen before and after flexural testing
3.9 COMPARISON OF STRENGTH PROPERTIES - GPC AND TVC
3.9.1 Compressive strength
For M60 grade concrete the compressive strength results of both
GPC and TVC are tabulated in the table 3.14
Page 17
81
Table 3. 14 - Compressive strengths for GPC and TVC
Days GPC (MPa) TVC (MPa)
7 72 26
14 81 59
28 88 85
3.9.2 Split tensile strength
For M60 grade concrete the split tensile strength results of both
GPC and TVC are tabulated in the tables 3.15 & 3.16
Table 3. 15 - Split tensile strength values GPC
Tensile load (kN) Splitting tensile strength (MPa)
120 3.82
120 3.82
80 2.55
120 3.82
120 3.82
110 3.50
Average 3.55
Table 3. 16 - Split tensile strength values TVC
Tensile load (kN) Splitting tensile strength (MPa)
150 4.77
140 4.46
130 4.14
140 4.46
150 4.77
140 4.46
Average 4.51
3.9.3 Flexural strength
For M60 grade concrete the flexural strength results of both GPC and
TVC are tabulated in the tables 3.17 & 3.18 according to IS 456 [132].
Page 18
82
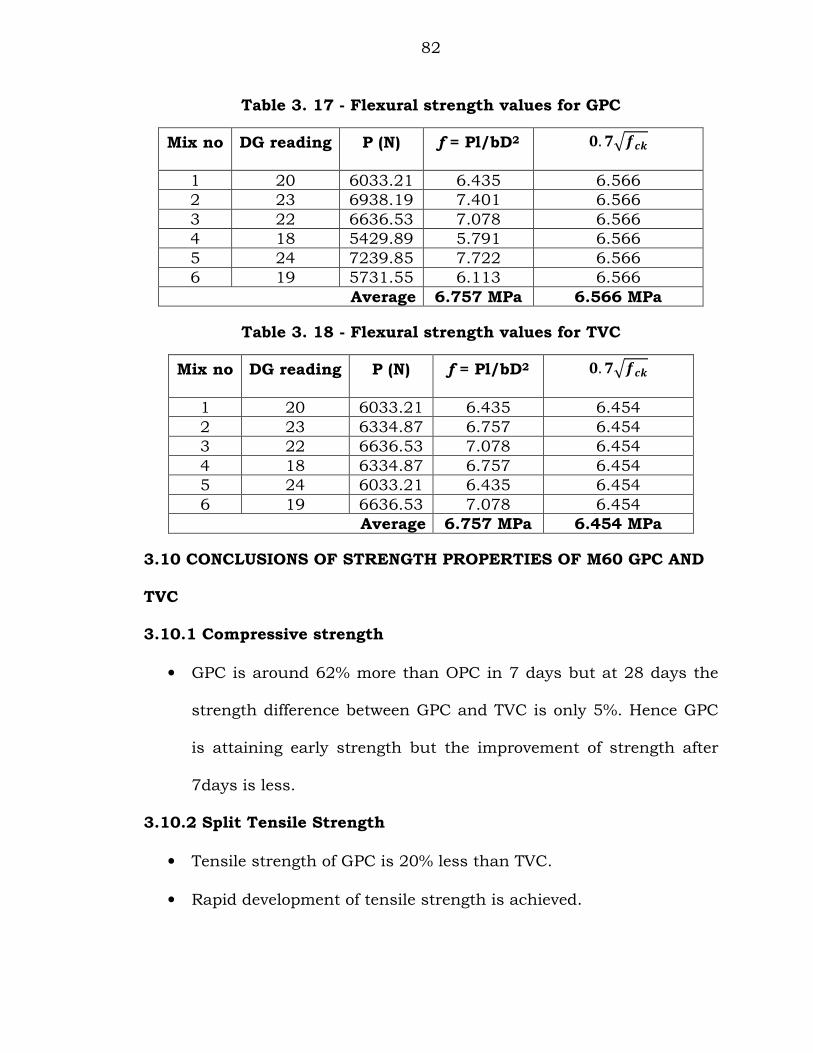
Table 3. 17 - Flexural strength values for GPC
Mix no DG reading P (N) f = Pl/bD2 . �����
1 20 6033.21 6.435 6.566
2 23 6938.19 7.401 6.566
3 22 6636.53 7.078 6.566
4 18 5429.89 5.791 6.566
5 24 7239.85 7.722 6.566
6 19 5731.55 6.113 6.566
Average 6.757 MPa 6.566 MPa
Table 3. 18 - Flexural strength values for TVC
Mix no DG reading P (N) f = Pl/bD2 . �����
1 20 6033.21 6.435 6.454
2 23 6334.87 6.757 6.454
3 22 6636.53 7.078 6.454
4 18 6334.87 6.757 6.454
5 24 6033.21 6.435 6.454
6 19 6636.53 7.078 6.454
Average 6.757 MPa 6.454 MPa
3.10 CONCLUSIONS OF STRENGTH PROPERTIES OF M60 GPC AND
TVC
3.10.1 Compressive strength
• GPC is around 62% more than OPC in 7 days but at 28 days the
strength difference between GPC and TVC is only 5%. Hence GPC
is attaining early strength but the improvement of strength after
7days is less.
3.10.2 Split Tensile Strength
• Tensile strength of GPC is 20% less than TVC.
• Rapid development of tensile strength is achieved.
Page 19
83
It is true that geopolymer concrete which performs better in
compressive strength should have performed in a better way also in split
tensile strength as available in the literature. More tests are required to
throw light on this so that split tensile strength can be correlated with
the corresponding compressive strength.
3.10.3 Flexural strength
• There is no much variation in experimental and theoretical values
of flexural stress.
• There was no much difference found in Flexural stresses of GPC
and TVC.


![Investigation of the compressive strength of various mix ... … · Mix Design For M20 Concrete The mix design of M20 concrete is conducted according to the ACI guidelines [ACI-211]](https://static.documents.pub/doc/80x56/5eab2e407cebb26ffc43b9de/investigation-of-the-compressive-strength-of-various-mix-mix-design-for-m20.jpg)


