32 CHAPTER 3 NEAR-DRY WEDM EXPERIMENTAL SETUP AND EXPLORATORY EXPERIMENTATION 3.1 NEAR-DRY WEDM SETUP 3.1.1 WEDM Machine Specification The near-dry WEDM experiments were carried out on a wire-cut electrical discharge machine (Model-DK7720CH) installed in the Special Machine Shop of Mechanical Engineering Department, Bannariamman Institute of Technology, Erode, Tamil Nadu, India (Figure 3.1). This machine consists of X-Y coordinate worktable, U-V auxiliary table, wire running system, wire frame, Microcomputer based control cabinet and liquid dielectric supply system. Here, the existing liquid dielectric supply system was replaced by a near-dry hydro-pneumatic dielectric system. The work piece is mounted on the X-Y direction moving work table with the help of clamps and bolts. The anode is connected with the work table and cathode is connected with a wire tool by the graphite contacts. The micro controller delivers the pulse signals to the servo motors which rotate accordingly through adjustable gears, lead screws and nuts. The motions are transmitted to the worktable for performing the cutting operations. The important specifications of WEDM machine used in the experiment are given below. Design : Fixed Column, Moving table Table Size : 280 mm × 420 mm
Transcript
32
CHAPTER 3
NEAR-DRY WEDM EXPERIMENTAL SETUP AND
EXPLORATORY EXPERIMENTATION
3.1 NEAR-DRY WEDM SETUP
3.1.1 WEDM Machine Specification
The near-dry WEDM experiments were carried out on a wire-cut
electrical discharge machine (Model-DK7720CH) installed in the Special
Machine Shop of Mechanical Engineering Department, Bannariamman
Institute of Technology, Erode, Tamil Nadu, India (Figure 3.1). This machine
consists of X-Y coordinate worktable, U-V auxiliary table, wire running
system, wire frame, Microcomputer based control cabinet and liquid dielectric
supply system. Here, the existing liquid dielectric supply system was replaced
by a near-dry hydro-pneumatic dielectric system. The work piece is mounted
on the X-Y direction moving work table with the help of clamps and bolts.
The anode is connected with the work table and cathode is connected with a
wire tool by the graphite contacts. The micro controller delivers the pulse
signals to the servo motors which rotate accordingly through adjustable gears,
lead screws and nuts. The motions are transmitted to the worktable for
performing the cutting operations. The important specifications of WEDM
tools, metal saws, milling tools of all types, wood-working tools and cold
work tools. The die steel plate was preheated to a temperature of 850 C and
thoroughly soaked then heated up to 1250 C followed by quenching into the
oil bath to obtain a final hardness of 60 HRC. The chemical composition of
this material as obtained by Electro Dispersive X-ray Spectroscopy test is
given in Table 3.1. The M2-HSS tool material is shown in Figure 3.3.
Figure 3.3 M2- High Speed Steel as a work material
3.1.4 Near-Dry Dielectric System
A hydro-pneumatic circuit has been constructed to perform the near-
dry WEDM process in the existing WEDM which was originally designed for
liquid dielectric only. It is used to mix the minimum quantity of
37
demineralized water with compressed air or oxygen gas. The unit has been
designed to control the pressure of air or oxygen gas and provide the required
flow rate of mixing water to perform the near-dry WEDM. Additionally, the
entire system is attached to existing WEDM machine. The hydro-pneumatic
circuit for the near-dry WEDM process is shown in Figure 3.4. The near-dry
WEDM experimental setup is shown in Figure 3.5. The main components of
the hydro-pneumatic circuit are given below.
(i) Air/Oxygen gas supply unit
(ii) Minimum quantity water unit
(iii) Air mist/oxygen-mist unit
Figure 3.4 Hydro-pneumatic circuit for near-dry WEDM process
38
Figure 3.5 Near-dry WEDM experimental setup
Figure 3.6 Filter-Regulator-Lubricator unit
39
(i) Air/Oxygen gas supply unit
Air/Oxygen gas supply unit consists of an air compressor, reservoir,
FRL (Filter-Regulator-Lubricator) unit, hoses, pressure gauges and oxygen
cylinder. The compressed air coming from a centrifugal air compressor is
stored in a reservoir of 350 liter capacity. The working pressure of
compressor is 150 psi. FRL unit is used to supply the clean air with certain
pressure (Figure 3.6). It can adjust the pressure from 1 to 16 kg/cm2. The
lubrication oil has not been used for the experiment. The hoses are used to
supply the air from the FRL unit to the hydro-pneumatic system.
Air-mist dielectric unit is shown in Figure 3.7. It was used to
provide the pressurized air mixing with a minimum quantity of water. Air
pressure can be controlled by FRL unit and monitored by a pressure gauge. 1
to 12 kg/cm2 range of air pressure can be adjusted by FRL unit.
Figure 3.7 Air-mist dielectric unit
Oxygen-mist dielectric unit consists of an oxygen cylinder, pressure
regulator and a pressure gauge as shown in the Figure 3.8 and 3.9. Oxygen-
mist near-dry WEDM experiments are conducted using the oxygen gas. The
pure oxygen from the separate cylinder is used to mix with the water. A
40
pressure regulator is used to adjust the oxygen pressure from 1 to 10 kg/cm2.
In the oxygen cylinder, two pressure gauges were used, one for indicating the
cylinder gas pressure and another for monitoring the outlet gas pressure from
the cylinder.
Figure 3.8 Oxygen-mist dielectric unit
Figure 3.9 Oxygen gas inlet setup
41
(ii) Minimum quantity water unit
Minimum Quantity Water (MQW) unit consists of a small water
tank of two liter capacity, FRL unit, flow control valve, check valve and
pressure gauge. The demineralized water is partially filled in the tank. The
compressed air into the tank can be controlled by FRL unit and it is monitored
by a pressure gauge. The water flow is initially adjusted by a flow control
valve in the outlet. The check valve is used to control the back flow of water
from the tank. By adjusting the inlet pressure and flow control valve, flow
rate of water to the system can be controlled. The flow rate of mixing water
with air has been measured by the amount of water collected in a vessel with
respect to time using a digital stopwatch. Before starting the every
experiment, the flow rate of water was verified and then experiment
conducted. The circuit has the capability of controlling the water flow rate
from 2 to 20 ml/min. This flow rate was constantly maintained up to
completion of every experiment. The water flow rate versus air inlet pressure
is given in Table 3.2. Table data were initially calibrated by a digital flow
meter.
Figure 3.10 Air-mist / Oxygen-mist unit
42
Table 3.2 Air pressure versus water flow rate
Air Pressure
kg/cm2
Flow Rate
ml/min
Air Pressure
kg/cm2
Flow Rate
ml/min
1.0 2.0 2.8 11.0
1.1 2.5 2.9 11.5
1.2 3.0 3.0 12.0
1.3 3.5 3.1 12.5
1.4 4.0 3.2 13.0
1.5 4.5 3.3 13.5
1.6 5.0 3.4 14.0
1.7 5.5 3.5 14.5
1.8 6.0 3.6 15.0
1.9 6.5 3.7 15.5
2.0 7.0 3.9 16.5
2.1 7.5 4.0 17.0
2.2 8.0 4.1 17.5
2.3 8.5 4.2 18.0
2.4 9.0 4.3 18.5
2.5 9.5 4.4 19.0
2.6 10.0 4.5 19.5
2.7 10.5 4.6 20.0
(iii) Air-mist/Oxygen-mist unit
Air-mist/oxygen-mist unit comprises a coaxial hose connector, a
coaxial tube and a nozzle. The hose connector was used to connect the
air/oxygen gas inlet hose and MQW unit hose with the coaxial hoses. The two
43
separate hoses (coaxial) of 8 mm and 3 mm diameter are used to pass the
air/gas and water respectively. The 3 mm inner diameter of the hose is
directly connected with the water hose in the MQW unit. The 8 mm outer
hose is connected to a hose from air/gas supply unit using bi-axial connector
as shown in Figure 3.10. The end of the bi-axial hose is connected to the
2 mm outlet diameter of a nozzle. The inside tube is 2 mm lengthy than the
outer tube in the nozzle to avoid the back pressure in the water tube. Gas/air
and minimum quantity of water were mixed together at the inlet to the nozzle.
This unit was closely fitted with the cutting gap between the wire tool and
work piece. During the experiment, the nozzle was fixed in the direction of
the wire tool. Thus, this unit was employed to provide the eco-friendly
machining environment with sufficient cooling and flushing effect on the
cutting zone.
3.2. EXPERIMENTAL PROCEDURE
Several controllable parameters such as the spark current, pulse
width, inlet air/gas pressure, pulse interval, mixing water flow rate and wire
travelling speed had initially been considered. However, other parameters
which may effect on the outputs have not been studied. Some of these may be
beyond our control (such as environmental conditions: room temperature and
humidity). However, it may be possible to control some of them (such as anti-
arc sensitivity and short circuit sensitivity). During the experiments, it is
essential to keep such parameters at some pre-set values so that data obtained
from different runs are comparable. To ensure this, the minimum standards
have been maintained throughout the experiments and necessary precautions
are taken. In this research, five stages of experiments are performed and
shown in Figure 3.11.
44
Figure 3.11 Different phases of near-dry WEDM experiment
Following steps were followed during the near-dry WEDM
experiments.
1) The wire tool was wound onto the rotating drum and vertical
guide ways.
2) The work piece was mounted and clamped to the work table.
The wire is connected to cathode and work table is connected
to anode using graphite material.
3) The work piece was positioned near the wire tool. A reference
point on the work piece was set. The programming was done
with respect to a reference point.
4) The program was made for cutting operation of the work piece
and a profile of 5 mm × 5 mm square was cut to total length of
20 mm.
Exploratory Experiments using air-mist dielectric fluid to select the parameters and their ranges
Air-mist and Oxygen-mist near dry Experiments using Taguchi Method to find the significant parameters
Oxygen-mist Near-dry Experiments using Response surface method to develop the mathematical models
Confirmation Experiments to evaluate the results obtained from Taguchi method and multi-objective optimization
Comparative Study Experiments using atmosphere air, compressed air, oxygen gas, air-mist and oxygen-mist as a dielectric medium
Experiment- I
Experiment- II
Experiment- III
Experiment- IV
Experiment- V
45
5) The uniform water flow rate of air-mist /oxygen-mist to the
cutting zone was maintained for the each experiment by
adjusting the pressure in the hydro-pneumatic circuit
(Figure 3.4). While adjusting the inlet air pressure to the water
tank, the flow rate of mixing water with the air/oxygen gas
could be controlled. Before conducting each experiment, the
flow rate was verified with respect to time.
6) The input gap voltage of 100 V was maintained for all
experimentations because of the availability of 75 and 100 V.
It was observed from OVAT approach that the machining
performance of near-dry WEDM is good at the 100V.
7) The time taken to cut 20 mm length was noted. Then, the
material removal rate (mm3/min) was calculated using the
Equation 3.1.
8) After conducting all the experiments, the surface roughness
(µm) is calculated using a surface tester.
Following precaution measures were made while performing the
experiments.
1) Before doing the experiments, whether the air-mist/gas-mist
from the hydro-pneumatic circuit is uniformly flowing or not.
If not, the pressure of air into the water tank and the gas/air
supply unit pressure were adjusted accordingly. The inlet
pressure of air or oxygen gas has carefully maintained
throughout the experiment. Oxygen cylinder was placed in the
safe place to avoid the fire problem.
46
2) Replications of experiments were conducted in random order
to avoid the bias of the results.
3) Totally, three sets of trial experiments were conducted to
reduce experimental errors.
4) Each experiment was conducted in the normal room
temperature (30 ± 2 C).
5) Before taking surface roughness measurements, the work
piece was cleaned with acetone only.
3.3 RESPONSE PARAMETERS
3.3.1 Material Removal Rate
The material removal rate is one of the desirable characteristics and
it should be higher to increase the productivity to reduce machining cycle
time. It refers to the volume of material removed from the work piece per unit
time. In the present study, MRR was calculated as mm3/min. An assumption
has been made that the kerf values are not changed because of very low wire
tool wear during the near-dry WEDM process. 6 mm thickness of the work
piece is used. During the experiments, the time taken to cut the 20 mm length
of the work piece is noted for every experiment and the MRR is calculated by
Equation 3.1 (Mahapatra and Patnaik 2007).
T
krlth MRR Rate Removal Material (3.1)
where, th Thickness of the work piece in mm (6 mm),
l Length of cut in mm (20 mm),
T Time taken for the same length of cut in min,
kr Kerf (Wire diameter+2×dielectric sparking gap) = 0.2 mm.
47
Figure 3.12 Mitutoyo-SJ-201P-surface tester
3.3.2 Surface Roughness
Center Line Average (CLA) surface roughness parameter, Ra has been used to quantify the surface roughness of the machined surface. It measures average roughness by comparing all the peaks and valleys to the mean line and then averaging them all over the entire cut-off length. In this work, the surface roughness was measured by the Mitutoyo-SJ-201P surface tester (Figure 3.12). The cut-off length of the surface roughness tester is 0.8 mm and 4 mm evaluation length was used. Ra was measured along four different paths over the work piece surface and the average value was considered. The surface tester is a shop-floor type surface-roughness measuring device which traces the surface of various machined parts then calculates the surface roughness based on roughness standards stored and displays the result in µm. The resolution of this device is 0.01 µm. The vertical stylus senses the minute irregularities of the work piece surface and displayed digitally on the liquid crystal display.
3.4 INPUT PROCESS PARAMETERS
The following parameters are initially considered to study the effects on the machining performances in the near-dry WEDM process.
48
(i) Spark current
of the current passing through the electrodes for the given pulse. The range of
current in this machine is from 0.8 to 5 A with the step of 0.1 A. At the higher
value of spark current, the machining conditions may become unstable with
improper combination with other process parameters (Tarng et al 1995).
(ii) Pulse width
micro seconds (µs) for which the voltage and current are flowing in each
cycle across the wire tool and work piece (Figure 3.13). The range of pulse
width available in machine tool is from 5-70 µs which is applied in steps of
1 µs. In the oil-based WEDM system, while increasing pulse width, MRR is
increased due to increase in pulse energy. However, surface roughness tends
to be increased at the higher pulse width (> 50 µs) which causes the wire
breakage.
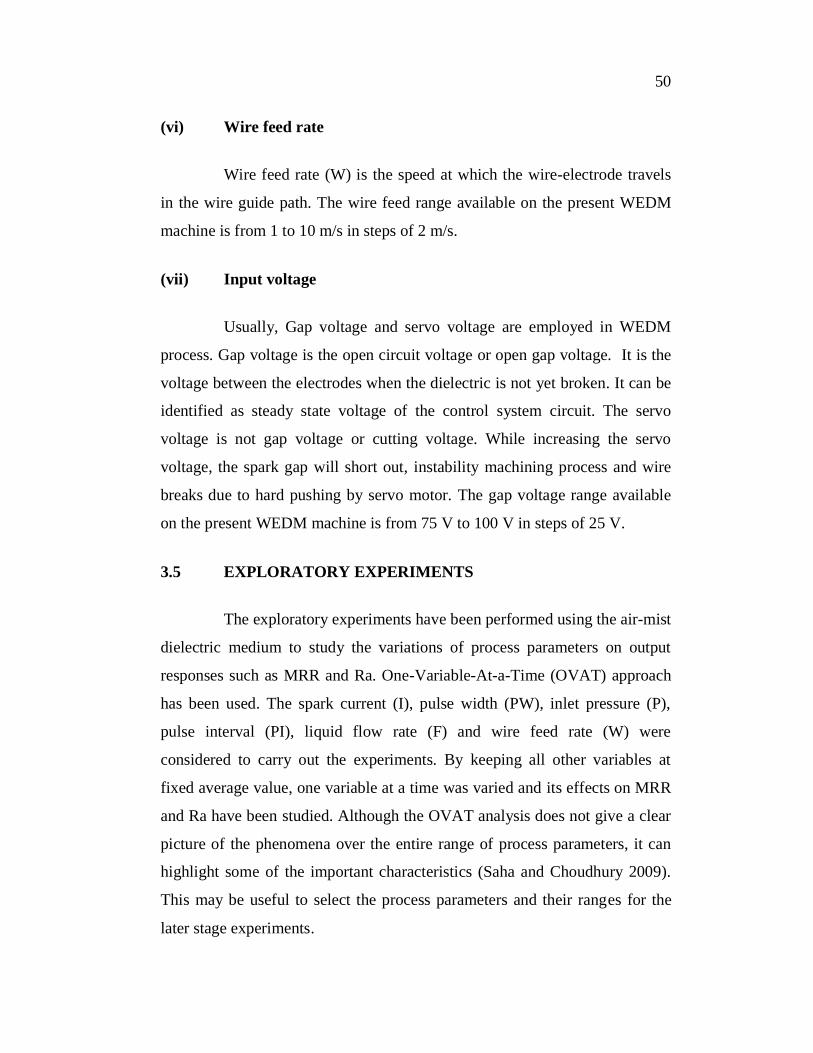
(iii) Inlet pressure
let air/oxygen
gas pressure in kg/cm2. The pressure regulator is used to control the
air/oxygen gas of the hydro-pneumatic circuit. The inlet pressure range in this
experimental setup is from 1 to 10 kg/cm2 which can be adjusted based on our
requirements. While increasing air/oxygen gas pressure, the velocity of
air-mist/oxygen-mist is increased into cutting zone. This is the very important
factor affecting the performance of the near-dry machining process.
49
Figure 3.13 Series of electrical pulses in the cutting gap
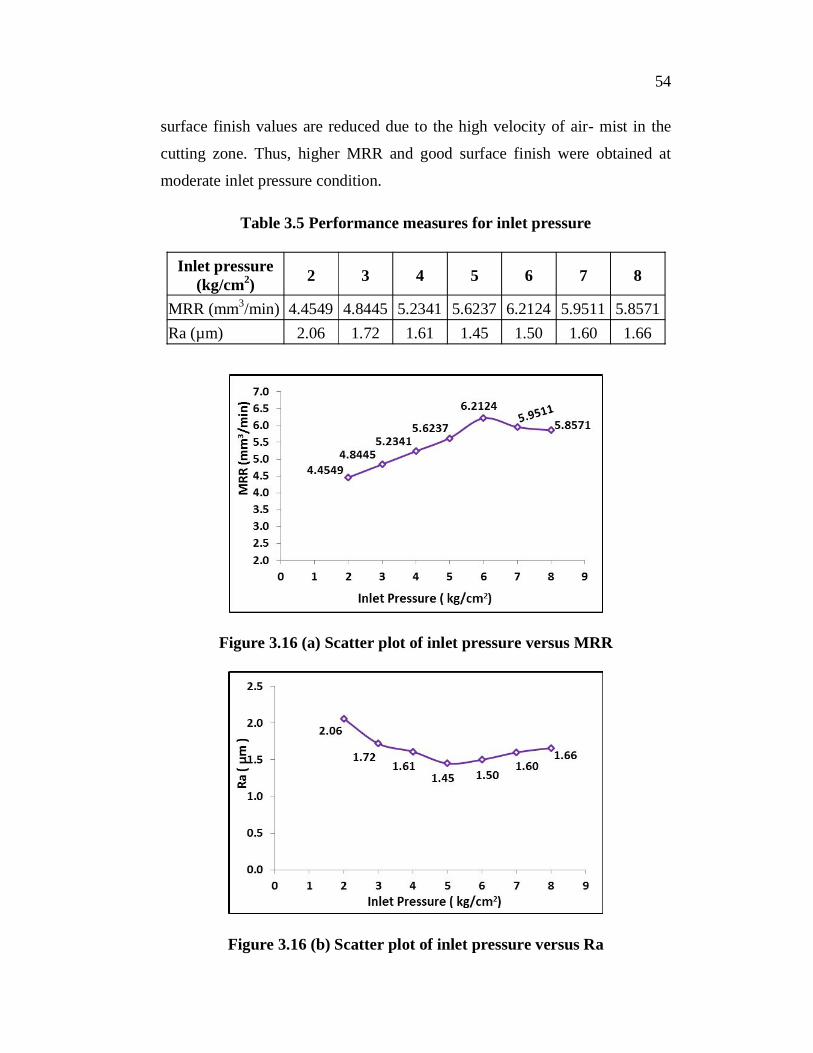
(iv) Pulse interval
in micro seconds (µs) for which the voltage and current are not flowing in
each cycle across the wire tool and work piece (Figure 3.13). The pulse
interval ranges available on the machine tool is 10-70 µs which is applied in
steps of 1 µs. The sparking efficiency is increased while decreasing the pulse
interval. While increasing pulse interval at high level (>60 µs), the discharge
conditions are unstable and average gap current is reduced.
(v) Mixing demineralized water flow rate
In the near-dry WEDM, the mixing of a minimum quantity of
and it affects the cooling efficiency in the cutting zone. The possible range of
water flow rate was used for the experiment from 4 to 16 ml/min and can be
adjusted based on our requirements.
50
(vi) Wire feed rate
Wire feed rate (W) is the speed at which the wire-electrode travels
in the wire guide path. The wire feed range available on the present WEDM
machine is from 1 to 10 m/s in steps of 2 m/s.
(vii) Input voltage
Usually, Gap voltage and servo voltage are employed in WEDM
process. Gap voltage is the open circuit voltage or open gap voltage. It is the
voltage between the electrodes when the dielectric is not yet broken. It can be
identified as steady state voltage of the control system circuit. The servo
voltage is not gap voltage or cutting voltage. While increasing the servo
voltage, the spark gap will short out, instability machining process and wire
breaks due to hard pushing by servo motor. The gap voltage range available
on the present WEDM machine is from 75 V to 100 V in steps of 25 V.
3.5 EXPLORATORY EXPERIMENTS
The exploratory experiments have been performed using the air-mist
dielectric medium to study the variations of process parameters on output
responses such as MRR and Ra. One-Variable-At-a-Time (OVAT) approach
has been used. The spark current (I), pulse width (PW), inlet pressure (P),
pulse interval (PI), liquid flow rate (F) and wire feed rate (W) were
considered to carry out the experiments. By keeping all other variables at
fixed average value, one variable at a time was varied and its effects on MRR
and Ra have been studied. Although the OVAT analysis does not give a clear
picture of the phenomena over the entire range of process parameters, it can
highlight some of the important characteristics (Saha and Choudhury 2009).
This may be useful to select the process parameters and their ranges for the
later stage experiments.
51
3.5.1 Effect of Spark Current on Responses
The spark current is varied from 1.5 to 3.5 A in the increment of
0.5 A for OVAT experiments. The other parameter values are kept constantly
used as PW=30 µs, P=5 kg/cm2, PI=36 µs, F=10 ml/min and W=6 m/s. The
output responses for different values of spark current were observed and
given in Table 3.3. The scatter plots of the spark current versus response
characteristics are shown in Figure 3.14 (a) and 3.14 (b). MRR is increased by
increasing spark current. However, Ra is also increased by the spark current
either due to an increase in depth of the crater or the diameter of the crater
(Saha and Choudhury 2009). At the higher value of spark current (> 4 A), the
machining performance is unstable by improper combination of other
parameters. At low spark current (< 1 A), the insufficient spark intensity
which is not adequate with high value of other process parameters.
Table 3.3 Performance measures for spark current
Spark Current (A) 1.5 2 2.5 3 3.5
MRR (mm3/min) 4.2711 4.8772 5.7527 6.6245 7.2663
Ra (µm) 1.15 1.37 1.66 1.82 1.87
Figure 3.14 (a) Scatter plot of spark current versus MRR
52
Figure 3.14 (b) Scatter plot of spark current versus Ra
Figure 3.15 (a) Scatter plot of pulse width versus MRR
Figure 3.15 (b) Scatter plot of pulse width versus Ra
53
3.5.2 Effect of Pulse Width on Responses
The pulse width value is taken in the near-dry WEDM study from
10 to 45 µs with an increment of 5 µs. The value of the other parameters is
kept constant and their values are given as I=2.4 A, P=5 kg/cm2, PI=36 µs,
F=10 ml/min and W=6 m/s. The output responses for different values of pulse
width were observed and given in Table 3.4. The scatter plots of pulse width
versus output responses are shown in Figure 3.15 (a) and 3.15 (b). The MRR
is significantly improved by increasing pulse width. The surface roughness is
also increased by increasing the pulse width but rather with a little wavy
pattern. At the maximum value of pulse width, the spark intensity was high
and wire is subjected by high thermal load due to increase in pulse energy.
The machining conditions were unstable at high values of pulse width (>50
µs). At a low pulse width, the insufficient spark intensity which is not
adequate with high value of other process parameters.


![Index [application.wiley-vch.de] · Index a abinitiocalculation ... Aspen Plus software 522, 758, 785 assembled measurement setup, with TOM during a measurement at high ... – dry](https://static.documents.pub/doc/80x56/5ac1f5707f8b9a357e8d4e79/index-a-abinitiocalculation-aspen-plus-software-522-758-785-assembled.jpg)


![Experimentation and Optimization of WEDM Machining of ... · Fig. 1. Schematic of WEDM Process. Han et al. [1] investigated that when pulse energy per discharge is constant, long](https://static.documents.pub/doc/80x56/5f239eb3730f3802f0081484/experimentation-and-optimization-of-wedm-machining-of-fig-1-schematic-of-wedm.jpg)


