102 CHAPTER 3: REINFORCING STEEL MATERIAL MODEL 3.1 Introduction The behavior of reinforcing steel may control the response of reinforced concrete structural elements subjected to earthquake loading. Thus, it is necessary to develop an analytical model that predicts the fundamental characteristics of steel within a range of loading that is appropriate for these structural systems. Typical load histories for reinforc- ing steel follow from consideration of the observed response of reinforced concrete struc- tural elements. Characteristics of steel response are established through laboratory testing of steel coupons. Previous research provides theories and techniques for development of an analytical model that predicts steel response. Experimental data provide information for final calibration and refinement of the proposed model. The following sections present the analytical model used in this investigation for finite element analysis of reinforced concrete beam-column connections. The characteris- tics of reinforcing steel are defined by the experimental data presented in Section 3.2. Analytical models proposed for use in previous investigations are presented in Section 3.3. Section 3.4 provides a discussion of the model developed for use in this investigation. Comparison of the predicted and observed response of reinforcing steel is presented in Section 3.5. 3.2 Steel Material Properties Established Through Experimental Testing In predicting the response of reinforcing steel for analysis of reinforced concrete structures subjected to earthquake loading, it is necessary that an analytical model be developed on the basis of a representative material data set. An appropriate data set encompasses the range of force and deformation demands as well as the range of load
Transcript
102
CHAPTER 3: REINFORCING STEEL MATERIAL MODEL
3.1 Introduction
The behavior of reinforcing steel may control the response of reinforced concrete
structural elements subjected to earthquake loading. Thus, it is necessary to develop an
analytical model that predicts the fundamental characteristics of steel within a range of
loading that is appropriate for these structural systems. Typical load histories for reinforc-
ing steel follow from consideration of the observed response of reinforced concrete struc-
tural elements. Characteristics of steel response are established through laboratory testing
of steel coupons. Previous research provides theories and techniques for development of
an analytical model that predicts steel response. Experimental data provide information
for final calibration and refinement of the proposed model.
The following sections present the analytical model used in this investigation for
finite element analysis of reinforced concrete beam-column connections. The characteris-
tics of reinforcing steel are defined by the experimental data presented in Section 3.2.
Analytical models proposed for use in previous investigations are presented in Section
3.3. Section 3.4 provides a discussion of the model developed for use in this investigation.
Comparison of the predicted and observed response of reinforcing steel is presented in
Section 3.5.
3.2 Steel Material Properties Established Through Experimental Testing
In predicting the response of reinforcing steel for analysis of reinforced concrete
structures subjected to earthquake loading, it is necessary that an analytical model be
developed on the basis of a representative material data set. An appropriate data set
encompasses the range of force and deformation demands as well as the range of load
103
rates that the material may experience in an actual structure subjected to earthquake load-
ing.
3.2.1 Criteria for Experimental Investigation of Reinforcing Steel
Reinforcing steel in reinforced concrete structures carries load primarily along the
axis of the bar. Reinforcement is relatively strong and stiff when loaded along the bar axis,
and reinforced concrete members are designed to exploit this. Typically, loading of a vol-
ume of reinforced concrete results in cracking of the concrete and transfer of the tensile
load to the reinforcement along the bar axis, perpendicular to the plane of the crack. In
regions of variably oriented loading or relatively high shear loading, or both, cracked rein-
forced concrete may be loaded perpendicular to the axis of a reinforcing bar and parallel to
an established crack surface. This loading of the cracked reinforced concrete volume is
referred to as shear friction, and activation of reinforcement perpendicular to the bar axis
at a crack surface is referred to as dowel action. Most research into the shear-friction
response of reinforced concrete elements indicates that even for this type of loading axial
rather than dowel action dominates the response of the reinforcement perpendicular to the
crack surface [Laible et al., 1977; Paulay and Loeber, 1977]. Under shear friction loading,
a concrete crack must open substantially for sliding to occur. However, crack opening pro-
duces tensile stress in the reinforcing steel crossing the crack. These forces are equili-
brated by a clamping force in the concrete that pushes the crack closed. Increased
clamping force results in increased sliding frictional resistance along the crack surface.
Thus, axial stress in the steel rather determines response. While model represents the
response observed by most researchers, results of one experimental investigation suggest
that the dowel action of reinforcing steel may not be negligible and my contribute between
twenty-five and thirty-five percent of the slip resistance at a crack surface [Hofbeck et al.,
1969].
104
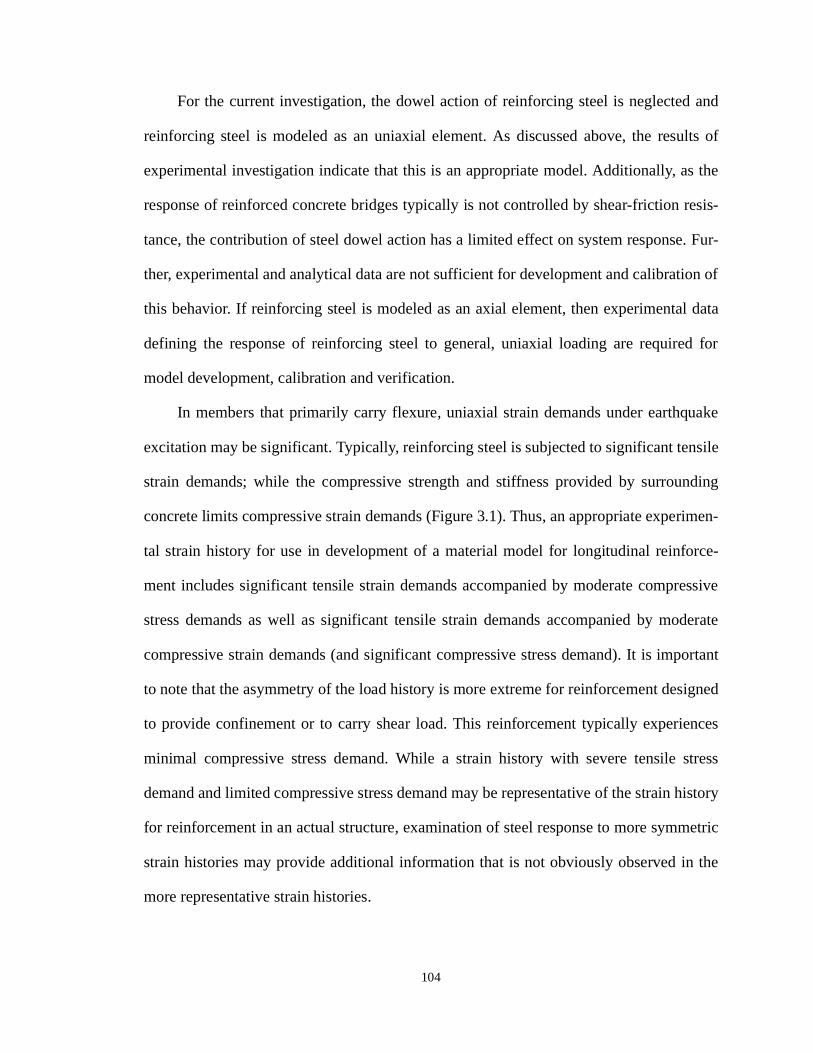
For the current investigation, the dowel action of reinforcing steel is neglected and
reinforcing steel is modeled as an uniaxial element. As discussed above, the results of
experimental investigation indicate that this is an appropriate model. Additionally, as the
response of reinforced concrete bridges typically is not controlled by shear-friction resis-
tance, the contribution of steel dowel action has a limited effect on system response. Fur-
ther, experimental and analytical data are not sufficient for development and calibration of
this behavior. If reinforcing steel is modeled as an axial element, then experimental data
defining the response of reinforcing steel to general, uniaxial loading are required for
model development, calibration and verification.
In members that primarily carry flexure, uniaxial strain demands under earthquake
excitation may be significant. Typically, reinforcing steel is subjected to significant tensile
strain demands; while the compressive strength and stiffness provided by surrounding
tal strain history for use in development of a material model for longitudinal reinforce-
ment includes significant tensile strain demands accompanied by moderate compressive
stress demands as well as significant tensile strain demands accompanied by moderate
compressive strain demands (and significant compressive stress demand). It is important
to note that the asymmetry of the load history is more extreme for reinforcement designed
to provide confinement or to carry shear load. This reinforcement typically experiences
minimal compressive stress demand. While a strain history with severe tensile stress
demand and limited compressive stress demand may be representative of the strain history
for reinforcement in an actual structure, examination of steel response to more symmetric
strain histories may provide additional information that is not obviously observed in the
more representative strain histories.
105
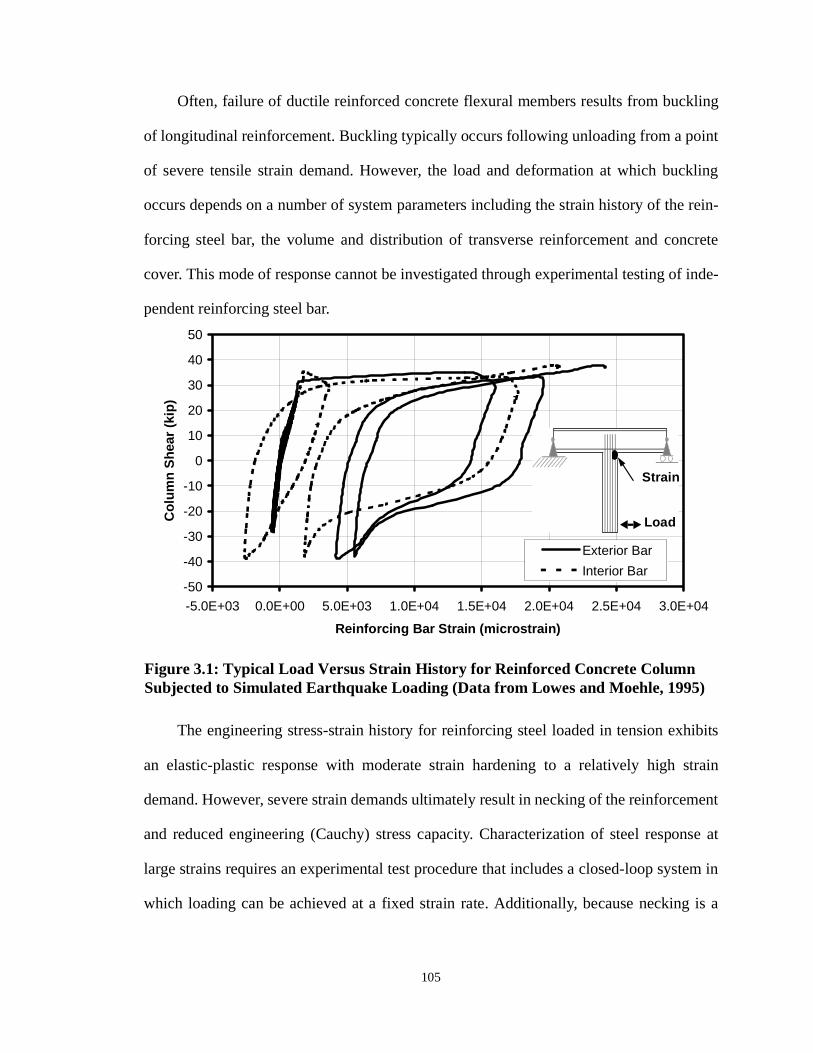
Often, failure of ductile reinforced concrete flexural members results from buckling
of longitudinal reinforcement. Buckling typically occurs following unloading from a point
of severe tensile strain demand. However, the load and deformation at which buckling
occurs depends on a number of system parameters including the strain history of the rein-
forcing steel bar, the volume and distribution of transverse reinforcement and concrete
cover. This mode of response cannot be investigated through experimental testing of inde-
pendent reinforcing steel bar.
The engineering stress-strain history for reinforcing steel loaded in tension exhibits
an elastic-plastic response with moderate strain hardening to a relatively high strain
demand. However, severe strain demands ultimately result in necking of the reinforcement
and reduced engineering (Cauchy) stress capacity. Characterization of steel response at
large strains requires an experimental test procedure that includes a closed-loop system in
which loading can be achieved at a fixed strain rate. Additionally, because necking is a
Figure 3.1: Typical Load Versus Strain History for Reinforced Concrete Column Subjected to Simulated Earthquake Loading (Data from Lowes and Moehle, 1995)
Figure 3.2: Tensile Monotonic Stress-Strain History for Typical Reinforcing Steel Bar (Data for A706 Grade 60 Reinforcement [Naito, 1999])
109
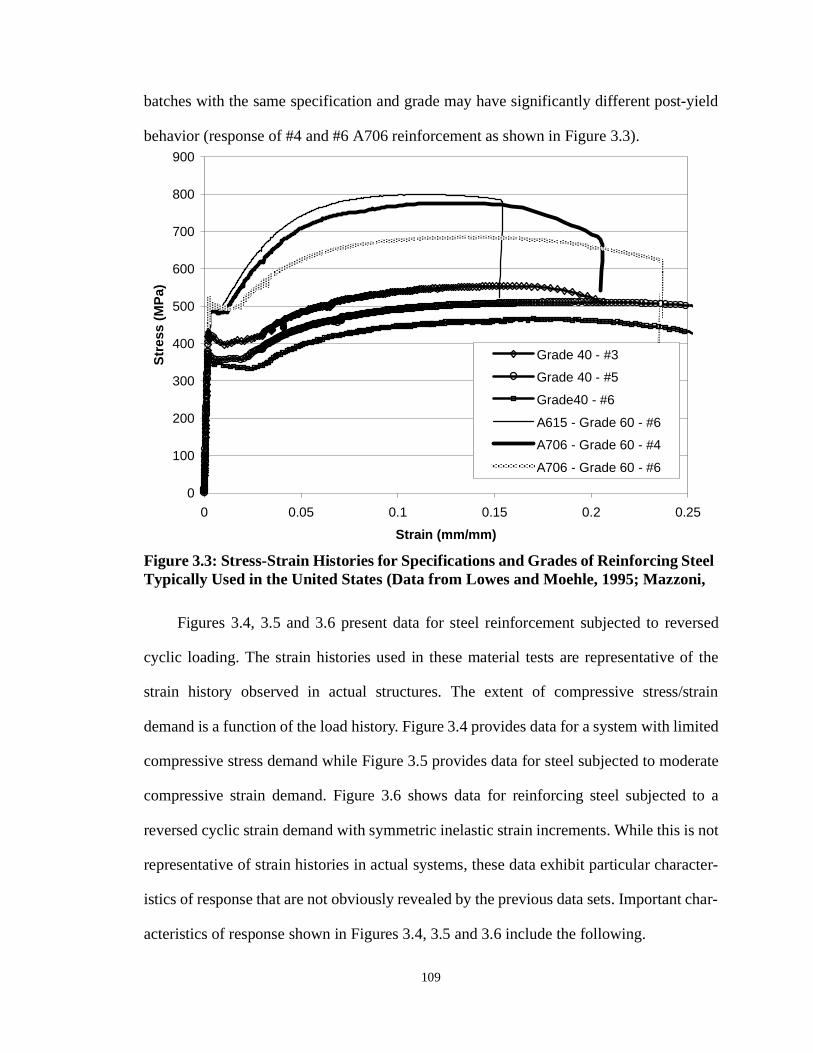
batches with the same specification and grade may have significantly different post-yield
behavior (response of #4 and #6 A706 reinforcement as shown in Figure 3.3).
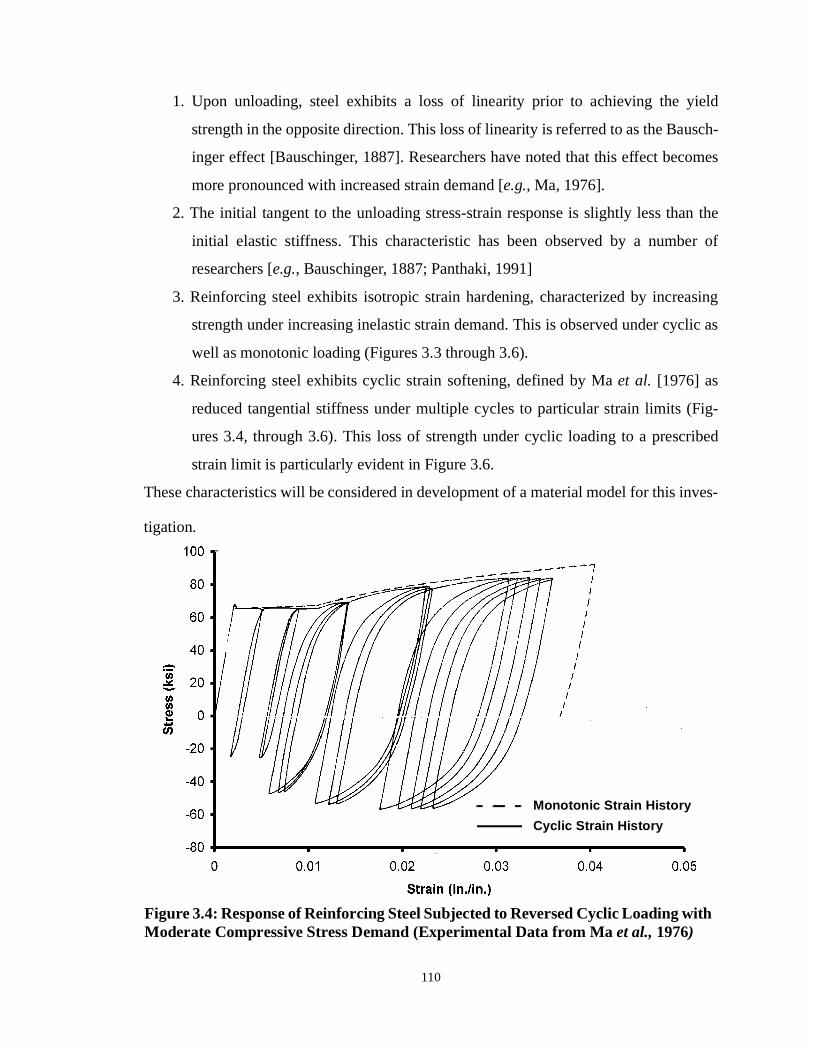
Figures 3.4, 3.5 and 3.6 present data for steel reinforcement subjected to reversed
cyclic loading. The strain histories used in these material tests are representative of the
strain history observed in actual structures. The extent of compressive stress/strain
demand is a function of the load history. Figure 3.4 provides data for a system with limited
compressive stress demand while Figure 3.5 provides data for steel subjected to moderate
compressive strain demand. Figure 3.6 shows data for reinforcing steel subjected to a
reversed cyclic strain demand with symmetric inelastic strain increments. While this is not
representative of strain histories in actual systems, these data exhibit particular character-
istics of response that are not obviously revealed by the previous data sets. Important char-
acteristics of response shown in Figures 3.4, 3.5 and 3.6 include the following.
0
100
200
300
400
500
600
700
800
900
0 0.05 0.1 0.15 0.2 0.25
Strain (mm/mm)
Str
ess
(MP
a)
Grade 40 - #3
Grade 40 - #5
Grade40 - #6
A615 - Grade 60 - #6
A706 - Grade 60 - #4
A706 - Grade 60 - #6
Figure 3.3: Stress-Strain Histories for Specifications and Grades of Reinforcing Steel Typically Used in the United States (Data from Lowes and Moehle, 1995; Mazzoni,
110
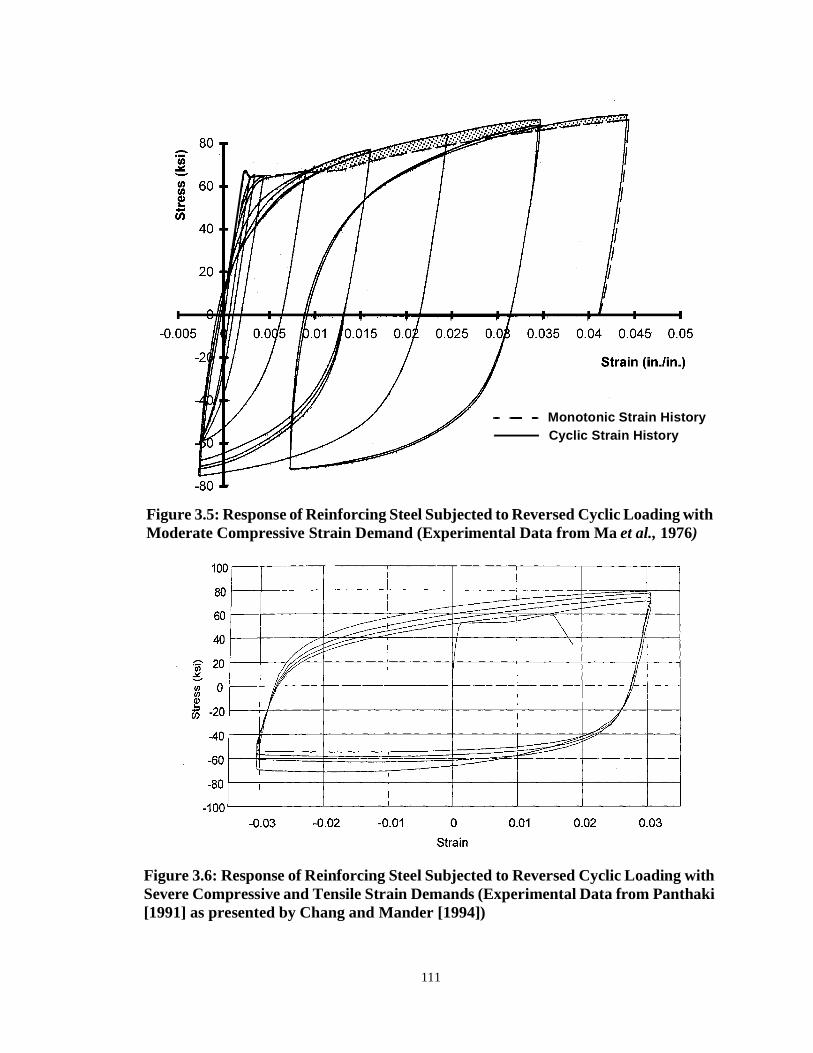
1. Upon unloading, steel exhibits a loss of linearity prior to achieving the yield
strength in the opposite direction. This loss of linearity is referred to as the Bausch-
inger effect [Bauschinger, 1887]. Researchers have noted that this effect becomes
more pronounced with increased strain demand [e.g., Ma, 1976].
2. The initial tangent to the unloading stress-strain response is slightly less than the
initial elastic stiffness. This characteristic has been observed by a number of
3. Reinforcing steel exhibits isotropic strain hardening, characterized by increasing
strength under increasing inelastic strain demand. This is observed under cyclic as
well as monotonic loading (Figures 3.3 through 3.6).
4. Reinforcing steel exhibits cyclic strain softening, defined by Ma et al. [1976] as
reduced tangential stiffness under multiple cycles to particular strain limits (Fig-
ures 3.4, through 3.6). This loss of strength under cyclic loading to a prescribed
strain limit is particularly evident in Figure 3.6.
These characteristics will be considered in development of a material model for this inves-
tigation.
Figure 3.4: Response of Reinforcing Steel Subjected to Reversed Cyclic Loading with Moderate Compressive Stress Demand (Experimental Data from Ma et al., 1976)
Monotonic Strain History
Cyclic Strain History
111
Monotonic Strain HistoryCyclic Strain History
Figure 3.5: Response of Reinforcing Steel Subjected to Reversed Cyclic Loading with Moderate Compressive Strain Demand (Experimental Data from Ma et al., 1976)
Figure 3.6: Response of Reinforcing Steel Subjected to Reversed Cyclic Loading with Severe Compressive and Tensile Strain Demands (Experimental Data from Panthaki [1991] as presented by Chang and Mander [1994])
112
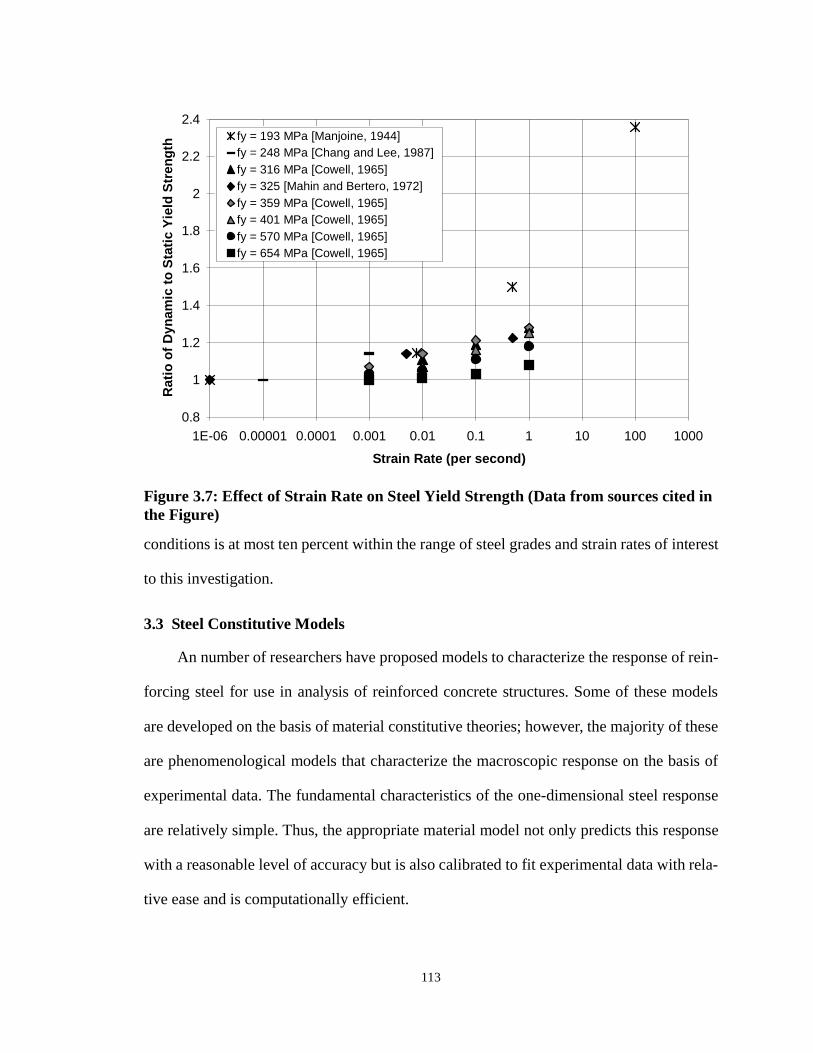
3.2.3 Effect of Load Rate
Experimental data collected during previous investigations define the effect of
increased strain rate on steel material response. These data may be used to adjust steel
strength for loading in the range of strain rates developed in structures subjected to earth-
quake loading. For reinforcing steel, maximum strain rates developed under earthquake
loading are approximately 0.3 per second for elastic steel approaching yield strength and
1.2 per second for yielding steel developing ultimate strength. Figure 3.7 shows the ratio
of dynamic to static tensile yield strength as a function of strain rate. These data are for
“mild structural steel” [Manjoine, 1944] and A36 steel [Chang and Lee, 1987] as well as
steel grades typically used for reinforcing steel [Cowell, 1965] and A615 steel [Mahin et
al., 1972]. These data show that for typical reinforcing steel, dynamic yield strength is
approximately 10 percent larger than the static yield strength within the range of load rate
that is appropriate for structures subjected to earthquake loading. Additionally, these data
show that the increase in yield strength observed under dynamic loading is less significant
for higher grade steels. Investigations conducted by Mahin et al. [1972] show that
increased strain rate has a negligible effect for steel loaded beyond the initiation of strain
hardening and for steel subjected to reversed cyclic loading. Similarly, data collected by
Manjoine [1944] show a maximum increase in ultimate strength of mild structural steel of
approximately 4 percent within the range of strain rates appropriate for this investigation.
Results of several investigations indicate that increased strain rate has relatively little
effect on elastic modulus [ACI Committee 439, 1969; Mahin et al., 1972; CEB, 1988].
The experimental data show that dynamic loading has a relatively limited effect on
the response of reinforcing steel. Increased strain rate will result in increased yield
strength; however, the strength increase beyond that observed under pseudo-static load
113
conditions is at most ten percent within the range of steel grades and strain rates of interest
to this investigation.
3.3 Steel Constitutive Models
An number of researchers have proposed models to characterize the response of rein-
forcing steel for use in analysis of reinforced concrete structures. Some of these models
are developed on the basis of material constitutive theories; however, the majority of these
are phenomenological models that characterize the macroscopic response on the basis of
experimental data. The fundamental characteristics of the one-dimensional steel response
are relatively simple. Thus, the appropriate material model not only predicts this response
with a reasonable level of accuracy but is also calibrated to fit experimental data with rela-
softening. The models differ in the non-linear equations used to model individual charac-
teristics of material response.
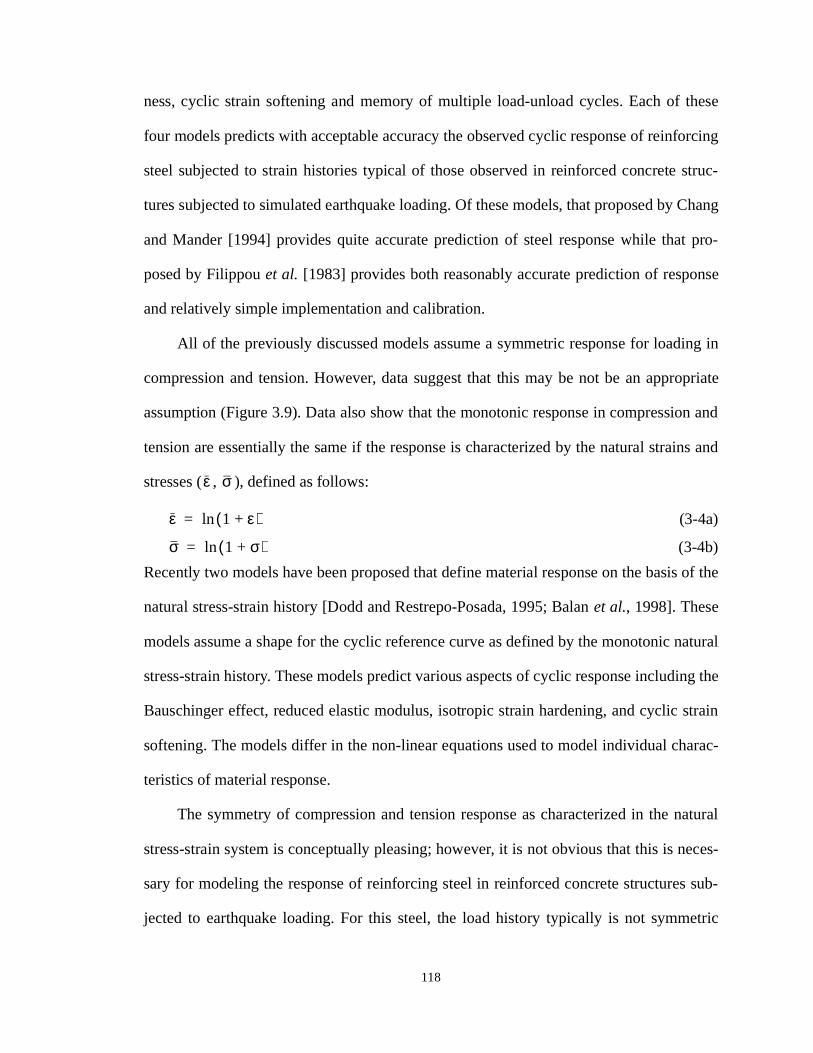
The symmetry of compression and tension response as characterized in the natural
stress-strain system is conceptually pleasing; however, it is not obvious that this is neces-
sary for modeling the response of reinforcing steel in reinforced concrete structures sub-
jected to earthquake loading. For this steel, the load history typically is not symmetric
ε σ
ε 1 ε+( )ln=
σ 1 σ+( )ln=
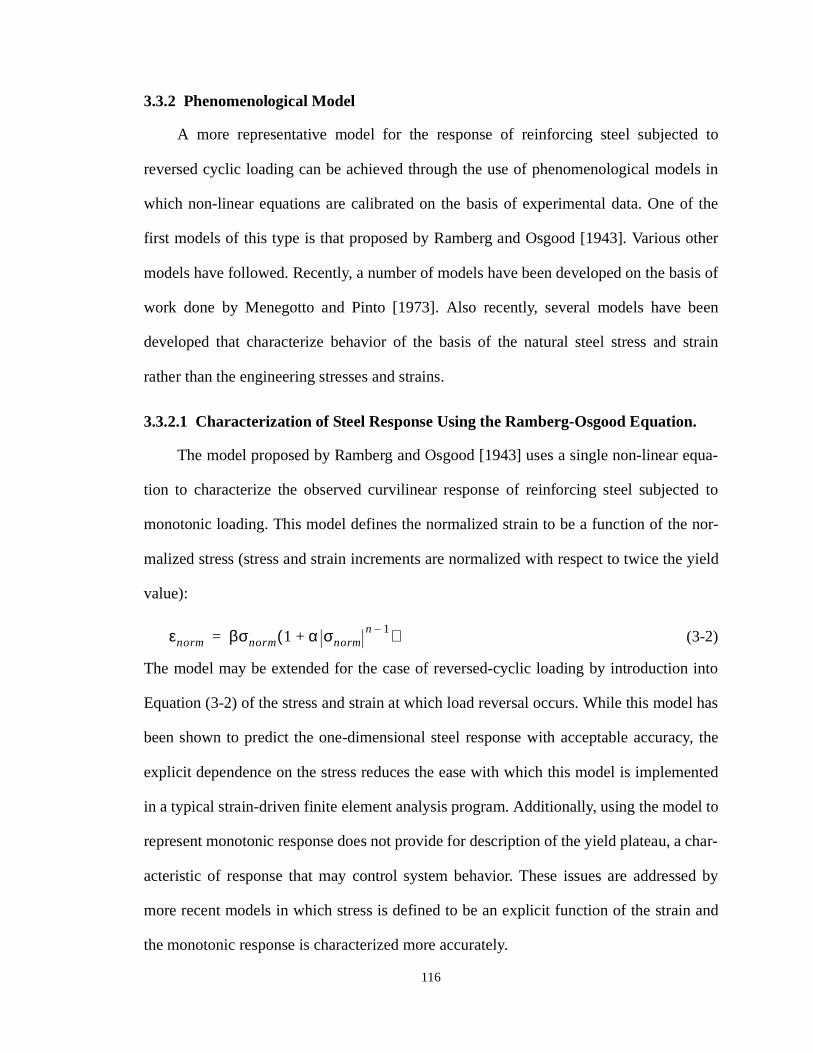
119
with load histories showing significant tensile strain demand and limited compressive
strain demand. For these cases, characterization of the model on the basis of the tensile
monotonic response is perhaps appropriate. Additionally, it is not clear that the enhanced
accuracy of these model justifies the additional complexity and computational effort.
3.4 Characterization of the Response of Reinforcing Steel
For this investigation, a material model is developed that defines those fundamental
characteristics of steel behavior that control the response of reinforced concrete structures
subjected to earthquake loading. This model follows from several previously proposed
models and predicts the uniaxial steel material response as defined by the presented exper-
imental data. Consideration of past research indicates that a macroscopic material model is
most appropriate for prediction of steel response. Further, the results of past research show
that steel behavior may be characterized with acceptable accuracy on the basis of engi-
neering strains and stresses. Here, it is assumed that the observed moderate increase in
Figure 3.9: Engineering Versus Natural Stress-Strain History for Reinforcing Steel Subjected to Monotonic Compression and Tension Loading (Data from Dodd and Restrepo-Posada [1995])
0
100
200
300
400
500
600
700
800
0 0.02 0.04 0.06 0.08 0.1 0.12 0.14 0.16
|Strain| (mm/mm)
|Str
ess|
(M
Pa)
Engineering Stress-Strain: Compression
Engineering Stress-Strain: Tension
True Stress-Strain: Compression
True Stress-Strain: Tension
120
steel yield strength as a function of increased strain rate may be neglected as this increased
strength will only be observed during short periods of rapid loading, will not control
development of a specific failure mechanism in the beam-column joint system and will
facilitate correlation with observed laboratory tests in which loading is pseudo-static.
Strain hardening may determine system strength and necessarily is incorporated into the
model. Here strain hardening is characterized through the assumption that plastic defor-
mation in both tension and compression results in nonlinear hardening as defined by the
experimentally observed monotonic stress-strain response. Finally, experimental data
show that the effect of cyclic strain softening is limited, and this characteristic of response
is not incorporated into the material model.
The proposed model defines the response of reinforcing steel subjected to reversed
cyclic loading on the basis of three characteristic stress-strain response curves: a reference
curve, an unloading curve and a reloading curve. For this investigation, the monotonic
stress-strain histories define the model reference curves. Experimental data show that the
monotonic tensile stress-strain history bounds the tensile response of reinforcing steel sub-
jected to reversed cyclic strain histories with severe tensile strain demands and moderate
compressive demand. For reinforcing steel subjected to severe compressive and tensile
strain demands, the monotonic stress-strain histories, shifted to account for accumulated
plastic deformation provide a reasonably accurate bound for the observed response. Also
for this investigation, unloading and reloading curves are defined using the Menegotto-
Pinto equation and calibration parameters provided by previous researchers. Previous
research shows that the Menegotto-Pinto equation represents well the unloading and
reloading response of reinforcing steel subjected to cyclic loading. Additionally, previous
research provides calibration parameters for this equation that are appropriate for model-
121
ing grades of reinforcing steel typically used in construction of reinforced concrete struc-
tures.
The reference curve is defined on the basis of the monotonic stress-strain history as
determined from experimental testing. Here the equation proposed by Chang and Mander
[1994] is used to describe the monotonic response in compression or tension:
(3-5a)
where
(3-5b)
and is the engineering stress, is the engineering strain, is a function of the plas-
tic deformation in either compression or tension and steel material parameters are as pre-
viously defined. The model variable, , is defined, as proposed by Chang and Mander,
to be a function of the strain at which strain hardening occurs in compression (or tension)
and of the extreme strain experienced in compression (or tension). For the tensile refer-
ence curve, this parameter is defined as follows (here material parameters characterize the
monotonic compressive response):
(3-6)
where k is a weighting parameter defined as follows:
(3-7)
It is important to note that the model variable provides a measure of plastic deforma-
tion; this variable is analogous, but different in definition, to the plastic deformation
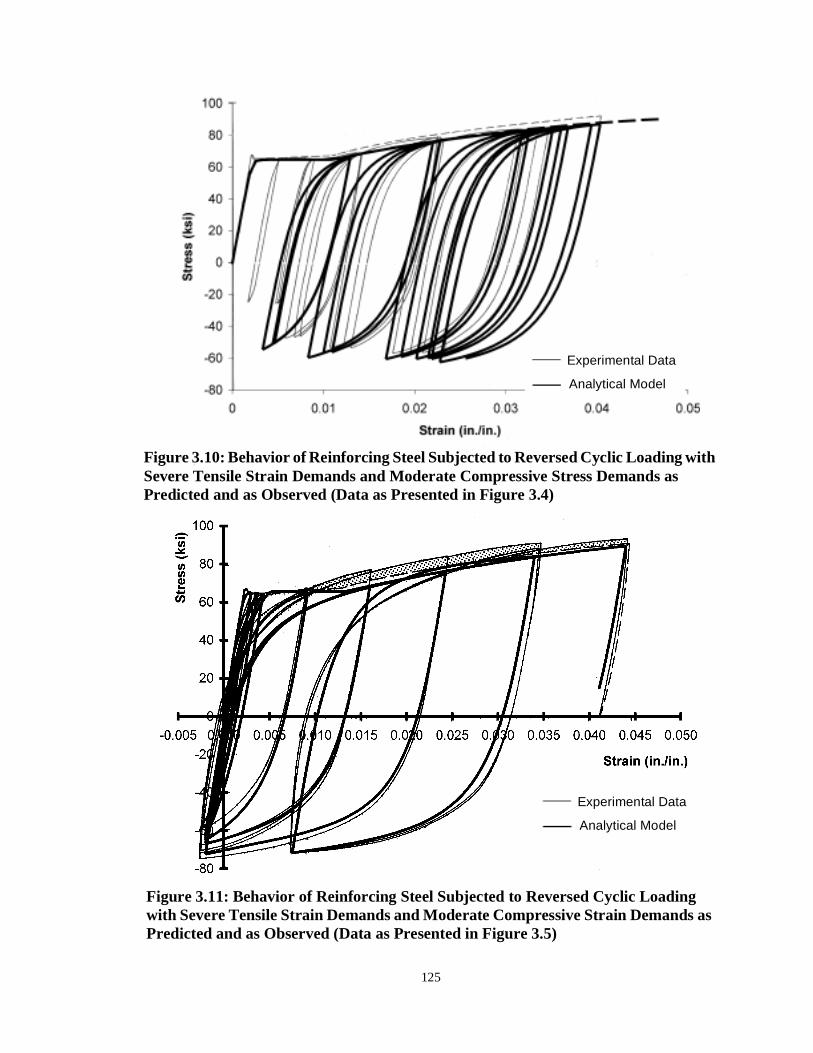
the behavior of reinforcing steel subjected to reversed cyclic loading with severe tensile
and moderate compressive strain demand. The proposed material model represents well
the fundamental characteristics of the observed response. However, for this strain history,
in which cyclic strain increments are relatively large in both tension and compression, the
model under represents the observed strain hardening and does not represent the reload
curves accurately. Given that this inaccuracy is relatively small and that this strain history
is extreme for an actual system, the errors in model are acceptable. Figure 3.12 presents
the behavior of reinforcing steel subjected to reversed cyclic loading with severe tensile
and compressive strain demands. Here, the proposed model represents well the fundamen-
tal characteristics of the response. However, the model does not represent the loss in
strength that is observed following cycling to a fixed strain. Since this loss of strength is
minimal and most significant for the case of multiple cycles to a fixed strain in which
there is no accumulation of additional plastic strain and thus no additional material strain
hardening, this inaccuracy is not significant.
3.6 Conclusions
The material model proposed for use in this investigation represents with acceptable
accuracy the behavior of reinforcing steel within the range of loading that is appropriate
for reinforced concrete bridges subjected to earthquake loading. The model employes a
macromodel framework to describe the engineering stress-strain history of reinforcement
subjected to reversed cyclic loading. The model uses nonlinear equations and calibration
factors established by others and is readily calibrated to represent the response of typical
reinforcing steel on the basis of parameters established through monotonic stress-strain
histories. This model is appropriate for predicting the response of typical reinforcing steels
subjected to variable reversed cyclic loading including load histories with severe tensile
strain demand and moderate to extreme compressive stress and strain demands.
125
Analytical Model
Experimental Data
Figure 3.10: Behavior of Reinforcing Steel Subjected to Reversed Cyclic Loading with Severe Tensile Strain Demands and Moderate Compressive Stress Demands as Predicted and as Observed (Data as Presented in Figure 3.4)
Figure 3.11: Behavior of Reinforcing Steel Subjected to Reversed Cyclic Loading with Severe Tensile Strain Demands and Moderate Compressive Strain Demands as Predicted and as Observed (Data as Presented in Figure 3.5)
Analytical Model
Experimental Data
126
Figure 3.12: Behavior of Reinforcing Steel Subjected to Reversed Cyclic Loading with Severe Tensile and Compressive Strain Demands as Predicted and as Observed (Data as Presented in Figure 3.6)
Analytical Model
Experimental Data
102
CHAPTER 3: REINFORCING STEEL MATERIAL MODEL
3.1 Introduction
The behavior of reinforcing steel may control the response of reinforced concrete
structural elements subjected to earthquake loading. Thus, it is necessary to develop an
analytical model that predicts the fundamental characteristics of steel within a range of
loading that is appropriate for these structural systems. Typical load histories for reinforc-
ing steel follow from consideration of the observed response of reinforced concrete struc-
tural elements. Characteristics of steel response are established through laboratory testing
of steel coupons. Previous research provides theories and techniques for development of
an analytical model that predicts steel response. Experimental data provide information
for final calibration and refinement of the proposed model.
The following sections present the analytical model used in this investigation for
finite element analysis of reinforced concrete beam-column connections. The characteris-
tics of reinforcing steel are defined by the experimental data presented in Section 3.2.
Analytical models proposed for use in previous investigations are presented in Section
3.3. Section 3.4 provides a discussion of the model developed for use in this investigation.
Comparison of the predicted and observed response of reinforcing steel is presented in
Section 3.5.
3.2 Steel Material Properties Established Through Experimental Testing
In predicting the response of reinforcing steel for analysis of reinforced concrete
structures subjected to earthquake loading, it is necessary that an analytical model be
developed on the basis of a representative material data set. An appropriate data set
encompasses the range of force and deformation demands as well as the range of load
103
rates that the material may experience in an actual structure subjected to earthquake load-
ing.
3.2.1 Criteria for Experimental Investigation of Reinforcing Steel
Reinforcing steel in reinforced concrete structures carries load primarily along the
axis of the bar. Reinforcement is relatively strong and stiff when loaded along the bar axis,
and reinforced concrete members are designed to exploit this. Typically, loading of a vol-
ume of reinforced concrete results in cracking of the concrete and transfer of the tensile
load to the reinforcement along the bar axis, perpendicular to the plane of the crack. In
regions of variably oriented loading or relatively high shear loading, or both, cracked rein-
forced concrete may be loaded perpendicular to the axis of a reinforcing bar and parallel to
an established crack surface. This loading of the cracked reinforced concrete volume is
referred to as shear friction, and activation of reinforcement perpendicular to the bar axis
at a crack surface is referred to as dowel action. Most research into the shear-friction
response of reinforced concrete elements indicates that even for this type of loading axial
rather than dowel action dominates the response of the reinforcement perpendicular to the
crack surface [Laible et al., 1977; Paulay and Loeber, 1977]. Under shear friction loading,
a concrete crack must open substantially for sliding to occur. However, crack opening pro-
duces tensile stress in the reinforcing steel crossing the crack. These forces are equili-
brated by a clamping force in the concrete that pushes the crack closed. Increased
clamping force results in increased sliding frictional resistance along the crack surface.
Thus, axial stress in the steel rather determines response. While model represents the
response observed by most researchers, results of one experimental investigation suggest
that the dowel action of reinforcing steel may not be negligible and my contribute between
twenty-five and thirty-five percent of the slip resistance at a crack surface [Hofbeck et al.,
1969].
104
For the current investigation, the dowel action of reinforcing steel is neglected and
reinforcing steel is modeled as an uniaxial element. As discussed above, the results of
experimental investigation indicate that this is an appropriate model. Additionally, as the
response of reinforced concrete bridges typically is not controlled by shear-friction resis-
tance, the contribution of steel dowel action has a limited effect on system response. Fur-
ther, experimental and analytical data are not sufficient for development and calibration of
this behavior. If reinforcing steel is modeled as an axial element, then experimental data
defining the response of reinforcing steel to general, uniaxial loading are required for
model development, calibration and verification.
In members that primarily carry flexure, uniaxial strain demands under earthquake
excitation may be significant. Typically, reinforcing steel is subjected to significant tensile
strain demands; while the compressive strength and stiffness provided by surrounding
tal strain history for use in development of a material model for longitudinal reinforce-
ment includes significant tensile strain demands accompanied by moderate compressive
stress demands as well as significant tensile strain demands accompanied by moderate
compressive strain demands (and significant compressive stress demand). It is important
to note that the asymmetry of the load history is more extreme for reinforcement designed
to provide confinement or to carry shear load. This reinforcement typically experiences
minimal compressive stress demand. While a strain history with severe tensile stress
demand and limited compressive stress demand may be representative of the strain history
for reinforcement in an actual structure, examination of steel response to more symmetric
strain histories may provide additional information that is not obviously observed in the
more representative strain histories.
105
Often, failure of ductile reinforced concrete flexural members results from buckling
of longitudinal reinforcement. Buckling typically occurs following unloading from a point
of severe tensile strain demand. However, the load and deformation at which buckling
occurs depends on a number of system parameters including the strain history of the rein-
forcing steel bar, the volume and distribution of transverse reinforcement and concrete
cover. This mode of response cannot be investigated through experimental testing of inde-
pendent reinforcing steel bar.
The engineering stress-strain history for reinforcing steel loaded in tension exhibits
an elastic-plastic response with moderate strain hardening to a relatively high strain
demand. However, severe strain demands ultimately result in necking of the reinforcement
and reduced engineering (Cauchy) stress capacity. Characterization of steel response at
large strains requires an experimental test procedure that includes a closed-loop system in
which loading can be achieved at a fixed strain rate. Additionally, because necking is a
Figure 3.1: Typical Load Versus Strain History for Reinforced Concrete Column Subjected to Simulated Earthquake Loading (Data from Lowes and Moehle, 1995)
Figure 3.2: Tensile Monotonic Stress-Strain History for Typical Reinforcing Steel Bar (Data for A706 Grade 60 Reinforcement [Naito, 1999])
109
batches with the same specification and grade may have significantly different post-yield
behavior (response of #4 and #6 A706 reinforcement as shown in Figure 3.3).
Figures 3.4, 3.5 and 3.6 present data for steel reinforcement subjected to reversed
cyclic loading. The strain histories used in these material tests are representative of the
strain history observed in actual structures. The extent of compressive stress/strain
demand is a function of the load history. Figure 3.4 provides data for a system with limited
compressive stress demand while Figure 3.5 provides data for steel subjected to moderate
compressive strain demand. Figure 3.6 shows data for reinforcing steel subjected to a
reversed cyclic strain demand with symmetric inelastic strain increments. While this is not
representative of strain histories in actual systems, these data exhibit particular character-
istics of response that are not obviously revealed by the previous data sets. Important char-
acteristics of response shown in Figures 3.4, 3.5 and 3.6 include the following.
0
100
200
300
400
500
600
700
800
900
0 0.05 0.1 0.15 0.2 0.25
Strain (mm/mm)
Str
ess
(MP
a)
Grade 40 - #3
Grade 40 - #5
Grade40 - #6
A615 - Grade 60 - #6
A706 - Grade 60 - #4
A706 - Grade 60 - #6
Figure 3.3: Stress-Strain Histories for Specifications and Grades of Reinforcing Steel Typically Used in the United States (Data from Lowes and Moehle, 1995; Mazzoni,
110
1. Upon unloading, steel exhibits a loss of linearity prior to achieving the yield
strength in the opposite direction. This loss of linearity is referred to as the Bausch-
inger effect [Bauschinger, 1887]. Researchers have noted that this effect becomes
more pronounced with increased strain demand [e.g., Ma, 1976].
2. The initial tangent to the unloading stress-strain response is slightly less than the
initial elastic stiffness. This characteristic has been observed by a number of
3. Reinforcing steel exhibits isotropic strain hardening, characterized by increasing
strength under increasing inelastic strain demand. This is observed under cyclic as
well as monotonic loading (Figures 3.3 through 3.6).
4. Reinforcing steel exhibits cyclic strain softening, defined by Ma et al. [1976] as
reduced tangential stiffness under multiple cycles to particular strain limits (Fig-
ures 3.4, through 3.6). This loss of strength under cyclic loading to a prescribed
strain limit is particularly evident in Figure 3.6.
These characteristics will be considered in development of a material model for this inves-
tigation.
Figure 3.4: Response of Reinforcing Steel Subjected to Reversed Cyclic Loading with Moderate Compressive Stress Demand (Experimental Data from Ma et al., 1976)
Monotonic Strain History
Cyclic Strain History
111
Monotonic Strain HistoryCyclic Strain History
Figure 3.5: Response of Reinforcing Steel Subjected to Reversed Cyclic Loading with Moderate Compressive Strain Demand (Experimental Data from Ma et al., 1976)
Figure 3.6: Response of Reinforcing Steel Subjected to Reversed Cyclic Loading with Severe Compressive and Tensile Strain Demands (Experimental Data from Panthaki [1991] as presented by Chang and Mander [1994])
112
3.2.3 Effect of Load Rate
Experimental data collected during previous investigations define the effect of
increased strain rate on steel material response. These data may be used to adjust steel
strength for loading in the range of strain rates developed in structures subjected to earth-
quake loading. For reinforcing steel, maximum strain rates developed under earthquake
loading are approximately 0.3 per second for elastic steel approaching yield strength and
1.2 per second for yielding steel developing ultimate strength. Figure 3.7 shows the ratio
of dynamic to static tensile yield strength as a function of strain rate. These data are for
“mild structural steel” [Manjoine, 1944] and A36 steel [Chang and Lee, 1987] as well as
steel grades typically used for reinforcing steel [Cowell, 1965] and A615 steel [Mahin et
al., 1972]. These data show that for typical reinforcing steel, dynamic yield strength is
approximately 10 percent larger than the static yield strength within the range of load rate
that is appropriate for structures subjected to earthquake loading. Additionally, these data
show that the increase in yield strength observed under dynamic loading is less significant
for higher grade steels. Investigations conducted by Mahin et al. [1972] show that
increased strain rate has a negligible effect for steel loaded beyond the initiation of strain
hardening and for steel subjected to reversed cyclic loading. Similarly, data collected by
Manjoine [1944] show a maximum increase in ultimate strength of mild structural steel of
approximately 4 percent within the range of strain rates appropriate for this investigation.
Results of several investigations indicate that increased strain rate has relatively little
effect on elastic modulus [ACI Committee 439, 1969; Mahin et al., 1972; CEB, 1988].
The experimental data show that dynamic loading has a relatively limited effect on
the response of reinforcing steel. Increased strain rate will result in increased yield
strength; however, the strength increase beyond that observed under pseudo-static load
113
conditions is at most ten percent within the range of steel grades and strain rates of interest
to this investigation.
3.3 Steel Constitutive Models
An number of researchers have proposed models to characterize the response of rein-
forcing steel for use in analysis of reinforced concrete structures. Some of these models
are developed on the basis of material constitutive theories; however, the majority of these
are phenomenological models that characterize the macroscopic response on the basis of
experimental data. The fundamental characteristics of the one-dimensional steel response
are relatively simple. Thus, the appropriate material model not only predicts this response
with a reasonable level of accuracy but is also calibrated to fit experimental data with rela-
softening. The models differ in the non-linear equations used to model individual charac-
teristics of material response.
The symmetry of compression and tension response as characterized in the natural
stress-strain system is conceptually pleasing; however, it is not obvious that this is neces-
sary for modeling the response of reinforcing steel in reinforced concrete structures sub-
jected to earthquake loading. For this steel, the load history typically is not symmetric
ε σ
ε 1 ε+( )ln=
σ 1 σ+( )ln=
119
with load histories showing significant tensile strain demand and limited compressive
strain demand. For these cases, characterization of the model on the basis of the tensile
monotonic response is perhaps appropriate. Additionally, it is not clear that the enhanced
accuracy of these model justifies the additional complexity and computational effort.
3.4 Characterization of the Response of Reinforcing Steel
For this investigation, a material model is developed that defines those fundamental
characteristics of steel behavior that control the response of reinforced concrete structures
subjected to earthquake loading. This model follows from several previously proposed
models and predicts the uniaxial steel material response as defined by the presented exper-
imental data. Consideration of past research indicates that a macroscopic material model is
most appropriate for prediction of steel response. Further, the results of past research show
that steel behavior may be characterized with acceptable accuracy on the basis of engi-
neering strains and stresses. Here, it is assumed that the observed moderate increase in
Figure 3.9: Engineering Versus Natural Stress-Strain History for Reinforcing Steel Subjected to Monotonic Compression and Tension Loading (Data from Dodd and Restrepo-Posada [1995])
0
100
200
300
400
500
600
700
800
0 0.02 0.04 0.06 0.08 0.1 0.12 0.14 0.16
|Strain| (mm/mm)
|Str
ess|
(M
Pa)
Engineering Stress-Strain: Compression
Engineering Stress-Strain: Tension
True Stress-Strain: Compression
True Stress-Strain: Tension
120
steel yield strength as a function of increased strain rate may be neglected as this increased
strength will only be observed during short periods of rapid loading, will not control
development of a specific failure mechanism in the beam-column joint system and will
facilitate correlation with observed laboratory tests in which loading is pseudo-static.
Strain hardening may determine system strength and necessarily is incorporated into the
model. Here strain hardening is characterized through the assumption that plastic defor-
mation in both tension and compression results in nonlinear hardening as defined by the
experimentally observed monotonic stress-strain response. Finally, experimental data
show that the effect of cyclic strain softening is limited, and this characteristic of response
is not incorporated into the material model.
The proposed model defines the response of reinforcing steel subjected to reversed
cyclic loading on the basis of three characteristic stress-strain response curves: a reference
curve, an unloading curve and a reloading curve. For this investigation, the monotonic
stress-strain histories define the model reference curves. Experimental data show that the
monotonic tensile stress-strain history bounds the tensile response of reinforcing steel sub-
jected to reversed cyclic strain histories with severe tensile strain demands and moderate
compressive demand. For reinforcing steel subjected to severe compressive and tensile
strain demands, the monotonic stress-strain histories, shifted to account for accumulated
plastic deformation provide a reasonably accurate bound for the observed response. Also
for this investigation, unloading and reloading curves are defined using the Menegotto-
Pinto equation and calibration parameters provided by previous researchers. Previous
research shows that the Menegotto-Pinto equation represents well the unloading and
reloading response of reinforcing steel subjected to cyclic loading. Additionally, previous
research provides calibration parameters for this equation that are appropriate for model-
121
ing grades of reinforcing steel typically used in construction of reinforced concrete struc-
tures.
The reference curve is defined on the basis of the monotonic stress-strain history as
determined from experimental testing. Here the equation proposed by Chang and Mander
[1994] is used to describe the monotonic response in compression or tension:
(3-5a)
where
(3-5b)
and is the engineering stress, is the engineering strain, is a function of the plas-
tic deformation in either compression or tension and steel material parameters are as pre-
viously defined. The model variable, , is defined, as proposed by Chang and Mander,
to be a function of the strain at which strain hardening occurs in compression (or tension)
and of the extreme strain experienced in compression (or tension). For the tensile refer-
ence curve, this parameter is defined as follows (here material parameters characterize the
monotonic compressive response):
(3-6)
where k is a weighting parameter defined as follows:
(3-7)
It is important to note that the model variable provides a measure of plastic deforma-
tion; this variable is analogous, but different in definition, to the plastic deformation
the behavior of reinforcing steel subjected to reversed cyclic loading with severe tensile
and moderate compressive strain demand. The proposed material model represents well
the fundamental characteristics of the observed response. However, for this strain history,
in which cyclic strain increments are relatively large in both tension and compression, the
model under represents the observed strain hardening and does not represent the reload
curves accurately. Given that this inaccuracy is relatively small and that this strain history
is extreme for an actual system, the errors in model are acceptable. Figure 3.12 presents
the behavior of reinforcing steel subjected to reversed cyclic loading with severe tensile
and compressive strain demands. Here, the proposed model represents well the fundamen-
tal characteristics of the response. However, the model does not represent the loss in
strength that is observed following cycling to a fixed strain. Since this loss of strength is
minimal and most significant for the case of multiple cycles to a fixed strain in which
there is no accumulation of additional plastic strain and thus no additional material strain
hardening, this inaccuracy is not significant.
3.6 Conclusions
The material model proposed for use in this investigation represents with acceptable
accuracy the behavior of reinforcing steel within the range of loading that is appropriate
for reinforced concrete bridges subjected to earthquake loading. The model employes a
macromodel framework to describe the engineering stress-strain history of reinforcement
subjected to reversed cyclic loading. The model uses nonlinear equations and calibration
factors established by others and is readily calibrated to represent the response of typical
reinforcing steel on the basis of parameters established through monotonic stress-strain
histories. This model is appropriate for predicting the response of typical reinforcing steels
subjected to variable reversed cyclic loading including load histories with severe tensile
strain demand and moderate to extreme compressive stress and strain demands.
125
Analytical Model
Experimental Data
Figure 3.10: Behavior of Reinforcing Steel Subjected to Reversed Cyclic Loading with Severe Tensile Strain Demands and Moderate Compressive Stress Demands as Predicted and as Observed (Data as Presented in Figure 3.4)
Figure 3.11: Behavior of Reinforcing Steel Subjected to Reversed Cyclic Loading with Severe Tensile Strain Demands and Moderate Compressive Strain Demands as Predicted and as Observed (Data as Presented in Figure 3.5)
Analytical Model
Experimental Data
126
Figure 3.12: Behavior of Reinforcing Steel Subjected to Reversed Cyclic Loading with Severe Tensile and Compressive Strain Demands as Predicted and as Observed (Data as Presented in Figure 3.6)