Seventh Northwest Conservation and Electric Power Plan nwcouncil.org/7thplan 3-1 CHAPTER 3: RESOURCE STRATEGY Contents Key Findings ..................................................................................................................................... 3 A Resource Strategy for the Region .................................................................................................. 3 Summary ....................................................................................................................................... 3 Scenario Analysis – The Basis of the Resource Strategy ................................................................. 7 The Resource Strategy ................................................................................................................... 14 Energy Efficiency Resources ....................................................................................................... 15 Demand Response ...................................................................................................................... 21 Natural Gas-Fired Generation ...................................................................................................... 24 Renewable Generation ................................................................................................................ 28 Carbon Policies and Methane Emissions ..................................................................................... 31 Regional Resource Utilization ...................................................................................................... 33 Develop Long-Term Resource Alternatives.................................................................................. 35 Adaptive Management ................................................................................................................. 36 Carbon Dioxide Emissions .............................................................................................................. 36 Federal Carbon Dioxide Emission Regulations ............................................................................ 44 Resource Strategy Cost and Revenue Impacts ............................................................................... 47 List of Tables and Figures Figure 3 - 1: Average Resource Development in Least Cost Resource Strategy by 2035 in Alternative Scenarios ...................................................................................................................... 15 Figure 3 - 2: Average Net Regional Load After Accounting for Cost-Effective Conservation Resource Development ................................................................................................................... 17 Figure 3 - 3: Quantity of Cost-Effective Conservation Resources Developed Under Different Scenarios ........................................................................................................................................ 18 Figure 3 - 4: Regional Conservation Achievements Compared To Sixth Plan Goals ...................... 19 Figure 3 - 5: Achievable Energy Efficiency Potential by Sector and Levelized Cost by 2035 ........... 20 Figure 3 - 6: Monthly Shape of 2035 Energy Efficiency Savings ...................................................... 21 Figure 3 - 7: Demand Response Resource Supply Curve ............................................................... 22 Figure 3 - 8: Demand Response Resource Development by 2021 Under Alternative Scenarios ..... 23 Figure 3 - 9: Probability of New Natural Gas-Fired Resource Development by 2021 ....................... 25 Figure 3 - 10: Probability of New Natural Gas-Fired Resource Development by 2026 ..................... 26 Figure 3 - 11: Average New Natural Gas-Fired Resource Development .......................................... 27 Figure 3 - 12: Average Annual Dispatch of Existing Natural Gas-Fired Resources .......................... 28
Transcript
Seventh Northwest Conservation and Electric Power Plan
nwcouncil.org/7thplan 3-1
CHAPTER 3: RESOURCE STRATEGY
Contents Key Findings ..................................................................................................................................... 3 A Resource Strategy for the Region .................................................................................................. 3
Summary ....................................................................................................................................... 3 Scenario Analysis – The Basis of the Resource Strategy ................................................................. 7 The Resource Strategy ................................................................................................................... 14
Resource Strategy Cost and Revenue Impacts ............................................................................... 47
List of Tables and Figures
Figure 3 - 1: Average Resource Development in Least Cost Resource Strategy by 2035 in Alternative Scenarios ...................................................................................................................... 15 Figure 3 - 2: Average Net Regional Load After Accounting for Cost-Effective Conservation Resource Development ................................................................................................................... 17 Figure 3 - 3: Quantity of Cost-Effective Conservation Resources Developed Under Different Scenarios ........................................................................................................................................ 18 Figure 3 - 4: Regional Conservation Achievements Compared To Sixth Plan Goals ...................... 19 Figure 3 - 5: Achievable Energy Efficiency Potential by Sector and Levelized Cost by 2035 ........... 20 Figure 3 - 6: Monthly Shape of 2035 Energy Efficiency Savings ...................................................... 21 Figure 3 - 7: Demand Response Resource Supply Curve ............................................................... 22 Figure 3 - 8: Demand Response Resource Development by 2021 Under Alternative Scenarios ..... 23 Figure 3 - 9: Probability of New Natural Gas-Fired Resource Development by 2021 ....................... 25 Figure 3 - 10: Probability of New Natural Gas-Fired Resource Development by 2026 ..................... 26 Figure 3 - 11: Average New Natural Gas-Fired Resource Development .......................................... 27 Figure 3 - 12: Average Annual Dispatch of Existing Natural Gas-Fired Resources .......................... 28
Chapter 3: Resource Strategy
nwcouncil.org/7thplan 3-2
Figure 3 - 13: Average Renewable Resource Development by Scenarios by 2021, 2026 and 2035 30 Figure 3 - 14: Average Annual Net Regional Exports for Least Cost Resource Strategies ............... 34 Figure 3 - 15: Carbon Dioxide Regulatory Cost or Price and Societal Cost of Carbon Tested in Scenario Analysis ............................................................................................................................ 37 Table 3 - 1: Average System Costs Excluding Carbon Revenues and PNW Power System Carbon Dioxide Emissions by Scenario ....................................................................................................... 39 Figure 3 - 16: Average Annual Carbon Dioxide Emissions by Carbon Reduction Policy Scenario ... 41 Table 3 - 2: Average Cumulative Emissions Reductions and Present Value Cost Excluding Carbon Revenues of Alternative Carbon Dioxide Emissions Reduction Policies Compared to Existing Policies - Scenario ........................................................................................................................... 42 Table 3 - 3: Pacific Northwest States Clean Power Plan Final Rule Carbon Dioxide Emissions Limits ........................................................................................................................................................ 45 Figure 3 - 17: Average Annual Carbon Dioxide Emissions for Least Cost Resource Strategies by Scenario for Generation Covered by EPA Carbon Emissions Regulations Located Within Northwest States .............................................................................................................................................. 47 Figure 3 - 18: Average Net Present Value System Cost for the Least Cost Resource Strategy by Scenario With and Without Carbon Revenues ................................................................................. 48 Table 3 - 4: Average Net Present Value System Cost without Carbon Dioxide Revenues and Incremental Cost Over Existing Policy Scenario .............................................................................. 49 Figure 3 - 19: Annual Forward-Going Power System Costs, Excluding Carbon Dioxide Revenues 50 Figure 3 - 20: System Costs, Rates, and Monthly Bills, Excluding Carbon Dioxide Revenues ........ 51 Figure 3 - 21: Regional Average Revenue per Megawatt-Hour and Residential Electricity Bills With and Without Lower Conservation ..................................................................................................... 52
Chapter 3: Resource Strategy
nwcouncil.org/7thplan 3-3
KEY FINDINGS The resource strategy for the Seventh Power Plan relies on energy efficiency, demand response, and natural gas-fired generation to meet the region’s needs for energy and peaking capacity. In addition, the region needs to better utilize, expand, and preserve its existing electric infrastructure and research and develop technologies for the long-term improvement of the region’s electricity supply. This resource strategy, with its heavy emphasis on low-cost energy efficiency and demand response, provides a least-cost mix of resources that assures the region an adequate and reliable power supply that is highly adaptable and reduces risks to the power system.
The resource strategy for the Seventh Power Plan consists of eight primary actions: 1) achieve the energy efficiency goals in the Council’s plan, 2) meet short-term needs for peaking capacity through the use of demand response except where expanded reliance on extra-regional markets can be assured, 3) increase the near term use of existing natural gas fired generation, 4) satisfy existing renewable-energy portfolio standards, 5) increase the utilization of regional resources to serve regional energy and capacity needs, 6) support policies that cost effectively achieve state and federal carbon dioxide emission reduction goals while maintaining regional power system adequacy, 7) support the research and development of emerging energy efficiency and clean energy resources and 8) adaptively manage future resource development to match actual future conditions.
A RESOURCE STRATEGY FOR THE REGION The Council’s resource strategy for the Seventh Power Plan provides guidance for Bonneville and the region’s utilities on choices of resources that will supply the region’s growing electricity needs while reducing the economic risk associated with uncertain future conditions, especially those related to state and federal carbon emission reduction policies and regulations. The resource strategy minimizes the costs and economic risks of the future power system for the region as a whole. The timing of specific resource acquisitions is not the essence of the strategy. The timing of resource needs will vary for every utility. Some utilities now find themselves with power supply resources that exceed their retail customers’ demands. For these utilities, low spot market prices for wholesale power reduce the revenues they generate from sales of surplus power, putting pressure on utility budgets. In contrast, the region has been a hotbed for new data center loads as companies like Google, Microsoft, and Facebook take advantage of the mild climate and low electricity prices to develop facilities in the Northwest. The addition of loads from these new data centers to service territory can dramatically change the utilities resource needs. The important message of the resource strategy is the nature and priority order of resource development.
Summary The resource strategy is summarized below in eight elements. The first two are high-priority actions that should be pursued immediately and aggressively. The next five are longer-term actions that must be more responsive to changing conditions in order to provide an array of solutions to meet the long-term needs of the regional power system. The final element recognizes the adaptive nature of the power plan and commits the Council to regular monitoring of the regional power system to identify and adjust to changing conditions.
Chapter 3: Resource Strategy
nwcouncil.org/7thplan 3-4
Energy Efficiency: The Council’s analysis found that development of between 1300 and 1450 average megawatts of energy efficiency by 2021 was cost-effective across a wide range of scenarios and future conditions. The Seventh Power Plan’s resource strategy calls upon the region to aggressively develop conservation with a goal of acquiring 1,400 average megawatts by 2021, 3000 average megawatts by 2026 and 4,300 average megawatts by 2035. Conservation is by far the least-expensive resource available to the region and it avoids risks of volatile fuel prices, financial risks associated with large-scale resources, and it mitigates the risk of potential carbon emission reduction policies to address climate-change concerns. In addition, conservation resources not only provide annual energy savings, but contribute significantly to meeting the region’s future needs for capacity by reducing both winter and summer peak demands.
Demand Response: The Northwest’s power system has historically relied on its large hydroelectric generators to provide peaking capacity. While the hydrosystem can typically meet the region’s peak demands, that likelihood decreases under critical water and weather conditions, which increases the probability of not meeting the Council’s resource adequacy standard without development of additional peaking resources.
The least-cost solution for providing new regional peaking capacity is to develop cost-effective demand-response resources – voluntary and temporary reductions in consumers’ use of electricity when the power system is stressed. However, the Council’s analysis also found that the need for demand response resources is sensitive to assumptions regarding the availability and prices of importing power from outside the region to meet peak demands under lower water and extreme temperature conditions. The Council’s analysis indicates that a minimum of 600 MW of demand response resources would be cost-effective to develop under all future conditions tested across all scenarios which do not rely on increased firm capacity imports. Moreover, even if additional firm peak power imports during winter months are assumed to be available, developing a minimum of 600 MW of demand response resources is still cost-effective in over 70 percent of the futures tested.
In order to satisfy regional resource adequacy standards the region should develop significant demand response resources by 2021 to meet the need for additional peaking capacity. The Seventh Power Plan Action Plan recommends that the annual assessment of regional resource adequacy consider the comparative cost and economic risk of increased reliance on external market purchases versus development of demand response resources to meet winter capacity needs within the region. The Council will determine if the region has made sufficient progress towards acquiring cost-effective demand response or confirming import capability to provide the region with a minimum additional peaking capacity of at least 600 MW in its mid-term assessment of progress on the Seventh Power Plan.
Natural Gas: It is clear that after efficiency and demand response, new natural gas-fired generation is the most cost-effective resource option for the region in the near-term. Moreover, after energy efficiency, the increased use of existing natural gas generation offers the lowest cost option for reducing regional carbon emissions.1 At the regional level, the probability that new natural gas-fired
1 The Council recognizes that in addition to the carbon dioxide emissions produced by the combustion of natural gas, the fugitive methane emissions from natural gas production and transportation could have significant climate change impacts.
Chapter 3: Resource Strategy
nwcouncil.org/7thplan 3-5
generation will be needed to supply peaking capacity prior to 2021 is quite low. If the region does not deploy the demand response resources and develop the level of energy efficiency resources called for in this plan, the need for more costly new gas-fired generation increases. In the mid-term (by 2026) there appears to be a modest probability that new gas fired generation could be needed to replace retiring coal generation or potentially to displace additional coal use to meet federal carbon-reduction goals. Nevertheless, even if the region has adequate resources, individual utilities or areas may need additional supply for capacity or wind integration when transmission and power market access is limited. In these instances, the Seventh Power Plan’s resource strategy relies on new natural gas-fired generation to provide energy, capacity, and ancillary services.
Renewable Resources: The Seventh Power Plan’s resource strategy assumes that only modest development of renewable generation, approximately 100 - 150 average megawatts of energy, or around 250 to 400 megawatts of installed capacity by 2035, is necessary to fulfill existing renewable portfolio standards. While the majority of historical renewable development in the region has been wind resources, recent and forecast further cost reductions in solar photovoltaic (solar PV) technology are expected to make electricity generated from such systems increasingly cost-competitive. In addition, solar PV systems, particularly when coupled with storage, can provide summer peaking services for which regional demand is increasing faster than winter peaking needs. As a result, solar PV systems should be seriously considered when determining which resources to acquire to comply with existing renewable portfolio standards. In addition, while to date regional development of geothermal resources has been limited, these resources offer significant potential and can provide both winter and summer capacity.
The Seventh Power Plan’s resource strategy encourages the development of other renewable alternatives that may be available at the local, small-scale level and are cost-effective now. Because power production from wind and solar PV projects creates little dependable peak capacity and increases the need for within-hour balancing reserves the strategy also encourages research on and demonstration of different sources of renewable energy for the future, especially those with a more consistent output like geothermal or wave energy.
The Council did not evaluate whether the increased use of renewable resources would be a cost-effective alternative for state level compliance with federal carbon dioxide emissions regulations or state level carbon emissions goals. The Council did find that increasing the requirements of state renewable portfolio standards alone would not result in the development of the least cost resource strategy for the region nor the least cost resource strategy for reducing carbon at the regional level.
See Appendix I for more detailed discussion methane emissions from natural gas production and distribution. A discussion of how fugitive emissions of methane were considered in the development of the Council’s resource strategy appears in the following section.
Chapter 3: Resource Strategy
nwcouncil.org/7thplan 3-6
Regional Resource Utilization: The region should continue to improve system scheduling and operating procedures across the region’s balancing authorities to maximize cost-effectiveness and minimize the need for new resources needed for integration of variable energy resource production. In addition, the region needs to invest in its transmission grid to improve market access for utilities and to facilitate development of more diverse cost-effective renewable generation. Finally, the Council identified least cost resource strategies for the region that rely first on regional resources to satisfy the region’s resource adequacy standards. Under many future conditions, these strategies reduce regional exports.
Carbon Policies and Methane Emissions: To support policies that cost effectively achieve state and federal carbon dioxide emission reduction goals while maintaining regional power system adequacy the region should develop the energy efficiency and demand response resources called for in this plan and replace retiring coal plants with only those resources required to meet regional capacity and energy adequacy requirements. As stated above, after energy efficiency, the increased use of existing natural gas generation offers the lowest cost option for reducing regional carbon emissions in the near term. Utility development of new gas-fired generation to meet local needs for ancillary services, such as wind integration, or capacity requirements beyond the modest levels anticipated in this plan will increase carbon dioxide emissions. If Northwest electricity generation is dispatched first to meet regional adequacy standards for energy and capacity rather than to serve external markets, the increase in regional carbon dioxide emissions can be minimized.
The Northwest will likely have a competitive advantage if pricing policies are used throughout the western electricity market to reduce carbon dioxide emissions. The region’s large existing non-carbon emitting resource base increases in value under most carbon pricing policies. If west-wide or national carbon prices are imposed, the value of low or no carbon content power exports will increase. Revenues from these exports will partially offset the regional cost of achieving carbon dioxide emission reductions.
As noted above, a central element in transitioning the Northwest power system to an even lower carbon footprint involves the increased use of natural gas, which consists primarily of methane. While burning natural gas produces significantly less carbon dioxide emissions per unit of electricity generation, its production and distribution releases methane into the atmosphere. Methane is a highly active greenhouse gas, with a global warming potential 28 to 36 times that of carbon dioxide.2 The Seventh Power Plan’s overall resource strategy seeks to minimize the need to develop new gas generation by meeting most future energy and capacity needs with energy efficiency and demand response. Successful implementation of this strategy provides time to take actions to reduce current fugitive methane emissions and minimize new methane emissions, so that the use of natural gas does produce a reduction in climate change impacts.
Future Resources: In the long term, the Council encourages the region to expand its resource alternatives. The region should explore additional sources of renewable energy, especially technologies that can provide both energy and winter capacity, improved regional transmission
2 See Appendix I for a more complete description of methane’s potential environmental impacts and the uncertainties surrounding fugitive emission sources and levels.
Chapter 3: Resource Strategy
nwcouncil.org/7thplan 3-7
capability, new conservation technologies, new energy-storage techniques, smart-grid technologies and demand-response resources, and new or advanced low-carbon generating technologies, including advanced nuclear energy. Research, development, and demonstration funding should be prioritized in areas where the Northwest has a comparative advantage or unique opportunities. For example, the potential for developing geothermal and wave energy in the Northwest is significantly greater than in many other areas of the country.
Adaptive Management: The Council will annually assess the adequacy of the regional power system. Through this process, the Council will be able to identify whether actual conditions depart so significantly from planning assumptions that it would require adjustments to the plan. This annual assessment will provide the region time to take actions necessary to reduce the probability of power shortages. The Council will also conduct a mid-term assessment to review plan implementation.
SCENARIO ANALYSIS – THE BASIS OF THE RESOURCE STRATEGY Scenarios combined elements of the future that the region controls, such as the type, amount and timing of resource development, with factors the region does not control, such as natural gas and wholesale market electricity prices. Sensitivity studies alter one parameter in a scenario to test how the least-cost resource strategy is affected by that input assumption. For example, several scenarios were run with and without future carbon cost to assess the impact of that input assumption on the various components of the least cost resource strategy.
All of the scenarios evaluated for the Seventh Power Plan include the same range of uncertainty regarding future fuel prices, hydropower conditions, electricity market prices, capital costs, and load growth. However, several scenarios were specifically designed to provide insights into the cost and impacts of specific alternative resource strategies and carbon dioxide emissions reduction policies. For example, the Council tested scenarios that excluded the development of demand response resources or required the development of a minimum amount of renewable resources.
To investigate policy options for reducing carbon dioxide emissions some scenarios included either the federal government’s estimates of the societal damage cost of carbon dioxide emissions or the economic risk associated with future carbon dioxide regulation or pricing or “non-pricing” policies. Each of these scenarios assumed differing levels of carbon dioxide damage or regulatory cost. Also, as noted above, several sensitivity studies were conducted to assess the impact of such factors as the near term pace of conservation development, lower natural gas and wholesale electricity prices, greater reliance on external markets, or the loss of major resources.
The US Environmental Protection Agency (EPA) released its draft Clean Power Plan in June, 2014, and its final set of regulations in August, 2015. 3 These regulations establish carbon dioxide
3 U.S. Environmental Protection Agency, "Carbon Pollution Emission Guidelines for Existing Stationary Sources: Electric Utility Generating Units," 80 Fed. Reg. 64,662 (October 23, 2015). A coalition of states, utilities, utility organizations and others challenged the rule applying to existing sources in the federal D.C. Circuit Court of Appeals. The U.S. Supreme
Chapter 3: Resource Strategy
nwcouncil.org/7thplan 3-8
emissions limits for both new and existing power plants. Eight of the scenarios summarized below: the two Social Cost of Carbon (Mid-Range and High), Carbon Cost Risk, Regional Renewable Portfolio Standards at 35 Percent, Maximum Carbon Reduction – Existing Technology, Coal Retirement, Coal Retirement with the Social Cost of Carbon and Coal Retirement with the Social Cost of Carbon and No New Gas were designed to test alternative policies that may be considered at the regional or state level to identify resource strategies that would comply with those regulations. Two other scenarios, the Planned Loss of a Major Non-Greenhouse Gas (GHG) Emitting Resource and the Unplanned Loss of a Major Non-GHG Emitting Resource were analyzed to provide insights into the effect of the loss of a major non-greenhouse gas-emitting would have on the region’s ability to reduce power system carbon dioxide emissions.
Each scenario and sensitivity analysis tested thousands of potential resource strategies against 800 alternative future conditions to identify the least cost and lowest economic risk resource portfolios. Since the discussion of the elements of the resource strategy draws on those scenarios and sensitivity studies, an introduction to the scenarios and studies and their findings is needed. Each scenario or sensitivity study was designed to explore specific components of resource strategies (e.g. strategies with and without demand response). The Seventh Power Plan’s resource strategy is based on analysis of over 25 scenarios and sensitivity studies.4 Eighteen of principal scenarios or sensitivity studies that informed the development of the Seventh Power Plan’s final resource strategy are summarized below. Not all scenarios or sensitivity studies “stress test” the same element of a resource strategy or policy option, so not all provide useful insight regarding that element or policy. Therefore, the following discussion of findings compares different subsets or combinations of scenarios and sensitivity studies when discussing a specific element of the Seventh Power Plan’s resource strategy.
Existing Policy – The existing-policy scenario includes current federal and state policies such as renewable portfolio standards, new plant emissions standards, and renewable energy credits, but it does not assume any additional carbon dioxide regulatory cost or economic risk in the future. Specifically, it does not reflect any actions Northwest states may
Court stayed the effectiveness of the rule in an order issued February 9, 2016, pending not just review on the merits by the court of appeals but also the resolution of any petition for further review in the Supreme Court following whatever decision is issued by the court of appeals. The litigation is ongoing as the Council completed the Seventh Power Plan. 4Ten scenarios were analyzed between the draft and final adoption of the Seventh Power Plan. These include updates to seven scenarios analyzed during the development of the draft plan and three new scenarios suggested by public comment. The draft plan’s findings for any of the scenarios and sensitivity studies not updated for the final plan are described in Appendix O.
Chapter 3: Resource Strategy
nwcouncil.org/7thplan 3-9
take in order to comply with recently finalized limits on carbon dioxide emissions from existing power generation. However, this scenario does serve as a point of departure for assessing the regional effect of carbon dioxide cost and economic risk when added to existing policies. Other major uncertainties regarding the future, such as load growth and natural gas and market electricity prices are considered. Updated results for this scenario are reported in the final plan.
Social Cost of Carbon (SCC) – Two scenarios, the Social Cost of Carbon – Mid-Range (SCC-MidRange) and Social Cost of Carbon – High (SCC-High), use the US Interagency Working Group on Social Cost of Carbon’s estimates of the damage cost of forecast global climate change. According to the Working Group:
o The SCC is an estimate of the economic damages associated with a small increase in
carbon dioxide (CO2) emissions, conventionally one metric ton, in a given year. This dollar figure also represents the value of damages avoided for a small emission reduction (i.e. the benefit of a CO2 reduction). Therefore, in theory, the cost and economic risk of the resource strategy that achieves carbon dioxide emissions reductions equivalent to the social cost of carbon would offset the cost of damage. The SCC-MidRange scenario uses the Interagency Working Group’s mid-range estimate of the damage cost from carbon dioxide emissions based on a three percent discount rate. The SCC-High scenario uses the Interagency Working Group’s estimate of damage cost that encompasses 95 percent of the estimated range of damage costs.5 Updated results for the SCC-MidRange scenario are reported in the final plan. The final plan’s findings for the SCC-High scenario would not be materially different than those reported in the draft plan, although due to the use of a lower range of natural gas prices the average system cost of this scenario would be slightly lower. The draft plan’s findings for the SCC-High scenario are discussed in Appendix O.
Carbon Cost Risk – The carbon cost risk scenario is intended to explore what resources result in the lowest expected cost and economic risk given existing policy plus the economic risk that additional carbon dioxide reduction policies will be implemented. Each of the 800 futures imposes a carbon dioxide price from $0 to $110 per metric ton at a random year during the 20 year planning period. Over time, the probability of a carbon dioxide price being imposed and the level of that price both increase. By 2035, the average price of carbon dioxide rises to $47 per metric ton across all futures. It should be noted, that the use of a carbon dioxide price does not presume that a “pricing policy” (e.g., carbon tax, cap and trade system) would be used to reduce carbon dioxide emissions. The prices imposed in this
5 Chapter 15 provides the year-by-year social cost of carbon used in these scenarios.
Chapter 3: Resource Strategy
nwcouncil.org/7thplan 3-10
scenario could also be a proxy for the cost imposed on the power system through regulation to reduce carbon dioxide emissions (e.g., caps on emissions). This scenario was initially designed to represent the current state of uncertainty about future carbon dioxide control policies and develop a responsive resource strategy. It is identical to a scenario analyzed for the development of the Sixth Power Plan. While with the promulgation of Environmental Protection Agency’s carbon dioxide emissions regulations there is less uncertainty regarding federal regulations, the specific form of state and/or regional compliance plans with EPA’s regulations are unknown. Moreover, some states may choose to adopt additional policies beyond the federal regulations to limit power system emissions. Updated results for the Carbon Cost Risk scenario are not reported in the final plan. The final plan’s findings for the Carbon Cost Risk scenario would not be materially different than those reported in the draft plan, although due to the use of a lower range of natural gas prices the average system cost of this scenario would be slightly lower. The draft plan’s findings for the Carbon Cost Risk scenario are discussed in Appendix O.
Regional Renewable Portfolio Standard at 35 Percent (Regional RPS at 35%) – This scenario assumes that a region wide Renewable Portfolio Standard (RPS) is established at 35 percent of regional retail electricity sales across all four Northwest states. Presently, three states in the region have RPS. Montana and Washington require that 15 percent of the retail sales of be served by renewable resources. Montana’s RPS must be satisfied in 2015 and Washington’s by 2020. Oregon requires that 20 percent of retail sales be served by renewable resources by 2020. These state level RPS generally only apply to investor owned utilities and larger public utilities, while this scenario assumes that all of the region’s retail sales are covered. Since this scenario was designed to test the cost and effectiveness of this policy for reducing regional power system carbon dioxide emissions, it did not include future carbon dioxide regulatory cost risk uncertainty or estimated damage cost. The cost-effectiveness of a policy that only requires use of additional renewable generation can, therefore, be compared to other scenarios that tested alternative policy options to reduce carbon dioxide emissions, including those use a combination of strategies such as limiting the type of new resources that can be developed and imposing a carbon price.
Updated results for the Regional Renewable Portfolio Standard at 35% scenario are reported in the final plan.
Maximum Carbon Reduction – Existing Technology – This scenario was designed to
explore the maximum carbon dioxide emissions reductions that are feasible with current commercially available technologies. In this scenario all of the existing coal plants serving the region were assumed to be retired by 2026. In addition, the least efficient (i.e., those with heat rates exceeding 8,500 Btu/kWh) existing natural gas-fired generating facilities were assumed to be retired by 2031. No carbon dioxide cost risk or estimated damage cost was assumed, so this scenario can be compared to the cost-effectiveness of other policy options (e.g., Carbon Cost Risk, Regional RPS at 35%, Social Cost of Carbon, Retire Coal w/SCC MidRange, etc. scenarios) for reducing carbon dioxide emissions.
Chapter 3: Resource Strategy
nwcouncil.org/7thplan 3-11
Updated results for the Maximum Carbon Reduction – Existing Technology scenario are reported in the final plan.
Maximum Carbon Reduction – Emerging Technology – This scenario considers the role of new technologies might play in achieving carbon dioxide reduction. Due to the speculative nature of the performance and ultimate cost of technologies considered in this scenario the Council’s Regional Portfolio Model (RPM) was not used to identify this scenario’s least cost resource strategy. Rather, the RPM was used to define the role (e.g., capacity and energy requirements) that new and emerging technologies would need to play in order to achieve carbon dioxide reductions beyond those achievable with existing technology. Updated results for the Maximum Carbon Reduction – Emerging Technology scenario are not reported in the final plan. The results of the Maximum Carbon Reduction – Emerging Technology scenario would not differ materially from those reported in the draft plan. The draft plan’s findings for the Maximum Carbon Reduction – Emerging Technology scenario are discussed in Appendix O.
Retire Coal – This scenario is identical to the Maximum Carbon Reduction – Existing
Technology scenario, except that it does not retire any existing natural gas generation. This scenario was designed to establish the lowest carbon dioxide emission level achievable by retiring all of the existing coal plants serving the region while assuming the continued operation of existing gas-fired generation. Since this resource strategy relies on existing gas generation rather than investing new resource development it could potentially have lower costs than the Maximum Carbon Reduction – Existing Technology scenario, but might produce similar carbon dioxide emissions. This scenario constructed based on public comment on the draft plan, and therefore was not considered during its development.
Retire Coal with Social Cost of Carbon Mid-Range (Retire Coal w/SCC MidRange) – This scenario is identical to Retire Coal scenario, except that it assumes that the US Interagency Working Group on Social Cost of Carbon’s Mid-Range estimate of the damage cost of forecast global climate change are reflected in fossil fuel costs. This scenario was designed to test the cost, economic risk and carbon emissions impacts that internalizing the damage cost of climate change would have on the resource dispatch and development. It was assumed that this scenario’s resource strategy would rely more on renewable resources. Therefore, this scenario assumes greater availability and lower solar PV system cost for both utility scale projects and distributed systems. This scenario was constructed based on public comment on the draft plan, and therefore was not considered during its development.
Retire Coal with Social Cost of Carbon Mid-Range and No New Gas Generation (Retire Coal w/SCC MidRange & No New Gas) – This scenario is identical to Retire Coal w/SCC MidRange scenario, except that it assumes that no new natural gas-fired generation resources can be constructed to replace retiring coal plants or existing gas generation if such plants are uneconomic to operate. This scenario was designed to test the cost, economic risk and carbon emissions impacts of restricting new resource development to renewable resources when compared to the Retire Coal w/SCC MidRange scenario. This scenario
Chapter 3: Resource Strategy
nwcouncil.org/7thplan 3-12
was constructed based on public comment on the draft plan, and therefore was not considered during its development.
Resource Uncertainty – Four scenarios explored resource uncertainties and carbon dioxide regulatory compliance cost and economic risk. Two examined the effect that the loss of a major non-greenhouse gas-emitting resource might have on the region’s ability to reduce power system carbon dioxide emissions. The Unplanned Major Resource Loss scenario assumed that a significant (approximately 1000 average megawatt) non-greenhouse gas emitting generator was unexpectedly taken out of service. The Planned Major Resource Loss scenario assumed that similar magnitudes of the region’s existing non-greenhouse gas emitting resources were phased out over the next 20 years. Since both of these scenarios were designed to identify resource strategies that would maintain regional compliance with federal carbon dioxide emissions limits they assumed the cost of future carbon dioxide regulatory risk used in the Carbon Cost Risk scenario.
The Planned Major Resource Loss scenario also provides insight into the resource implications that would occur in the event of the planned removal of any specific non-carbon resource in the region, including the removal of major hydroelectric projects such as the four federal dams on the lower Snake River The lower Snake River dams have a combined nameplate capacity of 3,033 megawatts. However, because of limited reservoir storage, their useful peaking capability (e.g. 10-hour sustained-period capacity) ranges from about 1,700 to 2,000 megawatts, which represents about 11 percent of the aggregate hydroelectric system’s sustained peaking capability.6 Annually, on average, these four projects produce about 1,000 average megawatts of energy or about 5 percent of the region’s annual average load.
The effect on the Council’s resource strategy of removing these dams was assessed in the Sixth Power Plan.7 In that assessment, however, generation from all four projects was removed in one year (2020). A more practical approach would be to remove the projects in sequence over a number of years to minimize disruption to both energy and fish needs as was assumed in Planned Major Resource Loss scenario in the Seventh Power Plan.
While the Seventh Power Plan does not include an explicit analysis of the effects of removing the four lower Snake River dams, it does provide a scenario for the planned loss of a large (1,000 average megawatt) non-carbon resource in four stages over a period of 10 years. And, although this scenario is more generic, it better represents the timing of the loss of generation. What it does not include are details of potential shifts in generation at other
6 This range is based on information from the Bonneville Power Administration’s 2015 White Book, Technical Appendix – Volume 2, Capacity Analysis (DOE/BP-4741), pages 246 and 247. From that data, the peaking capability of the four lower Snake River dams relative to the total regional hydroelectric peaking capability is 11 percent. The 1,700 to 2,000 megawatt range for the four lower Snake River dams was calculated by multiplying the Council’s estimated regional firm (low water) 10-hour sustained peaking capability by 11 percent for each season (quarter) of the year. 7 Sixth Northwest Conservation and Electric Power Plan, Chapter 10: Resource Strategy, pages 10-27 and 10-28. http://www.nwcouncil.org/media/6344/SixthPowerPlan_Ch10.pdf
hydroelectric projects that would result from the loss of the four lower Snake River dams. On a comprehensive scale, however, these shifts are relatively small and will even out in the long run because the hydroelectric system cannot simply make up for the loss of generation from the lower Snake River dams. Thus, the resulting effects on the resource strategy should be similar for both cases in the sense of the types and magnitude of replacement resources. If the Council had analyzed the timed removal of the four lower Snake River dams, resource strategies would have had to also account for the 1,700 to 2,000 megawatts of sustained peaking loss and not just the loss of 1,000 average megawatts of energy generating capability. This would have likely increased the magnitude of the requirement for replacement resources.
Two additional scenarios tested the economic benefits or cost resulting from a faster or slower near term pace of conservation deployment. The Faster Conservation Deployment scenario allowed the Regional Portfolio Model to increase the pace of acquiring conservation savings by 30 percent above the baseline assumption. The Slower Conservation Deployment scenario restricted the RPM’s option to acquire conservation savings to a pace that was 30 percent below the baseline assumption. Since both of these scenarios were designed to test resource strategies that might reduce the cost or increase the economic risk of compliance with federal carbon dioxide emissions limits, they assumed the carbon dioxide regulatory cost risk used in the Carbon Cost Risk scenario. Updated results for the Resource Uncertainty scenarios are not reported in the final plan. The results of these scenarios would not differ materially from those reported in the draft plan. That is, the replacement resource strategy and relative impact on regional carbon emissions would remain unchanged. However, since the final plan assumed lower natural gas and wholesale electricity prices the average system cost and economic risk of these scenarios would be slightly less due to the reduced the cost of fuel supplying replacement resources. The lower range of natural gas prices assumed in the final plan would also decrease the cost of the Faster Conservation Deployment and Slower Conservation Deployment scenarios, but not their cost relative to one another. The draft plan’s findings for all four of the resource uncertainty scenarios are discussed in Appendix O.
• No Demand Response – This sensitivity study assumed that no demand response resources were available to meet future regional peak capacity needs. It estimated the cost and risk of not using demand response to provide regional capacity reserves under both the Existing Policy scenario and with the future carbon dioxide regulatory cost assumed in the Carbon Cost Risk scenario. Updated results for the No Demand Response scenario are reported in the final plan.
• Low Natural Gas and Wholesale Electricity Prices – This sensitivity study assumed that the range of future natural gas and wholesale electricity prices the region would experience was systematically lower than the baseline assumptions. It was designed to test the impact of lower gas and electricity prices on the amount of cost-effective conservation and on the best future mix of generating resource development. This sensitivity study was tested under both the Existing Policy scenario and with the future carbon dioxide regulatory cost assumed in the Carbon Cost Risk scenario. The final plan assumed lower natural gas and
Chapter 3: Resource Strategy
nwcouncil.org/7thplan 3-14
wholesale electricity market prices than the draft plan so results for the Low Natural Gas and Wholesale Electricity Prices sensitivity study are not reported in the final plan. The draft plan’s findings for these two scenarios are discussed in Appendix O.
• Increased Market Reliance – This scenario explored the potential benefits and risk of increased reliance on out-of-region markets to meet regional resource adequacy standards. It evaluated the cost of meeting near-term peak capacity needs with demand response and other regional resources compared to reliance on external Southwest and Canadian markets. This sensitivity study was conducted using the Existing Policy scenario. Updated results for the Increased Market Reliance scenario are reported in the final plan.
Lower Conservation – This sensitivity study explored the potential costs and benefits associated with less reliance on energy efficiency. Under this scenario, the acquisition of conservation was limited to what would be cost-effective to acquire based on short-run market prices, rather than full consideration of long-term resource costs and economic risks. This sensitivity study was conducted using the Existing Policy scenario, so no carbon dioxide regulatory cost risk or damage costs were assumed. Updated results for Lower Conservation scenario are reported in the final plan.
Results of these studies are compared in the discussion of the eight elements of the resource strategy in the following section. A discussion of the specific input assumptions for each of these scenarios as well as a more comprehensive discussion of carbon dioxide emissions, rate and bill impacts, and the Regional Portfolio Model appears in Chapter 15 and Appendix L.
THE RESOURCE STRATEGY The resource strategy of the Seventh Power Plan is designed to provide the region a low-cost electricity supply to meet future load growth. It is also designed to provide a low economic risk electricity future by ensuring that the region develops and controls sufficient resources to maintain resource adequacy, limiting exposure to potential market price extremes. Therefore the amount and type of resources included in the strategy are designed to meet loads, minimize costs, and help reduce the economic risks posed by uncertain future events.
Figure 3 - 1 shows the average resource development by resource type for the least cost resource strategy under the major scenarios and sensitivity studies carried out to support the development of the final Seventh Power Plan. The resource development shown in Figure 3 - 1 is the average over all 800 futures modeled in the Regional Portfolio Model (RPM). In the RPM the specific timing and level of resource development is unique to each of the 800 potential futures modeled. The Seventh Power Plan’s principal of adaptive management is based on the reality that, as in the RPM, the timing and level of resource development in the region will be determined by actual conditions as they unfold over the next 20 years. However, what should not change are the Seventh Power Plan’s priorities for resource development. In that regard, Figure 3 - 1 shows the significant and consistent role of energy efficiency across all scenarios. This is because of its low cost, its contribution to regional winter capacity needs and its role in mitigating economic risk from fuel price uncertainty and volatility.
Chapter 3: Resource Strategy
nwcouncil.org/7thplan 3-15
After energy efficiency, the average development of new natural gas generation and renewable resources by 2035 varies significantly across scenarios. New natural gas-fired resources are developed to meet regional capacity needs and to replace existing coal generation in scenarios where all of those resources are assumed to be retired (e.g., Retire Coal, Retire Coal w/SCC MidRange, Maximum Carbon Reduction – Emerging Technology). Renewable resource development is driven by state renewable resource portfolio standards. Not shown in Figure 3 - 1 is the deployment of demand response resources because these resources primarily provide capacity (megawatts) not energy (average megawatts) and the increased dispatch of existing gas generation to replace already announced coal generation retirements. Both of these resources also play significant roles in the Seventh Power Plan’s resource strategy. Each element of the resource strategy is discussed below.
Figure 3 - 1: Average Resource Development in Least Cost Resource Strategy by 2035 in Alternative Scenarios
Energy Efficiency Resources Energy efficiency has been important in all previous Council power plans. The region has a long history of experience improving the efficiency of electricity use. Since the Northwest Power Act was enacted, the region has developed nearly 5,800 average megawatts of conservation. This achievement makes efficiency the second-largest source of electricity in the region following hydroelectricity.
As in all prior plans, the highest priority new resource in the Seventh Power Plan resource strategy is improved efficiency of electricity use, or conservation. Figure 3 - 2 shows that the region’s net load
- 1,000 2,000 3,000 4,000 5,000
Retire Coal w/SCC_MidRange & No New Gas
Max. CO2 Reduction - Exist. Tech.
SCC - Mid-Range
No Demand Response
Retire Coal w/SCC_MidRange
Existing Policy
Retire Coal
Regional RPS at 35%
Increased Market Reliance
Lower Conservation
Average Megawatts
Renewable Natural Gas Energy Efficiency
Chapter 3: Resource Strategy
nwcouncil.org/7thplan 3-16
after development of all-cost effective energy efficiency remains essentially the same over the next 20 years. This finding holds under scenarios that both consider damage cost and those that do not. The only scenario that developed significantly less energy efficiency was the scenario specifically designed to do so. The Lower Conservation scenario developed roughly 1800 average megawatts less energy efficiency by 2035 than the Existing Policy scenario. The Lower Conservation scenario had significantly higher ($15 billion) average system cost and exposed the region to much larger ($22 billion) economic risk than the Existing Policy scenario.8 However, as Figure 3 - 2 shows, even under that scenario, the development of energy efficiency offsets nearly all regional load growth through 2025.
The attractiveness of improved efficiency is due to its relatively low cost coupled with the fact that it provides both energy and capacity savings and is not subject to major sources of economic risk. The average cost of conservation developed in the least cost resource strategies across all scenarios tested was half the cost of alternative generating resources. The average levelized cost of the cost-effective efficiency developed in the Seventh Power Plan’s resource strategy is $30 per megawatt-hour.9 The comparable estimated cost of a natural gas-fired combined-cycle combustion turbine is around $71 per megawatt-hour. The current cost of utility scale solar photovoltaic systems is approximately $91 per megawatt-hour and Columbia Basin wind costs $110 per megawatt-hour, including the cost of integrating these variable output resources into the power system.10 The projected cost of conventional geothermal resources is around $85 per megawatt-hour, although this resource poses significant development risk. Significant amounts of improved efficiency also cost less than the forecast market price of electricity. Nearly 2,400 average megawatts of energy efficiency are available at cost below $30 per megawatt-hour.
Energy efficiency also lacks the economic risk associated with volatile fuel prices and carbon dioxide emission reduction policies. Its short lead time and availability in small increments also reduce its economic risk. Therefore, improved efficiency reduces both the cost and economic risk of the Seventh Power Plan’s resource strategy.
8 The cost of resource strategies reported in the Seventh Power Plan generally exclude revenues from carbon prices in order to compare scenarios based only on power system costs. The text will identify whether carbon revenues are included or not. In practice, carbon revenue may not be considered a cost if all of it is returned to ratepayers, for example, in the form of tax reduction. 9 This is the average real levelized cost of all conservation measures acquired in the resource strategy, excluding a cost-offset that is expected to occur as a result of lower load growth which defers the need to expand distribution and transmission systems. In evaluating conservation’s cost-effectiveness in the RPM, this cost-offset was included, as well as other non-energy benefits, such as water savings from more efficient clothes washers. If the cost-offset benefits provided by energy efficiency’s deferral of investments in distribution and transmission expansion are considered, the average levelized cost is $18 per megawatt-hour. 10 The levelized cost of solar PV resources has been reduced by the impact of a 30% Federal Investment Tax Credit (ITC) until 2022 and a 10% ITC for the remainder of the planning period. Geothermal cost have been also been reduced by 10% ITC throughout the entire planning period. In addition, solar, wind and geothermal resource costs are also reduced by accelerated depreciation. No state or local tax or other financial incentives are reflected in resource costs. The cost of these resources also reflect integration costs equivalent to current integration rates for wind resources charged by Bonneville and Idaho Power Company’s integration rates for solar PV systems. The integration cost of additional renewable resource development in the region may be higher.
Chapter 3: Resource Strategy
nwcouncil.org/7thplan 3-17
Figure 3 - 2: Average Net Regional Load After Accounting for Cost-Effective Conservation Resource Development
In the Council’s analysis, additional resources are added to provide insurance against future uncertainties. Efficiency improvement provides attractive insurance for this purpose because of its low cost. In futures or time periods when the extra resources are not immediately needed, the energy and capacity can be sold in the market and all or at least a portion of their cost recovered. This is not true for generating resources, for in periods when market prices are at or below their variable operating cost; these resources cannot recover any of their capital cost. In addition, because of its low average cost to utilities, the development of energy efficiency offers the potential opportunity to extend the benefits of the Northwest’s hydro-system through increased sales.
In all of the scenarios and sensitivity studies examined by the Council, similar amounts of improved efficiency were found to be cost-effective.11 The selection of energy efficiency as the primary new resource does not depend significantly on whether carbon dioxide policies are enacted. However, since energy efficiency is being developed in part because it provides winter and summer peaking capacity the amount developed is related to other resource options for meeting winter and summer peak needs.
11 The only exceptions are the Lower Conservation scenario which as explicitly designed to develop less energy efficiency and the Increased Market Reliance scenario which assumes that the region can rely more on imports to meets its peak capacity needs.
-
5,000
10,000
15,000
20,000
25,000
2016 2021 2026 2031
Net
Load
Aft
er E
nerg
y Ef
ficie
ncy
(aM
W)
Existing Policy
SCC - MidRange
Lower Conservation
Chapter 3: Resource Strategy
nwcouncil.org/7thplan 3-18
Figure 3 - 3 shows the average amount of efficiency acquired in various scenarios considered by the Council in the power plan by 2021, 2026, and 2035. In the Existing Policy, Social Cost of Carbon-MidRange and No Demand Response scenarios, the amount of cost-effective efficiency developed averages between 1,300 and 1,450 average megawatts by 2021 and 3,000 and 4,300 by 2035. In scenarios that assume that peaking capacity can be provided by demand response or increased reliance on external markets, the amount of cost-effective energy efficiency developed is slightly less, averaging 1200 aMW by 2021 and 2600 aMW by 2026 and 3700 aMW by 2035. The amount of conservation developed varies in each future considered in the Regional Portfolio Model. For example, in the Social Cost of Carbon - MidRange scenario, the average conservation development is 4,460 average megawatts, but individual futures can vary from just over 3900 average megawatts to as high as just under 4,900 average megawatts.
Figure 3 - 3: Quantity of Cost-Effective Conservation Resources Developed Under Different Scenarios
The nature of efficiency improvement is that the total cost is recovered over a smaller number of sales. Average cost per kilowatt-hour sold will increase, but because total consumption is reduced, average consumer electricity bills will be smaller. Consumers who choose not to improve their efficiency of use could see their bills increase. However, if the region does not capture the efficiency, the higher cost of other new generating resources will increase the average bill. The impact on both bills and average revenue requirement per megawatt-hour is discussed later in this chapter.
The amount of efficiency included in the Seventh Power Plan is comparable to that identified in the Council’s Sixth Power Plan; even though the 20-year goal is lower (4,300 aMW vs. 5,800 aMW). To a large extent, this decrease is the result of regional energy efficiency program achievements since the Sixth Power Plan was adopted in 2010 as well as significant savings that will be realized as a
-
500
1,000
1,500
2,000
2,500
3,000
3,500
4,000
4,500
5,000
SCC - Mid-Range No Demand Response
Existing Policy Increased Market Reliance
Lower Conservation
Cum
ulat
ive
Cons
erva
tion
Deve
lopm
ent (
aMW
)
2021
2026
2035
Chapter 3: Resource Strategy
nwcouncil.org/7thplan 3-19
result of federal standards and state codes enacted since the Sixth Power Plan was adopted. Figure 3 - 4 shows regional utility cumulative conservation program achievements from 2010 through 2014 compared to the Sixth Power Plan’s conservation goal for the same period. In addition, Figure 3 - 4 shows the savings achieved from the combined impact of federal and state appliance and equipment standards, state building codes, and market-induced savings. In aggregate, actual achievements from 2010 through 2014 were over 1500 average megawatts, exceeding the Sixth Power Plan’s five year goal of 1200 average megawatts by 25 percent.
Figure 3 - 4: Regional Conservation Achievements Compared To Sixth Plan Goals
Since the adoption of the Sixth Plan, the US Department of Energy has adopted new or revised more than 30 standards for appliances and equipment that have or will take effect over the next 10 years. These standards reduce load growth by capturing all or a portion of the conservation potential identified in the Sixth Plan. The Council estimates that collectively these standards will reduce forecast load growth by nearly 1500 average megawatts by 2035.
The Council has identified significant new efficiency opportunities in all consuming sectors. Figure 3 - 5 shows by levelized cost the sectors of efficiency improvements. Additional information on the sources and costs of efficiency improvements is provided in Chapter 12 and Appendix G.
Improved efficiency contributes not only to meeting future energy requirements, but also provides capacity during peak load periods. The savings from conservation generally follow the hourly shape of energy use, saving more energy when more is being used. As a result, efficiency contributes
-
200
400
600
800
1,000
1,200
1,400
1,600
Sixth Power Plan Target 2010-2014 Savings
Cum
ulat
ive
Savi
ngs 2
010-
2014
(aM
W)
Market-Induced, plus Codes & Standards Utility-Funded Sixth Power Plan Target
Chapter 3: Resource Strategy
nwcouncil.org/7thplan 3-20
Figure 3 - 5: Achievable Energy Efficiency Potential by Sector and Levelized Cost by 2035
more to load reduction during times of peak usage. To model the impact of energy efficiency on the hourly demand for electricity, the Council aggregated the load shapes of efficiency savings from the hourly shape of individual end-uses of electricity and the cost-effective efficiency improvements in those uses. Figure 3 - 6 shows the shape of the savings for all measures during heavy and light load hours. As is shown, the energy savings are greater during the winter season than summer, in large part due to significant savings from conversion of electric resistance heating to more efficient heat pump technologies and increased use of efficient lighting during the winter period.
The capacity impact of energy efficiency is almost two times the energy contribution in winter. For example, efficiency improvements that yield average annual savings of 4,360 average megawatts create 9,060 megawatts of peak hour savings during the winter months.12 This reduction in both system energy and capacity needs makes energy efficiency a valuable resource relative to generation because efficiency provides energy and capacity resources shaped to load. Because each efficiency measure has a specific shape, or capacity impact, the Seventh Power Plan explicitly
12 See Chapter 12 for a description of how the capacity savings of energy efficiency measures are estimated and Chapter 11 for a description of how the system level capacity savings, or Associated System Capacity Contributions, of conservation and generation resources are estimated.
incorporates the value of deferred generation capacity in the cost-effectiveness methodology for measures and programs.13
Figure 3 - 6: Monthly Shape of 2035 Energy Efficiency Savings
Demand Response Demand response resources (DR) are voluntary reductions (curtailments) in customer electricity use during periods of high demand and limited resource availability. As deployed in the Seventh Power Plan, demand response resources are used to meet fall, winter and summer peak demands primarily under critical water and extreme weather conditions. Other potential applications of demand response resources, such as the integration of variable resources like wind, were not explicitly modeled for the development of the Seventh Power Plan. However, this does not mean that such applications of demand response would not provide cost-effective options for providing such services. Therefore, the Seventh Power Plan resource strategy recommends that demand response resources be considered for the provision of other ancillary services, such as variable resource integration.
In many areas of the US, demand response resources have long been used by utilities to offset the need to build additional peaking capacity. In the Northwest, the existing hydropower system has been able to supply adequate peaking capacity, so the region has far less experience with deployment of demand response resources. To assess the economic value of developing demand response in the Northwest, the Council conducted sensitivity studies that assumed demand
13 See action items RES-2 and RES-3 in Chapter 4 and Appendix G.
0%
1%
2%
3%
4%
5%
6%
7%
Shar
e of
Ann
ual S
avin
gs
Heavy Load Hours
Light Load Hours
Chapter 3: Resource Strategy
nwcouncil.org/7thplan 3-22
response resources were not available. The average net present value system cost and economic risk of the least cost resource strategy without demand response were $5.4 billion higher than in the least cost resource strategy that was able to deploy this resource. Therefore, from the Seventh Power Plan’s analysis it appears that if barriers to development can be overcome and the Council’s analysis of the cost of demand response are accurate; demand response resources could provide significant regional economic benefits.14
The Council’s assessment identified more than 4300 megawatts of regional demand response potential. A significant amount of this potential, more than 1500 megawatts, is available at relatively low cost, under $25 per kilowatt of peak capacity per year. When compared to the alternative of constructing a simple cycle gas-fired turbine, demand response resources can be deployed sooner and in quantities better matched to the peak capacity need. Figure 3 - 7 shows the cumulative potential for each of the four blocks (i.e., price bins) of demand response modeled in the Regional Portfolio Model. Cumulative achievable potential by the years 2021, 2026, and 2035 is shown for both winter and summer capacity demand response programs. Note that the largest single block of estimated demand response potential is also the least costly.
The low cost of demand response resources make them the most economically attractive option for maintaining regional peak reserves to satisfy the Council’s Resource Adequacy Standards. The low cost of demand response resources also make them particularly valuable because the need for peaking capacity resources to meet resource adequacy in the region is a function of a combination
14 See Action Items RES-4 and BPA-3 in Chapter 4 for the Seventh Power Plan recommends the region and Bonneville should engage to specifically address the barriers to development of demand response resources.
0
200
400
600
800
1000
1200
1400
1600
$ 25 $ 57 $ 77 $ 144
Cum
ulat
ive
Pot
entia
l (M
W)
Demand Response Price Bins (2012$ per kW-year)
2021 Winter 2026 Winter
2035 Winter 2021 Summer
2026 Summer 2035 Summer
Chapter 3: Resource Strategy
nwcouncil.org/7thplan 3-23
of water and weather conditions that have low probability of occurrence. This is illustrated by Figure 3 - 8 which shows the amount of demand response resource developed by 2021 across the 800 futures tested in the RPM across multiple scenarios.
Figure 3 - 8 shows that there is a wide range of both the amount and probability of development from zero up to 2700 MW, depending on what scenario is being analyzed. In the Increased Market Reliance scenario, more than 70 percent of the futures require 600 MW demand response development and only a two percent probability exists that none will be needed. Under the Existing Policy and Social Cost of Carbon-MidRange scenarios there is around a 30 to 35 percent probability that as much as 1100 MW of demand response will need to be developed by 2021 and just over a 10 percent probability that as much as 1600 MW would need to be developed.
From Figure 3-8 it is also clear that the probability of deploying demand response development in the Increased Market Reliance scenario, which assumed the region could place greater reliance on external power markets to meet its winter peak capacity needs is less than other scenarios that used the limits on external market reliance used in the Regional Resource Adequacy Assessment. The amount of demand response developed on average across all futures is around 700 MW in the Existing Policy and Social Cost of Carbon-MidRange, but only about 400 MW in the Increased Market Reliance scenario. In this scenario, net present value system cost and economic risk were also significantly ($5.4 billion) lower than the Existing Policy scenario. This highlights the sensitivity of the assumed limits on external market reliance used in the Council Regional Resource Adequacy Assessment and the potential value to the region if it can rely upon additional imports.
Figure 3 - 8: Demand Response Resource Development by 2021 Under Alternative Scenarios
0%
10%
20%
30%
40%
50%
60%
70%
80%
90%
100%
0 10
0 20
0 30
0 40
0 50
0 60
0 70
0 80
0 90
0 10
00
1100
12
00
1300
14
00
1500
16
00
1700
18
00
1900
20
00
2100
22
00
2300
24
00
2500
26
00
2700
Prob
abili
ty o
f Dep
loym
ent
Level of Deployment (MW)
Existing Policy
Increased Market Reliance
SCC_MidRange
Chapter 3: Resource Strategy
nwcouncil.org/7thplan 3-24
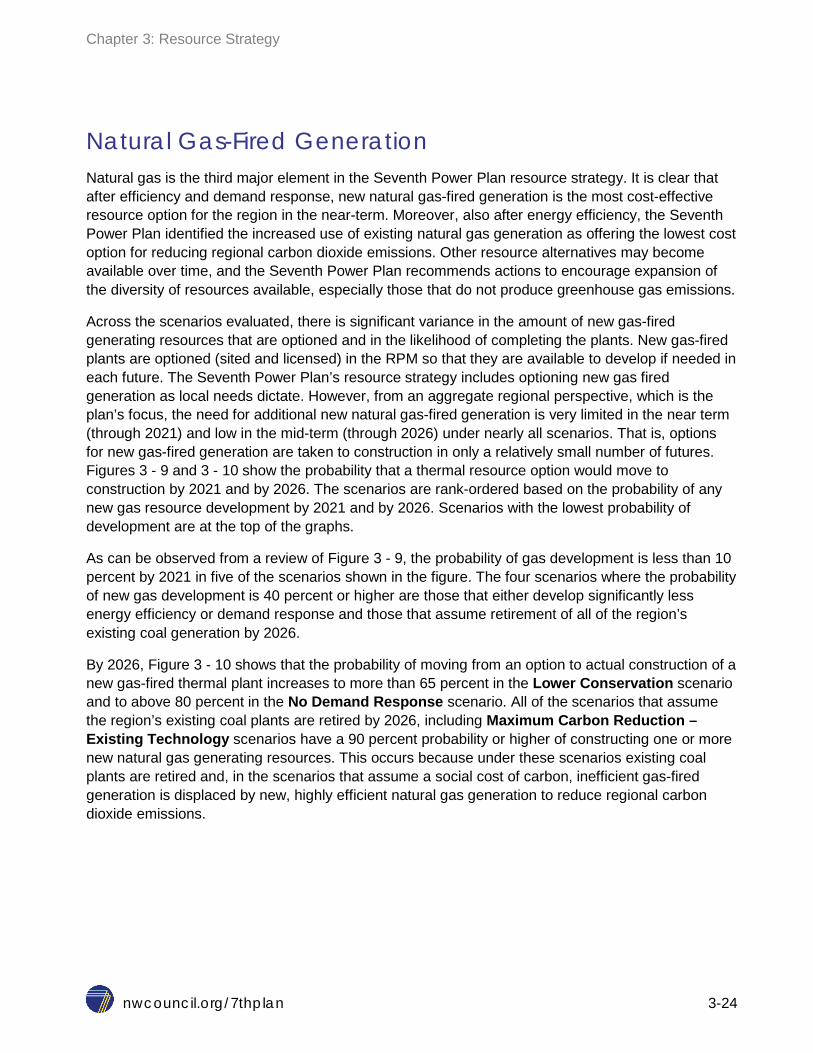
Natural Gas-Fired Generation Natural gas is the third major element in the Seventh Power Plan resource strategy. It is clear that after efficiency and demand response, new natural gas-fired generation is the most cost-effective resource option for the region in the near-term. Moreover, also after energy efficiency, the Seventh Power Plan identified the increased use of existing natural gas generation as offering the lowest cost option for reducing regional carbon dioxide emissions. Other resource alternatives may become available over time, and the Seventh Power Plan recommends actions to encourage expansion of the diversity of resources available, especially those that do not produce greenhouse gas emissions.
Across the scenarios evaluated, there is significant variance in the amount of new gas-fired generating resources that are optioned and in the likelihood of completing the plants. New gas-fired plants are optioned (sited and licensed) in the RPM so that they are available to develop if needed in each future. The Seventh Power Plan’s resource strategy includes optioning new gas fired generation as local needs dictate. However, from an aggregate regional perspective, which is the plan’s focus, the need for additional new natural gas-fired generation is very limited in the near term (through 2021) and low in the mid-term (through 2026) under nearly all scenarios. That is, options for new gas-fired generation are taken to construction in only a relatively small number of futures. Figures 3 - 9 and 3 - 10 show the probability that a thermal resource option would move to construction by 2021 and by 2026. The scenarios are rank-ordered based on the probability of any new gas resource development by 2021 and by 2026. Scenarios with the lowest probability of development are at the top of the graphs.
As can be observed from a review of Figure 3 - 9, the probability of gas development is less than 10 percent by 2021 in five of the scenarios shown in the figure. The four scenarios where the probability of new gas development is 40 percent or higher are those that either develop significantly less energy efficiency or demand response and those that assume retirement of all of the region’s existing coal generation by 2026.
By 2026, Figure 3 - 10 shows that the probability of moving from an option to actual construction of a new gas-fired thermal plant increases to more than 65 percent in the Lower Conservation scenario and to above 80 percent in the No Demand Response scenario. All of the scenarios that assume the region’s existing coal plants are retired by 2026, including Maximum Carbon Reduction – Existing Technology scenarios have a 90 percent probability or higher of constructing one or more new natural gas generating resources. This occurs because under these scenarios existing coal plants are retired and, in the scenarios that assume a social cost of carbon, inefficient gas-fired generation is displaced by new, highly efficient natural gas generation to reduce regional carbon dioxide emissions.
Chapter 3: Resource Strategy
nwcouncil.org/7thplan 3-25
Figure 3 - 9: Probability of New Natural Gas-Fired Resource Development by 2021
The development of natural gas combined cycle combustion turbines is largest when there is a need for both new capacity and energy to meet regional adequacy standards. As can be observed from the data shown in Figures 3 - 9 and 3 - 10, this occurs in scenarios that must replace energy generation lost due to the retirement of resources, such as in the five scenarios that retire or decrease the use of existing coal and inefficient existing gas plants or those that assume no demand response resources or develop significantly less amounts of energy efficiency.
0% 20% 40% 60% 80% 100%
No Demand Response
Retire Coal w/SCC_MidRange
Lower Conservation
Retire Coal
Max. CO2 Reduction - Exist. Tech.
Regional RPS at 35%
Existing Policy
Increased Market Reliance
SCC - Mid-Range
Probability of Converting Option to Construction by 2021
Chapter 3: Resource Strategy
nwcouncil.org/7thplan 3-26
Figure 3 - 10: Probability of New Natural Gas-Fired Resource Development by 2026
As can be seen from the prior discussion, while the amounts of efficiency and the minimum amount of demand response were fairly consistent across most scenarios examined, the future role of new natural gas-fired generation is more variable and specific to the scenarios studied. Figure 3 - 11 shows the average amounts of gas-fired generation across 800 futures considered in each of the principal scenarios. The amount of new natural gas-fired generation constructed varies in each future. In most scenarios the average annual dispatch of new natural gas-fired generation is less than 50 average megawatts by 2021 and only between 300 to 400 average megawatts by 2026 except in scenarios that assume all existing coal plants are retired. In the Existing Policy scenario, the amount of energy generated from new combined cycle combustion turbines, when averaged across all 800 futures examined, is just 20 average megawatts in 2026. In contrast, the average amount generated across 800 futures is between 200 - 300 average megawatts in 2026 in the scenarios that assume no demand response resources are developed or that develop significantly lower amounts of conservation.
However, the role of natural gas is larger than it appears in the Council’s analysis of the regional need for new natural gas fired generation for a number of reasons. First, the Council models the region as if it were a single utility, even though it is not. This understates the need for resource development because it does not capture the physical and institutional barriers present in the region. For example, the regional transmission system has not evolved as rapidly as the electricity market, resulting in limited access to market power for some utilities. Second, some utilities have significant near-term resource challenges, particularly if there is limited access to surplus resources from others. These factors limit the ability of the regional resource strategy to be specific about optioning and construction dates for natural gas-fired resources, or for the types of natural gas-fired generation. As a result, some amount of new gas-fired generation may be required in such instances
0% 20% 40% 60% 80% 100%
Retire Coal w/SCC_MidRange
Retire Coal
Max. CO2 Reduction - Exist. Tech.
No Demand Response
Lower Conservation
SCC - Mid-Range
Existing Policy
Increased Market Reliance
Regional RPS at 35%
Probability of Converting Option to Construction by 2026
Chapter 3: Resource Strategy
nwcouncil.org/7thplan 3-27
even if the utilities deploy demand response resources and develop the energy efficiency as called for in Seventh Power Plan.
Figure 3 - 11: Average New Natural Gas-Fired Resource Development
Third, the increased use of the existing natural gas generation in the region plays a major role in many of scenario’s least cost resource strategies, particularly those that explored alternative carbon dioxide emissions reduction policies. Figure 3 - 12 shows the average annual dispatch of the existing natural gas generation in the region through time for the six carbon dioxide reduction policy scenarios as well as the Existing Policy scenario. A review of Figure 3 - 12 reveals that the annual dispatch of existing natural gas generating resources increases in response to carbon dioxide emission reduction policies.
For example, under the three scenarios that assume the mid-range estimate of the social cost of carbon is imposed beginning in 2016, existing natural gas generation increases immediately following the imposition of carbon dioxide damage cost. In the three scenarios that assume all of the region’s existing coal plants are retired in 2025, existing gas generation increases post-2025 when the entire region’s existing coal-fired generation fleet is retired. Under the Regional RPS at 35% scenario, existing natural gas generation actually declines through time as low variable cost resources are added to the system, generally lowering market prices and diminishing the economics of gas dispatch.
-
500
1,000
1,500
2,000
2,500
3,000
2021 2026 2035
Aver
age
Annu
al N
ew N
atur
al G
as D
ispa
tch
(aM
W)
Regional RPS at 35% Existing Policy Increased Market Reliance No Demand Response SCC - Mid-Range Lower Conservation Retire Coal Max. CO2 Reduction - Exist. Tech. Retire Coal w/SCC_MidRange
Chapter 3: Resource Strategy
nwcouncil.org/7thplan 3-28
Figure 3 - 12: Average Annual Dispatch of Existing Natural Gas-Fired Resources
Renewable Generation Since the adoption of the Sixth Power Plan renewable generating resources development has increased significantly. This development was prompted by Renewable Portfolio Standards (RPS) adopted in three of the four Northwest states and in California. Wind energy has been the principal focus of renewable resource development in the Pacific Northwest. From 2010 through 2014 about 4,100 megawatts of wind nameplate capacity was added to the region, with 2,000 megawatts coming online in 2012 alone. By the end of 2014, wind nameplate capacity in the region totaled just over 8,700 megawatts. However, only about 5,550 megawatts of that nameplate capacity currently serves Northwest loads. The remaining 3,150 megawatts of wind nameplate capacity is presently contracted to utilities outside the region, primarily California.
Existing wind resources are estimated to provide about 2,400 average megawatts of energy generation per year in the region, or about 8 percent of the region’s electricity energy supply. However, on a firm capacity basis, existing wind resources only provide about 1 percent of the region’s total system peaking capability.15
15 See Chapter 11 for the analysis of the ability of new wind resources to provide peak capacity.
-
1,000
2,000
3,000
4,000
5,000
2015 2020 2025 2030 2035 Aver
age
Annu
al E
xist
ing
Gas
Dis
patc
h (a
MW
)
Existing Policy SCC - Mid-Range
Max. CO2 Reduction - Exist. Tech. Retire Coal
Retire Coal w/SCC_MidRange Retire Coal w/SCC_MidRange & No New Gas
Regional RPS at 35%
Chapter 3: Resource Strategy
nwcouncil.org/7thplan 3-29
Aside from hydropower, the renewable resources evaluated in the Regional Portfolio Model (RPM) are wind, utility scale and distributed solar photovoltaic (solar PV) and conventional geothermal.16 The Council recognizes that additional small-scale renewable resources are likely available and cost-effective. These small-scale renewables were not modeled in the RPM but the plan encourages their development as an important element of the resource strategy. In addition, there are many potential renewable resources not captured in the resource strategy that are currently either too expensive or unproven technologies that may, with additional research and demonstration, prove to be valuable future resources.
New wind resources that have ready access to transmission produce energy at costs that are competitive on an energy basis with other generation alternatives. Recent and forecast reductions in solar PV system cost are making utility scale PV system’s energy production cost increasingly cost-competitive. Even though conventional geothermal resources are currently estimated to have the lowest cost of all renewable resources in the region, only limited development of these resources has occurred, largely due of their exploration risk.
Despite the increasingly competitive cost per megawatt-hour of these renewable resources, renewable generation development in the scenarios tested for the Seventh Power Plan is driven by state renewable portfolio standards (RPS) and not economics. This is because in most of the futures tested in the RPM the region is short on peaking capacity and has surplus energy. Consequently, resource selection is based more on the each resource’s cost per megawatt of peak capacity and less on its cost per megawatt-hour of energy output. Since, with the exception of geothermal resources, renewable resources have a very high cost per peak megawatt, the vast majority of renewable resource development in scenarios tested is in response to existing state mandates (RPS).
The amount of renewable energy acquired depends on the future demand for electricity because state requirements specify percentages of retail sales that have to be met with qualifying renewable sources of energy. Figure 3 - 13 shows the average development of renewable resources across scenarios analyzed for the Seventh Power Plan. As can be seen from this figure, under all least cost resource strategies for all scenarios, except in the Regional Renewable Resource Standards at 35% and Retire Coal with SCC-MidRange & No New Gas scenarios, less than 400 average megawatts of renewable resource development occurs, and then only later in the planning period (post-2026) after the Oregon and Washington renewable credit bank balances are forecast to be drawn down. Even in the Social Cost of Carbon-MidRange scenario where carbon damage cost of between $40 and $60 per metric ton are imposed, the amount of wind, solar PV and conventional geothermal resources developed on average is only about 120 average megawatts.
The significant development of renewable resources in the Regional Renewable Resource Standards at 35% scenario occurs because they would be required by law, while their development in the Retire Coal with SCC-MidRange & No New Gas scenario is because they are the only
16 Distributed solar PV systems are evaluated in three scenarios, Retire Coal w/SCC MidRange, Retire Coal w/SCC MidRange and the Maximum Carbon Reduction – Emerging Technology. Distributed solar PV systems are also assumed to be installed in the baseline frozen efficiency forecast. See Chapter 7 and Appendix E for a more complete discussion.
Chapter 3: Resource Strategy
nwcouncil.org/7thplan 3-30
resource option assumed to be available to replace retiring coal generation and meet future load growth.
Figure 3 - 13: Average Renewable Resource Development by Scenarios by 2021, 2026 and 2035
The explanation for the outcome described above is that while the two widely available renewable resources in the region, wind and solar PV, produce significant amounts of energy, they provide little or only modest peaking capacity. Partly as a result of the significant wind development in the region over the past decade, the Northwest has a significant energy surplus, yet under critical water and extreme weather conditions the region faces the probability of a peak capacity shortfall. In short, the generation characteristics of the currently economically competitive renewable resources do not align well with regional power system needs.
The Council’s current analysis of wind, solar PV and geothermal resources ability to supply peaking capacity accounts for the ability of the region’s existing power system to store energy as fuel or water when renewable resource generation is available for later use to meet peak demands. The contribution to peak of all resources, including renewable resources, modeled in the RPM were determined by comparing how much nameplate capacity must be added to the system to reduce capacity shortfalls by specific predetermined amounts. The peak capacity contribution of wind and
-
500
1,000
1,500
2,000
2,500
3,000
3,500
4,000
4,500
2021 2026 2035
Aver
age
Reso
urce
Dev
elop
men
t (aM
W)
Max. CO2 Reduction - Exist. Tech.
Existing Policy
Increased Market Reliance
SCC - Mid-Range
No Demand Response
Lower Conservation
Retire Coal
Retire Coal w/SCC_MidRange
Retire Coal w/SCC_MidRange & No New Gas Regional RPS at 35%
Chapter 3: Resource Strategy
nwcouncil.org/7thplan 3-31
solar resources is based on hourly modeling of their output against hourly system loads and takes into account their interaction with the region’s existing power system.17
This analysis found that wind can only be relied upon to provide between 3 to 11 percent of its nameplate capacity (depending on the season of the year) toward meeting peak loads due to the variable nature of the resource. This means that, for example, a 100 megawatt wind farm can only be relied upon to provide 3 megawatts of peak capacity during the winter quarter.18 Solar PV resources contribute more to meeting peaking needs, ranging from a low of 26 percent of nameplate capacity in the winter months to a high of just over 80 percent of nameplate capacity in the summer. Conventional geothermal resources are assumed to be able to provide peaking capability similar to gas generation across the year, but this resource has a much longer development lead time, high development risk and is more limited in supply.
As stated above, the development of renewable generation is driven by state renewable portfolio standards more so than regional energy need. Based on the analysis for the Seventh Power Plan, in the absence of higher renewable portfolio standards or limitations on the development of new natural gas generation little additional renewable development would take place, even under scenarios where a very high estimate of the social cost of carbon dioxide is imposed on the power system raising the cost of gas and coal generation.
Carbon Policies and Methane Emissions The Northwest power system, due to its significant reliance on hydropower and its historical deployment of energy efficiency to offset the need for new thermal generation, has the lowest carbon emissions level of any area of the country. The Seventh Power Plan supports policies that cost-effectively achieve state and federal carbon dioxide emission reduction goals while maintaining regional power system adequacy. The plan calls upon the region to aggressively develop the energy-efficiency resources. In addition, the plan recommends replacing retiring coal plants with only those resources required to meet regional capacity and energy adequacy requirements. As stated above, after energy efficiency, the increased use of existing natural gas generation offers the lowest cost option for reducing regional carbon emissions. Utility development of new gas-fired generation to meet local needs for ancillary services, such as wind integration, or capacity requirements beyond the modest levels anticipated in this plan will increase carbon dioxide emissions. If Northwest electricity generation is dispatched first to meet regional adequacy standards for energy and capacity rather than to serve external markets, the increase in carbon dioxide emissions can be minimized.
As noted above, a central element in transitioning the Northwest power system to an even lower carbon footprint involves the increased use of natural gas, which consists primarily of methane.
17 See Chapter 11 for a more complete description of the derivation of the peak contribution of renewable and other resources modeled in the RPM. 18 Winter quarter as modeled in the RPM includes January through March.
Chapter 3: Resource Strategy
nwcouncil.org/7thplan 3-32
While burning natural gas produces significantly less carbon dioxide emissions per unit of electricity generation than coal, its production and distribution release methane into the atmosphere. Methane is a highly active greenhouse gas, with a global warming potential 28 to 36 times that of carbon dioxide.19 Recent studies have indicated that fugitive emissions of methane from some natural gas production areas and existing gas pipelines could be as high as 10 percent. In contrast, fugitive methane emissions from new production facilities and pipelines have been shown to be far lower, on the order of one percent. In developing the resource strategy for the Seventh Power Plan the Council seriously considered whether the carbon dioxide reduction benefits of the increased use of natural gas would be significantly offset by increases in methane emissions.
Although there is no debate about methane global warming potential, there is considerable uncertainty around such issues as whether its impacts compared to carbon dioxide are over or under-stated, whether its increased use results in a proportional increase in fugitive emissions, whether accounting for the methane emissions from coal production would also raise that fuel’s full life-cycle climate impacts and whether the cost of reducing methane emissions would significantly alter the price of natural gas. With respect to the last issue, even with the uncertainty surrounding the anticipated impact of regulations to reduce methane emissions in production and distribution, the best information available to the Council indicates that these emissions can be reduced to what is viewed by scientists as an acceptable level at a cost that leaves the price of natural gas well within the range of the natural gas prices assumed for the Seventh Plan’s development.20
The Council also observed that increasing the region’s use of existing gas generation or relying more on new gas generation, will likely draw on gas production from new wells which have lower fugitive emissions than the old fields/wells that appear to be the primary source of methane emissions. Moreover, pipeline leaks are a not significantly driven by throughput, they are primarily a function of a pipeline’s total capacity which is fixed within a range of operating pressures. Therefore, unless new pipeline capacity is needed, fugitive emissions from pipeline leaks remain relatively constant. Consequently, existing gas generation can be supplied with existing pipeline capacity, so only new gas generation that requires additional pipeline capacity produces incrementally more methane emissions.
The Seventh Power Plan’s overall resource strategy seeks to minimize the need to develop new gas generation by meeting most future energy and capacity needs with energy efficiency and demand response. Successful implementation of this strategy provides time to take actions to reduce current fugitive methane emissions and minimize new methane emissions, so that the use of natural gas does produce a reduction in climate change impacts.
The basis for the Seventh Power Plan’s carbon dioxide policy recommendations are more fully described in the Carbon Dioxide Emissions section of this chapter.
19 See Appendix I for a more complete description of methane’s potential environmental impacts and the uncertainties surrounding fugitive emission sources and levels. 20 See Chapter 13 for a discussion of the potential impacts on natural gas prices from regulations designed to reduce methane emissions at new production facilities.
Chapter 3: Resource Strategy
nwcouncil.org/7thplan 3-33
Regional Resource Utilization The existing Northwest power system is a significant asset for the region. The FCRPS (Federal Columbia River Power System) provides low-cost and carbon dioxide-free energy, capacity, and flexibility. The network of transmission constructed by Bonneville and the region’s utilities has supported a highly integrated regional power system. The Council’s Seventh Power Plan resource strategy assumes that ongoing efforts to improve system scheduling and operating procedures across the region’s balancing authorities will, in some form, succeed.
While the Council does not directly model the sub-hourly operation of the region’s power system, both the Regional Portfolio Model and the GENESYS models presume resources located anywhere in the region can provide energy and capacity services to any other location in the region, within the limits of existing transmission. This simplifying assumption also minimizes the need for new resources needed for integration of variable energy resource production. To the extent that actual systems can be developed that replicate the model’s assumptions, fewer new resources will be required. This likely means the region needs to invest in its transmission grid to improve market access for utilities, to facilitate development of more diverse cost-effective renewable generation and to provide a more liquid regional market for ancillary services.
Along with reducing physical and technical barriers, there are more efficient ways to dispatch and use existing regional resources that could minimize the need for new resource development. The analyses conducted for the Seventh Power Plan reveal in particular that the region could benefit from a different approach to using existing generation so as to keep more of that generation in the region serving load under longer-term arrangements.
The least cost resource strategies identified by the RPM often reduce regional exports in order to serve in-region demands for energy and capacity. That is, since the RPM treats the region as a single system, any resources that are available within the region to meet regional adequacy standards for energy and capacity are allocated to that purpose.21 For example, in scenarios that retired or significantly reduced the dispatch of existing coal-fired generation serving the region, the vast majority of which serves investor-owned utilities, the RPM reduces regional exports in order to maintain resource adequacy. The RPM does not differentiate between investor-owned, publicly owned and Bonneville’s generation when it balances regional loads and resources. The resource strategies that satisfied regional adequacy standards by inter-regional transfers resulted in lower total system cost and lower system economic risk because they delayed or avoided the need for new resource development within the region. Figure 3 - 14 shows the average net (i.e., exports minus imports) exports for their least cost resource strategies across these five scenarios.
Inspection of Figure 3 - 14 reveals how net exports change across time in response to the resource strategy for each scenario. For example, under the Existing Policy scenario exports grow slowly until 2021 then decline slightly after 2021 and 2025 following the closure of coal plants currently
21 See Chapter 11 for a more complete discussion of the Council’s resource adequacy assessment.
Chapter 3: Resource Strategy
nwcouncil.org/7thplan 3-34
serving the region. After 2030, under this same scenario, net exports continue to gradually decline as loads grow and conservation no longer offsets load growth.
In contrast, under the Social Cost of Carbon - MidRange scenario which assumes that carbon dioxide damage costs are imposed in 2016, net exports decline immediately. This reduction in exports offsets the reduction in regional coal plant dispatch in response to increased carbon dioxide costs. In the following years, exports gradually increase as highly efficient gas-fired generation developed in the region displaces less efficient generation outside the region. In the two scenarios shown in Figure 3-14 that assume all of the region’s existing coal plants are retired by 2025, net
Figure 3 - 14: Average Annual Net Regional Exports for Least Cost Resource Strategies
exports drop immediately following their assumed closure and remain lower for the remainder of the planning period. At the other extreme, under the Regional RPS at 35% scenario, regional net exports expand significantly over time as the region develops large amounts of additional renewable resources. These resources have very low variable cost, which makes them competitive outside the region and they produce energy that is surplus to regional needs during many months of the year.
The Council’s analysis shows that the total cost to the region would be lower if more effective use of surplus power available from Bonneville and some of the region’s utilities could be used in-region to offset the need that other utilities have to develop new generation to meet resource adequacy standards. The Council recognizes that significant equity, risk, institutional and legal issues must be overcome to effect such a change. For example, Bonneville and other utilities in the region that control hydropower generation often, but not always, generate substantial surplus power above critical water conditions. Most of that surplus is sold into short-term markets, much of it leaving the region. The Council’s analysis indicates that the region would benefit if, instead, some significant portion of this surplus hydropower generation could be sold to other utilities in the region under
-
1,000
2,000
3,000
4,000
5,000
6,000
7,000
2015 2020 2025 2030 2035
Annu
al A
vera
ge E
xpor
ts (
aMW
)
Existing Policy Max. CO2 Reduction - Exist. Tech. Retire Coal Social Cost of Carbon - MidRange Regional RPS at 35%
Chapter 3: Resource Strategy
nwcouncil.org/7thplan 3-35
longer-term contracts to meet regional firm power needs. In order for this to happen, however, either the sellers or the buyers, or both, would have to take on some additional risk since the surplus generation would not always be available due to poor water conditions. As a result the power price for such contracts would need to somehow reflect additional risk.
The region needs to be creative in crafting new power sales arrangements that address in an appropriate and equitable way the issues of risk inherent in any scheme to rely on this surplus generation to help meet regional adequacy standards. However, the Council encourages the region to find ways to overcome these barriers since the benefit to the region could be substantial.22
Develop Long-Term Resource Alternatives The seventh element of the Council’s resource strategy recognizes that technologies will evolve significantly over the 20 years of the Seventh Power Plan. When the Council next develops a power plan, the cost-effective, available and reliable resources will most likely be different from those considered in the Seventh Power Plan. But the Seventh Power Plan identifies areas where progress is likely to be valuable and includes actions to explore and develop such resources and technologies. In many instances entities in the region can influence the development of technology and the pace of adoption.
Areas of focus in the long-term resource strategy include additional efficiency opportunities and the ability to acquire them, energy-storage technologies to provide capacity and flexibility, development of smart-grid technologies, expansion of demand response capability, and tracking and supporting the development of no-carbon dioxide or low-carbon dioxide emitting generation. The latter includes renewable technologies such as enhanced geothermal and wave energy and small modular nuclear generation.
Research, development, and demonstration of these technologies are an important part of the Council’s resource strategy. Tracking these developments, as well as plan implementation and assumptions such as resource availability, cost and load growth, will identify needed changes in the power plan and near-term actions. These elements of the resource strategy are addressed primarily in the action plan.
22 Absent such an outcome, the trend over the past decade that shows the average revenue per kilowatt-hour for residential customers of investor-owned utilities increasing while the average revenue per kilowatt-hour for residential customers of public utilities has remained nearly flat will likely continue. Between 2005 and 2014, the average revenue per kilowatt-hour sold by IOUs increased from 7.7 cents to 9.9 cents, while the average revenue per kilowatt-hour sold for public utilities remained barely changed, increasing from 7.7 cents to 8.0 cents per kilowatt-hour. Similar trends have occurred for commercial and industrial customers.
Chapter 3: Resource Strategy
nwcouncil.org/7thplan 3-36
Adaptive Management The eighth element of the Council’s resource strategy is to adaptively manage its implementation. The Council’s planning process is based on the principle that “there are no facts about the future.” The Council tests thousands of resource strategies across 800 different futures to identify the elements of these strategies that are the most successful (i.e., have lower cost and economic risk) over the widest range of future conditions. This means that during the period covered by the Seventh Power Plan’s Action Plan, actual conditions must deviate significantly from the conditions tested in the 800 futures explored in the Regional Portfolio Model before the basic assumptions and action items in the Seventh Power Plan are called into question.
However, the fact that a wide range of strategies were tested against a large number of potential future conditions in developing the Plan does not mean that all near term actions called for in the Seventh Power Plan will be perfectly aligned with the actual future the region experiences. Therefore, the Council will annually assess the adequacy of the regional power system to identify conditions that could lead to power shortages. Through this process, the Council will be able to identify whether actual conditions depart so significantly from planning assumptions as to require adjustments to the action plan.
The Council will also conduct a mid-term assessment to review plan implementation and compare progress against specific metrics. This includes assessing how successful plan implementation has been at reducing and meeting Bonneville’s obligations, both the power sales contracts and the assistance the plan’s resource scheme provides in the successful implementation of the Council’s Columbia River Basin Fish and Wildlife Program.
CARBON DIOXIDE EMISSIONS As in the Sixth Plan, one of the key issues identified for the Seventh Power Plan is climate-change policy and the potential effects of proposed carbon dioxide regulatory policies. In addition, the Council was asked to address what changes would need to be made to the power system to reach a specific carbon dioxide reduction goal and what those changes would cost. This section also summarizes how alternative resources strategies compare with respect to their cost and ability to meet carbon dioxide emissions limits established by the Environmental Protection Agency (EPA).
In providing analysis of carbon dioxide emissions and the specific cost of attaining carbon dioxide emissions limits, the Council is not taking a position on future climate-change policy. Nor is it taking a position on how individual Northwest states or the region should comply with EPA’s carbon dioxide emissions regulations. The Council’s analysis is intended to provide useful information to policy-makers. Chapter 15 discusses the results of the Council’s analysis of alternative carbon dioxide emissions reduction policy scenarios in more detail.
Three “carbon dioxide pricing” policy options were tested. Two scenarios assumed that alternate values of the federal government’s estimates for damage caused to society by climate change due to carbon dioxide emissions, referred to as the “social cost of carbon,” are imposed beginning in 2016. The policy basis for these scenarios is that the cost of resource strategies developed under
Chapter 3: Resource Strategy
nwcouncil.org/7thplan 3-37
conditions which fully internalized the damage cost from carbon dioxide emissions would be the maximum society should invest to avoid such damage.
The third carbon dioxide pricing policy tested, Carbon Cost Risk is identical to the scenario analyzed in the Sixth Plan. This scenario exposes the power system to random changes in carbon dioxide pricing each year over the 20 year planning period. This scenario was designed to reflect the uncertainty regarding future carbon dioxide regulation. In this scenario, carbon dioxide pricing, reflecting differing levels of carbon dioxide regulatory costs, between $0 and $110 per metric ton were imposed randomly, but with increasing probability and at higher levels through time.
Figure 3 - 15 shows the two US Government Interagency Working Group’s estimates used for the SCC - MidRange and SCC-High scenarios and the range (shaded area) and average carbon dioxide prices across all futures that were evaluated in the $0-to-$110-per-metric ton Carbon Cost Risk scenario.
Figure 3 - 15: Carbon Dioxide Regulatory Cost or Price and Societal Cost of Carbon Tested in Scenario Analysis
Four other carbon dioxide emission reduction policies were tested that did not involve using carbon dioxide pricing. The first of these, the Maximum Carbon Reduction - Existing Technology scenario was designed to reduce carbon dioxide emissions by deploying all currently available and economically viable technology. The second, the Maximum Carbon Reduction - Emerging Technology scenario was designed to reduce carbon dioxide emissions by deploying technology that may become commercially available and economically viable over the next 20 years. Under both of these scenarios all existing coal plants serving the region were assumed to be retired by 2026. In addition, all existing natural gas plants with heat-rates (a measure of efficiency) above 8,500 BTU/kilowatt-hour were retired by 2030. Also, in the Maximum Carbon Reduction –
$-
$20
$40
$60
$80
$100
$120
$140
$160
$180
$200
2015 2020 2025 2030 2035
Carb
on P
rice/
Dam
age
Cost
(201
2$/M
etric
Ton
)
Social Cost of Carbon - Mid-Range (3% Discount) Social Cost of Carbon - High (95th Percentile) Carbon Cost Risk
Chapter 3: Resource Strategy
nwcouncil.org/7thplan 3-38
Emerging Technology scenario, no new natural gas-fired generation was considered for development.
The Maximum Carbon Reduction – Emerging Technology scenario was designed to assess the magnitude of potential additional carbon dioxide emission reductions that might be feasible by 2035. As stated above, the Council created this resource strategy based on energy-efficiency resources and non-carbon dioxide emitting generating resource alternatives that might become commercially viable over the next 20 years. While the Regional Portfolio Model (RPM) was used to develop the amount, timing and mix of resources in this resource strategy, no economic constraints were taken into account. That is, the RPM was simply used to create a mix of resources that could meet forecast energy and capacity needs, but it made no attempt to minimize the cost to do so. The reason the RPM’s economic optimization logic was not used is that the future cost and resource characteristics of many of the emerging technologies included in this scenario are highly speculative. This scenario was not updated for the draft plan. However, draft plan’s results for this scenario are Appendix O, along with a more detailed discussion of the emerging technologies considered in this scenario.
The third “non-price” carbon reduction policy tested, Retire Coal, is a variation on the two Maximum Carbon Reduction scenarios. Under this scenario, only the region’s existing coal generation is retired while existing gas generation remains available for deployment.
The fourth “non-price” carbon dioxide emission reduction policy option tested was the Regional RPS at 35% scenario. Under this scenario, the region’s reliance on carbon dioxide-free generation was increased by assuming that the region would satisfy a region wide Renewable Portfolio Standard requiring 35 percent of the region’s retail sales of electricity are met with such resources by 2030.
The Council also tested two other scenarios that combined both pricing and non-pricing strategies to assess their collective impact. The Coal Retirement with the Social Cost of Carbon scenario was designed to test whether the addition of carbon cost would alter the resources selected to replace retired coal plants. The Coal Retirement with the Social Cost of Carbon & No New Gas scenario was designed to assess the emissions reduction benefits and cost of restricting coal replacement resources to renewables.
In order to compare the cost of resource strategies that reflect both “carbon-pricing” and “non-carbon pricing” policy options for reducing carbon dioxide emissions it is useful to separate their cost into two components. The first is the direct cost of the resource strategy. That is, the actual the cost of building and operating a resource strategy that reduces carbon dioxide emissions. The second component is the revenue collected through the imposition of carbon taxes, through a cap and trade system or pricing carbon damage cost into resource development decisions. This second cost component, either in whole or in part, may or may not be paid directly by electricity consumers. For example, the “social cost of carbon” represents the estimated economic damage of carbon dioxide emissions worldwide. In contrast to the direct cost of a resource strategy which will directly affect the cost of electricity, these “damage costs” are borne by all of society, not just Northwest electricity consumers. In the discussion that follows, only the direct cost (i.e., costs net of carbon revenues) of resource strategies are reported.
Table 3 - 1 shows the average net present value system cost for the least cost resource strategy and average carbon dioxide emissions across all 800 futures for the year 2035 for the seven
Chapter 3: Resource Strategy
nwcouncil.org/7thplan 3-39
scenarios and sensitivity studies conducted to specifically evaluate carbon dioxide emissions reductions policies (and economic risks) for the development of the Seventh Power Plan. 23 Scenarios are listed based on their average level of carbon dioxide emissions in 2035, which the highest emission scenario at the top of the table. Table 3- 1 also shows this same information for the Existing Policy and Lower Conservation scenarios which were not designed to reduce carbon emissions. As a point of comparison, the carbon dioxide emissions from the generation serving the Northwest loads averaged approximately 54 million metric tons per year from 2001 through 2014.
Table 3 - 1: Average System Costs Excluding Carbon Revenues and PNW Power System Carbon Dioxide Emissions by Scenario
Table 3 - 1 shows the Existing Policy scenario which assumed no additional carbon dioxide emissions reductions policies beyond those in place prior to the issuance of the Environmental Protection Agency’s Clean Air Act 111(b) and 111(d) regulations results in carbon dioxide emissions in 2035 of 36 million metric tons. The direct cost of this resource strategy is $82 billion (2012$). The Regional RPS at 35% scenario’s least cost resource strategy reduces projected 2035 carbon dioxide emissions by about 10 million metric tons. However, this policy has a direct cost of $128 billion, or $46 billion above the Existing Policy scenario’s resource strategy. Two scenarios, the Retire Coal and Maximum Carbon Reduction - Existing Technology scenarios produce equivalent carbon dioxide emissions in 2035 (16 MMTE), but the Retire Coal scenario has a $19 billion lower average system cost. The only difference between these two scenarios is that the Retire Coal scenario does not retire inefficient natural gas plants, whereas the Maximum Carbon –
23 The emissions forecast shown in Table 3-1 are slightly lower than anticipated actual regional emissions. This is because the Council’s modeling assumes that all resources serving the region are economically dispatched as if operated by a single utility. In reality, both technical constraints and institutional barriers prohibit this optimized level of system integration from occurring. As a result, the most efficient thermal generator may not be used to serve load, even if it could have been dispatched to do so which understates the regional emissions.
Chapter 3: Resource Strategy
nwcouncil.org/7thplan 3-40
Existing Technology scenario does. Thus, it appears that retaining existing natural gas plants, even relatively inefficient ones does not materially increase carbon dioxide emissions and avoids the cost of constructing new gas-fired replacement generation.
The average system cost for all of the carbon emission scenarios which impose a price on carbon emissions (SCC-MidRange, Retire Coal w/SCC MidRange and Retire Coal w/SCC MidRange & No New Gas) are affected by the interaction of the Northwest region with the rest of the western power market. For these scenarios it was assumed that the social cost of carbon was imposed throughout the west, not just in the region. As a result, the relative carbon dioxide content in the region compared to the rest of the western market plays an important role in determining whether the region imports or exports. For example, the SCC MidRange scenario, which reduces 2035 carbon dioxide emissions to 21 million metric tons or to about 15 million metric tons below that of the Existing Policy scenario has an average system cost that is $4 billion lower ($78 vs. $82 billion). This scenario’s lower cost results from increased regional revenue from exports that reduce the cost of developing the scenario resource strategy. This scenario illustrates that the Northwest will likely have a competitive advantage if pricing policies are used throughout the western electricity market to reduce carbon dioxide emissions.
Comparing the results of these scenarios based on a single year’s emissions can be misleading. Each of these policies alters the resource selection and regional power system operation over the course of the entire study period. Figure 3 - 16 shows the annual emissions level for each scenario. A review of Figure 3 - 16 reveals that the three scenarios that assume that the “mid-range” estimate of the social cost of carbon dioxide damage costs is imposed in 2016, immediately reduce carbon dioxide emissions and therefore have impacts throughout the entire twenty year period covered by the Seventh Power Plan. In contrast, the other three carbon dioxide reduction policies phase in over time, so there cumulative impacts are generally smaller.
Chapter 3: Resource Strategy
nwcouncil.org/7thplan 3-41
Figure 3 - 16: Average Annual Carbon Dioxide Emissions by Carbon Reduction Policy Scenario
The Regional RPS at 35% scenarios gradually reduce emissions, while the Retire Coal, Maximum Carbon Reduction – Existing Technology and Maximum Carbon Reduction - Emerging Technology scenarios dramatically reduce emission as existing coal and inefficient gas plants are retired post-2025. The difference in timing results in large differences in the cumulative carbon dioxide emissions reductions for these policies. All scenarios show gradually increasing emissions beginning around 2028 as the amount of annual conservation development slows due to the completion of cost-effective and achievable retrofits. This lower level of conservation no longer offsets regional load growth, leading to the increased use of carbon dioxide emitting generation.
Table 3 - 2 shows cumulative emission reductions from 2016 through 2035 for each of the carbon dioxide reduction policy scenarios compared to the Existing Policy scenario. It also shows the average present value system cost per million metric ton of carbon dioxide reduction for these five carbon dioxide reduction policy options. Table 3-2 reveals that SCC MidRange scenario has negative cost per unit of carbon reduction. As discussed above, this lower present value system cost is a result of the increase in regional net revenues from electricity exports that occurs when carbon costs are imposed throughout the entire western electricity market. The cost per unit of carbon dioxide emission reduction for all the three scenarios that include imposing the social cost of carbon as one policy element are all lower as a consequence of this circumstance.
-
10
20
30
40
50
2015 2020 2025 2030 2035
Aver
age
Annu
al R
egio
nal C
O2
Emis
ssio
ns (M
MT)
Existing Policy SCC - Mid-Range Max. CO2 Reduction - Exist. Tech. Retire Coal Retire Coal w/SCC_MidRange Retire Coal w/SCC_MidRange & No New Gas Regional RPS at 35% Lower Conservation
Chapter 3: Resource Strategy
nwcouncil.org/7thplan 3-42
Table 3 - 2: Average Cumulative Emissions Reductions and Present Value Cost Excluding Carbon Revenues of Alternative Carbon Dioxide Emissions Reduction Policies Compared to
Existing Policies - Scenario
CO2 Emissions - PNW System 2016 - 2035 (MMT)
Cumulative CO2 Emission
Reduction Over Existing Policy - Scenario (MMT)
Incremental Present Value
Average System Cost of Cumulative
Emission Reduction Over Existing Policy -
Scenario (2012$/MT)
SCC - Mid-Range 351 $ (11) Existing Policy - - Retire Coal w/SCC_MidRange 377 $ 23 Retire Coal 197 $ 78 Retire Coal w/SCC_MidRange & No New Gas 430 $ 100 Max. CO2 Reduction - Exist. Tech. 201 $ 170 Regional RPS at 35% 132 $ 349
The single policy option with the lowest cost per unit of carbon dioxide emission reduction shown in Table 3-2 is the SCC-MidRange scenario. This scenario reduces cumulative carbon dioxide emissions by 351 million metric tons between 2016 and 2035. The single policy option with the highest cost per ton of carbon dioxide reduction is the Regional RPS at 35% scenario. The high per unit cost of carbon dioxide emissions reduction from this scenario occurs because it does not result in the retirement or significantly reduce the use of existing coal plants. All of the other policy options tested either retire the region’s existing coal plants, or dramatically reduce their dispatch as a result of the imposition of carbon pricing.
The next least expensive option combines two policies by adding a retire coal policy to the imposition of social cost of carbon policy, illustrated by the Retire Coal w/SCC MidRange scenario. This scenario reduces cumulative carbon dioxide emissions by another 26 million metric tons. Combining three policy options reduces emissions still further. This is illustrated by the Retire Coal w/SCC-MidRange & No New Gas scenario that restricts new resource development to renewable resources in addition to retiring coal plants and imposing the social cost of carbon. This scenario reduces cumulative carbon dioxide emissions by another 53 million metric tons at a cost of $100 per metric ton.
However, in order to judge the incremental costs and benefits of restricting new resource development to renewable resources it is useful to compare the difference in cumulative emissions and costs between the Retire Coal w/SCC_MidRange and the Retire Coal w/SCC_MidRange & No New Gas scenarios. From data in Tables 3-1 and 3-2 it can be determined that cumulative carbon dioxide emissions are reduced by 53 million metric tons and average system cost increase from $91 to $126 billion, or $35 billion. Thus, on an incremental basis the cost of these additional carbon dioxide emission reductions is $635 per metric ton. This illustrates the value of isolating the incremental impacts of each carbon reduction policy so that the most effective combinations can be identified.
Chapter 3: Resource Strategy
nwcouncil.org/7thplan 3-43
It is important to note that in all scenarios than impose the social cost of carbon the coal plants serving the region dispatch infrequently following the imposition of carbon cost. This occurs because these plants are more expensive than existing natural gas generation once carbon cost are considered. As a result, such plants might be viewed by their owners as uneconomic to continue operation. If this is indeed the case, and these plants are retired, then the cost of replacement resources needed to meet the energy or capacity needs supplied by the retiring plants would add to the average present value system cost of this scenario. As a result, the actual cost of the Social Cost of Carbon – MidRange scenario would likely be higher and much closer to the Retire Coal w/SCC-MidRange scenario.
In the analysis discussed above, only the cost incurred during the planning period (i.e. 2016-2035) and the emissions reductions that occur during this same time frame are considered. Clearly, investments made to reduce carbon dioxide emissions will continue beyond 2035, as will their carbon dioxide emissions impacts. These “end-effects” could alter the perceived relative cost-efficiency of carbon dioxide reduction policy options shown in Table 3 - 2. For example, over a longer period of time the cumulative emissions reductions from the Maximum Carbon Reduction – Existing Technology scenario could exceed those from the SCC-MidRange scenario because by 2035 the Maximum Carbon Reduction – Existing Technology scenario results in 5 MMTE per year lower emissions. In this instance, if the difference in emissions rates for these two scenarios were to remain the same for an additional 30 years, then their cumulative emissions reductions over 50 years would be nearly identical. Since it is impossible to forecast these “end effects,” readers should consider the scenario modeling results shown in Table 3 - 2 as directional in nature, rather than precise forecast of either emissions reductions or the cost to achieve them.
The key findings from the Council’s assessment of the potential to reduce power system carbon dioxide emissions are:
The retirement of all of the existing coal generation serving the region could reduce Northwest power system carbon dioxide emissions from a historical average of 54 million metric tons per year to about 16 million metric tons per year, or by nearly 70 percent. Achieving this level of carbon dioxide emission reduction is nearly $16 billion or nearly 20 percent above the cost of the least cost resource strategies that are anticipated to comply at the regional level with the newly established federal emissions limits.
If all of the region’s existing coal plants are retired and replaced exclusively with renewable resources and all generation is dispatched to reflect a mid-range estimate of the social cost of carbon, regional power system carbon emissions could be reduced to 10 million metric tons per year by 2035, or 80 percent below historical levels. The cost of achieving this level of carbon emission reduction is $44 billion, or nearly 55 percent above the cost of the least cost resource strategies that are anticipated to comply at the regional level with the newly established federal emissions limits. The average cost of this scenario is significantly lowered by the expected increase in net power sales revenues from exports assuming a western or national power market imposition of a carbon cost.
At present, it is not possible to entirely eliminate carbon dioxide emissions from the power system without the development and deployment of nuclear power and/or emerging technology for both energy efficiency and non-carbon dioxide emitting generation that require technological or cost breakthroughs.
Chapter 3: Resource Strategy
nwcouncil.org/7thplan 3-44
Deploying renewable resources to achieve maximum carbon reduction presents significant power system operational challenges, in particular by dramatically increasing the need for balancing and flexibility reserves.
The most cost-effective carbon dioxide emissions reduction policies are those that result in
the retirement or significantly reduce the use of existing coal plants. The single policy option for reducing carbon dioxide emissions with the lowest cost per unit of emission reduction imposes the equivalent of the federal government’s mid-range estimate of the social cost of carbon throughout the entire Western electricity market. The single policy option for reducing carbon dioxide emissions with the highest cost per unit of emission reduction establishes a regional renewable portfolio standard at 35 percent. The high per unit cost of carbon dioxide emissions reduction from this policy occurs because it does not result in the retirement or significantly reduce the use of existing coal plants.
Federal Carbon Dioxide Emission Regulations As the Seventh Power Plan was beginning, development the US Environmental Protection Agency (EPA) issued proposed rules that would limit the carbon dioxide emissions from new and existing power plants. Collectively, the proposed rules were referred to as the Clean Power Plan. In early August of 2015, after considering nearly four million public comments the EPA issued it final Clean Power Plan (CPP) rules. The “111(d) rule,” referred to by the Section of the Clean Air Act under which EPA regulates carbon dioxide emissions for existing power plants, has a goal of reducing national power plant carbon dioxide emissions by 32 percent from 2005 levels by the year 2030. This is slightly more stringent than the draft rule which set an emission reduction target of 30 percent. 24 EPA also issued the final rule under the Clean Air Act section 111(b) for new power plants and the proposed federal plan and model rules that would combine the two emissions limits.
To ensure the 2030 emissions goals are met, the rule requires states begin reducing their emissions no later than 2022 which is the start of an eight year compliance period. During the compliance period, states need to achieve progressively increasing reductions in carbon dioxide emissions. The eight year interim compliance period is further broken down into three steps, 2022-2024, 2025-2027, and 2028-2029, each associated with its own interim goal.
Under the EPA’s final rules, states may comply by reducing the average carbon dioxide emission rate (pounds of carbon dioxide/kilowatt-hour) emitted by all power generating facilities located in their state that are covered by the rule. In the alternative, states may also comply by limiting the total emissions (tons of carbon dioxide per year) from those plants. The former compliance option is referred as a “rate-based” path, while the latter compliance option is referred to as a “mass-based”
24 U.S. Environmental Protection Agency, "Carbon Pollution Emission Guidelines for Existing Stationary Sources: Electric Utility Generating Units," 80 Fed. Reg. 64,662 (October 23, 2015). A coalition of states, utilities, utility organizations and others challenged the rule applying to existing sources in the federal D.C. Circuit Court of Appeals. The U.S. Supreme Court stayed the effectiveness of the rule in an order issued February 9, 2016, pending not just review on the merits by the court of appeals but also the resolution of any petition for further review in the Supreme Court following whatever decision is issued by the court of appeals. The litigation is ongoing as the Council completed the Seventh Power Plan.
Chapter 3: Resource Strategy
nwcouncil.org/7thplan 3-45
path. Under the “mass-based” compliance option EPA has set forth two alternative limits on total carbon dioxide emissions. The first, and lower limit, includes only emissions from generating facilities either operating or under construction as of January 8, 2014. The second, and higher limit, includes emissions from both existing and new generating facilities, effectively combining the 111(b) and 111(d) regulations.
The Council determined that a comparison of the carbon dioxide emissions from alternative resource strategies should be based on the emissions from both existing and new facilities covered by the EPA’s regulations. This approach not only better represents the total carbon dioxide footprint of the power system, but it more fully captures the benefits of using energy efficiency as an option for compliance because it reduces the need for new generation. Table 3 - 3 shows the final rule’s emission limits for the four Northwest states for the “mass-based” compliance path, including both existing and new generation.
Table 3 - 3: Pacific Northwest States Clean Power Plan Final Rule Carbon Dioxide Emissions Limits25
Mass Based Goal (Existing) and New Source Complement (Million Metric Tons) Period Idaho Montana Oregon Washington PNW
Interim Period 2022-29
1.49
11.99
8.25
11.08
32.8
2022 to 2024
1.51
12.68
8.45
11.48
34.1
2025 to 2027
1.48
11.80
8.18
10.95
32.4
2028 to 2029
1.48
11.23
8.06
10.67
31.4
2030 and Beyond
1.49
10.85
8.00
10.49
30.8
EPA’s regulations do not cover all of the power plants used to serve Northwest consumers. Most notably, the Jim Bridger coal plants located in Wyoming serve the region, but are not physically located within the regional boundaries defined under the Northwest Power Act.26 In addition, there are many smaller, non-utility owned plants that serve Northwest consumers located in the region, but which are not covered by EPA’s 111(b) and 111(d) regulations. Therefore, in order for the Council to compare EPA’s carbon dioxide emissions limits to those specifically covered by the agency’s regulations, it was necessary to model a sub-set of plants in the region.
25 Note: EPA’s emissions limits are stated in the regulation in “short tons” (2000 lbs). In Table 3-2 and throughout this document, carbon dioxide emissions are measured in “metric tons” (2204.6 lbs) or million metric ton equivalent (MMT). 26 The Power Act defines the “Pacific Northwest” as Oregon, Washington, Idaho, the portion of Montana west of the Continental Divide, “and such portions of the States of Nevada, Utah, and Wyoming as are within the Columbia River drainage basin; and any contiguous areas, not in excess of seventy-five air miles from [those] area[s]… which are a part of the service area of a rural electric cooperative customer served by the Administrator on December 5, 1980, which has a distribution system from which it serves both within and without such region.” (Northwest Power Act, §§ 3(14)(A) and (B).)
Chapter 3: Resource Strategy
nwcouncil.org/7thplan 3-46
Under the Clean Air Act, each state is responsible for developing and implementing compliance plans with EPA’s carbon dioxide emissions regulations. However, the Council’s modeling of the Northwest Power system operation is not constrained by state boundaries. That is, generation located anywhere within the system is assumed to be dispatched when needed to serve consumer demands regardless of their location. For example, the Colstrip coal plants are located in Montana, but are dispatched to meet electricity demand in other Northwest states. Consequently, the Council’s analysis of compliance with EPA’s regulations can only be carried out at the regional level. While this is a limitation of the modeling, it does provide useful insight into what regional resource strategies can satisfy the Clean Power Plan’s emission limits.
Figure 3 - 17 shows the annual average carbon dioxide emissions for the least cost resource strategy identified under each of the major scenarios and sensitivity studies evaluated during the development of the Seventh Power Plan. The interim and final EPA carbon dioxide emissions limits aggregated from the state level to the regional level is also shown in this figure (top heavy line). Figure 3 - 17 shows all of the scenarios evaluated result in average annual carbon dioxide emissions well below the EPA limits for the region.
One of the key findings from the Council’s analysis is that from a regional perspective compliance with EPA’s carbon dioxide emissions rule should be achievable without adoption of additional carbon dioxide reduction policies in the region. This is not to say that no additional action need occur.
State compliance plans for meeting the Clean Power Plan regulations have not been drafted. These will likely call for additional actions beyond those required to achieve compliance at the regional level, since not all states in the region are equivalently affected by the final 111(d) regulations. This is clearly the case with Montana, where EPA’s regulations require the second largest percentage reduction in carbon dioxide emissions of any state.27 Moreover, even at the regional level, all of the least cost resource strategies that have their emission levels depicted in Figure 3 - 17 call for the development of between 4,000 and 4,400 average megawatts of energy efficiency by 2035. All of these resource strategies also assume that the retiring Centralia, Boardman, and North Valmy coal plants are replaced with only those resources required to meet regional capacity and energy adequacy requirements. Utility development of new gas-fired generation to meet local needs for ancillary services, such as wind integration, or capacity requirements beyond the modest levels included under these scenarios would increase emissions. Finally, all of the carbon dioxide emissions from the least cost resource strategies depicted in Figure 3-17 also assume that Northwest electricity generation is dispatched first to meet regional adequacy standards for energy and capacity rather than to serve external markets.
27 Montana, which must reduce its carbon emissions by 47%, is second only to South Dakota that must reduce its carbon dioxide emissions by 48%.
Chapter 3: Resource Strategy
nwcouncil.org/7thplan 3-47
Figure 3 - 17: Average Annual Carbon Dioxide Emissions for Least Cost Resource Strategies by Scenario for Generation Covered by EPA Carbon Emissions Regulations Located Within
Northwest States
RESOURCE STRATEGY COST AND REVENUE IMPACTS The Council’s Regional Portfolio Model (RPM) calculates the net present value cost to the region of each resource strategy it tests to identify those strategies that have both low cost and low economic risk. The RPM includes only the forward-going costs of the power system; that is, only those costs that can be affected by future conditions and resource decisions. Figure 3 - 18 shows the present value system cost for the ten scenarios evaluated for development of the final Seventh Power Plan.28 Figure 3 - 18 shows the present value of power system costs both with and without assumed
28 Chapter 15 provides this same information for both these scenarios and the other principal scenarios evaluated during development of the draft plan.
-
10
20
30
40
2015 2020 2025 2030 2035 2-Ye
ar R
ollin
g Av
erag
e CO
2 Em
issi
ons f
or G
ener
atio
n Co
vere
d Cl
ean
Pow
er P
lan
Regu
latio
ns (M
MT)
Existing Policy No Demand Response SCC - Mid-Range Max. CO2 Reduction - Exist. Tech. Retire Coal Retire Coal w/SCC_MidRange Retire Coal w/SCC_MidRange & No New Gas Increased Market Reliance Regional RPS at 35% EPA Emissions Limits
Chapter 3: Resource Strategy
nwcouncil.org/7thplan 3-48
carbon dioxide emissions costs. That is, the scenarios that assumed some form of carbon dioxide price include not only the direct cost of building and operating the resource strategy, but also the costs of emitting carbon dioxide assumed in those scenarios. Therefore, in Figure 3 - 18 the present value system cost of the least cost resource strategies for only those scenarios that assume the social cost of carbon is imposed include carbon dioxide costs. The average system cost for the other scenarios are the same with or without considering carbon dioxide revenues.
Figure 3 - 18: Average Net Present Value System Cost for the Least Cost Resource Strategy by Scenario With and Without Carbon Revenues
Table 3 - 4 shows average present value system cost, net of carbon revenues, for ten selected scenarios evaluated for the Seventh Power Plan. This table shows the difference in present value cost of each of these scenarios compared to the Existing Policy scenario. A review of Table 3-4 shows that the Increased Market Reliance and the SCC MidRange resource strategies both have a lower present value system cost than the Existing Policy resource strategy. The finding that the Increased Market Reliance resource strategy has a lower cost than the Existing Policy resource strategy supports the Council’s recommendation that the Resource Adequacy Advisory Committee review its assumptions regarding the cost and risk of reliance on external market contracts to meet regional adequacy standards. As discussed previously, the lower present value system cost for the SCC MidRange resource strategy is a result of cost-offsets from increased revenue due to higher value regional exports when carbon pricing is assumed across the entire western electricity market.
$0
$20
$40
$60
$80
$100
$120
$140
$160
Pres
ent V
alue
Cos
t (bi
llion
2012
$)
CO2 Costs (billion 2012$)
Without CO2 Costs (billion 2012$)
Chapter 3: Resource Strategy
nwcouncil.org/7thplan 3-49
Table 3-4 also shows that not developing demand responses resources, i.e., following the No Demand Response least cost resource strategy) would add $4 billion to the regional power system cost. Similarly, adopting a resource strategy that targets only conservation with cost below short run wholesale market prices (i.e. the Lower Conservation resource strategy) would increase regional power system cost by $16 billion compared to the Existing Policy resource strategy.
Six of the scenarios shown in Table 3-4 test different policy options for reducing carbon dioxide emissions. As a result, with the exception of the SCC MidRange scenario, they all have higher average system cost than the Existing Policy scenario which includes no new policies to reduce carbon emissions. The relative merits of these policy alternatives are discussed in the prior section of this Chapter.
Table 3 - 4: Average Net Present Value System Cost without Carbon Dioxide Revenues and Incremental Cost Over Existing Policy Scenario
Scenario
Present Value System Cost of Resource Strategy, Excluding Carbon Revenues (billion 2012$)
Incremental Present Value System Cost Over Existing Policy Scenario Resource Strategy (billion 2012$)
Reporting costs as net present values does not show patterns over time and may obscure differences among individual utilities. The latter is unavoidable in regional planning and the Council has noted throughout the plan that different utilities will be affected differently by alternative policies. It is possible, however, to display the temporal patterns of costs among scenarios. Four of the scenarios assume no carbon dioxide regulatory compliance cost or damage costs: Existing Policy, Maximum Carbon Reduction - Existing Technology, Lower Conservation and Renewable Portfolio Standards at 35 Percent so their forward going costs are identical with and without carbon dioxide cost. In order to compare the direct cost of the actual resource strategies resulting from carbon dioxide pricing policies with these four scenarios it is necessary to remove the carbon dioxide cost from those other scenarios. Figure 3 - 19 shows the power system cost over the forecast period for the least cost resource strategy, excluding carbon dioxide costs.
Chapter 3: Resource Strategy
nwcouncil.org/7thplan 3-50
Forward-going costs include only the future operating costs of existing resources and the capital and operating costs of new resources. The 2016 value in Figure 3 - 19 includes mainly operating costs of the current power system, but not the capital costs of the existing generation, transmission, and distribution system since these remain unchanged by future resource decisions. The cost shown for the Retire Coal w/SCC MidRange & No New Gas scenario does not include the cost of carbon dioxide damage.
Figure 3 - 19: Annual Forward-Going Power System Costs, Excluding Carbon Dioxide Revenues
A review of Figure 3 - 19 shows the Existing Policy scenario has the lowest annual cost throughout the planning period. The Lower Conservation resource strategy shows similar annual system cost to the Existing Policy scenario, but begins to deviate above that scenario beginning around 2025. The No Demand Response scenario shows a similar pattern, with higher annual cost later in the planning period. All of the scenarios that are designed to reduce carbon dioxide emissions have higher annual cost than the Existing Policy scenario. In particular the Retire Coal w/SCC-MidRange & No New Gas, the Regional RPS at 35% and the Maximum Carbon Reduction - Existing Technology least cost resource strategies all exhibit significantly higher annual cost.
In the following section of this chapter these revenue requirements are translated into electric rates and typical residential customer monthly electricity bills. The addition of existing system costs makes these impacts on consumers appear smaller than looking only at forward-going costs. The rate and bill effects are further dampened by the fact that conservation costs are not all recovered through utility rates. In fact, it becomes difficult to graphically distinguish among the effects of some of the scenarios.
$-
$1.00
$2.00
$3.00
$4.00
$5.00
$6.00
$7.00
$8.00
2015 2020 2025 2030 2035 Annu
al R
even
ue R
equi
rem
ent f
or F
orw
ard
Goi
ng
Syst
em C
ost (
billi
on 2
012$
)
Existing Policy Retire Coal Retire Coal w/SCC_MidRange & No New Gas No Demand Response Regional RPS at 35% Lower Conservation
Chapter 3: Resource Strategy
nwcouncil.org/7thplan 3-51
Figure 3 - 20 shows the effects of the different scenarios’ average system costs translated into possible effects on electricity rates and residential consumer monthly electricity bills. The “rate” estimates shown in Figure 3 - 20 are average revenue requirement per megawatt-hour which include both monthly fixed charges and monthly energy consumption charges. The residential bills are typical monthly bills. In order to compare these scenarios over the period covered by the Seventh Power Plan, both the average revenue requirement per megawatt-hour and average monthly bills have been levelized over the twenty year planning period. Both are expressed in constant 2012 dollars.
Figure 3 - 20: System Costs, Rates, and Monthly Bills, Excluding Carbon Dioxide Revenues
As can be seen in Figure 3 - 20, levelized rates and bills generally move in the same direction as the average net present value of power system cost reported in this plan. The only exception to this relationship is in the Lower Conservation scenario.
The Lower Conservation scenario has an average system cost of $97 billion, compared to the Existing Policy resource strategy’s $82 billion. Even with a $16 billion higher average system cost the Lower Conservation resource strategy has a lower levelized average revenue requirement per megawatt-hour than the Existing Policy scenario ($83/MWh vs. $86/MWh). However, the, the average monthly bills for the two scenarios are nearly identical throughout this same period with the Existing Policy scenario having slightly lower monthly bill ($69/month vs. $70/month) than the Lower Conservation scenario.
$0 $10 $20 $30 $40 $50 $60 $70 $80 $90 $100
$0
$20
$40
$60
$80
$100
$120
$140
Aver
age
Mon
thly
Bill
($/m
th)
/Ave
rage
Rat
e ($
/MW
h)
Pres
ent V
alue
Sys
tem
Cos
t (b
illio
n 20
12$)
System Cost
Levelized Bill
Levelized Rate
Chapter 3: Resource Strategy
nwcouncil.org/7thplan 3-52
However, viewed over time the Lower Conservation scenario’s average monthly bill is higher by a several dollars per month than the Existing Policy scenario’s average monthly bill. Figure 3 - 21 illustrates how system cost can increase with lower conservation, but rates decrease because costs are spread over a larger number of megawatt-hours sold without conservation. Figure 3 - 21 also illustrates how the greater efficiency improvements lower average electricity bills through time. As can be seen this figure, the average monthly bills for the Lower Conservation and Existing Policy scenarios are nearly equivalent through around 2030, then the Existing Policy scenario’s bills are increasingly lower. This occurs despite the fact that the Existing Policy scenarios average revenue requirement per megawatt-hour is several dollars per megawatt-higher than the Lower Conservation scenario’s.
Figure 3 - 21: Regional Average Revenue per Megawatt-Hour and Residential Electricity Bills With and Without Lower Conservation
$-
$10
$20
$30
$40
$50
$60
$70
$80
$90
$100
2016 2021 2026 2031
Aver
age
Resi
dent
ial R
even
ue ($
/MW
h)
Ave
rage
Res
iden
tial B
ill ($
/mon
th)
Existing Policy - Average Regional Revenue/MWh
Lower EE - Average Regional Revenue/MWh
Existing Policy - Average Regional Residential Bill