46 This chapter is divided into three sections (RN, APN, and LPN), each describing a portion of the New Jersey Nursing Workforce. The data for this chapter was acquired from the New Jersey Board of Nursing license renewal survey. Section 1: Registered Nurse (RN) Profile Demographics In the 2016-2017 survey periods, there were 96,113 RN respondents. Table 3-A. RN Demographic Characteristics N = 96,113 % Gender Female 86,639 90% Male 7,878 8% Transgender 23 0% Choose not to answer 114 0% Missing/No Data 1,459 2% Race/Ethnicity American Indian 104 0% Asian 14,429 15% Black/African American 9,183 10% White/Caucasian 61,562 64% Hispanic/Latino 3,933 4% Other 336 0% Two or More Races 3,453 4% Did not Disclose 3,113 3% Chapter 3: Workforce Supply Data
Transcript
46
This chapter is divided into three sections (RN, APN, and LPN), each describing a portion of the
New Jersey Nursing Workforce. The data for this chapter was acquired from the New Jersey
Board of Nursing license renewal survey.
Section 1: Registered Nurse (RN) Profile Demographics In the 2016-2017 survey periods, there were 96,113 RN respondents.
Table 3-A. RN Demographic Characteristics
N = 96,113 %
Gender Female 86,639 90% Male 7,878 8% Transgender 23 0% Choose not to answer 114 0% Missing/No Data 1,459 2%
Race/Ethnicity American Indian 104 0% Asian 14,429 15% Black/African American 9,183 10% White/Caucasian 61,562 64% Hispanic/Latino 3,933 4% Other 336 0% Two or More Races 3,453 4% Did not Disclose 3,113 3%
Chapter 3: Workforce Supply Data
47
Figure 3-A shows the type of
educational program that led
to respondents’ initial
NCLEX examination and
licensure. Of all RN
respondents, 3,758 did not
report the level of their initial
pre-licensure education.
RN Geographic Distribution Figure 3-B. Distribution of RNs by County
Figures 3-B and 3-C describe the employment of
RNs geographically. Figure 3-B sorts RNs
according to the zip code of their primary employer.
Of the 96,113 RN survey respondents, 34,754 did
not report their employer’s zip code, so they are not
included on this map.
20%
40%1%
38%
1%
Figure 3-A. RN Initial Pre-Licensure
Education
Diploma, N=18,456
ADN Generic,
N=37,160
ADN Bridge (LPN-
RN), N=1,134
Baccalaureate,
N=35,322
Pre-licensure MSN,
N=282
25%
21%
18%
36%
Figure 3-C. Distribution of RNs by
Region
North, N=23,666
Central, N=19,980
South, N=17,713
Missing, N=34,754
48
Approximately 25%
(24,179) of RNs have an
active licensure in one or
more other states. These
data do not show
whether these RNs are
practicing in these other
states; it only shows
whether they are
licensed.
RN Employment Characteristics Table 3-B shows details of the licensed RNs who are employed in a profession that utilizes their
license.
Table 3-B. RN Nursing Employment Status
N = 96,113 %
Employed as an RN Yes 83,969 87% No 6,816 7% Missing/No Data 5,328 6%
Hours per Week 34 hours or less 21,208 22% 35-40 hours 58,343 61% 41-50 hours 1,542 2% 51 or more hours 1,733 2% Missing/No Data 13,247 14%
Number of Positions 1 54,845 57% 2 23,234 24% 3 4,309 4% 4 448 0% 5 334 0% Missing/No Data 12,943 13%
71%
10%
8%
7%4%
Figure 3-D. RN Licensure in States other than NJ
Only New Jersey,
N=67,766
New York, N=9,624
Pennsylvania, N=7,659
Other, N=6,896
Missing/No Data,
N=4,168
49
Figures 3-E and 3-F describe RNs according to employment setting. Employment setting refers
to the type of agency or department in which a nurse is working. According to Figure 3-E, nearly
50% of RNs are employed in a department within a hospital.
Figure 3-F shows the average age of RNs in each employment setting. The average age of RNs
across all employment settings is 48.
8% 1%
4%
2% 1%
5%
1%
10%
34%
1%
2%
5%
1%
3%
5%
1%
18%
Figure 3-E. RN Primary Employment Setting
Ambulatory Care, N=7,012
Call Center/Telenursing, N=611
Case Management, N=3,469
Dialysis, N=1,602
Government Agency, N=746
Home Health, N=4,859
Hospice, N=1,120
Hospital - Ambulatory Care, N=9,191
Hospital - Inpatient, N=31,112
Hospital - Nursing Home, N=813
Inpatient Mental Health, N=1,757
Nursing Home, N=4,727
Public Health, N=891
Rehabilitation Facility, N=2,451
School Health, N=4,262
University or College, N=1,017
Missing, N=16,576
51 52 5248
54 52 5248
4549 50 51 53
47
5558
Figure 3-F. Average Age of RNs According to Primary
Employment Setting
50
Figures 3-G and 3-H describe RNs according to employment position. Employment position
refers to a nurse’s job title. According to Figure 3-G, nearly 50% of RNs are employed as staff
nurses. This corresponds to the number of RNs in Figure 3-E who are employed in hospital
settings.
Figure 3-G shows the average age of RNs in each employment position. The average age of RNs
across all employment positions is 48.
4%5%
1%1% 2%
5%
2%2%
1%
1%
4%
1%
1%
49%
1%
18%
Figure 3-G. RN Primary Employment Position
Case Manager/Coordinator, N=3,900
Charge Nurse/Team Leader, N=5,038
Clinical Nurse Leader (CNL), N=782
Educator (Academic), N=1,141
Front-Line Management, N=1,973
Middle Management, N=4,228
Nurse Coordinator, N=2,158
Patient Care Coordinator, N=1,615
Public Health, N=1,023
Quality Improvement Nurse, N=1,041
School Nurse, N=4,065
Senior Management, N=1,112
Staff Educator, N=972
Staff Nurse, N=45,068
Telenursing, N=1,305
Missing/No Data, N=16,649
52 50 5258
52 52 52 53 52 53 55 5653
46 48
58
Figure 3-H. Average Age of RNs According to Primary
Employment Position
51
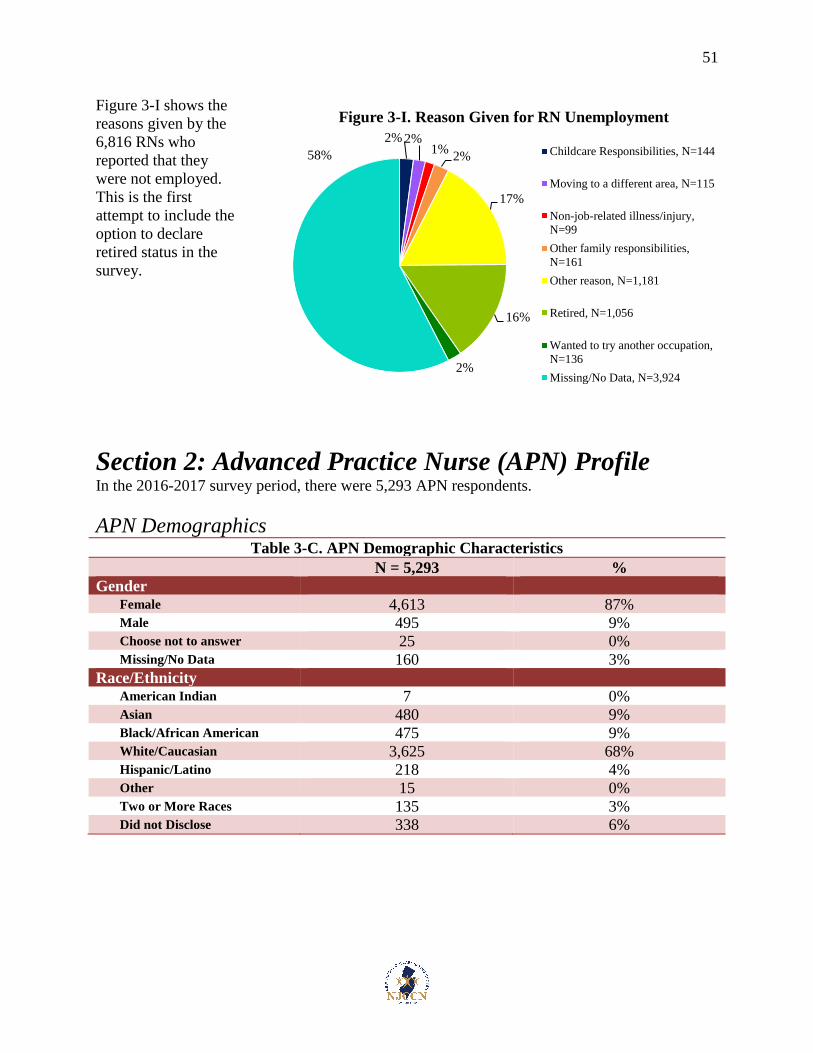
Figure 3-I shows the
reasons given by the
6,816 RNs who
reported that they
were not employed.
This is the first
attempt to include the
option to declare
retired status in the
survey.
Section 2: Advanced Practice Nurse (APN) Profile In the 2016-2017 survey period, there were 5,293 APN respondents.
Gender Female 4,613 87% Male 495 9% Choose not to answer 25 0% Missing/No Data 160 3%
Race/Ethnicity American Indian 7 0% Asian 480 9% Black/African American 475 9% White/Caucasian 3,625 68% Hispanic/Latino 218 4% Other 15 0% Two or More Races 135 3% Did not Disclose 338 6%
2% 2%1%
2%
17%
16%
2%
58%
Figure 3-I. Reason Given for RN Unemployment
Childcare Responsibilities, N=144
Moving to a different area, N=115
Non-job-related illness/injury,
N=99
Other family responsibilities,
N=161
Other reason, N=1,181
Retired, N=1,056
Wanted to try another occupation,
N=136
Missing/No Data, N=3,924
52
APN Geographic Distribution
Figure 3-J. Distribution of APNs by County
Figures 3-J and 3-K describe the employment of APNs
geographically. Figure 3-J sorts APNs according to the
zip code of their primary employer. Of the 5,523 APN
survey respondents, 2,053 did not report their
employer’s zip code, so they are not included on this
map.
Approximately 22%
(1,147) of APNs have an
active licensure in one or
more other states. These
data do not show
whether these APNs are
practicing in these other
states; it only shows
whether they are
licensed.
23%
19%
21%
37%
Figure 3-K. Distribution of APNs by
Region
North, N=1,254
Central, N=1,036
South, N=1,180
Missing, N=2,053
7%
8%
7%
69%
9%
Figure 3-L. APN Licensure in States other than NJ
New York, N=360
Pennsylvania, N=438
Other, N=349
Only New Jersey,
N=3,690
Missing/No Data,
N=456
53
APN Employment Characteristics The following table shows details of the licensed APNs who are employed in a profession that
utilizes their license. The majority are full-time employees and report that they work in more
than one position as an APN.
Table 3-D: APN Nursing Employment Status
N = 5,293 %
Employed as an APN Yes 4,701 88% No 126 2% Missing/No Data 466 9%
Hours per Week 34 hours or less 1,270 24% 35-40 hours 3,046 58% 41-50 hours 280 5% 51 or more hours 103 2% Missing/No Data 77 1%
Employed in More than 1 Position as an APN No 748 14% Yes 4,161 79% Missing/No Data 712 13%
Figure 3-M shows the reasons given by the 126 APNs who reported that they were unemployed.
20%
11%
8%
18%
41%
2%
Figure 3-M. Reason Given for APN Unemployment
Childcare Responsibilities, N=25
Moving to a different area, N=14
Returned to School, N=10
Other family responsibilities,
N=23
Retired, N=52
Other reason, N=2
54
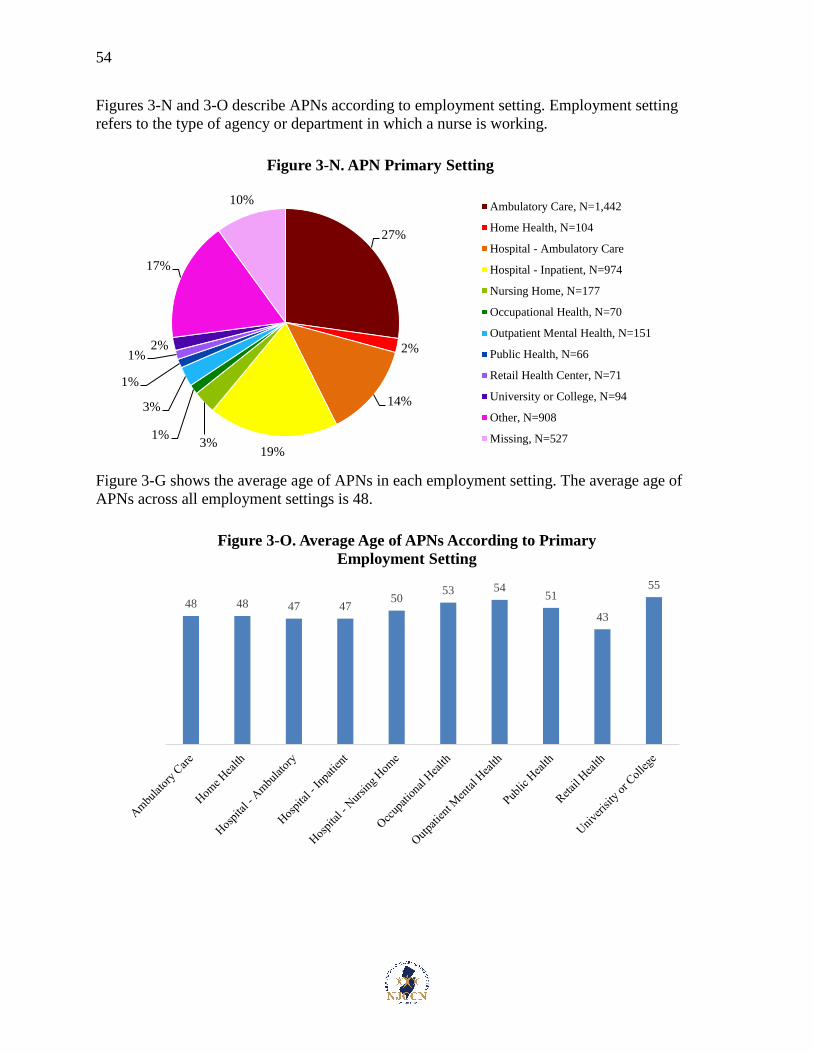
Figures 3-N and 3-O describe APNs according to employment setting. Employment setting
refers to the type of agency or department in which a nurse is working.
Figure 3-G shows the average age of APNs in each employment setting. The average age of
APNs across all employment settings is 48.
27%
2%
14%
19%3%
1%
3%
1%
1%2%
17%
10%
Figure 3-N. APN Primary Setting
Ambulatory Care, N=1,442
Home Health, N=104
Hospital - Ambulatory Care
Hospital - Inpatient, N=974
Nursing Home, N=177
Occupational Health, N=70
Outpatient Mental Health, N=151
Public Health, N=66
Retail Health Center, N=71
University or College, N=94
Other, N=908
Missing, N=527
48 48 47 4750
53 5451
43
55
Figure 3-O. Average Age of APNs According to Primary
Employment Setting
55
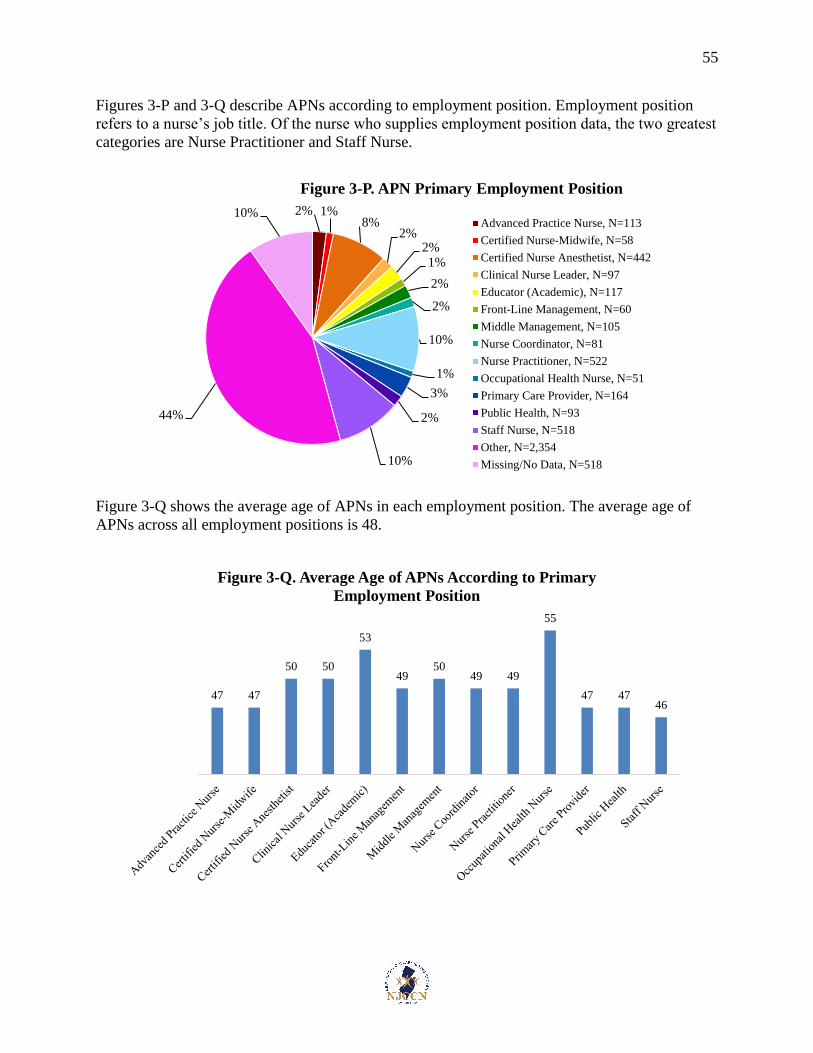
Figures 3-P and 3-Q describe APNs according to employment position. Employment position
refers to a nurse’s job title. Of the nurse who supplies employment position data, the two greatest
categories are Nurse Practitioner and Staff Nurse.
Figure 3-Q shows the average age of APNs in each employment position. The average age of
APNs across all employment positions is 48.
2% 1%8%
2%2%1%
2%
2%
10%
1%
3%
2%
10%
44%
10%
Figure 3-P. APN Primary Employment Position
Advanced Practice Nurse, N=113
Certified Nurse-Midwife, N=58
Certified Nurse Anesthetist, N=442
Clinical Nurse Leader, N=97
Educator (Academic), N=117
Front-Line Management, N=60
Middle Management, N=105
Nurse Coordinator, N=81
Nurse Practitioner, N=522
Occupational Health Nurse, N=51
Primary Care Provider, N=164
Public Health, N=93
Staff Nurse, N=518
Other, N=2,354
Missing/No Data, N=518
47 47
50 50
53
4950
49 49
55
47 4746
Figure 3-Q. Average Age of APNs According to Primary
Employment Position
56
Section 3: Licensed Practical Nurse (LPN) Profile In the 2016-2017 survey period, there were 16,831 LPN respondents.
Gender Female 14,606 87% Male 1,675 10% Transgender 2 0% Choose not to answer 31 0% Missing/No Data 517 3%
Race/Ethnicity American Indian 27 0% Asian 1,194 7% Black/African American 5,349 32% White/Caucasian 7,366 44% Hispanic/Latino 1,278 8% Other 89 1% Two or More Races 859 5% Did not Disclose 669 4%
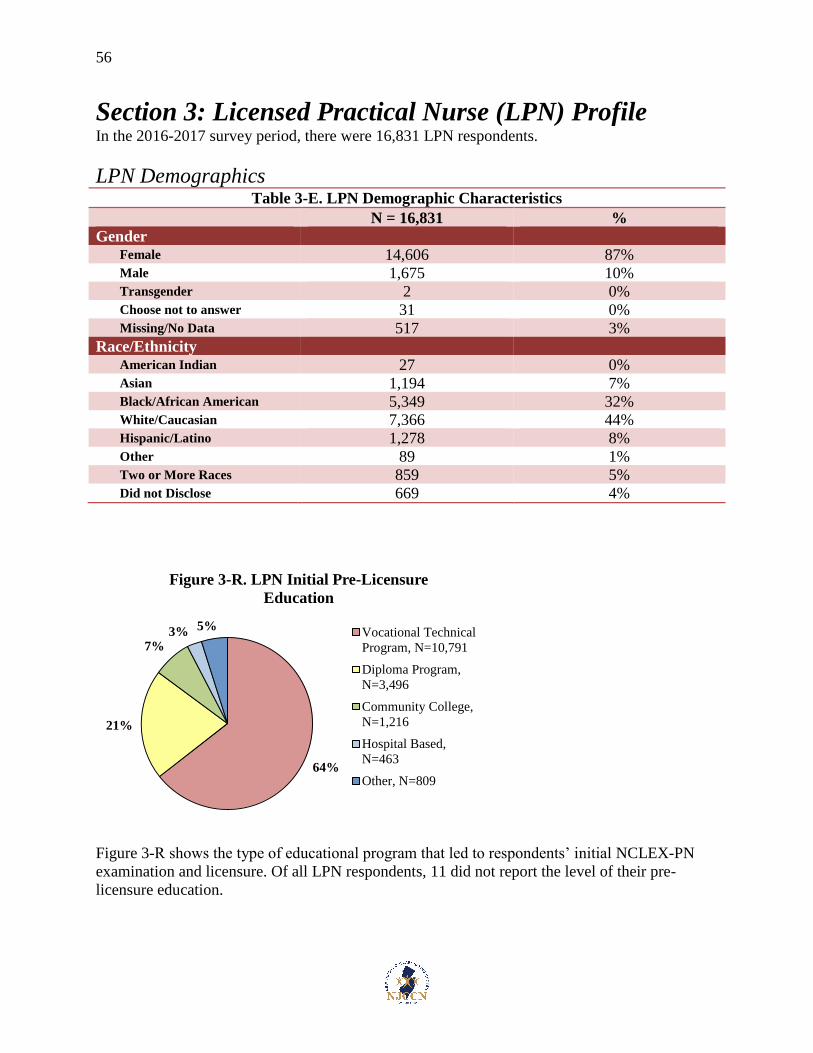
Figure 3-R shows the type of educational program that led to respondents’ initial NCLEX-PN
examination and licensure. Of all LPN respondents, 11 did not report the level of their pre-
licensure education.
64%
21%
7%3% 5%
Figure 3-R. LPN Initial Pre-Licensure
Education
Vocational Technical
Program, N=10,791
Diploma Program,
N=3,496
Community College,
N=1,216
Hospital Based,
N=463
Other, N=809
57
LPN Geographic Distribution
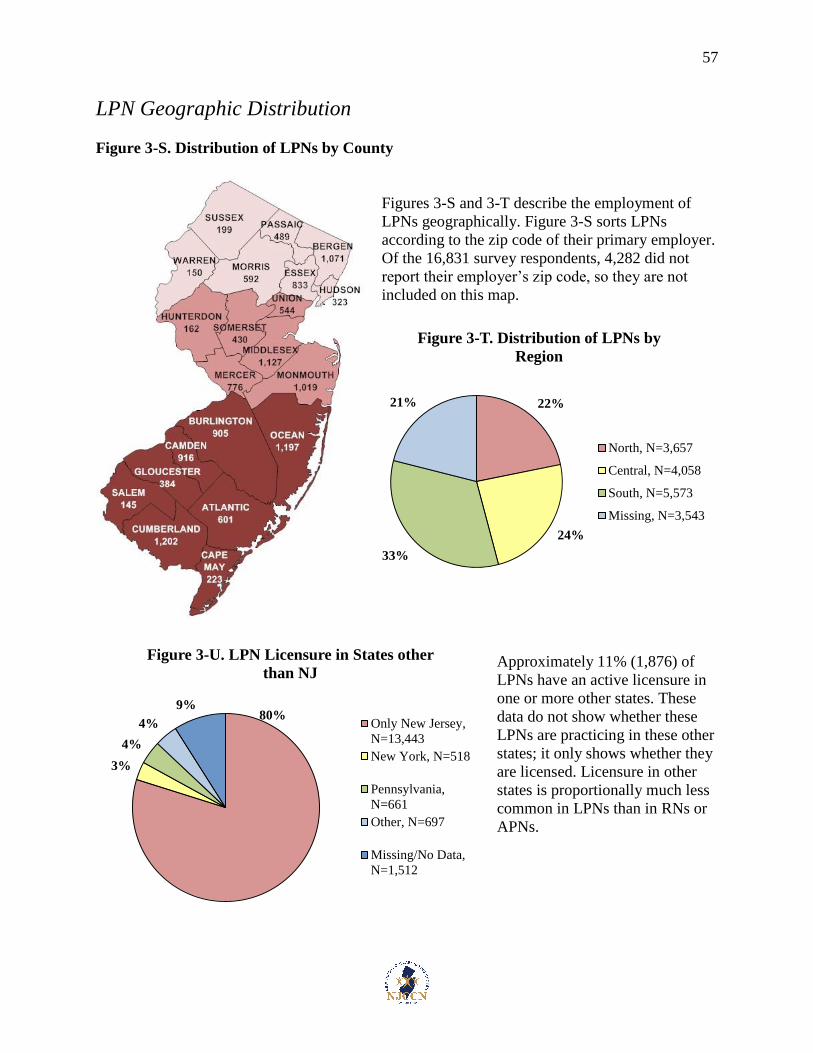
Figure 3-S. Distribution of LPNs by County
Figures 3-S and 3-T describe the employment of
LPNs geographically. Figure 3-S sorts LPNs
according to the zip code of their primary employer.
Of the 16,831 survey respondents, 4,282 did not
report their employer’s zip code, so they are not
included on this map.
Approximately 11% (1,876) of
LPNs have an active licensure in
one or more other states. These
data do not show whether these
LPNs are practicing in these other
states; it only shows whether they
are licensed. Licensure in other
states is proportionally much less
common in LPNs than in RNs or
APNs.
22%
24%
33%
21%
Figure 3-T. Distribution of LPNs by
Region
North, N=3,657
Central, N=4,058
South, N=5,573
Missing, N=3,543
80%
3%
4%
4%
9%
Figure 3-U. LPN Licensure in States other
than NJ
Only New Jersey,
N=13,443
New York, N=518
Pennsylvania,
N=661
Other, N=697
Missing/No Data,
N=1,512
58
LPN Employment Characteristics The following table shows details of the licensed LPNs who are employed in a profession that
utilizes their license.
Table 3-F. LPN Nursing Employment Status
N = 16,831 %
Employed as an LPN Yes 14,502 86% No 1,351 8% Missing/No Data 978 6%
Hours per Week 34 hours or less 4,017 24% 35-40 hours 8,351 50% 41-50 hours 347 2% 51 or more hours 238 1% Missing/No Data 3,878 23%
Number of Positions 1 9,301 55% 2 4,090 24% 3 806 5% 4 83 0% 5 22 0% Missing/No Data 2,529 15%
7%
9%
1%
15%
9%
7%
6%
30%
7%
9%
Figure 3-V. Reason Given for LPN Unemployment
Cannot find work as an LPN, N=101
Childcare Responsibilities, N=117
Non-job-related illness/injury, N=137
Other family responsibilities, N=199
Difficult to find desired nursing position, N=124
Returned to School, N=92
Other reason, N=79
Retired, N=406
Wanted to try another occupation, N=96
Missing/No Data, N=124
59
Figures 3-W and 3-X describe LPNs according to employment setting. Employment setting
refers to the type of agency or department in which a nurse is working. According to Figure 3-W,
LPNs are heavily concentrated in long-term care settings, with 31% of LPNs are working in
Nursing Homes and 15% working in Home Health.
Figure 3-X shows the average age of LPNs in each employment setting. The average age of
LPNs across all employment settings is 47.
9%
1% 1%
1%1%
15%
1%
1%
1%
3%
2%
31%
1%
8%
1%
11%
14%
Figure 3-W. LPN Primary Employment Setting
Ambulatory Care, N=1,441
Assisted Living, N=132
Case Management, N=205
Correctional Facility, N=158
Government, N=159
Home Health, N=2,569
Hospice, N=170
Hospital - Ambulatory Care, N=170
Hospital, Inpatient Care, N=210
Hospital - Nursing Home, N=425
Inpatient Mental Health, N=255
Nursing Home, N=5,162
Public Health, N=135
Rehabilitation, N=1,297
School Health, N=157
Other, N=1,846
Missing/No Data, N=2,288
48 48 48 4649
4651 51 53
47 48 46 45 4449
Figure 3-X. Average Age of LPNs According to Primary
Employment Setting
60
Figures 3-Y and 3-Z describe LPNs according to employment position. Employment position
refers to a nurse’s job title. According to Figure 3-Y, 52% of LPNs are employed as staff nurses.
Figure 3-Z shows the average age of LPNs in each employment position. The average age of
LPNs across all employment settings is 47.
2% 8% 1%1%
1% 1%
1%
1%2%
1%
52%
16%
13%
Figure 3-Y. LPN Primary Employment Position
Case Manager, N=273
Charge Nurse, N=1,350
Front-Line Management, N=173
Middle Management, N=219
Nurse Coordinator, N=174
Occupational Health, N=204
Patient Care Coordinator, N=220
Patient Educator, N=104
Public Health, N=249
School Nurse, N=17
Staff Nurse, N=8,793
Other, N=2,654
Missing/No Data, N=2,246
4847 47 47 47
4847
4645
46 46
48
53
Figure 3-Z. Average Age of LPNs According to Primary