Chapter 4 Environmental Effects 4.1 Introduction 4.2 Land Ownership and Use 4.3 Air Quality 4.4 Geology, Soils, and Erosional Processes 4.5 Water Resources 4.6 Vegetation 4.7 Riparian and Wetland Processes 4.8 Fish and Fish Habitat 4.9 Amphibians and Amphibian Habitat 4.10 Birds, Mammals, Other Wildlife and Their Habitats 4.11 Recreation 4.12 Visual Resources 4.13 Archaeological, Historical, and Cultural Resources 4.14 Social and Economic Environment
Transcript
Chapter 4Environmental
Effects
4.1 Introduction 4.2 Land Ownership and Use 4.3 Air Quality 4.4 Geology, Soils, and Erosional
Processes 4.5 Water Resources 4.6 Vegetation 4.7 Riparian and Wetland Processes 4.8 Fish and Fish Habitat 4.9 Amphibians and Amphibian Habitat4.10 Birds, Mammals, Other Wildlife
and Their Habitats 4.11 Recreation 4.12 Visual Resources 4.13 Archaeological, Historical, and
Cultural Resources 4.14 Social and Economic Environment
4.8 FISH AND FISH HABITAT...........................................................................4-161 33 4.8.1 Introduction .....................................................................................4-161 34 4.8.2 Evaluation Criteria ..........................................................................4-163 35 4.8.3 Evaluation of Alternatives ...............................................................4-168 36 4.8.4 Synthesis by Analysis Region ........................................................4-203 37
4.9 AMPHIBIANS AND AMPHIBIAN HABITATS ..............................................4-225 38 4.9.1 Evaluation Criteria ..........................................................................4-225 39 4.9.2 Evaluation of Alternatives ...............................................................4-227 40
4.10 BIRDS, MAMMALS, OTHER WILDLIFE, AND THEIR HABITATS.............4-237 41 4.10.1 Evaluation Criteria ..........................................................................4-237 42 4.10.2 Evaluation of Alternatives ...............................................................4-237 43
4.11.1 Introduction .....................................................................................4-245 2 4.11.2 Recreation Use in Riparian Management Zones............................4-246 3 4.11.3 Effects of Forestland Conversion....................................................4-251 4 4.11.4 Effects on Anglers...........................................................................4-252 5
4.12 VISUAL RESOURCES ................................................................................4-253 6 4.12.1 Introduction .....................................................................................4-253 7 4.12.2 Effects of Harvest in Riparian Management Zones........................4-254 8 4.12.3 Effects of Forestland Conversion....................................................4-255 9
4.13 ARCHEOLOGICAL, HISTORICAL AND CULTURAL RESOURCES .........4-257 10 4.13.1 Statutory and Regulatory Context...................................................4-257 11 4.13.2 Evaluation Criteria ..........................................................................4-261 12 4.13.3 Evaluation of the Alternatives .........................................................4-262 13
4.14 SOCIAL AND ECONOMIC ENVIRONMENT ..............................................4-265 14 4.14.1 Introduction .....................................................................................4-265 15 4.14.2 Employment and the Economy.......................................................4-268 16 4.14.3 Non-Use and Ecosystem Service Values.......................................4-278 17 4.14.4 Environmental Justice.....................................................................4-280 18
19
4.1 INTRODUCTION 20 This chapter provides an analysis of the direct and indirect environmental effects 21 associated with the alternatives. Table S-1 at the end of the Executive Summary provides 22 a summary of effects presented in this chapter. Cumulative effects are presented in 23 Chapter 5. The analysis in this chapter is presented relative to the affected environment 24 descriptions given in Chapter 3. Therefore, each main subsection in Chapter 3 has a 25 corresponding effects subsection in Chapter 4 presented in the same sequence. 26
Please note, figures and tables in Chapter 4 are numbered differently than they are in all 27 other chapters. Chapter 4 tables and figures are labeled according to the subsection they 28 appear within. For example, Figure 4.1-1 would be the first figure located in subsection 29 4.1. This numbering system was necessary because of the length of Chapter 4. 30
The specific subsection sequence is as follows: 31
• Land Ownership and Use (subsection 4.2) 32 • Air Quality (subsection 4.3) 33 • Geology, Soils, and Erosional Processes (subsection 4.4) 34 • Water Resources (subsection 4.5) 35 • Vegetation (subsection 4.6) 36 • Riparian and Wetland Processes (subsection 4.7) 37 • Fish and Fish Habitat (subsection 4.8) 38 • Amphibian and Amphibian Habitat (subsection 4.9) 39 • Birds, Mammals, Other Wildlife, and Their Habitats (subsection 4.10) 40
Draft EIS Introduction
4-3
Chapter 4 • Recreation (subsection 4.11) 1 • Visual Resources (subsection 4.12) 2 • Cultural and Indian Trust Resources (subsection 4.13) 3 • Social and Economic Environment (subsection 4.14) 4
4.1.1 Analysis Area 5 The analysis area that defines the affected environment includes the majority of the State 6 of Washington (subsection 3.1, Affected Environment – Introduction). The proposed 7 action and the alternatives would directly affect the forested lands that are covered under 8 the Washington Forest Practices Rules. These lands include the non-Federal and non-9 tribal forestlands of the State (Figure 3-1). These lands are referred to as the “covered 10 lands” or the lands subject to Washington Forest Practices Rules in this Draft 11 Environmental Impact Statement (DEIS). 12
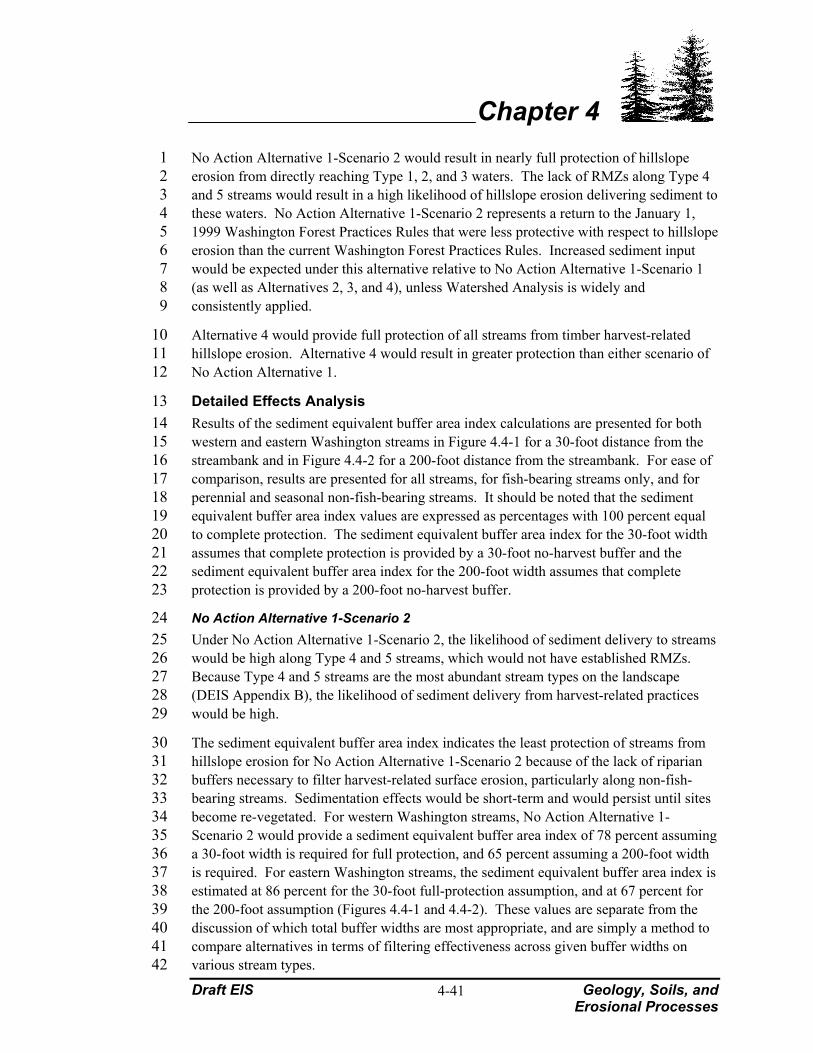
In addition to displaying the covered lands, Figure 3-1 displays the 12 analysis regions. 13 These analysis regions are used as the basis for describing some of the regional aspects of 14 the environmental effects in this chapter and Chapter 5 (Cumulative Effects). 15
4.1.2 Review of the Alternatives 16 This subsection is included to provide the reader with a short review of the alternatives, 17 immediately prior to reading the effects analyses. This page can be marked, and the short 18 descriptions can be referred to while reading Chapters 4 and 5. However, the reader 19 should refer to Chapter 2, subsection 2.3 (Alternatives Analyzed in Detail) for detailed 20 descriptions. 21
This EIS analyzes a No-Action Alternative and three action alternatives (Chapter 2, 22 Alternatives). The action alternatives are identified as Alternatives 2, 3, and 4, and the 23 No-Action Alternative is identified as No Action Alternative 1, which has two scenarios. 24 A summary description of each of these No-Action scenarios, along with a summary 25 description of each action alternative is provided below to assist the reader. 26
4.1.2.1 No-Action Alternative (No Action Alternative 1) 27 Under this alternative, no Incidental Take Permits (ITPs) or take authorization under any 28 Endangered Species Act (ESA) Section 4(d) rules would be issued. This lack of action 29 would affect the Forest Practices Regulatory Program in a way that is difficult to predict, 30 and a range of outcomes could result. Therefore, two scenarios, which represent the 31 endpoints of the reasonable range of possible outcomes for the Forest Practices 32 Regulatory Program, have been defined (Chapter 2, Alternatives) to represent the No-33 Action Alternative (No Action Alternative 1). Endpoints for this range of outcomes are 34 defined in Chapter 2 and referred to as No Action Alternative 1-Scenario 1 and No 35 Action Alternative 1-Scenario 2. The effects of No Action are displayed for both of these 36 endpoints in the following subsections, but the actual outcome and the actual effects of 37 No Action on the individual resources are likely to fall somewhere in-between these two 38 scenarios. 39
Introduction Draft EIS
4-4
Chapter 4 No Action Alternative 1-Scenario 1 1 Under No Action Alternative 1-Scenario 1, no incidental take would be authorized, and 2 the current rules (which are based on the Forests and Fish Report [FFR] and became 3 effective in July 2001) would remain in effect until altered through the adaptive 4 management program. However, the amount of collaboration and participation among 5 Forests and Fish stakeholders in adaptive management, associated monitoring, and other 6 program elements that depend partly on landowner support and voluntary participation, 7 would be reduced from the status quo. As a result, there would be less public funding for 8 these non-regulatory elements, and the ability to modify the rules over time, based on 9 scientific research, would also be reduced. 10
No Action Alternative 1-Senario 2 11 Again, under No Action Alternative 1-Scenario 2, no ITP would be authorized, and the 12 current rules (which are based on the FFR and became effective in July 2001) would 13 remain in effect, initially. However, the Washington State Legislature would likely direct 14 the Washington Forest Practices Board to repeal the current State rules and re-adopt the 15 less-restrictive rules that were in effect on January 1, 1999. If this were to occur, there 16 would be less stakeholder participation and support of adaptive management, associated 17 monitoring, and other program elements that depend partly on landowner support and 18 voluntary participation as well as substantial reductions in public funding. 19
4.1.2.2 Alternative 2 20 Under Alternative 2, the Services would issue ITPs to the State of Washington, based on 21 implementation of the proposed statewide Forest Practices Habitat Conservation Plan 22 (FPHCP). This FPHCP incorporates the current Washington Forest Practices Rules 23 (which are based on the FFR and became effective in July 2001). The ITPs would be 24 valid for a term of 50 years. Because of greater regulatory certainty, stakeholder support 25 and participation, public funding for adaptive management, associated monitoring, and 26 other program elements that depend on landowner support and voluntary participation 27 would be expected to continue at present levels, maintaining high effectiveness. 28
4.1.2.3 Alternative 3 29 Under Alternative 3, the Services would not issue ITPs, but NMFS would issue findings 30 under its existing ESA Section 4(d) rule that would limit the application of the 31 prohibition against take so that it did not apply to forest practice activities in Washington. 32 USFWS would adopt a new Section 4(d) rule for bull trout (the USFWS has not, as of 33 yet, initiated any such rule-making, which is subject to public comment). As a result, the 34 take of species, currently listed as threatened (except for the Snake River races - See 35 subsection 2.3.3.1, Alternative 3, General Description), would be authorized based on 36 continued implementation of the current Washington Forest Practices Rules (which are 37 based on the FFR and became effective in July 2001). Take authorization under this 38 alternative would not apply to endangered species or to species that could be listed as 39 threatened in the future. It would not have specific term duration and could be 40 terminated. This alternative would provide landowners with more certainty than under 41 No Action Alternative 1 (but with less certainty than under Alternative 2). Therefore, the 42
Draft EIS Introduction
4-5
Chapter 4 level of stakeholder support and participation and public funding for adaptive 1 management, associated monitoring, and other program elements requiring such support 2 would likely be higher than under No Action Alternative 1 (either scenario) (but lower 3 than under Alternative 2). 4
4.1.2.4 Alternative 4 5 Under Alternative 4, the Services would issue ITPs to the State of Washington, based on 6 implementation of a statewide Forest Practices HCP. This HCP would incorporate a set 7 of Washington Forest Practices Rules that are more protective of aquatic resources but 8 more restrictive to landowners than the current rules (which are based on the FFR and 9 became effective in July 2001). The ITPs would be valid for a term of 50 years. 10 Alternative 4 would require action by the State Legislature or a court order to initiate 11 additional rule-making by the Washington Forest Practices Board to increase protective 12 measures in the rules. Because landowners would consider that the rules under 13 Alternative 4 are over-protective, there would likely be substantially less stakeholder 14 support and participation and public funding for adaptive management, associated 15 monitoring, and other program elements. Under this Alternative, however, the adaptive 16 management program would be under the direction of the Washington Forest Practices 17 Board and would be less dependent on landowner support, voluntary participation, and 18 public funding to produce outcomes. Based upon the assumption that Alternative 4 19 provides more conservative rules, there likely would be less emphasis on the need for 20 adaptive management under this alternative. The reader should note that much of the 21 discussion about Alternative 4, in Chapter 4, focuses on the benefits to aquatic resources 22 resulting from more protective Forest Practices Rules under this alternative. However, 23 the potential for landowners to convert their forestlands to other uses, due to the 24 economic impacts of more protective rules, may reduce the beneficial effects to aquatic 25 resources. 26
4.1.2.5 Alternative Groupings 27 In the detailed effects analysis of biological and physical processes as well as social and 28 economic issues, distinctions among the alternatives emerge primarily because of two 29 factors: First is the regulatory program associated with an alternative. Second is the 30 effectiveness over time of the adaptive management program to improve regulations 31 under each alternative. While other attributes also create distinctions among the 32 alternatives, they are often divided into three groupings for ease of comparison in the 33 following analysis. No Action Alternative 1-Scenario 2 is generally analyzed separately 34 because it would result in the January 1, 1999 Washington Forest Practices Rules being 35 implemented. Alternative 4 is also analyzed independently because it would result in a 36 distinct set of more-restrictive rules. 37
In contrast, No Action Alternative 1-Scenario 1, Alternative 2, and Alternative 3 each 38 initially continue current Washington Forest Practices Rules. The distinction in these 39 alternatives lies, therefore, not in the initial regulations, but in the differing effect upon 40 those initial regulations that would occur over time as a result of the adaptive 41 management program. Predicting precisely this effect over time – Which biological 42
Introduction Draft EIS
4-6
Chapter 4 processes will be affected and to what degree? Which regulatory prescriptions will be 1 improved and to what degree? What will be the pace of regulatory improvement? – is 2 impossible. Much will depend on the results of research and monitoring projects within 3 the program itself. Nevertheless, it is possible to predict the general effectiveness of the 4 adaptive management program under each alternative based on the amount of 5 participation and support it receives from stakeholders, as well as likely State and Federal 6 funding. 7
To facilitate the analysis of the alternatives, this chapter will first describe the expected 8 effectiveness of the adaptive management program under each alternative and use three 9 examples to illustrate how different resource effects might emerge over time. Following 10 the discussion of the adaptive management program, the chapter will analyze the initial 11 regulatory program associated with the three groupings of alternatives. The reader then 12 can estimate how the adaptive management program would affect resources under each 13 alternative over time. 14
4.1.3 Available Information 15 Less than complete knowledge exists about many of the resource conditions and their 16 relationships with watershed input processes and forest practices. Physical and 17 ecological relationships associated with riparian management in forested landscapes 18 represent a complex and evolving science. In developing the environmental effects 19 sections of this EIS, the analysis team examined the available data and knowledge about 20 relationships used to estimate the effects of the alternatives. The data and level of 21 analysis used were commensurate with the importance of possible effects. Much of the 22 analysis was based on the geographic information system (GIS) databases of Washington 23 DNR and other agencies, using the most current databases available. 24
When encountering an information gap, the analysis team generally either collected the 25 information or developed the information through modeling. In some cases, however, the 26 effort required to obtain the information was prohibitively expensive or required too long 27 a period of time, relative to the value of the information to be obtained. In these cases, 28 the team concluded that the missing information would have added precision to estimates 29 or better specified a relationship; however, they concluded that the basic data and central 30 relationships were sufficiently well established in the respective sciences that the new 31 information would be very unlikely to change conclusions. Thus, the new information 32 would have added precision, but was not considered necessary to provide adequate 33 information for the decision-makers to make a reasoned choice among the alternatives. 34
4.1.4 Evaluation Criteria and Effects Evaluations 35 Evaluation criteria for resource effects are defined for each of the resource topic areas 36 within their individual subsections in this chapter. The criteria are briefly described 37 immediately before the detailed discussion of environmental effects for each resource 38 topic. 39
Draft EIS Introduction
4-7
Chapter 4 The scientists who conducted the analysis for this EIS based the effects analysis on best 1 professional judgment after weighing all of the quantitative and qualitative evaluation 2 criteria that were developed, as well as their review of the scientific literature. They also 3 considered the fact that each alternative incorporates a level of effectiveness for the 4 associated adaptive management program, allowing for change in the rules over time 5 based on feedback from research and monitoring activities. The efficiency and time-lag 6 involved for each adaptive management program was also evaluated. 7
Finally, the issue of uncertainty was considered. Because lack of information sometimes 8 existed to make definitive statements regarding effects, some uncertainty is associated 9 with each effects analysis. In a few cases, the amount of uncertainty associated with the 10 analysis is quite high; in these cases, the high uncertainty is noted along with a 11 description of the expected effects. Further, in a few cases the amount of uncertainty will 12 likely change over time; this type of uncertainty is also noted and the potential effects 13 described. 14
As described in Chapter 2, the FPHCP and associated ITP have a proposed permit 15 duration of 50 years. Consequently, the effects analysis in the EIS generally considers 16 “long term” to mean approximately a 50-year period, but in some circumstances could be 17 longer. Given the definition of “long-term,” a “short-term” period is considered to be 18 less than 10 years. 19
4.1.5 Adaptive Management 20 Adaptive management is often used in habitat conservation planning as a means of 21 addressing scientific uncertainty regarding the biological requirements of covered species 22 and/or the cause-and-effect relationships between proposed management actions and 23 those species. The primary benefit of incorporating adaptive management in 24 conservation plans is to provide a mechanism for changing management prescriptions 25 necessary to meet the goals, objectives, and targets of the plan and to ensure the adequate 26 protection of covered species. The alternatives presented in Chapter 2 of this DEIS 27 describe differing levels of collaboration and support for the adaptive management 28 program developed within the FFR and, in the case of Alternative 4, describe a non-FFR 29 adaptive management program that operates without the requirement of collaboration 30 embodied in the Timber, Fish, and Wildlife (TFW) Agreement and the FFR. As 31 described in Chapter 2, differing levels of collaboration and support for the adaptive 32 management program would have implications on its effectiveness in the protection of 33 covered species and their habitats for the other alternatives (Table 4.1-1). 34
Collaboration and support for adaptive management manifests itself in a wide variety of 35 ways, all of which have implications for its effectiveness. Collaborating interests 36 establish and pursue joint priorities through the adaptive management program. 37 Landowners identify and contribute forest sites for both short term and long term 38 research. Access to private lands is provided to monitoring crews. Scientific expertise is 39 contributed without reimbursement. Peer review among State, private, Federal, and tribal 40 biologists increases and maintains the credibility and integrity of ongoing research and 41 new study designs. The coalition of collaborators effectively advocates for State, Federal, 42
43
Introduction Draft EIS
4-8
Chapter 4
Table 4.1-1. Differences Between the Alternatives in the Effectiveness of Their 1 Adaptive Management Research and Monitoring Programs in Meeting 2 Resource Performance Targets and Differences in Species Coverage by 3 Federal Assurances (ITPs or ESA Section 4(d) Take Authorization). 4
DEIS Alternative Initial Forest Practices
Prescriptions
Effectiveness of Adaptive Management Research
and Monitoring Program in Meeting Resource Performance Targets
Species Coverage by Federal Assurances
No Action Alt. 1-Scenario 2
Rules in Effect on January 1, 1999 Lowest None
No Action Alt. 1-Scenario 1
Current Washington Forest Practices Rules Low None
Alternative 2 Current Washington Forest Practices Rules High Aquatic Species
(ITPs)
Alternative 3 Current Washington Forest Practices Rules Moderate
Threatened Species Covered by ESA Section 4(d)
Alternative 4 More Protective Forest Practices Rules Non-FFR (low) Aquatic Species
(ITPs)
and private funding of research and monitoring activities. Funding, in turn, improves the 5 amount, pace, and rigor of scientific investigations conducted under the adaptive 6 management program. Finally, maintenance of the collaboration ensures timely 7 consideration of its recommendations by the Washington Forest Practices Board. 8
A policy on adaptive management consistent with FFR has been adopted in regulation by 9 the Washington Forest Practices Board to further the purposes of the Forest Practices Act 10 (Washington Administrative Code [WAC] 222-12-045). It is designed to rely on the 11 collaboration and support embedded in FFR to modify the regulations and their 12 application by ensuring that any modification be based on cooperative research, 13 monitoring and evaluation (Chapter 2, Alternatives). Because of this reliance, varying 14 degrees of effectiveness in the adaptive management program will result in differing rates 15 of improvement in the Washington Forest Practices Rules over time. In addition, each 16 alternative has a different level of uncertainty associated with its degree of effectiveness 17 at protecting covered species and their habitats. Therefore, adaptive management may be 18 a more important component for an alternative with more uncertainty versus an 19 alternative with less uncertainty. For example, some of the prescriptions in No Action 20 Alternative 1-Scenario 2 have high levels of uncertainty. Thus, a robust and 21 comprehensive adaptive management program would be critical to ensuring prescriptions 22 are improved through research and monitoring. 23
The regulatory prescriptions under No Action Alternative 1-Scenario 1, Alternative 2, 24 and Alternative 3 are more restrictive than No Action Alternative 1-Scenario 2, and have 25 less uncertainly associated with their effectiveness. Still, some uncertainty exists. Thus, 26 adaptive management is important, although probably less so than with No Action 27
Draft EIS Introduction
4-9
Chapter 4 Alternative 1-Scenario 2. Although the initial regulatory program under No Action 1 Alternative 1-Scenario 1, Alternative 2, and Alternative 3 are the same (i.e., the existing 2 FFR-derived rules), the differences in the effectiveness of the adaptive management 3 program, and the resulting effects over time on improvements in the rules by the 4 Washington Forest Practices Board, distinguish these alternatives from each other 5 (Figure 4.1-1). 6
Alternative 4 has the most restrictive protection measures and therefore the least 7 uncertainty associated with its effectiveness. Because the regulatory program under 8 Alternative 4 presents fewer scientific uncertainties at the outset, there would be reduced 9 resource uncertainties for the adaptive management program under Alternative 4 to 10 address initially. However, uncertainty may increase over time as a consequence of 11 actions likely to result from the more restrictive Alternative 4 (e.g., extensive, no-harvest 12 buffers). Likely outcomes would include: 1) an increase in the rate of forestland 13 conversion, particularly in areas around Puget Sound, 2) an increased incidence of forest 14 health problems such as insect and disease outbreaks, and 3) an increase in the likelihood 15 of wildfire. The adaptive management program under Alternative 4 would be solely 16 dependent upon State funding and directed by the Washington Forest Practices Board 17 with no collaborative, consensus-based policy committee to serve in an advisory 18 capacity. 19
This subsection outlines the differences in the adaptive management processes among 20 alternatives. Because those differences are largely qualitative, it is not possible to 21 accurately predict how or when those differences would manifest themselves in future 22 specific changes to rules or future effects on resource values. However, examples can 23 illustrate how the differences in the adaptive management program would lead to 24 differing effects among these alternatives over time. 25
4.1.5.1 Evaluation Criteria 26 The evaluation of adaptive management is based on its effectiveness as a result of the 27 degree of program support likely provided under each alternative. Support is measured 28 qualitatively in terms of expected participation and collaboration by stakeholders and 29 expected future funding (See discussion above). The evaluation also uses examples from 30 the current adaptive management program research and monitoring topics to describe the 31 implications of varying levels of program support in terms of habitat effects. That is, 32 given different levels of program support, how might habitat conditions for fish and 33 target amphibians be affected? The examples have been taken from Schedule L-1 of the 34 FFR (FPHCP Appendix B). Schedule L-1 lists research and monitoring priorities that are 35 designed to address the greatest scientific uncertainties surrounding the recommended 36 FFR protection measures (which are now included in the Washington Forest Practices 37 Rules). Schedule L-1 serves as the basis for research and monitoring project 38 development. The results of research and monitoring efforts will allow policymakers to 39 determine if it is necessary to modify Washington Forest Practices Rules to achieve 40 established performance goals, resource objectives, and performance targets (for a 41 complete description of adaptive management program performance goals, resource 42 objectives, and performance targets, see Chapter 2, Alternatives, of this document). 43
Introduction Draft EIS
4-10
Chapter 4 Figure 4.1-1. Comparison of the Effectiveness of Adaptive Management 1
Research and Monitoring Program in Meeting Resource 2 Performance Targets for No Action Alternative1-Scenario 1, 3 Alternative 2, and Alternative 3. 4
5 6
The evaluation of the adaptive management program considers, in the discussion below, 7 three research and monitoring topics from Schedule L-1 to illustrate differences among 8 Alternatives 1, 2, and 3. The three environmental topics considered include temperature, 9 large woody debris (LWD), and sediment. The topics selected represent current high 10 priorities within the Cooperative Monitoring, Evaluation, and Research (CMER) 11 Committee’s effectiveness and validation monitoring program. This program includes 12 projects designed to test the effectiveness of management prescriptions in meeting 13 established performance goals, resource objectives, and performance targets as well as 14 projects designed to validate existing performance targets. 15
In addition to the effectiveness and validation monitoring issues referenced above, the 16 evaluation also considers the effects of the alternatives on three other Adaptive 17 Management research and monitoring programs: extensive monitoring, intensive 18 monitoring, and rule implementation tool development. These three programs are 19
Effe
ctiv
enes
s in
Mee
ting
Res
ourc
e Pe
rfor
man
ce T
arge
ts
Draft EIS Introduction
4-11
Chapter 4 designed to track the status and trends of key environmental elements (extensive 1 monitoring), to evaluate the effectiveness of management prescriptions in preventing 2 cumulative watershed effects (intensive monitoring), and to develop technology-based 3 tools that facilitate implementation of the Washington Forest Practices Rules and the 4 Forest Practices Regulatory Program in general (rule implementation tool development). 5
The following paragraphs describe the level of adaptive management program support 6 likely provided under each alternative and the expected effects on habitat conditions. 7
4.1.5.2 Evaluation of Alternatives 8 Overview of Effects 9 No Action Alternative 1-Scenario 1 10 Under No Action Alternative 1-Scenario 1, the adaptive management program would 11 follow its current format and structure (WAC 222-12-045; subsection 2.3.2.2, 12 Washington Forest Practices Rules and Program – Specific Description). However, the 13 effectiveness of the program would likely be low (although slightly higher than under No 14 Action Alternative 1-Scenario 2) as a result of not receiving the anticipated regulatory 15 certainty provided by ESA take authorization. This reduction would be in the form of 16 decreased participation by stakeholders from status quo, particularly commercial timber 17 landowners to whom the regulatory certainty is a priority, and a resulting reduction in 18 contributed resources and funding for implementation. Funding levels affect the amount, 19 pace, and rigor of adaptive management research projects. 20
Currently, CMER has high priority research and monitoring projects identified, and work 21 is underway in several areas (FPHCP Appendix H). Under No Action Alternative 1-22 Scenario 1, funding at levels below projections would cause a re-prioritization of research 23 and monitoring. Projects would probably be delayed or not conducted as a result of less 24 participation and less funding. A reasonable assumption is that only the highest priority 25 effectiveness and validation projects and/or rule implementation tool projects would 26 proceed, and the timeline for completion would be extended. Also, it is likely that little if 27 any extensive and intensive monitoring would be conducted under this alternative. 28
Relative to No Action Alternative 1-Scenario 2, the adaptive management program under 29 No Action Alternative 1-Scenario 1 is expected to have a slightly higher level of 30 effectiveness because of a moderate amount of stakeholder participation and support (i.e., 31 by those not relying on Federal assurances to provide regulatory certainty). Commercial 32 timber landowners are not assumed to be a part of the collaboration under No Action 33 Alternative 1-Scenario 1 because of the lack of the anticipated regulatory certainty 34 provided by Federal assurances. Landowner contributions of technical expertise, forest 35 sites for research, access, and support for funding could not be assumed. 36
No Action Alternative 1-Scenario 2 37 Under No Action Alternative 1-Scenario 2, the adaptive management program would be 38 required to follow the format that was in the rules in effect on January 1, 1999. 39 Regulations at that time required DNR to report to the Washington Forest Practices 40 Board on opportunities to modify the regulations when baseline data, monitoring, 41
Introduction Draft EIS
4-12
Chapter 4 evaluation or the use of interdisciplinary teams showed that such adaptive management 1 would better meet the purposes and policies of the Forest Practices Act. 2
Although the same stakeholders that had embarked upon the FFR effort by 1999 would 3 be involved under No Action Alternative 1-Scenario 2, the level of collaboration and 4 support under this scenario is expected to be less than that found under No Action 5 Alternative 1-Scenario 1. This scenario assumes that: 1) federal assurances are not 6 provided, and 2) that the regulations “roll back” to those in effect on January 1, 1999. As 7 a result, neither landowners nor public resource advocates would have gained benefits 8 anticipated through FFR. Even though still required by the rules, support for the adaptive 9 management program would be limited by the collaborators. Advocacy for public 10 funding of collaborative adaptive management would be minimal. In addition, the pre-11 1999 adaptive management program included much less specific statutory and regulatory 12 direction about the purpose of the program. It is reasonable to assume that the program 13 would suffer from that lack of direction, and agreement would be more difficult to reach 14 on how to spend very limited resources, compared with current conditions. 15
Alternative 2 16 Under Alternative 2, the adaptive management program would continue to follow its 17 current format and structure (WAC 222-12-045; subsection 2.3.2.2, Washington Forest 18 Practices Rules and Program – Specific Description). Receiving ESA take authorization 19 through Section 10 of the ESA would provide the full extent of the regulatory certainty 20 anticipated by FFR collaborators. As a result, Alternative 2 anticipates robust 21 participation and support for the adaptive management program by collaborators, thereby 22 achieving the full potential of its effectiveness. Under this alternative, it is expected that 23 the program would continue to receive funding at anticipated levels and address scientific 24 uncertainties at the anticipated pace and with anticipated rigor (FPHCP Appendix H). 25
Effectiveness of the adaptive management program under this alternative would be 26 higher than under No Action Alternative 1-Scenario 1and substantially higher than under 27 No Action Alternative 1-Scenario 2. Effectiveness would be the highest relative to all 28 other alternatives. 29
Alternative 3 30 Under Alternative 3, the adaptive management program would continue to follow its 31 current format and structure (WAC 222-12-045; subsection 2.3.2.2, Washington Forest 32 Practices Rules and Program – Specific Description). However, the regulatory stability 33 afforded by ESA Section 4(d) coverage is only related to species addressed in the 4(d) 34 rules, and coverage can be modified by the Services through their rule-making authority. 35 As a result, participation and support by those relying on regulatory certainty would be 36 moderate compared to No Action Alternative 1-Scenario 1 (where effectiveness would be 37 “low”) and No Action Alternative 1-Scenario 2 (where effectiveness would be the 38 “lowest”). A reasonable assumption would be that several more effectiveness and 39 validation projects and/or rule tool projects (i.e., projects that facilitate implementation of 40 the rules) might be funded than under No Action Alternative 1-Scenario 1 (directly 41 related to only those few species covered by the 4(d) rule), or that an intensive 42
Draft EIS Introduction
4-13
Chapter 4 monitoring project could be done under Alternative 3 that could not be done under No 1 Action Alternative 1-Scenario 1. Again, the timelines for accomplishing these projects 2 would likely be longer than under Alternative 2 due to less funding and fewer people 3 willing to participate. 4
Alternative 4 5 Under Alternative 4, the adaptive management program would be managed directly by 6 the Washington Forest Practices Board with no input from the collaborative, consensus-7 based TFW/FFR Policy Group that exists under No Action Alternative 1-Scenario 1. The 8 Washington Forest Practices Board would take direct control over all effectiveness and 9 validation monitoring and determine the need for any research projects relevant to forest 10 practices. The DNR, on behalf of the Washington Forest Practices Board, would either 11 conduct or contract for the research dependent upon available funding. In the absence of 12 the TFW/FFR Policy Group, a new stakeholder advisory committee would be established 13 that does not work on a consensus basis and whose membership is approved by the 14 Washington Forest Practices Board. Proposals for changes to the rules that are supported 15 by a simple majority, and even a minority, of the advisory committee may be brought 16 before the Washington Forest Practices Board for review and decision. 17
Because Alternative 4 would implement a set of management prescriptions that are not 18 consistent with the recommendations of the FFR, this alternative would effectively negate 19 the FFR and the current Forest Practices Regulatory Program. This would result in a 20 decrease in public funding for implementation of the FFR and a decrease in the 21 collaboration and participation among stakeholders, particularly landowner participation, 22 in the adaptive management program. 23
Alternative 4 is expected to result in a low level of adaptive management program 24 support, although that support is not necessary under this alternative for implementation 25 of the program. This is because the adaptive management program under this alternative 26 is directed by the Washington Forest Practices Board. The effectiveness of the adaptive 27 management program is expected to be low because research priorities are not currently 28 established, long-term funding sources unknown, and outcomes (in terms of 29 improvements in regulations) uncertain. Further, under Alternative 4 it is unlikely that 30 stakeholders would reach consensus before the Washington Forest Practices Board on 31 priorities, funding, or other attributes of the program. 32
It should be noted that under Alternative 4 there is less biological uncertainty associated 33 with the effectiveness of the protection measures initially and, therefore, less need for an 34 adaptive management program, regardless of its effectiveness. However, the level of 35 uncertainty would be expected to increase over time as a result of implementing the more 36 restrictive protection measures. The results would likely include an increase in the rate of 37 forestland conversion, an increase in the incidence of forest health problems, and an 38 increased in the likelihood of wildfire. Such consequences would be expected to offset 39 some of the resource benefits associated with the more restrictive protection measures. 40
Introduction Draft EIS
4-14
Chapter 4 Detailed Effects Analysis 1 The varying levels of support for the adaptive management program described above 2 have implications for the protection of fish and target amphibians, and for doing so at the 3 least possible economic cost. The primary purpose of any adaptive management program 4 is to provide credible, scientifically sound information to facilitate rule changes to meet 5 established goals, objectives, and targets. Under the adaptive management program 6 included in the No Action Alternative 1, Alternative 2 and Alternative 3, adequate 7 program support is essential to ensure an effective adaptive management program and, 8 therefore, proper resource protection. Alternative 4 does not require the same level of 9 participation and support to function, but may lack priority-setting and funding necessary 10 to assess regulatory prescription effectiveness where forestland conversion, forest health, 11 and wildfire issues may pose a problem. 12
The information generated through adaptive management typically describes the degree 13 to which management prescriptions affect a particular environmental element. For 14 example, a monitoring project may evaluate the effect of Riparian Management Zone 15 (RMZ) prescriptions on stream water temperatures. The environmental element (in this 16 case temperature), in turn affects the quality and/or quantity of habitat for a particular 17 species (e.g., bull trout). In the absence of adaptive management, it is difficult to 18 accurately assess the degree to which management prescriptions maintain or alter 19 environmental elements which, in turn, affect covered species. 20
This subsection describes the expected effects of the alternatives on several key 21 environmental elements from an adaptive management standpoint. The evaluation 22 focuses on current research and monitoring priorities related to temperature, LWD, and 23 sediment to illustrate by example how varying levels of support for an adaptive 24 management program may affect these environmental elements, and ultimately, habitat 25 for fish and target amphibians. Later in this chapter, the reader may use these examples 26 to assess how varying levels of support and, therefore, effectiveness of the adaptive 27 management program would affect other resource attributes over time. 28
Temperature 29 Schedule L-1 of the FFR includes 11 different research and monitoring issues related to 30 water temperature (FPHCP Appendix B). The issues include both effectiveness and 31 validation monitoring topics. One effectiveness monitoring topic is listed as: 32
Test the cumulative effect (at basin scale) of the westside Type N smart buffers in meeting 33 temperature targets (page 124, FFR). 34
“Smart buffers” refers to the initial Type Np buffering strategy described under No 35 Action Alternative 1-Scenario 1 and Alternatives 2 and 3 where RMZs are required along 36 50 percent of the length of Type Np stream reaches and including all sensitive sites. 37 “Temperature targets” refers to the State water quality standards for water temperature. 38 This Schedule L-1 issue, referred to as the “Type Np Buffer Effectiveness” project, will 39 be used to describe how varying levels of adaptive management program effectiveness 40
Draft EIS Introduction
4-15
Chapter 4 under the different alternatives may affect water temperature and habitat conditions for 1 fish and target amphibians. 2
Implementation of the Type Np Buffer Effectiveness project would provide information 3 regarding the degree to which the Type Np buffer strategy affects water temperatures both 4 within Type Np stream reaches and at the upstream end of the fish-bearing network. The 5 results would have important implications for the protection of water quality and fish 6 (particularly bull trout) and amphibian habitat. If the results affirm the effectiveness of 7 the initial buffer strategy, it is unlikely any modifications to the rules would be necessary. 8 If, however, the results indicate the buffer strategy is ineffective or only partially 9 effective, policymakers would at the conclusion of the study have the information 10 necessary to modify the rules to better ensure water temperature standards were met. In 11 this instance, scientists responsible for the monitoring could recommend the most 12 effective way to modify the management prescriptions to meet temperature targets. 13 Finally, if the study was not implemented at all, policy makers would gain no information 14 that would help resolve uncertainties and address any adverse effects. In fact, policy 15 makers may not be aware that adverse impacts were occurring. 16
Under No Action Alternative 1-Scenario 1, improvements to the rules rely on the 17 collaborative adaptive management program adopted by the Washington Forest Practices 18 Board. Because the effectiveness of the adaptive management program in this scenario is 19 low (See discussion above), improvements would be delayed and uncertain. The 20 potential exists under Scenario 1 that the project would not be funded or pursued at all. If 21 the buffer strategy is ineffective or only partially effective, resource impacts could be 22 significant if the protection measures are ineffective. Policymakers would not gain for 23 some time, if at all, the information with which to improve the regulations. 24
The outcome under No Action Alternative 1-Scenario 2 would be similar to that in 25 Scenario 1. However, even greater resource impact is possible because the buffering 26 strategy for Type 4 streams under the January 1, 1999 Washington Forest Practices Rules 27 was less protective than the current rules, and the adaptive management program under 28 this alternative is degraded further from that in Scenario 1. Under No Action 29 Alternative 1-Scenario 2, the Type Np Buffer Effectiveness project would need to be re-30 defined given the different buffering strategies of the rules. Further, it is possible that the 31 research would not be conducted at all because under this scenario the adaptive 32 management program is without support as a result of the absence of stakeholder 33 participation, support, and funding. 34
Under Alternative 2, adaptive management would receive a high level of support, both in 35 terms of public funding and stakeholder participation as a result of the regulatory 36 certainty provided by federal assurances. It is highly likely that the Type Np Buffer 37 Effectiveness project would be pursued as a high priority within the adaptive 38 management program, even as other priority research projects derived from Schedule L-1 39 are pursued (FPHCP Appendix B, Schedule L-1; FPHCP Appendix H). 40
In cases where monitoring results indicated the buffer strategy was ineffective or partially 41 effective, Alternative 2 would result in substantially fewer temperature impacts to 42
Introduction Draft EIS
4-16
Chapter 4 covered species than under either scenario of No Action Alternative 1 because: 1 1) adequate program funding and participation would result in timely project 2 implementation, 2) timely project implementation would produce results in the shortest 3 time frame, 3) adequate program support would ensure a comprehensive project scope 4 (i.e., a broad distribution of study sites across space and time), and 4) the collaborative 5 nature of the project would ensure prompt and serious consideration by the Washington 6 Forest Practices Board of recommendations of TFW/FFR Policy Group. 7
Under Alternative 3, the adaptive management program would be required to maintain 8 the format and structure as adopted by the Washington Forest Practices Board, the same 9 as under both scenarios of No Action Alternative 1. The adaptive management program 10 would have adequate stakeholder support as a result of the level of regulatory certainty 11 offered under the ESA Section 4(d) rules. Program funding and participation under 12 Alternative 3 would be moderate, resulting in the adaptive management program 13 achieving moderate effectiveness in the amount, pace, and rigor of research projects 14 relative to No Action Alternative 1. In cases where the initial Type Np buffer strategy 15 was ineffective or only partially effective in meeting temperature targets, the adaptive 16 management program under Alternative 3 would provide feedback to decision-makers 17 more-promptly than under either scenario in No Action Alternative 1 (but delayed 18 relative to Alternative 2). 19
The scope of a project addressing temperature targets under Alternative 3 would be 20 superior to the scope of efforts under No Action Alternative 1. However, it should be 21 noted that the scope would be limited to effects on threatened species covered by the 22 specific ESA Section 4(d) rules, likely not including amphibians or fish species not 23 currently listed under the ESA and those listed species not covered by a Section 4(d) rule. 24 As a result, the scope of a project would also be limited relative to the scope likely 25 available under Alternative 2. 26
Under Alternative 4, adaptive management would not rely on the support of stakeholders, 27 but rather be directed by the Washington Forest Practices Board subject to available State 28 funds. Project implementation and scope would be determined by the Washington Forest 29 Practices Board, also subject to available financial resources. Given the higher levels of 30 protection for Type Np waters under Alternative 4, the likelihood of negative temperature 31 effects is lower compared to either scenario of No Action Alternative 1. This somewhat 32 mitigates the potential effects relative to No Action Alternative 1 that could occur if the 33 Washington Forest Practices Board did not address the uncertainty through adaptive 34 management, or did so slowly. The priority for such a project may increase over time as 35 the effects of increased forestland conversion, forest health issues, and wildfire affect 36 broad, landscape-level resource protection in some watersheds. Lack of funding or the 37 inability to establish priorities for adaptive management could affect the Washington 38 Forest Practices Board’s response to such emerging issues. 39
The effects of the alternatives on a single effectiveness monitoring project have been 40 described above. In addition to effectiveness monitoring, the adaptive management 41 program also includes temperature-related extensive and intensive monitoring projects 42
Draft EIS Introduction
4-17
Chapter 4 and projects that involve the development of temperature-related rule implementation 1 tools. The effects of the alternatives on these adaptive management sub-programs are 2 expected to follow the same trends as described for effectiveness monitoring: Under No 3 Action Alternative 1-Scenario 1, projects would likely be delayed, lack scope, and lack 4 rigor relative to status quo and other alternatives. Under No Action Alternative 1-5 Scenario 2, it is likely that the projects simply would not be pursued. Projects are likely 6 to be funded and implemented in a timely manner under Alternative 2, particularly 7 compared to both scenarios under No Action Alternative 1. Under Alternative 3, projects 8 are more likely to be implemented than under No Action Alternative 1, but less likely 9 than under Alternative 2. Under Alternative 4, project implementation would be subject 10 to the priority setting of the Washington Forest Practices Board and available funding. 11 While the need for a robust and comprehensive adaptive management program may be 12 less at the outset due to less resource protection uncertainty, that need likely increases 13 over time, and the Washington Forest Practices Board would need to prioritize limited 14 resources to areas of highest uncertainty. The lack of funding under Alternative 4 would 15 likely limit the Washington Forest Practices Board’s ability to respond with a robust and 16 rigorous monitoring program. 17
Large Woody Debris 18 Schedule L-1 of the FFR includes a validation monitoring topic listed as: 19
Validate the Desired Future Condition targets within two years of report (page 126, 20 FFR). 21
The “desired future condition” (DFC) targets refer to the basal area (See Glossary) targets 22 that apply to Type S and F RMZs under No Action Alternative 1-Scenario 1 and 23 Alternatives 2 and 3. This Schedule L-1 issue, referred to as the DFC Validation project, 24 will be used to describe how varying levels of adaptive management program 25 effectiveness under the different alternatives may affect LWD recruitment and habitat 26 conditions for fish and target amphibians. Because there is a level of uncertainty with 27 regard to the accuracy of current RMZ basal area targets, the DFC Validation project 28 would be a high priority within the adaptive management program. 29
Implementation of the DFC Validation project would provide information regarding the 30 degree to which current basal area targets reflect basal areas in natural, unmanaged 31 stands. The results would have implications for LWD recruitment, for fish and 32 amphibian habitat, and potentially for increased economic gain. If the results validate the 33 existing targets, it is unlikely any modifications to the rules would be necessary. If, 34 however, the results indicate the targets are not representative of natural, unmanaged 35 stands, policymakers would have the information necessary to modify the targets. 36 Scientists responsible for monitoring could explain the most effective way to modify 37 management prescriptions to meet performance targets. Finally, if the study was not 38 implemented at all, policy makers would gain no information to would help resolve 39 uncertainties and to address any adverse effects, whether they are related to resources or 40 economics. 41
Introduction Draft EIS
4-18
Chapter 4 The adaptive management program under No Action Alternative 1-Scenario 1 would 1 have a low level of effectiveness relative to other alternatives (although slightly higher 2 than under No Action Alternative 1-Scenario 2). Because the effectiveness of the 3 adaptive management program under this scenario would be low, improvements would 4 be delayed and uncertain. The potential exists under Scenario 1 that the project would 5 not be funded or pursued at all. If, in fact, the basal area targets are incorrect 6 policymakers would not gain for some time, if at all, the information with which to 7 improve the regulations. 8
Because No Action Alternative 1-Scenario 2 does not use basal area targets for riparian 9 management, the DFC Validation project would not be necessary under this scenario. 10 However, some form of monitoring would be necessary to evaluate the effectiveness of 11 the January 1, 1999 Washington Forest Practices Rules RMZ leave tree requirements in 12 providing adequate habitat. Because the RMZ leave tree requirements under this 13 alternative are unlikely to provide adequate LWD recruitment, such monitoring would 14 provide important information for policymakers when considering rule modifications. 15 The low level of support for adaptive management under No Action Alternative 1-16 Scenario 2 would likely delay or limit the scope of any monitoring effort, if one was 17 developed. Because Scenario 2 involves the “roll back” of regulations to those in effect 18 on January 1, 1999 and a less functional adaptive management program, it also presents 19 the highest likelihood for adverse resource effects relative to all alternatives. 20
Under Alternative 2, adaptive management would receive a high level of support, both in 21 terms of public funding and stakeholder participation. It is highly likely under 22 Alternative 2 that the DFC Validation project would be pursued. In cases where 23 monitoring results indicated existing targets were incorrect, this Alternative would result 24 in the fewest adverse habitat impacts among all alternatives, particularly relative to both 25 scenarios in the No Action Alternative 1. This is the case because: 1) adequate program 26 funding and participation would result in relatively rapid project implementation, 27 2) relatively rapid project implementation would produce results in the shortest time 28 frame, 3) adequate program support would ensure a comprehensive project scope (i.e., a 29 broad distribution of study sites across space and time), and 4) the collaborative nature of 30 the adaptive management program would ensure serious and timely consideration of 31 TFW/FFR Policy Group recommendations by the Washington Forest Practices Board. 32
Under Alternative 3, the adaptive management program would be required to maintain 33 the format and structure as adopted by the Washington Forest Practices Board, the same 34 as under No Action Alternative 1-Scenario 1 and Alternative 2. The adaptive 35 management program under Alternative 3 would likely receive moderate stakeholder 36 support as a result of the level of regulatory certainty offered under the ESA Section 4(d) 37 rules. Program funding and participation under Alternative 3 would be moderate, 38 resulting in the adaptive management program achieving moderate effectiveness in the 39 amount, pace, and rigor of research projects relative to No Action Alternative 1. In cases 40 where the basal area targets were found to be incorrect, the adaptive management 41 program under Alternative 3 would provide feedback to decision-makers more-promptly 42 than under either scenario in No Action Alternative 1 (but with a delay in project 43
Draft EIS Introduction
4-19
Chapter 4 implementation relative to status quo or Alternative 2). Alternative 3 includes the 1 potential of delay or a limit on the scope of the project due to funding constraints that are 2 derived from the more-limited support as a result of the more-limited regulatory certainty 3 provided by federal assurances under ESA Section 4(d). If the scope were limited, the 4 potential exists that the forthcoming data would not be persuasive to decision-makers or 5 that it would require a limitation on the applicability of the results. Both outcomes could 6 mean that regulations would be improved relative to the scenarios under the No Action 7 Alternative, but less effectively than under Alternative 2. Adverse resource effects due to 8 insufficient LWD inputs would occur until regulations were improved, but the 9 improvements would occur more rapidly than under No Action Alternative 1. 10
Under Alternative 4, RMZs are treated as no-harvest areas. Therefore, the DFC 11 Validation project may not be necessary. Some form of effectiveness monitoring would 12 be required if the Washington Forest Practices Board elected to evaluate the effectiveness 13 of management prescriptions in providing adequate habitat. However, the greater degree 14 of riparian protection offered by Alternative 4 increases the likelihood that management 15 prescriptions directed at wood recruitment may be effective and may mitigate the need 16 for such monitoring relative to No Action Alternative 1-Scenarios 1 and 2. However, 17 without an adaptive management strategy, it would be difficult to determine whether a 18 no-harvest buffer achieves or exceeds the desired habitat conditions in supplying large 19 wood for recruitment. Also, the economic impact of such buffers would likely lead to 20 increased conversion of forestlands to other uses. Also, no-harvest buffers may increase 21 the incidence of forest health problems and wildfire. The ability of the Washington 22 Forest Practices Board to monitor the effects of these other factors in the future would be 23 limited under Alternative 4. 24
Sediment 25 Schedule L-1 of the FFR includes six different research and monitoring issues related to 26 sediment. The issues include both effectiveness and validation monitoring topics. One 27 effectiveness monitoring topic is listed as: 28
Determine the effectiveness of road maintenance BMPs (best management practices) on 29 a site- and subbasin-scale in meeting road sediment targets (page 127, FFR). 30
This Schedule L-1 issue, referred to as the Roads BMP Effectiveness project, will be used 31 to describe how varying levels of adaptive management program effectiveness under the 32 different alternatives may affect road sediment delivery and habitat conditions for fish 33 and target amphibians over time. 34
Implementation of the Roads BMP Effectiveness project would provide information 35 regarding the degree to which implementation of specific sediment-reduction measures 36 (via road maintenance and abandonment plans [RMAPs]) are effective in meeting 37 established performance targets. The results have important implications for the 38 protection of water quality and fish and amphibian habitat in both non-fish-bearing and 39 fish-bearing waters. If the results affirm the effectiveness of the road BMPs, it is unlikely 40 any modifications to the rules would be necessary. If, however, the results indicate some 41
Introduction Draft EIS
4-20
Chapter 4 or all BMPs are ineffective or only partially effective, policymakers would have the 1 information necessary to modify the rules and Board Manual guidance to better ensure 2 the performance targets were met. Scientists responsible for the monitoring could 3 explain how the management prescriptions could be modified to meet the road sediment 4 targets. It is also possible that the study would not be implemented at all. In such an 5 instance, policy makers would gain no information that would help resolve uncertainties 6 and address any adverse effects. 7
The adaptive management program under No Action Alternative 1-Scenario 1 has a low 8 level of effectiveness relative to other alternatives (although slightly higher than under 9 No Action Alternative 1-Scenario 2). Since the effectiveness of the adaptive 10 management program under this scenario is low, improvements would be delayed and 11 uncertain. The potential exists under Scenario 1 that the project would not be funded or 12 pursued. Resource impacts would be significant if, in fact, the specific sediment-13 reduction efforts are ineffective or only partially effective in providing ecological 14 functions because policymakers would not gain for some time, if at all, the information 15 with which to improve the regulations. 16
The adaptive management program under No Action Alternative 1-Scenario 2 has the 17 lowest effectiveness of all alternatives. The low level of support for adaptive 18 management under No Action Alternative 1-Scenario 2 would likely delay or limit the 19 scope of any effectiveness monitoring effort. There is a high likelihood that the project 20 would not be pursued at all. Because Scenario 2 involves: 1) no federal assurances, 21 2) the likely “roll back” of regulations to those in effect on January 1, 1999, and 3) a less 22 functional adaptive management program, it presents the highest likelihood of adverse 23 resource effects relative to Scenario 1 and all other alternatives. 24
Under Alternative 2, adaptive management would receive a high level of support, both in 25 terms of public funding and stakeholder participation. The likelihood of timely project 26 implementation would be highest under Alternative 2 relative to No Action Alternative 1 27 (and all other alternatives) because this alternative would receive broad financial and 28 stakeholder support compared to the other alternatives. 29
In cases where monitoring results indicated the BMPs were ineffective or partially 30 effective, this Alternative would result in the fewest sediment-related impacts to covered 31 species and their habitat relative to the No Action Alternative 1 and other alternatives 32 because: 1) adequate program funding and participation would result in relatively rapid 33 project implementation, 2) relatively rapid project implementation would produce results 34 in the shortest time frame, 3) adequate program support would ensure a comprehensive 35 project scope (i.e., a broad distribution of study sites across space and time), and 4) the 36 collaborative nature of the adaptive management program would ensure serious and 37 timely consideration of the recommendations by the Washington Forest Practices Board. 38
Under Alternative 3, the adaptive management program is expected to maintain the same 39 format and structure as under both scenarios of No Action Alternative 1 (as adopted by 40 the Washington Forest Practices Board). Alternative 3 would likely receive moderate 41
Draft EIS Introduction
4-21
Chapter 4 stakeholder support as a result of the regulatory certainty offered under the ESA Section 1 4(d) rules over that provided by No Action Alternative 1 (but less than Alternative 2). 2 Program funding and participation under Alternative 3 would be moderate, resulting in 3 the adaptive management program achieving moderate effectiveness. In cases where all 4 or some road BMPs were ineffective or only partially effective in meeting performance 5 targets, the adaptive management program under Alternative 3 would provide feedback to 6 decision-makers more-promptly than under either scenario in No Action Alternative 1 7 (but with a delay in project implementation relative to status quo or Alternative 2). As 8 with the No Action Alternative 1, Alternative 3 includes the possibility that the Road 9 BMP Effectiveness project would not occur at all. Alternative 3 also includes the 10 potential of a limit on the scope of the project due to reduced funding relative to status 11 quo. If such were to occur, it would likely limit the applicability of the results or result in 12 providing data that was insufficient to be persuasive. These outcomes could result in a 13 delay or failure to improve regulations, resulting in resource impacts from on-going 14 sediment-reduction measures that would not meet expectations (if the measures were 15 found by the project to be inadequate). 16
Under Alternative 4, some form of effectiveness monitoring would be required if the 17 Washington Forest Practices Board elected to evaluate the effectiveness of road BMPs in 18 reducing sediment. However, given the accelerated RMAP implementation schedule and 19 the cap on road densities under Alternative 4, the likelihood of sediment effects is lower 20 compared to Scenario 1 of No Action Alternative 1 and significantly lower compared to 21 Scenario 2. This somewhat mitigates the potential effects relative to No Action 22 Alternative 1 that could occur if the Washington Forest Practices Board failed to pursue 23 the uncertainty associated with the BMPs through adaptive management, or did so 24 slowly. However, the economic impact of more restrictive regulations would likely lead 25 to increased conversion of forestlands to other uses. Also, no-harvest buffers may 26 increase the incidence of forest health problems and wildfire. These unintended 27 consequences of Alternative 4 could affect the rate of fine sediment inputs to streams, 28 and the ability of the Washington Forest Practices Board to monitor the effects of these 29 other factors in the future would be limited under Alternative 4. 30
Summary 31 The preceding subsection provided illustrations of potential effects as a result of the 32 various levels of effectiveness in the adaptive management program under each of the 33 alternatives. As shown in Table S-1 in the Summary, this effectiveness would be low for 34 No Action Alternative 1-Scenario 1, lowest for No Action Alternative 1-Scenario 2, high 35 for Alternative 2, and moderate for Alternative 3. The likelihood of resource impacts 36 under Alternative 4 is low at the outset, and therefore the need for a robust and 37 comprehensive adaptive management program is initially reduced. However, unintended 38 consequences of more restrictive protection measures likely increases the likelihood of 39 negative resource impacts over time, and the Washington Forest Practices Board’s ability 40 to respond appropriately would likely be limited due to lack of priorities and secure, 41 long-term funding. The follow subsections of this Chapter focus on an assessment of the 42 effects on various resources of the regulatory provisions of each alternative. Often the 43
Introduction Draft EIS
4-22
Chapter 4 analysis is presented in three groupings of alternatives: No Action Alternative 1-Scenario 1 2 (regulations in effect on January 1, 1999); Alternative 4 (more restrictive regulations); 2 and No Action Alternative 1-Scenario 1, Alternative 2, and Alternative 3 (existing, FFR-3 based regulations). As described above, the effectiveness of the adaptive management 4 program provides further distinctions among these alternatives, particularly among the 5 three alternatives within the grouping based on existing, FFR-based regulations. To 6 avoid repetition, the remainder of this chapter does not restate the potential impact on 7 resource effects over time of various levels of adaptive management effectiveness. 8 Rather, it is suggested that the reviewer continue to consider the previous analysis of 9 adaptive management when assessing the information on resource effects as described in 10 the remainder of this chapter. 11
12
Draft EIS Land Ownership and Use
4-23
Chapter 4
4.2 LAND OWNERSHIP AND USE 1
4.2.1 Introduction 2 The alternatives considered in this EIS would not directly affect land ownership; 3 however, they would modify the level of restrictions on land use to varying degrees. 4 These changes in restrictions may indirectly change land ownership by creating 5 incentives to convert land from forest management to other land uses. Large timber 6 companies have stated that long-term regulatory certainty and stability are also key 7 factors in retaining forestlands. Changing regulations or other potential restrictions have 8 increased the costs and uncertainty attendant upon investments in timber acquisitions and 9 harvest activities (Forests and Fish Report 1999 [FPHCP Appendix B]; NMFS and 10 USFWS 2003; See also individual scoping comment letters). Potentially affected private 11 forestland owners include non-industrial private forests and small forest landowners, who 12 harvest annual average volumes of 2 million board feet or less, as well as large timber 13 companies with extensive land holdings throughout the State. 14
4.2.2 Evaluation Criteria 15 The alternatives being evaluated in this DEIS would directly affect only State, city, 16 county, and private forestlands being managed for timber production in Washington 17 State. No effects on land ownership and use are expected relative to Federal or tribal 18 lands, or on State lands that are not being managed for timber production (e.g., State 19 parks and wildlife areas), or on non-forestlands (e.g., agricultural lands). Therefore, the 20 effects analysis and the evaluation criteria discussed below relate to these State, city, 21 county, and private forestlands. 22
Land use would be directly affected within riparian corridors. Each of the alternatives 23 would restrict land use within these corridors to varying degrees. In addition, riparian 24 area restrictions could indirectly affect uses on adjacent or nearby non-riparian areas that 25 are owned or managed by the same landowner or agency. Therefore, the primary 26 evaluation criteria for potential land use effects are the type of riparian land use 27 restrictions associated with each alternative and the amount of land area affected by the 28 restrictions. 29
Ultimately, the degree of land use restrictions (both amount and type) could result in 30 changes in ownership and conversion to other land uses. Therefore, a second evaluation 31 criterion for land ownership and use is the degree to which the restriction of land uses 32 ultimately affects land ownership and conversion to a land use that is not consistent with 33 forest management. 34
4.2.3 Evaluation of Alternatives 35 The effects of the alternatives on land ownership and use are discussed in this subsection. 36 In reading this discussion, it should be remembered from Chapter 2 (Alternatives) that 37 under the No Action Alternative 1, no ITPs or ESA Section 4(d) take authorization would 38 be issued. However, this lack of action would likely affect the Forest Practices 39
Land Ownership and Use Draft EIS
4-24
Chapter 4 Regulatory Program in a way that is difficult to predict. Therefore, two scenarios, which 1 represent the endpoints of the reasonable range of possible outcomes for the Forest 2 Practices Regulatory Program, have been defined (subsection 2.3.1, No Action 3 Alternative 1) to represent the No-Action Alternative. The effects of No Action are 4 displayed for both of these endpoints in the following subsections, but the actual outcome 5 and the actual effects of No Action on land ownership and use are likely to fall 6 somewhere between these two scenarios. 7
4.2.3.1 Direct Restrictions on Forest Land Use 8 Overview of Effects 9 Total western Washington RMZ area on private, city, and county lands would be 10 approximately 631,000 acres under No Action Alternative 1-Scenario 2; 1,322,000 acres 11 under No Action Alternative 1-Scenario 1, Alternative 2, and Alternative 3; and 12 2,695,000 acres under Alternative 4. These figures represent about 10 percent, 21 13 percent, and 43 percent of all private, city, and county forestlands in western Washington, 14 respectively (Note that State forestlands in western Washington already are subject to an 15 HCP, see subsection 1.1.2, Washington State’s Conservation Plan, footnote 1). 16
In eastern Washington, the total forestland area within RMZs on State and private, city, 17 and county lands would be approximately 196,000 acres under No Action Alternative 1-18 Scenario 2; 374,000 acres under No Action Alternative 1-Scenario 1, Alternative 2, and 19 Alternative 3; and 871,000 acres under Alternative 4. These figures represent about 6 20 percent, 11 percent, and 26 percent of all State, private, city, and county forestlands in 21 eastern Washington, respectively. 22
Effects Analysis 23 The primary direct effect of the alternatives on land ownership and use is the amount of 24 land that is restricted from timber harvest within RMZs. Figures 4.2-1 and 4.2-2 display 25 the estimated amount of land where timber harvest would likely be reduced because of 26 RMZ restrictions under each alternative for western Washington and eastern Washington, 27 respectively (See DEIS Appendix B for a description of the methods used to estimate 28 these acres). State forestlands in western Washington are excluded from these figures 29 because they are covered under an existing Habitat Conservation Plan (Washington DNR 30 1997d). 31
The no-harvest zone (i.e., the most restrictive land use zone) represents the entire RMZ 32 area for Alternative 4 and somewhat less than half of the total RMZ area for the grouping 33 of alternatives, which includes No Action Alternative 1-Scenario 1, Alternative 2, and 34 Alternative 3. Under No Action Alternative 1-Scenario 2, a no-harvest zone is not 35 required but may occur in some instances according to the “shade rule” in Section 1 of 36 the Washington Forest Practices Board Manual (FPHCP Appendix F). 37
38
Draft EIS Land Ownership and Use
4-25
Chapter 4
Figure 4.2-1. Estimated RMZ Areas (acres) on Private Lands1/ in Western 1 Washington2/ by Alternative (note that private lands include city 2 and county-owned lands). 3
1/ Total private forestlands in Western Washington cover approximately 6,289,000 acres. 4 2/ State forestlands in western Washington are excluded from these figures because they are 5
covered under an existing Habitat Conservation Plan (Washington DNR 1997d)). 6 3/ Under No Action Alternative 1-Scenario 2, the rules in effect on January 1, 1999, do not 7
require a no-harvest zone, however, for modeling purposes, a no-harvest zone was estimated to 8 allow for comparison to the other alternatives that do require a no-harvest zone. 9
10
***
Estimated RMZ Areas on Western Washington Private Lands
Alternative 1-Scenario 23/ Alternative 1-Scenario 1, Alternative 2, and Alternative 3
Alternative 4
Land Ownership and Use Draft EIS
4-26
Chapter 4
Figure 4.2-2. Estimated RMZ Areas (acres) on State and Private Lands1/ in 1 Eastern Washington by Alternative (note that private lands include 2 city and county-owned lands). 3
1/ Total private forestlands in eastern Washington cover approximately 3,365,000 acres. 4 2/ Under No Action Alternative 1-Scenario 2, the rules in effect on January 1, 1999, do not 5
require a no-harvest zone, however, for modeling purposes, a no-harvest zone was estimated 6 to allow for comparison to the other alternatives that do require a no-harvest zone. 7
8
**
Estimated RMZ Areas on Eastern Washington Private and State Lands
Alternative 1-Scenario 22/ Alternative 1-Scenario 1, Alternative 2, and Alternative 3
Alternative 4
Draft EIS Land Ownership and Use
4-27
Chapter 4 4.2.3.2 Forestland Conversion 1 Overview of Effects 2 The existing forest practices regulations were adopted “on the assumption that federal 3 assurances . . . will be obtained” by June 30, 2005 (subsection 1.3.2, Washington State 4 Legislative Directive Regarding Federal Assurances). As a result, the existing rate of 5 private forestland conversion is, in part, occurring under a level of expectation that 6 regulatory certainty will be provided by federal assurances (subsection 3.2.4, Forestland 7 Conversion, for a general description of current and historic conversion in Washington) 8 and is considered for purposes of analysis to be status quo. Under No Action Alternative 9 1-Scenario 1, those regulatory assurances would not be forthcoming, and the regulations 10 adopted in anticipation of assurances would still remain in effect. As a result, the rate of 11 conversion under No Action Alternative 1-Scenario 1 would likely increase from status 12 quo. 13
Like Scenario 1, No Action Alternative 1-Scenario 2 includes no federal assurances (and, 14 therefore, no anticipated regulatory certainty), but the Forest Practices Regulatory 15 Program is “rolled back” to the rules in effect on January 1, 1999. This reduction in 16 restrictions on harvest would likely result in an increase in the value of private forestlands 17 for timber production and, therefore, the rate of conversion of private forestlands to other 18 uses would be similar to the status quo, and less than under No Action Alternative 1-19 Scenario 1. 20
The Forest Practices Regulatory Program under Alternative 2 would be the same as No 21 Action Alternative 1-Scenario 1 and more restrictive than No Action Alternative 1 22 Scenario 2. However, Alternative 2 would also provide the greatest degree of regulatory 23 certainty and public funding available for landowner incentive/assistance programs and is 24 consistent with the expectations inherent under the status quo. With confirmation of 25 federal assurances and funding for landowner incentive/assistance programs under 26 Alternative 2, it is likely that conversion rates would drop slightly from the status quo. 27 These conversion rates would be slightly lower than under No Action Alternative 1-28 Scenario 1, but higher than under No Action Alternative 1-Scenario 2. 29
Alternative 3 provides more regulatory certainty than under No Action Alternative 1. As 30 a result, conversion rates under Alternative 3 are anticipated to be lower than under No 31 Action Alternative 1-Scenario 1, even though the initial Forest Practices Regulatory 32 Program under these two alternatives is the same. However, conversion rates under 33 Alternative 3 would be higher than under No Action Alternative 1-Scenario 2 because of 34 the more-restrictive regulations under Alternative 3. 35
Alternative 4 would likely present the highest rate of conversion among all alternatives 36 because its restrictive regulations would significantly reduce anticipated economic return 37 to landowners from timber management, particularly small forest landowners. This is 38 true even though federal assurances are provided under this alternative. 39
Land Ownership and Use Draft EIS
4-28
Chapter 4 Effects Analysis 1 Limitations on land use resulting from RMZ restrictions may affect the rate of conversion 2 of affected forestlands to other uses (subsection 3.2.4, Forestland Conversion, for a 3 general description of current and historic conversion in Washington). Zobrist (2003) 4 conducted 10 case studies of small, non-industrial private forest landowners in western 5 Washington (six in Lewis County and four in Grays Harbor County) under the current 6 Washington Forest Practices Rules, which would be the same initial rules as under No 7 Action Alternative 1-Scenario 1, Alternative 2, and Alternative 3. These case studies 8 were conducted to help better understand the economic impacts of these rules on small 9 landowners and the economic implications of these impacts. One of the implications 10 considered was the possibility that these rules would lead to an increase in the rate of 11 conversion of forestland to other non-forested uses. 12
The results of these case studies indicated that some small landowners could potentially 13 incur substantial economic losses under these alternatives, with the severity of potential 14 impacts varying by landowner. This analysis considered several different harvest 15 scenarios, including no riparian harvest, harvest in the outer zone only, and harvest in 16 both the inner and outer zones, and compared forest and land values under each scenario 17 with the January 1, 1999 Washington Forest Practices Rules, which would be the same as 18 under No Action Alternative 1-Scenario 2. Economic losses were greatest under the no 19 riparian harvest scenario compared to the scenarios that involved partial harvesting in the 20 riparian zone. Harvesting in the outer zone reduced economic losses compared to the no 21 riparian harvest scenario. Harvesting in both the inner and outer zones further reduced 22 economic losses in some of the case studies, but the incremental benefit of harvesting in 23 the inner zone was relatively small (Zobrist 2003). 24
The case study analysis found that the land value for timber management would be 25 completely lost in no-harvest areas, such as the core zone and parts of the inner zone, as 26 these acres could no longer be used for commercial management (Zobrist 2003). Further, 27 if buffer restrictions resulted in a large portion of a given property being taken out of 28 timber production, it could make the entire property unprofitable, because the production 29 base available to cover fixed production costs would be much smaller. Also, buffer 30 restrictions may fragment properties, separating unrestricted areas from one another and 31 making management unfeasible in these areas, as well as those areas within the RMZ 32 (Zobrist 2003). 33
The Forestry Riparian Easement Program, which is part of the current Washington Forest 34 Practices Rules, is designed to mitigate the economic costs of the riparian rules on small 35 forest landowners by compensating them directly for a portion of timber volume losses 36 due to the RMZ restrictions. Zobrist (2003) concluded that this program can be very 37 effective at mitigating losses, especially when harvest takes place in the riparian zone. 38 However, he also identified a number of shortcomings. First, if participation is high, the 39 cost will far exceed present funding levels, and it is unlikely that the majority of small 40 landowners will enjoy the benefits of the program. Second, the program only 41 compensates for currently standing timber. Thus, it does not compensate for the loss in 42
Draft EIS Land Ownership and Use
4-29
Chapter 4 land value due to riparian acreage that can no longer be used for forest management 1 (Zobrist 2003). 2
The current Washington Forest Practices Rules allow for alternate plans to the current 3 Washington Forest Practices Rules. Applicants can propose harvest prescriptions, 4 including placement of LWD and uneven buffer widths that may be approved by 5 Washington DNR if the alternate plan provides protection to public resources that is 6 equivalent to that provided in the specific buffer prescriptions under the current 7 Washington Forest Practices Rules. Alternate plan templates for small forest landowners 8 to meet this objective are being considered for overstocked forest stand rehabilitation and 9 conversion of certain hardwood-dominated stands to conifer-dominated stands. Alternate 10 plans offer an incentive to retain forestland. Other small forest landowners are working 11 with the Services to develop a programmatic HCP covering over 100,000 acres in Lewis 12 County. If approved, the HCP in Lewis County, or others like it, should help to reduce 13 the rate of conversions in those areas. 14
Substantial decreases in land value imply that it would not be economically viable for 15 small landowners to continue to use their property for forest management, which could 16 motivate land use conversion, particularly to residential development (Zobrist 2003). 17 Non-industrial private forestlands in western Washington tend to interface with 18 urbanizing areas, and conversion of these lands is a growing concern. A study conducted 19 by Washington DNR, for example, found that non-industrial private forestlands were 20 converted to non-forest use between 1979 and 1989 at a rate of almost 100 acres per day 21 (Washington DNR 1998). This conversion figure is, however, for land converted from 22 primary forestland to some other purpose. This does not always mean conversion to 23 another land use, such as residential development or agriculture; it could mean 24 conversion to smaller or less dense parcels of forestland. The majority of the conversion 25 identified in this report occurred in western Washington, with much of the conversion 26 occurring within urban growth area boundaries and on the fringes of the suburban/rural 27 interface (Washington DNR 1998). 28
Conversion information available from Washington DNR’s Forest Practices Application 29 Review System database indicates that 53,821 acres were converted from forestland to 30 other uses between 1997 and 2003 (Table 3-12). 31
The primary areas where conversion is taking place are in the Puget Sound Region and 32 along the I-90 corridor. A study conducted by The Wilderness Society assessed changes 33 in forest cover in King, Pierce, and Kittitas Counties from 1985 to 1999 based on Landsat 34 imagery (Thomson et al. 2003). This study identified approximately 96,000 acres that 35 had been converted from forest to urban development during that period in the three-36 county analysis area. 37
The results of Zobrist’s (2003) case study analysis suggest that the rate of non-industrial 38 private forestland conversion would likely increase under No Action Alternative 1-39 Scenario 1, Alternative 2, and Alternative 3 relative to No Action Alternative 1-Scenario 40 2. Forestland conversion would likely be the lowest under No Action Alternative 1-41 Scenario 2 because of the less-restrictive RMZ rules in effect on January 1, 1999. No 42
Land Ownership and Use Draft EIS
4-30
Chapter 4 Action Alternative 1-Scenario 1 would result in reduced funding for landowner incentive 1 and assistance programs, such as the Forestry Riparian Easement Program because of a 2 lack of regulatory certainty leading to a lack in public funding for such programs. As a 3 result, comparing these three alternatives, small landowner mitigation, viewed in terms of 4 financial compensation, would be lowest under No Action Alternative 1-Scenario 1, 5 higher under Alternative 3, and highest under Alternative 2. This effect would likely 6 result in a lower rate of conversion under Alternative 2 and higher rates under No Action 7 Alternative 1-Scenario 1 and Alternative 3. 8
RMZ restrictions would be substantially higher under Alternative 4 relative to all other 9 alternatives (Figure 4.2-1). Thus, it can be concluded (based on the findings of Zobrist 10 2003) that the economic viability for forest landowners, especially small forest 11 landowners, would be lower under Alternative 4, and the rate of forestland conversion 12 could be substantially higher than under any of the other alternatives. These types of 13 effects would be particularly likely to occur in the South Puget Sound and West Puget 14 Sound Regions, as well as the North Puget Sound and lower Columbia Regions, where 15 substantial urban development pressures exist and non-industrial private forestlands are 16 often located along the urban-wildland interface. However, county regulations and 17 restrictions, the proximity of properties to urban areas, the current real estate market, and 18 other factors would contribute to how fast conversion could take place under any 19 alternative. 20
Many of the aquatic habitat functions described in the following subsections on sediment, 21 water quality, hydrology, and riparian processes, particularly wood recruitment, would 22 likely be affected adversely by substantial increases in land use conversion. While these 23 effects would tend to be at the site scale, watershed scale effects could occur in basins 24 with high densities of small landowners and/or in basins in close proximity to rapidly 25 growing urban areas. Conversion of forestland to more intense land uses (e.g., 26 agriculture, residential development) typically is followed by altered hydrologic regimes, 27 diminished water quality, and reduced riparian function for aquatic species and other 28 riparian–dependent wildlife. 29
The restrictions proposed under each alternative only apply to private forestlands in 30 western Washington and private and State forestlands in eastern Washington. As a result, 31 none of the alternatives are expected to have a direct effect on Federal, tribal, other State-32 managed, or agricultural lands. Reductions in land available for harvest or increases in 33 conversion from forestland to other uses on the lands managed under these alternatives 34 could increase demand for timber from other land ownerships or encourage conversion 35 on other nearby lands, but these effects are expected to be minor. 36
37
Draft EIS Air Quality
4-31
Chapter 4
4.3 AIR QUALITY 1
4.3.1 Introduction 2 There would be only minor differences among the alternatives in terms of effects on air 3 quality. Timber harvest-associated traffic on logging roads would add dust to the air, and 4 prescribed burning and wildfires would add smoke under all alternatives. The dust and 5 smoke could produce eye and respiratory discomfort to people working, living, or 6 recreating in the area. Air pollution from dust would be partially mitigated by dust 7 abatement measures under all alternatives. All alternatives would comply with Federal 8 air quality standards, the Washington Visibility State Implementation Plan (Washington 9 Department of Ecology 1999a), which regulates (among other pollutants) emissions from 10 prescribed burning, and the State Smoke Management Plan (Washington DNR 1998i), 11 which would mitigate any adverse effects from silvicultural burning. 12
4.3.2 Evaluation Criteria 13 None of the rules under any of the alternatives would significantly affect the amount of 14 burning that takes place or the amount of traffic on logging roads. A general indicator of 15 the amount of activity that produces air emissions is the amount of land taken out of 16 forest management over the long term. Thus, in the following evaluation, the amount of 17 RMZ area (particularly no-harvest area) is used as a general indicator of the differences 18 in activity levels among the alternatives. 19
4.3.3 Evaluation of Alternatives 20 This subsection addresses the effects of the alternatives on air quality. In reading this 21 subsection it should be remembered from Chapter 2 (Alternatives) that under the No 22 Action Alternative 1, no ITPs or ESA Section 4(d) take authorization would be issued. 23 However, this lack of action would likely affect the forest practices program in a way that 24 is difficult to predict. Therefore, two scenarios (Alternative 1-Scenario 1 and Alternative 25 1-Scenario 2), which represent the endpoints of the reasonable range of possible 26 outcomes for the Forest Practices Regulatory Program, have been defined to represent the 27 No Action Alternative (subsection 2.3.1, No Action Alternative 1 (No Action)). The 28 effects of No Action are displayed for both of these endpoints in the following paragraph, 29 the actual effects of No Action on air quality are likely to fall somewhere between these 30 two scenarios. 31
No Action Alternative 1-Scenario 1 (and Alternative 2 and Alternative 3) would have 32 harvest levels consistent with the status quo. Dust levels under these three alternatives, 33 therefore, are likely to be similar to current levels. No Action Alternative 1-Scenario 2 is 34 projected to result in more harvest over the long term than the status quo (and more than 35 other alternatives) because it would require substantially fewer trees be left in RMZs 36 (Figures 4.2-1 and 4.2-2). In areas where more miles of road are used and/or there is 37 more truck traffic compared to the status quo, there is the potential for increases in dust 38 under No Action Alternative 1-Scenario 2 than from levels under No Action Alternative 39
Air Quality Draft EIS
4-32
Chapter 4 1-Scenario 1. The same is true for Alternatives 2 and 3 relative to No Action Alternative 1 1-Scenario 2. 2
Alternative 4 is projected to result in the lowest harvest level because of the large no-3 harvest RMZs. Therefore, Alternative 4 would have a lower potential to generate dust 4 than either No Action Alternative 1-Scenario 1 or Scenario 2. 5
Air pollution from dust under all alternatives would be mitigated by dust abatement 6 measures required by Washington Forest Practices Board road maintenance standards and 7 State Department of Labor and Industries safety standards for dust. These include using 8 gravel road surface material, applying chemical dust suppressants, or applying water to 9 the road surface. 10
The use of prescribed burning (both broadcast burning and pile and burn) to prepare a site 11 for planting is expected to be similar under No Action Alternative 1-Scenario 1, 12 Alternative 2, and Alternative 3. Levels of prescribed burning would be slightly higher 13 under No Action Alternative 1-Scenario 2 than No Action Alternative 1-Scenario 1. 14 Because of reduced harvest activity under Alternative 4, prescribed burning would be 15 slightly lower than under either scenario of the No Action Alternative 1. 16
Compared to the status quo, little or no additional adverse effects on air quality are 17 anticipated due to prescribed burning for site preparation under any of the proposed 18 alternatives. Per WAC 222-30-100, slash burning is strictly regulated under the 19 Washington State Smoke Management Plan (Washington DNR 1998i) and would require 20 a permit from the Washington DNR. Prescribed burning for both slash disposal and to 21 reduce wildfires would occur in eastern Washington. Fewer acres of prescribed burning 22 would likely occur in western Washington due to the cool and wet weather patterns that 23 generally prevail and the restrictions on burning that may affect urban areas. 24
Air pollution from wildfire is also expected to be greater on the eastside of the State than 25 on the westside because of the drier conditions east of the Cascade Mountains. No 26 Action Alternative 1-Scenario 2 would result in the lowest likelihood of wildfire among 27 all alternatives because there would be smaller riparian buffer areas and some tree 28 removal would be allowed, resulting in low fuel loads. This alternative would be less 29 likely to violate air quality standards due to wildfire compared to the status quo. 30
No Action Alternative 1-Scenario 1 (and Alternatives 2 and 3) has a riparian buffer larger 31 than No Action Alternative 1-Scenario 2 and would allow partial tree removal in portions 32 of the buffers. This would result in higher levels of fuel than No Action Alternative 1-33 Scenario 2. The likelihood of wildfire associated with this alternative (and Alternatives 2 34 and 3), and the likelihood of violating air quality standards, would be similar to the status 35 quo. 36
The likelihood of wildfire is expected to be slightly higher under Alternative 4 than either 37 scenario of No Action Alternative 1, due to the wider unmanaged riparian buffers, which 38 would result in greater fuel buildup in riparian corridors compared to other alternatives. 39 Unmanaged stands tend to have higher amounts of both down and standing dead fuel and 40
Draft EIS Air Quality
4-33
Chapter 4 a wide range of tree sizes, ranging from seedlings and saplings to mid-canopy trees to 1 upper canopy trees. This creates a “ladder effect” that allows fire to move from the 2 ground to the upper canopy. The likelihood of wildfire under Alternative 4 may result in 3 a slightly greater affect on air quality standards compared to the status quo. 4
5
Air Quality Draft EIS
4-34
Chapter 4 This page is intentionally left blank. 1
2
Draft EIS Geology, Soils, and Erosional Processes
4-35
Chapter 4
4.4 GEOLOGY, SOILS, AND EROSIONAL PROCESSES 1 In this subsection, the effects of the alternatives are divided into two main areas: surface 2 erosion and mass wasting. Differences in climate, topography, geology, and resulting 3 soil characteristics among and within regions of the State will lead to differences in 4 overall susceptibility to surface erosion and mass wasting. The Washington Forest 5 Practices Rules apply statewide, with some differences between eastern and western 6 Washington. In general, higher frequencies of mass wasting and lower surface erosion 7 rates occur in western Washington relative to eastern Washington forestlands due to 8 differences in climate, topography, geology, and soil permeability (subsection 3.4, 9 Geology, Soils, and Erosional Processes). The Regional Summaries (DEIS Appendix A) 10 describe differences in geology and soil types, which vary by region and are summarized 11 in the affected environment discussion of subsection 3.4 (Geology, Soils, and Erosional 12 Processes). 13
4.4.1 Surface Erosion 14 The major sources of surface erosion on forestlands due to forest management are erosion 15 from road surfaces and hill-slope erosion following harvest, as discussed in subsection 16 3.4.2 (Erosion). The evaluation criteria for these sources are described below. 17
4.4.1.1 Surface Erosion Evaluation Criteria 18 Road Surface Erosion 19 Road surface erosion is affected by road construction methods, road use, road 20 maintenance, road abandonment, and drainage, as discussed in subsection 3.4.2.2 (Forest 21 Practices Effects on Erosion and Sedimentation). The criterion for evaluating this 22 chronic source of erosion sediment is a qualitative assessment of how well the 23 Washington Forest Practices Rules that are pertinent to road management (i.e., planning, 24 construction, use, maintenance, drainage, and abandonment) would control road-related 25 sediment production and delivery to streams under each alternative. 26
Chapter 222-24-050 through 052 of the WAC (also found in Washington Forest Practices 27 Board 2002) describe the reasoning, schedule, and requirements for road maintenance 28 and abandonment of forest roads, including RMAPs under the current Washington Forest 29 Practices Rules. RMAPs are required analyses and plans to be submitted by forest 30 landowners to Washington DNR. The purpose of the RMAP program is to evaluate and 31 prioritize the maintenance and abandonment of forest roads by addressing roads in most 32 need of these actions first, as demonstrated by a well-defined set of maintenance and 33 abandonment criteria designed to protect surface waters from sediment input, and 34 resources from road-related mass wasting events. The need for improvement of road 35 maintenance and abandonment practices over the January 1, 1999 Washington Forest 36 Practices Rule is described in Rashin et al. (1999). 37
Hillslope Erosion Related to Timber Harvest 38 Timber harvest activities often lead to increased soil disturbance, potentially increasing 39 delivery of fine sediments to stream channels. Factors influencing the delivery of 40
Geology, Soils, and Draft EIS Erosional Processes
4-36
Chapter 4 excessive sediment to streams as a result of timber harvest are discussed in subsection 1 3.4.2.2 (Forest Practices Effects on Erosion and Sedimentation). 2
Evaluation criteria for hillslope erosion are compared using an equivalent buffer area 3 index. The equivalent buffer area index is similar in concept to the equivalent road area 4 analysis of McGurk and Fong (1995) and the non-point source risk assessment of Lull et 5 al. (1995), and represents a relative measure of the protection of streams from fine 6 sediment derived from hillslope erosion (DEIS Appendix B). The ability of buffers to 7 capture fine sediment is largely dependent on their width, slope, and the management 8 practices within the buffer strip. Buffer-strip width is the most common parameter used 9 for evaluating the ability of a management option to minimize fine sediment delivery to 10 streams. Recommended buffer widths for sediment removal vary widely, ranging from 11 about 10 feet for removing coarse fractions (sand) to 400 feet for fine fractions (clay). 12 Studies of forested watersheds often recommend buffers of approximately 100 feet for 13 this purpose (Johnson and Ryba 1992). Spence et al. (1996) also reviewed the literature 14 on buffer widths for sediment filtration. Although Spence et al. (1996) and his colleagues 15 gave no definitive width, they concluded that on gentle slopes 100 feet might be 16 sufficient, while on steep slopes 300 feet may be necessary for sediment filtration. The 17 Forest Ecosystem Management Assessment Team (FEMAT) (1993) buffer width for 18 sediment filtration is one site potential tree height (See Glossary), or approximately 170 19 feet in western Washington for Site Class II forestland. For management purposes, a 20 fixed width rather than one based on site potential tree height is more appropriate, since 21 sediment movement is unrelated to the latter. Site potential tree height was used by 22 FEMAT (1993) as a surrogate for using fixed width because of the relationship between 23 site potential tree height and soil stability given by tree roots (the bigger the site potential 24 tree height, the wider the root system and the greater the width). Rashin et al. (1999) 25 recommended a 10 meter (33-foot) buffer as effective at reducing timber harvest–related 26 surface erosion from entering the drainage network. 27
For this DEIS, the equivalent buffer area index was evaluated for a 30-foot and a 200-28 foot RMZ width, for all alternatives, representing a lower end and upper end RMZ 29 prescription. The lower end RMZ width of 30 feet was chosen to be consistent with the 30 recommendation of Rashin et al. (1999). The higher end buffer was chosen to represent 31 the upper end of recommendations and the widest buffers being considered under any of 32 the alternatives. 33
The equivalent buffer area index values are expressed as a percentage that is normalized 34 based on the assumption that complete protection is provided by a 30-foot no-harvest 35 buffer for the 30-foot equivalent buffer area index and that complete protection is 36 provided by a 200-foot no-harvest buffer for the 200-foot equivalent buffer area index. 37
Regardless of the equivalent buffer area index width chosen to analyze hillslope erosion, 38 in forestlands on steep terrain, it should be noted that riparian buffers do not provide full 39 protection from upslope sedimentation that originates from roads, unless all road drainage 40 is directed to the forest floor. This is generally not possible, and considerable suspended 41 sediment may be transported to fish-bearing streams via non-fish-bearing streams where 42
Draft EIS Geology, Soils, and
Erosional Processes 4-37
Chapter 4 roads bisect the non-fish-bearing riparian buffers and streams. Best Management 1 Practices (BMPs) for road placement and construction, as well as RMAPs and Watershed 2 Analysis are meant to address this issue. Effectiveness of road construction techniques 3 and recommended BMPs for prevention of sediment-related water quality impacts over 4 the January 1, 1999 Washington Forest Practices Rules is discussed in more detail in 5 Rashin et al. (1999). 6
4.4.1.2 Evaluation of Alternatives 7 The effects of the alternatives on road surface and hillslope erosion are analyzed in this 8 subsection. In reading this analysis, it should be remembered from Chapter 2 9 (Alternatives) that under the No Action Alternative, no ITPs or ESA Section 4(d) take 10 authorization would be issued. However, this lack of action would likely affect the 11 Forest Practices Regulatory Program in a way that is difficult to predict. Therefore, two 12 scenarios, which represent the endpoints of the reasonable range of possible outcomes for 13 the Forest Practices Regulatory Program, have been defined (subsection 2.3.1, No Action 14 Alternative 1) to represent the No-Action Alternative. The effects of No Action are 15 discussed for both of these endpoints in the following paragraphs, but the actual outcome 16 and the actual effects of No Action on road surface erosion and hillslope erosion are 17 likely to fall between these two scenarios. 18
Road Surface Erosion 19 Overview of Effects 20 The effects of the alternatives on road-related surface erosion and sediment delivery are 21 analyzed in this subsection. It is important to note that, from a historical perspective, 22 road-related surface erosion and sediment delivery to streams has been substantially 23 reduced over time because of improvements in road construction methods, the frequency 24 of maintenance, and the implementation of BMPs (subsection 3.4.2.3, History of Forest 25 Practices Affecting Erosion and Sedimentation). The following paragraphs address the 26 likelihood of increased sediment delivery by alternative. 27
Overall, No Action Alternative 1-Scenario 2 would result in the highest likelihood of fine 28 sediment delivery to streams over the long term, primarily because the eventual rules, 29 under this scenario, would not be outcome-based and would lack the needed flexibility 30 for site-specific situations. In addition, RMAPs would generally not be required, and 31 rules and BMPs that address road drainage would be less protective than for the other 32 alternatives. However, the probability of sediment delivery would be substantially 33 reduced in those areas where Watershed Analysis was performed. 34
No Action Alternative 1-Scenario 1 (and Alternative 2 and Alternative 3) would reduce 35 road-related sediment from delivering to streams, relative to No Action Alternative 1-36 Scenario 2, due to: 1) improved BMPs, 2) implementation of RMAPs, and 3) an 37 outcome-based and enforceable policy statement that requires resource protection within 38 a 15-year period for large landowners that represent the majority of covered lands. 39
The probability of sediment delivery under Alternatives 2 and 3 and No Action 40 Alternative 1-Scenario 1 is expected to be similar since Washington Forest Practices 41
Geology, Soils, and Draft EIS Erosional Processes
4-38
Chapter 4 Rules are the same among these alternatives. Alternative 4 would result in a low 1 likelihood of road-generated sediment delivery to streams over the short term and long 2 term when compared to either scenario under the No Action Alternative 1. This outcome 3 would be due to the no net increase restriction on road densities and the shorter 4 timeframe for completion of RMAPs and their implementation. 5
Detailed Effects Analysis 6 A detailed analysis of the alternatives is presented in the following subsections. 7
No Action Alternative 1-Scenario 2 8 Under No Action Alternative 1-Scenario 2, the January 1, 1999 Washington Forest 9 Practices Rules would be in effect. These rules were intended to control the rate of 10 sediment delivery to streams based on implementation of BMPs. Among the alternatives 11 considered, No Action Alternative 1-Scenario 2 is the only one that would not require 12 RMAPs for most forestlands over the long term. In general, the highest likelihood for 13 sediment delivery to streams from roads would occur under this alternative. Rashin et al. 14 (1999) evaluated the January 1, 1999 Washington Forest Practices Rules and came to a 15 similar conclusion (although the evaluation took place prior to January 1, 1999, the rules 16 evaluated were the same as those in effect on January 1, 1999). However, where 17 Watershed Analysis had been applied, prescriptions were developed to reduce surface 18 erosion for areas where there was a high vulnerability to a public resource, such as 19 fisheries or water quality. Without gaining incidental take authorization under ITPs or 20 ESA Section 4(d) rules, Watershed Analysis, which has decreased since the current 21 Washington Forest Practices Rules were implemented, may be applied more frequently 22 by forest landowners to gain greater certainty in their ability to harvest. 23
A road maintenance survey was conducted by Washington DNR on 379 miles of State 24 and private forest roads across Washington State. The unpublished draft document 25 concluded that the January 1, 1999 Washington Forest Practices Rules are subjective and 26 inadequate because they do not establish an acceptable limit on how much sediment 27 delivery constitutes resource damage. The delivery of fine sediment from road surfaces 28 to streams is addressed by the rules with statements such as “minimize erosion” or “not 29 conducive to accelerated erosion;” however, the rules do not directly address the desired 30 outcome, which is to avoid resource damage. In addition, the rules do not offer a 31 standard process for landowners and regulators to assess or identify successes and 32 failures relating to resource protection, which can lead to varying compliance 33 expectations throughout the State for landowners, regulators, and the public. The draft 34 report by Washington DNR on road maintenance concluded that the January 1, 1999 35 Washington Forest Practices Rules emphasize the use of culverts and ditches as the 36 primary means of addressing hydrologic issues, but do not adequately address sediment 37 production. The results of the survey showed that approximately 65 percent of the 38 surveyed roads had direct delivery of sediment to streams (Washington DNR, 39 unpublished draft report, 1999). 40
In addition, the rules under No Action Alternative 1-Scenario 2 do not result in a 41 landscape-level approach to sediment reduction. RMAPs, which are required under the 42
Draft EIS Geology, Soils, and
Erosional Processes 4-39
Chapter 4 current rules (and No Action Alternative 1-Scenario 1 and Alternatives 2, 3, and 4), are a 1 landscape-level or ownership-wide assessment, and would not be mandatory under No 2 Action Alternative 1-Scenario 2 unless Washington DNR assessments indicate an 3 ongoing problem; in this situation, road plans would be required on a case-by-case basis. 4 The rules under No Action Alternative 1-Scenario 2 do not have any specific guidelines 5 or assessment tools in the Washington Forest Practices Board Manual as to when these 6 plans are required. The draft report by Washington DNR on road maintenance concluded 7 that RMAPs appear to assist landowners in identifying and addressing most issues that 8 have the potential to cause resource damage and are effective at providing better 9 protection for public resources; however, surface erosion appeared to be a problem in 10 some areas that had an RMAP (Washington DNR, unpublished draft report, 1999). 11
No Action Alternative 1-Scenario 1, Alternative 2, and Alternative 3 12 Note: The reviewer is reminded to consider the differences in effectiveness over time of 13 the adaptive management programs among this group of alternatives (No Action 14 Alternative 1-Scenario 1[low], Alternative 2 [high], Alternative 3 [moderate]) in 15 evaluating the effects discussed below (subsection 4.1.5, Adaptive Management). 16
Under these alternatives, the current rules pertaining to forest roads would remain in 17 effect, including RMAP rules. Watershed Analysis would be undertaken less frequently 18 than under No Action Alternative 1-Scenario 2. The approach of the rules under these 19 alternatives (i.e., the current Washington Forest Practices Rules) is specifically designed 20 to reduce road-generated sediment. For new roads, all ditch relief culverts are required to 21 drain onto the forest floor in such a way that no sediment reaches a stream. Research has 22 shown that sediment from relief culverts can travel overland for 100 feet (or more) under 23 certain conditions (Duncan et. al. 1987). Therefore, under these alternatives, the 24 performance-based Washington Forest Practices Board Manual guidance would result in 25 placement of culverts where necessary to minimize sediment delivery to streams. Other 26 conditions, such as slope and soil texture, can make the culvert-to-stream distance even 27 greater. 28
RMAPs for entire ownerships would be required by 2006 from large landowners. The 29 plans would require the inventory and assessment of all forest roads, including orphan 30 roads. Further, the rules under these alternatives specify that all upgrades to roads must 31 be completed, and new maintenance standards applied to all roads built after 1974, by the 32 end of 2016. Priorities in the rules place activities and locations with the highest 33 potential benefit to fish and water quality early in the maintenance and abandonment 34 schedule. Washington DNR provides guidance and tools necessary for landowners to 35 complete the RMAPs. 36
Small forest landowners would be required to submit a checklist type of RMAP with their 37 forest practices applications for forest roads covered under the forest practices activities 38 in the application. Roads used or proposed for use, as timber haul routes must be 39 maintained in a condition that prevents damage to public resources. 40
Geology, Soils, and Draft EIS Erosional Processes
4-40
Chapter 4 RMAPs represent a landscape-level approach that includes prioritization of problem 1 sediment areas and an implementation schedule that would reduce the delivery of chronic 2 sediment to streams. Abandonment plans would prioritize roads for abandonment that 3 would exempt them from future maintenance. This would also result in further reduction 4 of surface erosion from roads and sediment delivery to streams. 5
Under No Action Alternative 1-Scenario 1, Alternative 2, and Alternative 3, the current 6 RMAP rules (WAC 222-24-010(1)) to protect water quality and aquatic and riparian 7 habitats do not explicitly include or recommend tools such as monitoring to measure the 8 effects of roads on the resources. However, the current Washington Forest Practice Rules 9 require annual reviews and meetings with large forest landowners on their road plans, 10 which constitute an informal assessment of the plan's effectiveness. These processes 11 would continue under these alternatives. 12
Alternative 4 13 Alternative 4 would substantially reduce road sediment delivery to streams relative to No 14 Action Alternative 1-Scenario 2. There would also be some reduction in road sediment 15 delivery to streams under Alternative 4 compared to No Action Alternative 1-Scenario 1 16 and Alternatives 2 and 3. This is primarily due to the requirement under Alternative 4 of 17 no net increase in forest road densities on State and private timberlands. In addition, 18 Alternative 4 would require the time frame for completion of road maintenance and 19 abandonment plans to be 5 years shorter than under No Action Alternative 1-Scenario 1 20 and Alternatives 2 and 3. All landowners would have to submit RMAPs. There would 21 be no difference between the RMAP requirements for small landowners and large 22 landowners as under No Action Alternative 1-Scenario 1 and Alternatives 2 and 3. Road 23 upgrades and road abandonment in a shorter time period would reduce the total quantity 24 of sediment generated by surface erosion compared to the other alternatives. 25
Hillslope Erosion 26 Overview of Effects 27 A summary comparison of the effects of the alternatives is provided in the next few 28 paragraphs, and a detailed analysis of the effects is provided by alternative in the 29 following subsections. It is important to note that from an historical perspective, 30 hillslope erosion and sediment delivery to streams has been substantially reduced over 31 time due to the implementation of buffers and improved felling, yarding, transport 32 techniques, and BMP implementation (subsection 3.4.2.3, History of Forest Practices 33 Affecting Erosion and Sedimentation). 34
No Action Alternative 1-Scenario 1 (and Alternative 2 and Alternative 3) would provide 35 full protection for Type S and F streams relative to sediment delivery resulting from 36 hillslope erosion. However, Type NP and NS streams would not be fully protected due to 37 narrower buffers along these streams. Even so, relative to No Action Alternative 1-38 Scenario 2, No Action Alternative 1-Scenario 1 (and Alternatives 2 and 3) would result in 39 a low likelihood of sediment delivery from hillslope erosion due to implementation of 40 Equipment Limitation Zones. 41
Draft EIS Geology, Soils, and
Erosional Processes 4-41
Chapter 4 No Action Alternative 1-Scenario 2 would result in nearly full protection of hillslope 1 erosion from directly reaching Type 1, 2, and 3 waters. The lack of RMZs along Type 4 2 and 5 streams would result in a high likelihood of hillslope erosion delivering sediment to 3 these waters. No Action Alternative 1-Scenario 2 represents a return to the January 1, 4 1999 Washington Forest Practices Rules that were less protective with respect to hillslope 5 erosion than the current Washington Forest Practices Rules. Increased sediment input 6 would be expected under this alternative relative to No Action Alternative 1-Scenario 1 7 (as well as Alternatives 2, 3, and 4), unless Watershed Analysis is widely and 8 consistently applied. 9
Alternative 4 would provide full protection of all streams from timber harvest-related 10 hillslope erosion. Alternative 4 would result in greater protection than either scenario of 11 No Action Alternative 1. 12
Detailed Effects Analysis 13 Results of the sediment equivalent buffer area index calculations are presented for both 14 western and eastern Washington streams in Figure 4.4-1 for a 30-foot distance from the 15 streambank and in Figure 4.4-2 for a 200-foot distance from the streambank. For ease of 16 comparison, results are presented for all streams, for fish-bearing streams only, and for 17 perennial and seasonal non-fish-bearing streams. It should be noted that the sediment 18 equivalent buffer area index values are expressed as percentages with 100 percent equal 19 to complete protection. The sediment equivalent buffer area index for the 30-foot width 20 assumes that complete protection is provided by a 30-foot no-harvest buffer and the 21 sediment equivalent buffer area index for the 200-foot width assumes that complete 22 protection is provided by a 200-foot no-harvest buffer. 23
No Action Alternative 1-Scenario 2 24 Under No Action Alternative 1-Scenario 2, the likelihood of sediment delivery to streams 25 would be high along Type 4 and 5 streams, which would not have established RMZs. 26 Because Type 4 and 5 streams are the most abundant stream types on the landscape 27 (DEIS Appendix B), the likelihood of sediment delivery from harvest-related practices 28 would be high. 29
The sediment equivalent buffer area index indicates the least protection of streams from 30 hillslope erosion for No Action Alternative 1-Scenario 2 because of the lack of riparian 31 buffers necessary to filter harvest-related surface erosion, particularly along non-fish-32 bearing streams. Sedimentation effects would be short-term and would persist until sites 33 become re-vegetated. For western Washington streams, No Action Alternative 1-34 Scenario 2 would provide a sediment equivalent buffer area index of 78 percent assuming 35 a 30-foot width is required for full protection, and 65 percent assuming a 200-foot width 36 is required. For eastern Washington streams, the sediment equivalent buffer area index is 37 estimated at 86 percent for the 30-foot full-protection assumption, and at 67 percent for 38 the 200-foot assumption (Figures 4.4-1 and 4.4-2). These values are separate from the 39 discussion of which total buffer widths are most appropriate, and are simply a method to 40 compare alternatives in terms of filtering effectiveness across given buffer widths on 41 various stream types. 42
Geology, Soils, and Draft EIS Erosional Processes
4-42
Chapter 4 In a study on the effectiveness of the January 1, 1999 Washington Forest Practices Rules 1 at preventing sediment delivery, Rashin et al. (1999) concluded that streamside buffers in 2 place at the time were effective at preventing sediment delivery to Type 1-3 streams. 3 Along Type 4 and 5 streams, which were not buffered, physical impacts included 4 extensive fine sediment deposition and other streambed changes such as increased 5 streambed mobility, burial of substrates by logging slash, and loss of pre-existing LWD. 6 Rashin et al. (1999) concluded that the no-harvest buffers in place at the time were 7 generally effective in preventing sediment delivery, except where flow was channelized. 8 Most erosion features that were identified as delivering sediment occurred within 30 feet 9 of a stream. However, they concluded that many of the BMPs and rules were ineffective, 10 particularly where no RMZs were in place, as was the case prior to 1999 for Type 4 and 5 11 streams. In another study, Pentec (1991) concluded that the lack of RMZs and associated 12 BMPs on Type 4 and 5 streams was a fundamental flaw in the January 1, 1999 13 Washington Forest Practices Rules. 14
The likelihood of sediment delivery to Type 4, Type 5, and other larger streams would be 15 high under No Action Alternative 1-Scenario 2. It should also be noted that the 16 likelihood would be increased for all streams with Channel Migration Zones in this 17 alternative because the rules under this alternative do not include Channel Migration 18 Zone protection as do the current Washington Forest Practices Rules (i.e., No Action 19 Alternative 1-Scenario 1 and Alternatives 2 and 3). 20
No Action Alternative 1-Scenario 1, Alternative 2, and Alternative 3 21 Note: The reviewer is reminded to consider the differences in effectiveness over time of 22 the adaptive management programs among this group of alternatives (No Action 23 Alternative 1-Scenario 1[low], Alternative 2 [high], Alternative 3 [moderate]) in 24 evaluating the effects discussed below (subsection 4.1.5, Adaptive Management). 25
Under this group of alternatives (i.e., current rules), the no-harvest portion of RMZs for 26 Type S and F streams (a minimum of 50 feet on the westside and 30 feet on the eastside) 27 would meet or exceed the 30-foot buffer criterion described above under No Action 28 Alternative 1- Scenario 2. Full protection of hillslope erosion would exist along Type S 29 and F streams. 30
A 30-foot Equipment Limitation Zone would continue to be applied to each side of all 31 Type Np and Ns streams. Landowners would continue to be required to mitigate 32 (e.g., grass seeding, mulching, or installation of water bars) for the disturbance of more 33 than 10 percent of the soil within any as a result of the use of ground-based equipment, 34 skid-trails, stream-crossings (other than road crossings), or partial (as opposed to fully 35 suspended) suspension of logs during yarding. These Equipment Limitation Zones would 36 continue to reduce the amount of timber harvest-generated surface erosion and 37 subsequent delivery to the stream network. 38
39
Draft EIS Geology, Soils, and
Erosional Processes 4-43
Chapter 4 Figure 4.4-1. Equivalent Buffer Area Index (EBAI) for Sediment Summed for all 1
Streams, Fish-Bearing Streams, Perennial Non-fish Streams, and 2 Seasonal Non-fish Streams, by Alternative Normalized by Assuming 3 100 Percent Protection is Provided by a 30-foot No-Harvest Buffer 4 Width. 5 6
7
0.00
0.10
0.20
0.30
0.40
0.50
0.60
0.70
0.80
0.90
1.00
All S tream s Fish-bearing N on-fish Perennia l N on-fish Seasona l
Sedi
men
t EB
AI f
or 3
0-ft.
Buf
fer
Alternative 1-Scenario 2A lternative 1-Scenario 1 , A lternative 2, & A lternative 3A lternative 4
W estern W ashington
0.00
0.10
0.20
0.30
0.40
0.50
0.60
0.70
0.80
0.90
1.00
All Streams Fish-bearing Non-fish Perennial Non-fish Seasonal
Sedi
men
t EB
AI f
or 3
0-ft.
Buf
fer
Alternative 1-Scenario 2Alternative 1-Scenario 1, Alternative 2, & Alternative 3Alternative 4
Eastern Washington
Geology, Soils, and Draft EIS Erosional Processes
4-44
Chapter 4 1
Figure 4.4-2. Equivalent Buffer Area Index (EBAI) for Sediment Summed for all 2 Streams, Fish-Bearing Streams, Perennial Non-fish Streams, and 3 Seasonal Non-fish Streams, by Alternative Normalized by 4 Assuming 100 Percent Protection is Provided by a 200-foot No-5 Harvest Buffer Width. 6
7
0.00
0.10
0.20
0.30
0.40
0.50
0.60
0.70
0.80
0.90
1.00
All Streams Fish-bearing Non-fish Perennial Non-fish Seasonal
Sedi
men
t EB
AI f
or 2
0 0-
ft. B
uffe
r
Alt.1-Scenario 2Alt.1-Scenario 1, Alternative 2, & Alternative 3Alternative 4
Western Washington
0.00
0.10
0.20
0.30
0.40
0.50
0.60
0.70
0.80
0.90
1.00
All Streams Fish-bearing Non-fish Perennial Non-fish Seasonal
Sedi
men
t EBA
I for
200-
ft. B
uffe
r
Alt.1-Scenario 2Alt.1-Scenario 1, Alternative 2, & Alternative 3Alternative 4
Eastern Washington
Draft EIS Geology, Soils, and
Erosional Processes 4-45
Chapter 4 A minimum of 50 percent of the NP streams in western Washington would receive 1 50-foot no-harvest buffers, which exceeds the 30-foot sediment filtration criterion 2 recommended by Rashin et al. (1999). In addition, sensitive sites, such as headwater 3 springs, headwall seeps, side-slope seeps, and Type Np confluences, are protected by 56-4 foot radius buffers where no harvest is allowed. In practice, approximately 70 percent or 5 more of NP streams are receiving these buffers, due to unstable slopes and sensitive area 6 buffers, according to Washington DNR field staff observations. 7
The no-harvest buffers along many of the NP streams, and the 30-foot Equipment 8 Limitation Zone along the other Type Np streams and NS streams should continue to 9 prevent hillslope sediment from entering streams. 10
Along Type NP streams on the eastside, if a landowner were to choose the clearcut 11 option, at least 60 percent of the Type Np stream length would receive a 50-foot no-12 harvest buffer. If the partial cut option were to be chosen, a 50-foot selective harvest 13 buffer would be required along the entire length of the Type Np stream. In cases where 14 harvest would be allowed within the RMZ, the effectiveness of the buffer in filtering 15 sediment would be compromised, but the Equipment Limitation Zone mitigation 16 requirements should reduce any hillslope erosion from entering streams. 17
The sediment equivalent buffer area index for effective riparian sediment filtration shows 18 that these alternatives, including No Action Alternative 1-Scenario 1, would have a much 19 greater buffering effect for sediment filtration, compared to No Action Alternative 1-20 Scenario 2. The estimated equivalent buffer area index values are 91 percent for the 21 westside and 96 percent for the eastside assuming a 30-foot width is required for full 22 protection, and 73 percent for the westside and 72 percent for the eastside assuming a 23 200-foot width is required for full protection (Figures 4.4-1 and 4.4-2). However, these 24 alternatives do not provide full protection of timber harvest-related surface erosion, 25 specifically along Type NP and NS streams that do not have 50-foot no-harvest buffers. 26 Sediment equivalent buffer area index values for these streams are estimated at 80 27 percent for the 30-foot full-protection assumption and between 63 and 68 percent for the 28 200-foot full-protection assumption. 29
Alternative 4 30 The no-harvest buffers on all stream types under Alternative 4 far exceed the 30-foot 31 buffer criterion recommended by Rashin et al. (1999). Therefore, all streams would be 32 fully protected from hillslope erosion delivery of sediment under the 30-foot full-33 protection assumption when compared to either scenario of No Action Alternative 1. The 34 sediment equivalent buffer area index under the 200-foot full-protection assumption is 35 estimated at 94 percent for westside streams and 98 percent for eastside streams for this 36 alternative (Figures 4.4-1 and 4.4-2). 37
4.4.2 Mass Wasting 38 Mass wasting is a natural occurrence; however, forest road construction and timber 39 harvest have been shown in a variety of studies to significantly increase the frequency 40 and magnitude of mass wasting events in potentially unstable areas (subsection 3.4.2, 41
Geology, Soils, and Draft EIS Erosional Processes
4-46
Chapter 4 Erosion). The Washington Forest Practices Rules are designed to reduce the frequency 1 and magnitude of debris flows, but when they occur, they also ensure that large, whole 2 trees are available for recruitment to non-fish and fish-bearing streams. 3
In the past three decades, a greater level of understanding, greater restrictions on harvest, 4 and more requirements for mitigation related to potentially unstable areas has 5 substantially decreased landslide frequency from historical levels (subsection 3.4.2.3, 6 History of Forest Practices Affecting Erosion and Sedimentation; DEIS Appendix A). 7
4.4.2.1 Mass Wasting Evaluation Criteria 8 Whether or not a particular slope will fail at any given time is dependent on a variety of 9 variables, including precipitation rate and quantity; soil moisture; hydrology; slope 10 aspect, length, and curvature; the internal strength of the slope material, (Coates 1990; 11 Dragovich et al. 1993a), and root strength of vegetation (Harp et al. 1997; Schmidt et al. 12 2001; Roering et al. 2003). Disturbances, including timber harvest and road building, 13 that compact or weaken slope material, change the hydrology of the slope, or undercut 14 marginally stable slopes can trigger mass wasting events (Rollerson et al. 1973; Swanson 15 and Dyrness 1975; Amaranthus et al. 1985; Dragovich et al. 1993b; Gerstel 1996). 16 Increased levels of planning and analysis can reduce the likelihood of landslides by 17 identifying and avoiding potentially unstable landforms, as can minimizing disturbance 18 from harvest activities in these areas (Gerstel 1994; Rashin et al. 1999; Dhakal and Sidle 19 2003). The likelihood of management-related mass wasting is discussed separately in 20 relation to forest roads, timber harvest, and streambank stability. 21
To achieve avoidance of unstable areas and protection from road-related landslides, there 22 are three factors that must be considered when assessing the effectiveness of a given 23 strategy or alternative for minimizing mass wasting: 1) to what degree do the rules 24 adequately define unstable slopes and landforms across the landscape (i.e., how good are 25 the definitions), 2) what mechanisms are in place to ensure unstable slopes and landforms 26 are detected during the forest practices application review process (i.e., screening tools 27 and training programs), and 3) how effective are the rule procedures or prescriptions in 28 minimizing mass wasting (i.e., level of avoidance or mitigation required by the rules 29 based on adequate definitions and screening processes)? The factors required for meeting 30 these criteria are evaluated below with respect to both road- and harvest-related mass 31 wasting. 32
Road-related Landslides 33 The potential for road-related landslides depends on both the location of roads in relation 34 to unstable areas and on how the roads are designed, built, and maintained (Rashin et al. 35 1999; USDA Forest Service 2001). Therefore, additional evaluation criteria for this 36 episodic source of sediment impacts are: 1) the degree to which unstable slopes would be 37 avoided under each alternative, and 2) the degree of protection from road-related 38 landslides provided by the Washington Forest Practices Rules. 39
Chapter 222-24-050 through 052 of the WAC (See also Washington Forest Practices 40 Board 2002) describe the reasoning, schedule, and requirements for road maintenance 41
Draft EIS Geology, Soils, and
Erosional Processes 4-47
Chapter 4 and abandonment for forest roads, including RMAPs, which are currently required 1 analyses and plans to be submitted by forest landowners to Washington DNR. The 2 purpose of the RMAP program is to evaluate and prioritize the maintenance and 3 abandonment of forest roads by addressing roads in most need of these actions first, as 4 demonstrated by a well-defined set of maintenance and abandonment criteria designed to 5 protect surface waters from sediment input, and resources from road-related mass wasting 6 events. The need for improvement of road maintenance and abandonment practices over 7 the requirements of the rules in effect on January 1, 1999, is described in Rashin et al. 8 (1999). 9
Landslides Related to Timber Harvest 10 Mass wasting related to timber harvest is most likely to occur on steep slopes and specific 11 landforms that are highly susceptible to mass failure. The initiation of landslides from 12 management activities can occur in both riparian areas and upslope areas. The evaluation 13 criterion for harvest-related landslides is based on the degree of protection provided to 14 unstable areas under each alternative. This assessment considers the protection of 15 unstable slopes upslope from RMZs that may buffer upslope landslides and landslides 16 that may occur in RMZs. 17
Streambank Stability 18 The evaluation of timber harvest effects on streambank stability is based on RMZ widths 19 and activities allowed within the RMZ that may affect root strength and thus streambank 20 integrity. For this analysis, one-half of a tree crown diameter (which is in the range of 21 0.3 site potential tree height) is assumed to be a sufficient width for the maintenance of 22 streambank stability. The rationale for the value of 0.3 site potential tree height is based 23 on the curve for root strength on page V-27 of the FEMAT (1993) report. Consideration 24 is also given to the composition of riparian species because of differences in the root 25 morphology and relative root strength of conifers, deciduous trees, and shrubs. Bank 26 stability is a relative term. Bank erosion is a natural process that on the one hand 27 provides LWD and sediment for the benefit of aquatic ecosystems, while on the other 28 hand, bank erosion beyond natural rates and durations may be detrimental to aquatic 29 ecosystems (LWD overloading, channel shifting and bedload aggradation, changes in 30 width/depth ratios, and possible increased stream temperatures). This subsection 31 evaluates how the alternatives protect bank stability and integrity relative to natural 32 conditions and processes. 33
4.4.2.2 Evaluation of Alternatives 34 The effects of the alternatives on road related landslides are analyzed in this subsection. 35 In reading this analysis, it should be remembered from Chapter 2 (Alternatives) that 36 under the No Action Alternative 1, no ITPs or ESA Section 4(d) take authorization would 37 be issued. However, this lack of action would likely affect the Forest Practices 38 Regulatory Program in a way that is difficult to predict. Therefore, two scenarios, which 39 represent the endpoints of the reasonable range of possible outcomes for the Forest 40 Practices Regulatory Program, have been defined (subsection 2.3.1, Alternative 1 (No 41 Action)) to represent the No-Action Alternative. The effects of No Action are displayed 42
Geology, Soils, and Draft EIS Erosional Processes
4-48
Chapter 4 for both of these endpoints in the following subsections, but the actual outcome and the 1 actual effects of No Action on road surface erosion and hillslope erosion are likely to fall 2 between these two scenarios. 3
Road Related Landslides 4 Overview of Effects 5 The effects of the alternatives on road-related landslides and sediment delivery are 6 analyzed in this subsection. There is no comprehensive statewide data available for 7 historical or current management-related landslide frequency compared to natural levels. 8 However, even the January 1, 1999 Washington Forest Practices Rules were much more 9 protective of unstable slopes than historic rules (subsection 3.4.2.3, History of Forest 10 Practices Affecting Erosion and Sedimentation); therefore, it is likely that the frequency 11 of road-related mass wasting events would be reduced under any of the alternatives, 12 relative to historic conditions. 13
Compared to the No Action Alternative 1-Scenario 1, No Action Alternative 1-Scenario 2 14 would result in an increased likelihood of road-related landslides because: 1) under the 15 January 1, 1999 Washington Forest Practices Rules the unstable slope screening process 16 did not identify some unstable areas, 2) there were no comprehensive screening process 17 required to identify unstable areas on all forestlands, 3) the rules and BMPs that address 18 road drainage were inadequate, and 4) while forest landowners would continue to be 19 required to do road maintenance, there would be no requirements for RMAPs and 20 schedule for completion of road repairs. 21
No Action Alternative 1-Scenario 1 (as well as Alternative 2 and Alternative 3) would 22 result in a continued low to moderate likelihood of road-related landslides because: 1) the 23 unstable slope screening process under the current Washington Forest Practices Rules is 24 more refined and relies on a more complete and specific set of definitions and 25 requirements for evaluating the potential for landslides than under the January 1, 1999 26 Washington Forest Practices Rules, 2) the Washington Forest Practices Rules and BMPs 27 that address road drainage are substantially strengthened over the January 1, 1999 28 Washington Forest Practices Rules, 3) RMAPs are required for forestland owners, and 29 4) training programs for identifying potentially unstable slopes are being implemented by 30 Washington DNR. Compared to No Action Alternative 1-Scenario 2, this group of 31 alternatives has a lower likelihood of road-related mass wasting. 32
Alternative 4 would result in the lowest likelihood of road-related landslides relative to 33 either scenario of the No Action Alternative 1 because: 1) there would be no net increases 34 in roads, 2) the rules and BMPs that address road drainage would be more protective than 35 the current Washington Forest Practices Rules, 3) RMAPs would be required in the 36 shortest timeframe, and 4) there would be a broader set of definitions of potentially 37 unstable slopes than under the other alternatives. 38
Draft EIS Geology, Soils, and
Erosional Processes 4-49
Chapter 4 Detailed Effects Analysis 1 No Action Alternative 1-Scenario 2 2 Under No Action Alternative 1-Scenario 2, it is assumed that the January 1, 1999 3 Washington Forest Practices Rules would govern forest practices. No Action Alternative 4 1-Scenario 2 would be the least protective of the alternatives in terms of avoidance of 5 unstable slopes. As discussed above under Road Surface Erosion, RMAPs would not be 6 required over the long term under No Action Alternative 1-Scenario 2. The construction 7 of roads on potentially unstable slopes increases the probability of road-related failures 8 (Swanson et al. 1987). The mechanisms for identifying potentially unstable slopes and 9 landforms were not comprehensive under the January 1, 1999 Washington Forest 10 Practices Rules, and definitions were incomplete. The likelihood of not identifying 11 potentially unstable slopes due to inadequate screening would be high under this 12 alternative. However, under this scenario, Watershed Analysis may be conducted more 13 frequently than under the current Washington Forest Practices Rules and may reduce the 14 potential for road building on unstable slopes. Watershed Analysis is effective at 15 identifying unstable slopes, and at defining suitable prescriptions that would minimize the 16 potential of failure due to roads, when it is applied. 17
Landforms with a high potential for mass wasting would most likely be identified in 18 forest practices applications, or in subsequent reviews, and classified as Class IV-Special. 19 A Class IV-Special forest practices application covers practices where there is a potential 20 for substantial impact to the environment such as aquatic habitat, water quality, and 21 cultural resources. 22
The January 1, 1999 Washington Forest Practices Rules also have few specific guidelines 23 that directly address road-related mass wasting issues such as road drainage. Road-24 related landslides can be caused by road drainage problems such as plugged culverts and 25 inadequately spaced cross drains and/or road construction on potentially unstable slopes 26 (Rashin et al. 1999; USDA Forest Service 2001). Problems can result from inadequate 27 construction and maintenance. The rules under No Action Alternative 1-Scenario 2 28 require culverts and bridges to pass a 50-year flow event. Cross drains are only required 29 every 600 to 1,000 feet depending on road gradient. Rashin et al. (1999) concluded that 30 the most common drainage problems that caused resource damage to streams were 31 undersized culverts and inadequate cross drain spacing; the most common maintenance 32 related drainage problem was the maintenance of functional inlets (i.e., the drains from 33 roadside ditches that divert water under the road through a culvert). 34
In addition, the January 1, 1999 Washington Forest Practices Rules do not address 35 drainage onto unstable slopes. Road drainage onto unstable areas can initiate mass 36 wasting and the drainage onto unstable areas may not be identified when a forest 37 practices application is reviewed; thus, a road built on stable ground may drain water 38 onto potentially unstable areas. The drainage of water onto steep slopes can increase the 39 likelihood of slope failure (USDA Forest Service 2001). Where Watershed Analysis is 40 conducted, the prescriptions for mass wasting could address and reduce the likelihood of 41 road-related landslides. 42
Geology, Soils, and Draft EIS Erosional Processes
4-50
Chapter 4 Studies by Toth (1991) and Oregon Department of Forestry (1999a) found that newer 1 roads (younger than 10 years old) experienced a lower rate of mass wasting than older 2 roads. Because there is no requirement under No Action Alternative 1-Scenario 2 to 3 upgrade roads to current construction standards unless a public resource has been 4 damaged or there is a potential for damage to a public resource, the thousands of miles of 5 older roads (both active and inactive) and orphan roads that currently exist in statewide 6 forests could continue to fail over time and likely deliver large quantities of sediment to 7 the drainage network. If active or inactive roads are damaging public resources, the 8 Washington DNR would have the authority to require the repair of these roads under this 9 alternative. 10
No Action Alternative 1-Scenario 1, Alternative 2, and Alternative 3 11 Note: The reviewer is reminded to consider the differences in effectiveness over time of 12 the adaptive management programs among this group of alternatives (No Action 13 Alternative 1-Scenario 1[low], Alternative 2 [high], Alternative 3 [moderate]) in 14 evaluating the effects discussed below (subsection 4.1.5, Adaptive Management). 15
No Action Alternative 1-Scenario 1, Alternative 2, and Alternative 3 would provide more 16 protection and result in a lower likelihood of road-related landslides than under No 17 Action Alternative 1-Scenario 2. The identification and definitions of potentially 18 unstable slopes and landforms have improved substantially in the current rules (which 19 would be in place under No Action Alternative 1-Scenario 1, Alternative 2, and 20 Alternative 3), compared with the January 1, 1999 Washington Forest Practices Rules 21 (which would be in place over the long term under No Action Alternative 1-Scenario 2). 22 All Forest Practices applications would be screened for potentially unstable slopes and 23 landforms. Field verification requirements and qualifications of personnel who may field 24 verify and design mitigation are codified under the current Washington Forest Practices 25 Rules (WAC 222-10-030, 222-16-050(1)(d); Washington Forest Practices Board Manual 26 2000, Section 16) and would continue to be in effect. The Washington DNR has 27 implemented a training program for identification of potentially unstable slopes and 28 landforms and this would continue; however, there is a high likelihood that funding 29 would not be adequate to continue the training program under No Action Alternative 1-30 Scenario 1 and may not be adequate under Alternative 3. 31
As would be the case under any of the alternatives, new roads built on potentially 32 unstable slopes would require greater scrutiny if the forest practices application is 33 processed as a Class IV-Special. Class IV-Special applications currently require a 34 specific Washington State Environmental Policy Act (SEPA) review including a site 35 evaluation by a qualified expert and a detailed mitigation plan. However, a more refined 36 screening method would be used to identify potentially unstable slopes during forest 37 practices application reviews so that these slopes are more likely to be identified. This 38 more refined screening process would reduce the likelihood of road construction on high 39 hazard mass wasting areas and reduce the potential of failure on slopes and landforms 40 with a high potential for failure. As under the current rules (No Action Alternative 1-41 Scenario 1 and Alternatives 2 and 3), roads would often be located away from unstable 42
Draft EIS Geology, Soils, and
Erosional Processes 4-51
Chapter 4 slopes to avoid resource impacts, minimize forest practices application approval time for 1 road building, and reduce the costs associated with building on unstable areas. 2
Road drainage rules under No Action Alternative 1-Scenario 1 (and Alternatives 2 and 3) 3 would reduce over time drainage-related road failures such as plugged culverts, 4 particularly relative to No Action Alternative 1-Scenario 2. More specific BMPs 5 currently exist in the Washington Forest Practices Board Manual (Scenario 1) that 6 address road drainage than under the January 1, 1999 Washington Forest Practices Rules 7 (Scenario 2). Some of these include: outsloping roads so runoff drains onto slopes, more 8 frequent cross-drain spacing, and installation of new culverts that can pass a 100-year 9 flow event. Maintenance BMPs include removing debris from culvert outlets and inlets 10 after major storm events and preventative ditch maintenance. 11
While under No Action Alternative 1-Scenario 1 (and Alternatives 2 and 3) the 12 Washington Forest Practices Rules and Board Manual do not explicitly consider that 13 roads located on stable slopes may drain onto potentially unstable slopes (e.g., a ridge-top 14 road that drains water onto convergent headwalls) without initiating a Class IV-Special 15 application, the Washington DNR can use conditioning authority to screen for unstable 16 slopes, thus helping to mitigate for this potential impact. 17
Under No Action Alternative1-Scenario 1 (and Alternatives 2 and 3), existing culverts 18 would be replaced unless they meet the following three requirements: 1) pose “little risk 19 to public resources,” 2) “have been properly maintained,” and 3) are “capable of passing 20 fish” (WAC 222-24-050). The Washington Forest Practices Rules regarding RMAPs are 21 intended to prevent failure of existing culverts by requiring maintenance and replacement 22 of culverts that pose a substantial threat to public resources. Many culverts exist on Type 23 Np and Ns streams. If damage to public resources is imminent, DNR can require that the 24 existing culvert must be replaced sooner, rather than at the end of its lifespan. 25
The current Washington Forest Practices Rules under No Action Alternative 1-Scenario 1 26 (and Alternatives 2 and 3) require large forest landowners to upgrade all roads on their 27 ownership to current construction standards by 2016 (WAC 222-24-050). RMAPs would 28 describe the landowner’s intended strategies to improve all roads to current construction 29 standards set forth in WAC Chapter 222-24. The current rules are consistent with 30 standards studied by Toth (1991) and Oregon Department of Forestry (1999a), which 31 demonstrate that they have a much lower rate of mass wasting (e.g., failure) than older 32 roads constructed under older standards. 33
Small forest landowners are required to address road-related problems at the time they 34 submit a forest practices application to the DNR. Culvert repairs are prioritized within a 35 watershed so that the repairs that provide the greatest benefits to aquatic resources are 36 fixed first and generally based on available public funding. 37
Under No Action Alternative 1-Scenario 1 (and Alternative 2 and 3), the implementation 38 of RMAPs for large landowners would substantially reduce the likelihood of road-related 39 landslides compared to No Action Alternative 1-Scenario 2. Orphan roads would be 40 inventoried and assessed. After the inventory and assessment, an evaluation would be 41
Geology, Soils, and Draft EIS Erosional Processes
4-52
Chapter 4 made to determine the scope of the problem presented by the orphan roads, and if cost-1 sharing would be needed to repair the orphan roads problems. Where orphan roads are 2 abandoned, further reduction of potential mass failure of roads, sediment delivery to 3 streams, and potential debris torrent initiation would occur. No Action Alternative 1-4 Scenario 1 (and Alternatives 2 and 3) would preserve the existing process for RMAPs, 5 assessment of orphan roads, and maintain current rules protecting potentially unstable 6 slopes. 7
Alternative 4 8 Under Alternative 4, the likelihood of road-related mass wasting would be lower than 9 either scenario under No Action Alternative 1. Alternative 4 includes a “no net increase” 10 rule for forest roads within a basin. The “no net increase” in roads on a per unit area 11 basis would reduce the probability of failure because fewer additional roads would be 12 constructed, and some roads would be eliminated. Whenever a new road is proposed, an 13 equivalent amount of road on the same property or the same basin would have to be 14 abandoned using the abandonment guidelines in the current Washington Forest Practices 15 Rules. Alternative 4 also has an even more conservative approach to unstable landforms 16 than the current rules: all slopes greater than 80 percent are considered high hazard. 17 Rules would require no-harvest on these slopes in addition to a 50-foot no-harvest buffer 18 around high hazard slopes. Also, activities on slopes greater than 50 percent would 19 trigger the SEPA review process and be classified as a Class IV–special forest practices 20 application. Additionally, Alternative 4 would not have different requirements for 21 RMAPs for small landowners and would require that RMAPs be implemented by 2011, 22 rather than 2016, and would not have a 20-acre parcel exemption. 23
The shorter time period for RMAPs, which include orphan roads, decreases the likelihood 24 of mass wasting because the potential for failure of older roads would be reduced by five 25 years. Roads on stable slopes that drain onto potentially unstable slopes would not be 26 classified as Class IV-Special applications, resulting in the same likelihood of mass 27 wasting from this impact as under No Action Alternative 1-Scenario 1. Alternative 4 28 would result in an overall reduction of road-related sediment from entering the drainage 29 network. 30
Landslides Related to Timber Harvest 31 Overview of Effects 32 This subsection evaluates the alternatives in terms of the likelihood of timber harvest-33 related landslides. A summary comparison of the effects of the alternatives is provided in 34 the next few paragraphs, and a detailed analysis of the effects is provided by alternative, 35 in the following subsections. 36
There are no comprehensive statewide data available for historical or current landslide 37 frequency due to timber harvest compared to natural levels. However, the January 1, 38 1999 Washington Forest Practices Rules were much more protective of unstable slopes 39 than historic rules (subsection 3.4.2.3, History of Forest Practices Affecting Erosion and 40 Sedimentation); therefore, it is likely that the frequency of timber harvest-related mass 41
Draft EIS Geology, Soils, and
Erosional Processes 4-53
Chapter 4 wasting events would be reduced under any of the alternatives relative to historic 1 conditions. 2
No Action Alternative 1-Scenario 2 would result in a return to January 1, 1999 3 Washington Forest Practices Rules. As such, the likelihood of harvest-related landslides 4 and damage to public resources (including surface water quality and habitat) would 5 increase from the status quo, be higher than under No Action Alternative 1-Scenario 1, 6 and be highest relative to all other alternatives because: 1) under the January 1, 1999 7 Washington Forest Practices Rules the unstable slope screening process did not identify 8 some unstable areas, and 2) there would be no comprehensive screening process required 9 to identify unstable areas on all forestlands. Additionally, No Action Alternative 1-10 Scenario 2 would result in an increased likelihood of harvest-related landslides delivering 11 to streams relative to the other alternatives, primarily due to the low frequency of RMZ 12 protection along steep Type 4 and 5 streams. 13
No Action Alternative 1-Scenario 1 (and Alternatives 2 and 3) would provide the same 14 current levels of protection and more protection than under No Action Alternative 1-15 Scenario 2 because: 1) the unstable slope screening process would be more refined and 16 rely on a more complete and specific set of definitions and requirements for the 17 evaluation of landslides than under the January 1, 1999 Washington Forest Practices 18 Rules, and 2) training programs for identification of potentially unstable slopes would be 19 implemented by the Washington DNR (although funding for this training may disappear 20 over time under No Action Alternative 1-Scenario 1 and may be reduced over time under 21 Alternative 3). While No Action Alternative 1-Scenario 1, Alternative 2, and Alternative 22 3 would provide greater protection for sediment delivery relative to No Action 23 Alternative 1-Scenario 2, this group of alternatives would still result in a slight to 24 moderate likelihood of harvest-related landslides delivering to streams. 25
Alternative 4 would provide the greatest protection for potentially unstable slopes and 26 landforms compared to either scenario of No Action Alternative 1, because: 1) there 27 would be a broader set of definitions of potentially unstable slopes, and 2) the amount of 28 protection and buffered area would increase on and around potentially unstable areas. 29 Thus, Alternative 4 would likely have a lower rate of harvest-related landslides relative to 30 either scenario of the No Action Alternative 1. 31
Detailed Effects Analysis 32 No Action Alternative 1-Scenario 2 33 Under No Action Alternative 1-Scenario 2, some landforms with a high potential for 34 mass wasting would most likely be identified during processing of the forest practices 35 application. However, there would be little incidental protection of potentially high 36 hazard slopes because there would be no RMZs for Type 4 and 5 waters, which constitute 37 approximately 50 to 60 percent of all streams on the landscape (DEIS Appendix B). 38 RMZs of fish-bearing typed waters (Type 1, 2, and 3) provide some incidental protection 39 of areas with a high mass wasting potential; however, short-term losses to windthrow 40 may impair the effectiveness of these buffers by reducing stand density and causing soil 41 disturbance, and therefore reducing the filtering capacity of the buffer in the short term. 42
Geology, Soils, and Draft EIS Erosional Processes
4-54
Chapter 4 Under No Action Alternative 1-Scenario 2, the only protection provided for small tributary 1 junctions and steep channel gradients would be if they triggered a Class IV-Special 2 application based on the likelihood of being unstable and having a potential to substantially 3 impact a public resource. Because these areas receive no specific protection under the 4 January 1, 1999 Washington Forest Practices Rules, there is a moderate likelihood of 5 debris torrents. The steep small tributary streams tend to be first- and second-order streams 6 that would be Type 4 and 5 waters (See Glossary). Except for very limited situations, these 7 streams have no buffers to protect them from management activities. 8
Once a debris flow is initiated, RMZs along high order streams may act to reduce channel 9 impacts. The streams most susceptible to riparian damage by channelized debris flows 10 tend to have gradients greater than 20 percent (Coho and Burges 1991). On the westside, 11 most streams with gradients greater than 20 percent are Type 4 and 5 waters (DEIS 12 Appendix B); these streams would receive no riparian buffers that might help mitigate 13 impacts from channelized debris flows under No Action Alternative 1-Scenario 2. Lower 14 gradient streams (Types 1-3) would receive some protection from debris flow impacts 15 and sediment input. An assumption of a “fencing effect” on landslide “runout,” 16 deposition, and sedimentation is based on the observations of Johnson et al. (2000) of 17 landslides that occurred immediately following a single storm event of more than 300 18 landslides on Prince of Wales Island, Alaska. A “fencing effect” results from standing 19 riparian trees that serve as roughness elements, which slow the landslide travel rate and 20 reduce the travel distance (i.e., “runout”). Landslides studied that started and remained in 21 old-growth forests were more likely to split or remain unchannelized, contained more 22 woody debris, and had less erosion and more deposition along the runout zone compared 23 to landslides that occurred in clearcuts without riparian buffers. The authors estimated 24 that more fine sediment would migrate further down tributary channels to mainstem 25 channels as a result of less woody debris and depositional features along the runout path. 26
No Action Alternative 1-Scenario 1, Alternative 2, and Alternative 3 27 Note: The reviewer is reminded to consider the differences in effectiveness over time of 28 the adaptive management programs among this group of alternatives (No Action 29 Alternative 1-Scenario 1[low], Alternative 2 [high], Alternative 3 [moderate]) in 30 evaluating the effects discussed below (subsection 4.1.5, Adaptive Management). 31
Relative to No Action Alternative 1-Scenario 2, No Action Alternative 1-Scenario 1 (and 32 Alternatives 2 and 3) would provide more specific definitions of potentially unstable 33 slopes and landforms. Under this group of alternatives, all forest practices applications 34 would be screened for potentially unstable slopes and landforms. Field verification 35 requirements and qualifications of personnel who may field verify and design mitigation 36 would remain codified (WAC 222-10-030, 222-16-050(1)(d); Washington Forest 37 Practices Board Manual 2000, Section 16), and the Washington DNR would continue 38 implementing a training program for identification of potentially unstable slopes and 39 landforms (although funding for this training may disappear over time under No Action 40 Alternative 1-Scenario 1 and may be reduced over time under Alternative 3). As would 41 be the case under any of this group of alternatives, new roads built on potentially unstable 42 slopes would require greater scrutiny if the forest practices application is processed as a 43
Draft EIS Geology, Soils, and
Erosional Processes 4-55
Chapter 4 Class IV-Special. Class IV-Special applications currently require a specific SEPA review 1 including a site evaluation by a qualified expert and a detailed mitigation plan. A more 2 refined screening method would be used to identify potentially unstable slopes during 3 forest practices application reviews so that these slopes are more likely to be identified. 4 This more refined screening process would account for regional and local variations in 5 soils, geology, and topography. Because of the screening tools that trigger Class IV-6 Special (e.g., the slope morphology model (SMORPH), improved definitions in the 7 Washington Forest Practices Board manual, as well as review of the application by 8 qualified Washington DNR personnel familiar with the landslide hazards in the area) it 9 would be more likely that potentially unstable slopes would be identified, and more 10 applications would be classified as Class IV-Special by the Washington DNR. As a 11 result, more landowners would modify their applications to avoid unstable slopes and 12 thereby avoid the requirements of a Class IV-Special application. 13
Under No Action Alternative 1-Scenario 1 (and Alternatives 2 and 3), areas of high 14 susceptibility to debris torrents (i.e., steep tributary channels) would receive greater 15 protection than under No Action Alternative 1-Scenario 2. If the areas of high 16 susceptibility are on specific high hazard landforms and have the potential to deliver 17 sediment to a public resource or threaten public safety, the forest practice would be a 18 Class-IV Special, and mitigation would be necessary for the management activity to 19 occur. Also, sensitive areas such as headwall and sideslope seeps, springs, and Type Np 20 confluences would receive a 56-foot radius no-harvest buffer in western Washington and 21 a 50-foot no-harvest buffer in eastern Washington. Seasonal non-fish-bearing streams 22 (Type Ns), as well as the unbuffered portions of perennial streams (Type Np) would 23 continue to receive protection from Equipment Limitation Zones. Management activities 24 are allowed in Equipment Limitation Zones, but with specific mitigation requirements for 25 any soil disturbance greater than 10 percent of the Equipment Limitation Zone area. 26 Local buffer effectiveness may be impaired in some cases due to short-term losses to 27 windthrow. There is still a moderate likelihood of debris torrents initiation because of 28 potential for management activity in areas of susceptibility. 29
Under No Action Alternative 1-Scenario 1 (and Alternatives 2 and 3), approximately 75 30 percent of streams less than 20 percent gradient would have Type S and F buffers, and 25 31 percent would have Type N buffers (DEIS Appendix B). These buffers would provide 32 some, but not necessarily full protection in the form of a fencing effect for debris torrents, 33 and may be subject to short-term losses to windthrow. As a result, these alternatives would 34 have a slight to moderate likelihood of harvest-related landslides delivering to streams. 35 Alternative 4 36 Under Alternative 4, potentially high hazard areas identified during forest practices 37 application review would automatically trigger a Class IV-special classification, would 38 be treated as a no-harvest area, and would be protected by a 50-foot no-harvest buffer 39 around the perimeter of the unstable slope or landform. Alternative 4 provides the most 40 protection from mass wasting and delivery of sediment to streams due to timber harvest 41 relative to both scenarios in No Action Alternative 1. Alternative 4 also anticipates 42 further rule development for areas of moderate potential slope instability. 43
Geology, Soils, and Draft EIS Erosional Processes
4-56
Chapter 4 The no-harvest RMZs under Alternative 4 would protect steep stream channel junctions. 1 This would probably reduce the frequency and downstream impacts of debris torrents. 2 Also, under Alternative 4, no timber harvest or road activity is permitted on high hazard 3 slopes. Incidental protection of steep tributary junctions would also be provided if the 4 tributary junction areas are considered high hazard mass wasting areas. Streams with 5 channel gradients of 20 to 30 percent would receive 100-foot buffers, and streams with 6 gradients greater than 30 percent would receive 70-foot buffers. Further, Channel 7 Disturbance Zone buffers would be retained along steep streams that have a high 8 potential for channelized landslides. These buffers should provide partial protection for 9 streams from potential sediment inputs. Because buffer widths are wider under 10 Alternative 4, they are more likely to be windfirm and thus more likely to function 11 without short-term losses to blowdown. 12
Streambank Stability 13 Overview of Effects 14 The effects of the alternatives on streambank stability are based on RMZ widths and 15 activities allowed within the RMZ, or the stream channel that may affect root strength 16 and, thus, streambank integrity are summarized here and analyzed in more detail in the 17 following subsections. 18
No Action Alternative 1-Scenario 2 would generally provide protection for bank stability 19 and integrity along Type 1, 2, and 3 streams. However, bank stability would not be 20 protected along Type 4 and 5 streams; therefore, increased high bank instability is likely 21 along these small streams. Because of the amount of historic logging to streambanks, it 22 is likely that even this alternative would result in an improvement in bank stability 23 relative to historic conditions in riparian zones of the State. 24
No Action Alternative 1-Scenario 1, (and Alternatives 2 and 3) would also protect bank 25 stability along fish-bearing streams and many non-fish-bearing streams, except along 26 those non-fish-bearing streams that lack RMZs. Felling and yarding activities that occur 27 in and across these steam channels would further compromise bank stability in non-fish-28 bearing streams lacking RMZs. However, some protection would be provided by 29 Equipment Limitation Zones. This group of alternatives would be expected to provide 30 more protection for bank stability than No Action Alternative-Scenario 2. 31
Alternative 4 would fully protect bank stability along all streams by requiring no-harvest 32 riparian buffer zones of at least 70 feet along all streams. Under Alternative 4, bank stability 33 protection would be expected to be substantially more than under No Action Alternative 1-34 Scenario 2, and somewhat more than under No Action Alternative 1-Scenario 1. 35
Detailed Effects Analysis 36 No Action Alternative 1-Scenario 2 37 In western Washington, No Action Alternative 1-Scenario 2 (January 1, 1999 38 Washington Forest Practices Rules) would fully maintain streambank stability based on 39 the RMZ buffer widths for Type 1, 2, and 3 streams when the maximum RMZ widths are 40 implemented and no harvest occurs within the RMZ. However, the minimum RMZ 41 width of 25 feet does not meet the one-half crown diameter (0.3 site potential tree height) 42
Draft EIS Geology, Soils, and
Erosional Processes 4-57
Chapter 4 required for complete maintenance of streambank stability as described by FEMAT 1 (1993, p. V-27) (Figure 4.4-3). For each stream type, RMZ width can vary depending on 2 the extent of wetland vegetation and the width needed to meet shade requirements, from a 3 minimum of 25 feet to a maximum of 200 feet (Figures 2-1 and 2-2). In cases where 4 shade requirements are met, selective harvest could occur adjacent to the stream channel, 5 compromising rooting strength and increasing the likelihood of impacts to the 6 streambank. However, a greater number of leave trees are provided in RMZs along less 7 stable stream channels (i.e., gravel/cobble channels) and this aspect may slightly reduce 8 the likelihood of negative effects. For streams that do not meet the established criterion 9 of one-half crown diameter (0.3 site potential tree height), combined with the selective 10 harvest prescriptions, the likelihood of reducing root strength and, therefore, streambank 11 stability, would increase. This is because January 1, 1999 rules offered only minimal 12 streambank protection by requiring operators to avoid disturbance of brush, stumps, and 13 trees that display large root systems embedded in the bank in the RMZ core zone for 14 Type S and F waters, and RMZs for Type Np waters. 15
Figure 4.4-3. Percent Effectiveness of Root Strength in Relation to the Distance 16 from the Stream Channel. 17
18 19 20
21
Source: FEMAT 1993
Geology, Soils, and Draft EIS Erosional Processes
4-58
Chapter 4 In eastern Washington, streambank stability would be fully maintained along Type 1, 2, 1 and 3 streams when the maximum and average RMZ widths are implemented. Site class 2 I would require a wider RMZ to provide a sufficient width buffer to maintain streambank 3 stability. However, minimum RMZ widths of 30 feet would fully maintain streambank 4 stability for all other site classes (Figure 4.4-3). In both western and eastern Washington, 5 the possibility of harvest activity within the RMZ under No Action Alternative 1-6 Scenario 2 leaves the possibility that root strength would be compromised and the 7 streambank potentially damaged. However, selective harvest does maintain some 8 streambank integrity through root strength and minimizes further streambank damage 9 relative to clearcutting, as would the requirement to avoid disturbing brush and stumps, 10 including their root systems (WAC 222-30-030). 11
The greatest potential for adverse effects is for Type 4 and 5 streams that would have no 12 leave tree requirements, and where timber harvest and yarding could occur adjacent to, 13 in, and across the stream. For Type 4 and 5 waters, RMZs would not be required except 14 for site-specific conditions and, in this case, would not exceed 25 feet. Therefore, RMZs 15 under the January 1, 1999 Washington Forest Practices Rules for Type 4 and 5 streams 16 would not meet the one-half crown diameter (0.3 site potential tree height) required for 17 complete protection as described in FEMAT (1993, pV-27). Type 4 and 5 streams are 18 small, tend to be moderately or highly confined, and have less erosive power; therefore, 19 they do not necessarily require expansive buffers for streambank stability maintenance. 20 However, Type 4 and 5 streams are susceptible to other processes such as mass wasting 21 and peak flows, which could affect streambank stability. The lack of an RMZ along most 22 of these smaller streams means that Type 4 and 5 waters would receive no streambank 23 stability protection. Further, streambank stability could be severely compromised when 24 felling and yarding are allowed in, or across, Type 4 and 5 streams and when logging 25 slash is allowed to remain in streams following logging. 26
No Action Alternative 1-Scenario 1, Alternative 2, and Alternative 3 27 Note: The reviewer is reminded to consider the differences in effectiveness over time of 28 the adaptive management programs among this group of alternatives (No Action 29 Alternative 1-Scenario 1[low], Alternative 2 [high], Alternative 3 [moderate]) in 30 evaluating the effects discussed below (subsection 4.1.5, Adaptive Management). 31
Under No Action Alternative 1-Scenario 1 (and Alternatives 2 and 3), existing forest 32 practices rules would continue. Under these rules all Type S and F streams would have 33 RMZ widths that exceed the width recommended by FEMAT (1993, p. V-26) for full 34 maintenance of streambank stability. On the westside, the 50-foot no-harvest zone 35 adjacent to the streambank (or Channel Migration Zone) combined with the selective 36 harvest inner zone under Management Option 1 (as described in Chapter 2, for F and S 37 streams, calls for thinning from below in the inner zone and 20 riparian leave trees per 38 acre in the outer zone), should provide sufficient rooting strength to fully maintain 39 streambank stability. Additional protection due to the no-harvest floor adjacent to the 40 50-foot no-harvest zone under Management Option 2 would provide even greater 41 maintenance of streambank stability (as described in Chapter 2, for S and F streams, 42 enough Riparian Leave Trees must be left in the inner zone to meet the Stand 43
Draft EIS Geology, Soils, and
Erosional Processes 4-59
Chapter 4 Requirements, plus an additional 20 Riparian Leave Trees per acre in the outer zone. If 1 the no-harvest restriction in the core zone results in conditions that would exceed the 2 Stand Requirements, fewer trees may be left in the outer zone) On the eastside, the 30-3 foot no-harvest zone adjacent to the streambank (or Channel Migration Zone) combined 4 with the selective harvest inner zone should fully maintain streambank stability. Overall, 5 these three alternatives would provide substantially more protection of streambank 6 integrity than No Action Alternative 1-Scenario 2 along Type S and F streams. 7
Under No Action Alternative 1-Scenario 1 (and Alternatives 2 and 3), at least 50 percent 8 of a Type Np streams’ length would receive a 50-foot RMZ (DEIS Appendix B); and 9 these segments would have most of the protection required to maintain bank stability, 10 according to FEMAT (1993). In addition, Type Np streams are much smaller, tend to be 11 moderately or highly confined, and have less erosive power than Type S or F streams, 12 therefore, they do not necessarily require extensive buffers to maintain streambank 13 stability. For other segments of Type Np streams and for all Ns streams, no RMZ would 14 be provided except in cases where trees are retained for the protection of unstable slopes. 15 However, all Type N streams would receive some protection because of the 30-foot 16 Equipment Limitation Zones that would be implemented. These zones would provide 17 substantially more protection than conditions under No Action Alternative 1-Scenario 2. 18 However, as under No Action Alternative 1-Scenario 2, the lack of an RMZ restricting 19 timber harvest on these smaller streams means that some Type Np and all Ns streams 20 would not receive complete bank stability protection. 21
Alternative 4 22 Under Alternative 4, the RMZ width and no-harvest requirements in the RMZs would 23 meet or exceed the current recommendations in the literature (0.3 site potential tree 24 height no-harvest buffers) for full maintenance of streambank stability on most streams. 25 According to FEMAT (1993), all streams on both the east and westside would be 26 completely protected (Figures 2-1 and 2-2). In addition, where there are small channels 27 that have potential slope stability issues, Channel Disturbance Zone buffers would 28 provide additional protection (Table 2-15). Thus, under Alternative 4, greater bank 29 stability protection would be expected compared to No Action Alternative 1-Scenario 2, 30 and somewhat more than under No Action Alternative 1-Scenario 1. 31
32
33
Geology, Soils, and Draft EIS Erosional Processes
4-60
Chapter 4 This page is intentionally left blank. 1
2
Draft EIS Water Resources
4-61
Chapter 4
4.5 WATER RESOURCES 1 Water resources include groundwater and surface water resources. Water occurring in 2 the hyporheic zone, defined as the zone of mixing between groundwater and surface 3 water along a stream system, is also discussed in this subsection, as it can contribute to 4 either surface water or ground water quality or quantity. It is also discussed in subsection 5 4.8 (Fish and Fish Habitat) as a habitat component. 6
4.5.1 Surface Water Quality 7 Effects on surface water quality are discussed in terms of effects on temperature, 8 sediment and turbidity, dissolved oxygen concentration, level of contamination by 9 pesticides (insecticides, herbicides, and fungicides), and nutrient concentrations. 10
4.5.1.1 Evaluation Criteria 11 Temperature 12 Many factors can influence stream temperature, such as shade, air temperature, 13 groundwater inflow, channel width, ratios of channel width to channel depth, and 14 watershed conditions (Brosofske et al. 1997; Johnson and Jones 2000; Bartholow 2002; 15 Macdonald et al. 2003; Sridhar et al. 2004; Curry et al. 2004). Forest practices can 16 reduce canopy cover near streams, which can lead to an increase in solar radiation and 17 increased stream temperatures along unshaded reaches (FEMAT 1993; Brosofske et al. 18 1997). Temperatures in small streams were documented by Johnson and Jones (2000) in 19 a paired basin study to return to pre-harvest conditions after 15 years following harvest, 20 regardless of the presence of riparian buffers. 21
The amount of temperature increase due to lack of shade and the downstream impacts of 22 surface water warming from upstream areas depends on the combined effects of 23 watershed and stream surface and subsurface hydrologic conditions (Johnson and Jones 24 2000; Curry et al. 2004), but the effect of increased solar radiation due to a lack of 25 riparian buffer can be demonstrated and modeled to be a significant local and 26 downstream factor affecting stream temperatures, especially with respect to increases in 27 daily temperature maxima (FEMAT 1993; Johnson and Jones 2000; Bartholow 2002; 28 Sridhar et al. 2004). Water temperature total maximum daily loads (TMDLs) developed 29 for streams and rivers in Washington have predicted that it will take between 50 and 80 30 years, depending on location and type of riparian vegetation, to achieve natural 31 temperature conditions that existed prior to timber harvest (Personal Communication, 32 Laurie Mann, Environmental Protection Agency, September 13, 2004). 33
The evaluation criterion for stream water temperature is the retention of streamside shade 34 during and after timber harvest activities to ensure no temperature increase from 35 increased solar radiation. For comparison the conservative approach of measuring the 36 alternatives against the potential for change in short wave solar radiation is taken because 37 changes in solar radiation have been demonstrated to be a primary factor controlling 38 changes in stream temperature following harvest, even though it may not be the only 39 factor (forestry or non-forestry related) affecting changes in stream temperature for a 40 given watershed or reach (Johnson and Jones 2000; Bartholow 2002). A no-harvest 41
Water Resources Draft EIS
4-62
Chapter 4 buffer width of 0.75 site potential tree height is used as the criterion to evaluate the 1 effectiveness of RMZs to maintain shade for streams greater than 5 feet in width, based 2 on the shading curve from FEMAT (1993, p V-27). For streams less than 5 feet in width, 3 the analysis will consider this factor plus the protection of seeps, springs, other sensitive 4 sites, and stream-adjacent unstable slopes. 5
Incidental protection of hyporheic zones on large streams with alluvial channels and 6 active Channel Migration Zones may protect stream temperatures in these reaches in 7 addition to shade protection for surface waters. Conduction between substrate and soil 8 materials near streams has been inferred to account for a portion of the energy input to 9 surface waters (Johnson and Jones 2000). 10
Sediment and Turbidity 11 The evaluation criterion for sediment-related water quality parameters is the overall 12 reduction in sediment delivery to streams from management activities, meaning the 13 degree to which the alternatives would reduce sediment delivery from existing forestry-14 related sources and minimize sediment delivery from future forestry-related sources. 15 Reduction in sediment delivery to surface waters could be achieved by reduction in 16 chronic erosion sources such as surface erosion and episodic sediment deposition (i.e., 17 mass wasting) associated with timber harvest (Dhakal and Sidle 2003); and road 18 construction, road use, road maintenance, and road abandonment (Rashin et al. 1999). 19
Turbidity, an optical measure of water clarity, is affected by the amount of fine 20 suspended sediment in water, but can also be related to the amount of organic acids 21 (tannins), and other organic materials that might be dissolved in water, causing lowered 22 water clarity even under undisturbed watershed conditions. Therefore, for the purposes 23 of regulation, allowable turbidity changes are relative to background. For the purposes of 24 this analysis, turbidity would be considered together with suspended and bedload 25 sediment. 26
Dissolved Oxygen and Nutrients 27 Fish can be adversely affected by decreases in dissolved oxygen, as discussed in 28 subsection 3.8.3.8 (Dissolved Oxygen). The evaluation criteria for dissolved oxygen 29 focuses on how well each of the alternatives protect water resources from decreases in 30 dissolved oxygen that would be harmful to fish (subsection 3.8, Fish and Fish Habitat). 31 The analysis is based on an assessment of relative effects on stream temperature and 32 excess nutrient input as a function of proposed buffer widths under each alternative. 33 Temperature has a direct physical effect on the concentration of dissolved oxygen in 34 water (Washington Department of Ecology 2002c). Dissolved oxygen concentration 35 decreases as temperature increases up to the boiling point of water at 1 bar of pressure. 36 The thermodynamic explanation for this phenomenon is that gases have negative 37 entropies of solvation, meaning that gases become more ordered (due to loss of volume) 38 when dissolved in water than in a gaseous phase (Levine 1995). 39
Stream complexity and flow circulation are also relevant factors contributing to dissolved 40 oxygen. Nutrients such as those derived from leaf and needle litter in surface waters and 41 dissolved nutrients from hyporheic zones are beneficial to fish, as discussed in subsection 42
Draft EIS Water Resources
4-63
Chapter 4 3.8.3.5 (The Aquatic Food Chain). However, excess nutrients due to wind drift or runoff 1 from application of fertilizers may lead to adverse effects in terms of overproduction of 2 stream organisms (e.g., algae) and consequent short-term decreases in dissolved oxygen 3 (subsection 3.8, Fish and Fish Habitat). Dissolved oxygen can be decreased by fine 4 sediment input as well, if the fine sediment contains nutrient material, as discussed in 5 subsection 3.8 (Fish and Fish Habitat). In general, buffers for harvest activities and 6 fertilizer application should decrease the likelihood of low dissolved oxygen 7 concentrations in surface waters due to either reduced shade or increased nutrient input 8 by protecting riparian and hyporheic zone functions, filtering sediment, and providing for 9 re-areation through instream LWD (FEMAT 1993; CH2M Hill 2000). The buffers for 10 fertilizer application would not change under any alternative because fertilizer application 11 rules are unchanged in the January 1, 1999 Washington Forest Practices Rules and the 12 current Washington Forest Practices Rules. 13
Incidental protection of hyporheic zones on large streams with alluvial channels and 14 active Channel Migration Zones may help protect stream dissolved oxygen and nutrient 15 chemistry in these reaches from changes in the adjacent non-buffered areas (Naiman and 16 Bilby 1998). However, no explicit protection is given to hyporheic zones under any of 17 the alternatives. 18
Pesticides (Insecticides, Herbicides, and Fungicides) 19 The evaluation of forest pesticide applications focuses on how well each of the 20 alternatives would protect water resources from pesticide contamination (e.g., spray drift, 21 runoff, erosion, seepage to groundwater). In addition, the evaluation criteria take into 22 account how well the alternatives would protect riparian plants from damage caused by 23 pesticide applications. Finally, the criteria consider the potential impacts to fish and 24 aquatic life resulting from contamination of water resources in subsection 4.8 (Fish and 25 Fish Habitat). Note: The reader is reminded that forest chemical activities are not 26 included as a proposed covered activity in the State’s application for incidental take 27 authorization under Alternative 2, Alternative 3, and Alternative 4. 28
Several other laws and regulations, aside from the Washington Forest Practices Rules in 29 WAC 222-50, govern the application of pesticides. All alternatives are subject to forest 30 practices WAC 222-16-070 (pesticide uses with the potential for a substantial impact on 31 the environment), which helps determine if the forest practices application is a Class IV-32 Special. This preliminary process addresses the available information on the toxicity of 33 the specific pesticide and the potential impacts of the proposed applications. If under 34 WAC 222-16-070 the forest practice is found to be a Class IV-Special, additional 35 environmental precautions and SEPA review may be required. Additionally, the 36 Environmental Protection Agency (EPA) regulates the labeling, availability, and use of 37 pesticides and other forest chemicals. 38
An important consideration for this DEIS is that the Washington Forest Practices Rules 39 are not the single means of environmental protection for pesticide applications. The 40 analysis presented in this DEIS focuses on an evaluation of each alternative with the 41 purpose of making qualitative comparisons among the alternatives, with the caveat that 42
Water Resources Draft EIS
4-64
Chapter 4 regulations developed by Federal and State agencies may require wider buffers for 1 individual chemicals than Washington Forest Practices Rules do, or may further restrict 2 the use of certain chemicals (including pesticides and pesticide additives) for silvicultural 3 purposes. Regulations are continually being developed by EPA in consultation with the 4 Washington Department of Fish and Wildlife (WDFW), NMFS, and USFWS as new 5 pesticides and pesticide additives come on the market. The effectiveness of particular 6 pesticide buffers in preventing surface water contamination may be a result of site 7 conditions or weather conditions at time of application. Therefore, a “fully functional” 8 pesticide buffer cannot be defined for all current and future pesticide products. 9
In general, pesticide applications on forestlands are currently infrequent. On westside 10 State-managed lands, for example, pesticide application rates are reported as one to two 11 applications every 40 to 60 years (Washington DNR 2004c). Modern pesticide products 12 are generally designed to break down rapidly or bind to soil materials. Therefore, the 13 short term impact of spills, overspray, or erosion is considered to be more likely than the 14 long-term impact from pesticide applications on forestlands adjacent to surface water or 15 groundwater. 16
4.5.1.2 Evaluation of Alternatives 17 The effects of the alternatives on water quality parameters are analyzed in this subsection. 18 In reading this analysis, it should be remembered from Chapter 2 (Alternatives) that 19 under the No Action Alternative 1 no ITPs or ESA Section 4(d) take authorization would 20 be issued. However, this lack of action would likely affect the Forest Practices 21 Regulatory Program in a way that is difficult to predict. Therefore, two scenarios, which 22 represent the endpoints of the reasonable range of possible outcomes for the Forest 23 Practices Regulatory Program, have been defined (subsection 2.3.1, No Action 24 Alternative 1). The effects of No Action are displayed for both of these endpoints in the 25 following subsections, but the actual outcome and the actual effects of No Action on 26 water quality are likely to fall between these two scenarios. 27
The increased protection of riparian vegetation by requiring buffers during harvest 28 relative to historic timber practices has resulted in significantly improved riparian 29 function (subsection 3.5.1, Surface Water Quality; DEIS Appendix A). Improvement 30 over historical conditions for forested streams should generally continue or at least be 31 maintained as riparian vegetation matures regardless of which of the alternatives is 32 selected. However, the amount and rate of improvement, and short-term and long-term 33 effects may be influenced by alternative, depending on the parameter. 34
Temperature 35 Overview of Effects 36 This subsection evaluates the degree to which the alternatives are likely to produce 37 elevated stream temperatures. A summary comparison of the effects of the alternatives is 38 provided in the next few paragraphs, and a detailed analysis of the effects is provided by 39 alternative, in the following subsections. 40
Draft EIS Water Resources
4-65
Chapter 4 No Action Alternative 1-Scenario 2 has a low to moderate likelihood of producing stream 1 temperature increases along Type 1, 2, and 3 waters and a high likelihood along Type 4 2 and 5 waters. However, because of the current early-seral condition of most riparian 3 areas on the lands covered by Washington Forest Practices Rules (subsections 3.7.1.6, 4 Historic Protection of Riparian Areas, and 3.7.1.7, Current Condition of Riparian Areas), 5 this alternative would likely result in some improvement in the average level of shade 6 provided by riparian areas on covered lands over the long term. 7
No Action Alternative 1-Scenario 1 and Alternatives 2 and 3 have a low likelihood of 8 producing elevated water temperatures in Type S and F streams. There is a moderate to 9 high likelihood of elevated water temperatures in Type N streams. The effect of 10 temperature increases in non-fish-bearing streams on downstream fish-bearing streams is 11 uncertain, and could be important in watersheds with a high degree of past harvest or 12 already elevated stream temperature. Compared to current conditions, continued 13 statewide improvement in shade retention, and therefore stream temperature protection, is 14 expected under these alternatives, particularly within the bull trout overlay of eastern 15 Washington where additional shade trees are required to be left in the RMZs 16 (Washington Forest Practices Board 2001b, Section 1). Relative to No Action 17 Alternative 1-Scenario 2, this group of alternatives has considerably higher levels of 18 shade retention (particularly along Type Np streams), and therefore have a lower 19 likelihood of producing elevated stream temperatures. 20
Alternative 4 has a very low likelihood of stream temperature increases due to adequate 21 shade along all streams; this alternative has the lowest uncertainty of adverse effects on 22 stream temperature when compared to both scenarios of the No Action Alternative 1. 23 Compared to current conditions, it would result in long-term improvement and retention 24 of stream shade, and therefore, improvement in protection of stream temperatures. 25
Detailed Effects Analysis 26 No Action Alternative 1-Scenario 2 27 Under No Action Alternative 1-Scenario 2 (which would result in the January 1, 1999 28 Washington Forest Practices Rules), Type 1, 2, and 3 waters would generally receive 29 adequate shade protection regardless of RMZ width. Within the RMZ, the shade rule, 30 WAC 222-30-040, must be met before any harvest activity can occur within the RMZ. 31 The shade rule is based upon elevation of the stream and the water quality classification 32 of the stream (Class A or AA; Table 3-13). The shade rule reflects the fact that lower-33 elevation streams require more shade and higher elevations require less shade to meet 34 water quality standards. The shade rule is meant to achieve State water quality standards. 35 The shade rule limits harvest within RMZs by requiring specified levels of canopy 36 closure over streams at different elevations. Tree retention requirements within RMZs at 37 lower elevations tend to be greater than at higher elevations. 38
On the westside, the minimum RMZ width of 25 feet on Type 2 and 3 waters (some Type 39 1 waters have much wider buffers due to Shoreline Management Act requirements) does 40 not meet the 0.75 site potential tree height required for complete shade protection for any 41 site class (FEMAT 1993, pp V-27 through V-28). However, the shade rule is applied to 42
Water Resources Draft EIS
4-66
Chapter 4 the maximum RMZ width. Therefore, water temperature protection is substantially 1 increased over the minimum RMZ width. For each stream type, RMZ buffer widths can 2 vary between the minimum and maximum values of 25 feet and 100 feet (Figures 2-1 and 3 2-2) (Chapter 2, Alternatives). For Type 4 and 5 waters, RMZs are generally not required 4 under most conditions and, under No Action Alternative 1-Scenario 2, would not exceed 5 25 feet. Therefore, RMZs for Type 4 and 5 streams do not meet the 0.75 site potential 6 tree height required for adequate shade retention. This is important because Type 4 and 7 Type 5 waters comprise a large portion of the drainage network (DEIS Appendix B). 8
On the eastside under No Action Alternative 1-Scenario 2, most RMZ widths along Type 9 1, 2, and 3 streams do not meet the 0.75 site potential tree height criterion, except along 10 some Type 1 streams where additional protection may occur due to Shoreline 11 Management Act requirements. The few exceptions are primarily where maximum 12 RMZs are applied to areas with low site class. However, minimum RMZ widths of 30 13 feet do not meet the 0.75 site potential tree height required for adequate shade retention 14 for any site class (compare p. V-27 in FEMAT 1993 to Figures 2-1 and 2-2 in this 15 document). Similar to the westside, the RMZ buffer width can vary between the 16 minimum and maximum values of 30 feet to over 300 feet (Figures 2-1 and 2-2) (Chapter 17 2, Alternatives). 18
For Type 4 and 5 waters, RMZs are not required except for site-specific conditions and in 19 this case would not exceed 25 feet. The lack of RMZs on Type 4 and 5 streams would 20 not meet the 0.75 site potential tree height criterion for shade retention. However, shade 21 may be provided to these streams from understory vegetation and slash. Caldwell et al. 22 (1991) documented temperature increases in harvested Type 4 waters of 2oC to 8oC (3.6 23 to 14.4°F) on several westside streams. Although in many cases the water quality 24 temperature criteria were met, the increases observed were still violations of the 2.8oC 25 (5°F) increase allowed for non-point source activities. However, where a harvested Type 26 4 stream flows into a Type 3 stream, the temperature increases in the Type 3 stream were 27 negligible approximately 150 meters downstream of the confluence (Caldwell et al. 28 1991). In addition, Zwienecki and Newton (1999) found that streams returned to 29 background temperatures within 500 feet after accounting for a stream’s natural 30 downstream warming trend. However, No Action Alternative 1-Scenario 2 provides no 31 protection of sensitive sites for Type 4 waters. 32
The shade provided by RMZs under No Action Alternative 1-Scenario 2 is further 33 reduced as a result of allowable harvest within the RMZ. No Action Alternative 1-34 Scenario 2 would not meet the protection requirements for maintaining stream 35 temperature along Type 1, 2, and 3 waters, resulting in a moderate likelihood of stream 36 temperature increases as a result of reduced shade. Type 4 and 5 waters would have a 37 high likelihood of stream temperature increase due to inadequate shade because there are 38 no buffers along Type 4 and 5 streams. 39
No Action Alternative 1-Scenario 1, Alternative 2, and Alternative 3 40 Note: The reviewer is reminded to consider the differences in effectiveness over time of 41 the adaptive management programs among this group of alternatives (No Action 42
Draft EIS Water Resources
4-67
Chapter 4 Alternative 1-Scenario 1[low], Alternative 2 [high], Alternative 3 [moderate]) in 1 evaluating the effects discussed below (subsection 4.1.5, Adaptive Management). 2
Westside 3 Under No Action Alternative 1-Scenario 1 (and Alternatives 2 and 3), the stream typing 4 and associated prescriptions increase the retention of shade provided to the drainage 5 network compared to No Action Alternative 1-Scenario 2, because more streams would 6 receive some type of buffer. Under this group of alternatives, the nominal RMZ widths 7 for Type S and F streams exceed the criteria to provide complete shade, using both 100-8 year and 250-year site potential tree heights (Table 4.7-1), but some level of harvest 9 would be allowed within the inner and outer zones if the shade rule of maintaining 10 adequate shade within 75 feet of the bankfull or Channel Migration Zone edge is met. 11 Parcels that meet the 20-acre exemption must follow the shade rule that was in effect on 12 January 1, 1999. The impact of these rule differences on 20-acre exempt parcels on 13 westside stream temperatures is assumed to be negligible due to the small percentage of 14 area impacted on westside lands (See Chapter 5, Cumulative Effects, for discussion of 15 20-acre exempt parcel impacts). 16
At least 50 percent of the length of Type Np streams would receive a 50-foot no-harvest 17 buffer (DEIS Appendix B). Seeps and other sensitive areas would also receive protection 18 from forest practices with 50-foot no-harvest buffers. In western Washington, 56-foot 19 radius no-harvest buffers are required at Type Np confluences. In addition, where an Np 20 stream meets a Type F or S stream, a 50-foot no-harvest buffer would be required for the 21 first 500 feet upstream of the confluence with the Type F or S stream. These buffers 22 should provide some temperature protection within Type Np channels. Additional 23 buffering would occur where trees are retained on stream-adjacent unstable slopes. High 24 hazard unstable slopes including channel heads, bedrock hollows, and inner gorges are 25 commonly associated with Type Np channels and are often treated as no-harvest areas. 26 While difficult to quantify, unstable slopes buffering substantially increases stream shade 27 and temperature protection along many Type Np waters, particularly in western 28 Washington where there is a higher frequency of unstable slopes and landforms. Some 29 portions of unbuffered Np channels are likely to exceed water quality standards for 30 several years following harvest. There is a low to moderate likelihood of temperature 31 increases at the downstream end of Type Np stream reaches that would lack buffers. 32
Type NS streams would not likely be adversely affected because these streams are 33 typically dry during the warmest summer months when the waters are most vulnerable to 34 warming. However, Type Ns streams that may have water present during this time may 35 not have adequate shade from overstory trees to maintain stream temperature because no 36 buffers are required along these streams. However, protection of unstable slopes adjacent 37 to Type Ns waters would, in many cases, provide adequate shade for temperature control. 38 However, the level of shade and length of channel protected would vary with the extent 39 of unstable slopes and landforms. Shrubs and debris along the streams may provide 40 adequate shade; but, because of this uncertainty, there is a high likelihood of water 41 temperature increases in Type NS streams where water is present during the summer 42 months (i.e., July through September). 43
Water Resources Draft EIS
4-68
Chapter 4 There are no data from the scientific literature conclusively demonstrating that the 1 combination of a no-harvest zone with a selective harvest zone out to 0.75 site potential 2 tree height will provide complete shade protection. In general, the no-harvest portions of 3 RMZs and the implementation of the shade rule would provide a higher level of 4 protection and increase shade in areas where applied compared to No Action Alternative 5 1-Scenario 2. Overall, the RMZ effectiveness to provide shade to Type S and F streams 6 under this alternative would be high (subsection 4.7.1, Riparian Processes). RMZs along 7 Type S and F waters are adequate to maintain shade; however, potential increases in 8 water temperature may occur along Type Ns and Np streams. The potential cumulative 9 effects of temperature increases in Type Np streams delivering to Type S and F streams is 10 uncertain, but could be important in watersheds with a high degree of past harvest or a 11 history of elevated temperatures. This is a priority research topic under the adaptive 12 management program incorporated under these alternatives (subsection 4.10, Birds, 13 Mammals, Other Wildlife, and Their Habitats). 14
Eastside 15 Under No Action Alternative 1-Scenario 1 (and Alternatives 2 and 3), RMZ buffer widths 16 would exceed the width recommended by FEMAT (1993) for full shade protection for 17 Type S and F streams (Figure 4.7-3). Along Type S and F streams the 30-foot no-harvest 18 zone adjacent to the streambank (or Channel Migration Zone) combined with the inner 19 zone’s selective harvest prescription (out to 0.75 site potential tree height) should 20 adequately protect shade levels (subsection 4.7.1, Riparian Processes). In addition, 21 within the bull trout overlay, the shade rule would require the retention of “all available 22 shade” within 75 feet of the streambank (or Channel Migration Zone). The bull trout 23 overlay includes watersheds in eastern Washington that contain bull trout habitat as 24 identified on the WDFW’s bull trout map (Washington Forest Practices Board 200b, 25 Section 1; WAC 222-16-010). The retention of shade within the bull trout overlay is 26 likely to maintain water temperatures. 27
For Type NP streams, sensitive sites would be buffered with either a partial cut buffer 28 where adjacent harvest operations employ a partial cut strategy or a 50-foot no-harvest 29 buffer where adjacent harvest operations employ a clearcut strategy. The 50-foot partial 30 cut strategy RMZ would not provide complete protection of shade. However, these 31 buffers should protect sensitive sites and provide some shade with understory vegetation 32 to protect stream water temperatures. For the clearcut strategy, the 50 feet of no-harvest 33 protection would only be provided on one-third of the Np streams (DEIS Appendix B). 34 Unstable slopes protection would supplement RMZ protection where these features are 35 present along Type Np waters. Although unquantified, such supplemental protection 36 would likely be substantial in areas where there is a high frequency of unstable slopes 37 and landforms. 38
A low to moderate likelihood of temperature increases exists for segments of unbuffered 39 Np streams. Stream temperatures that may increase in these reaches might be mitigated 40 downstream when the water flows through an RMZ (Bartholow 2004) or if cooler 41 groundwater or surface water enters the stream as discharge increases (Curry et al. 2004). 42 However, channel type (e.g., alluvial versus bedrock), susceptibility to blowdown, stream 43
Draft EIS Water Resources
4-69
Chapter 4 aspect, and watershed properties or changes that would also affect groundwater and soil 1 temperatures may also influence the efficacy of the RMZ rules downstream, or 2 groundwater recharge temperatures (Brosofske et al. 1997; Macdonald et al. 2003; 3 Sridhar et al. 2004). Sensitive sites are also protected from harvest, which protect 4 groundwater seeps and springs. Type Ns streams would not likely be adversely affected 5 because these streams tend to be dry during the warmest summer months when the waters 6 are most vulnerable to warming. However, Type Ns streams that may have water present 7 during this time may lack adequate shade from overstory trees to maintain stream 8 temperature because buffers are not required along these streams. Where stream-adjacent 9 unstable slopes are present, shade is likely to be retained as a result of the no-harvest 10 buffers typically retained to protect these features. Shrubs and debris in the streams may 11 provide adequate shade; but, because of this uncertainty, a moderate to high likelihood of 12 water temperature increases exists in Ns streams with flowing water during the summer 13 months. 14
Alternative 4 15 In general under Alternative 4, for all streams on both the eastside and westside, most if 16 not all shade would be retained (Figures 4.7-5 and 4.7-6). In general, the no-harvest 17 RMZs would provide a higher level of shade retention than either scenario of No Action 18 Alternative 1 thereby substantially reducing the likelihood of temperature increases. 19
Sediment and Turbidity 20 Overview of Effects 21 This subsection evaluates the alternatives in terms of the likelihood for sediment and 22 turbidity effects on water quality. A summary comparison of the effects of the 23 alternatives is provided in the next few paragraphs, and a detailed analysis of the effects 24 is provided by alternative in the following subsections. 25
No Action Alternative 1-Scenario 2 would result in a high likelihood of sediment-related 26 impacts to streams. However, because of the limited protective measures followed 27 historically (subsection 3.4.2.3, History of Forest Practices Affecting Erosion and 28 Sedimentation), instream sediment and turbidity in forested watersheds would be 29 expected to improve relative to current conditions under this alternative. Still, relative to 30 No Action Alternative 1-Scenario 1 and all other alternatives, this alternative has the 31 highest likelihood of sediment and turbidity impacts. 32
No Action Alternative 1-Scenario 1, Alternative 2, and Alternative 3 would result in a 33 moderate likelihood of sediment delivery in the short term (next 10 years) and a low to 34 moderate likelihood of sediment delivery in the long term; this conclusion has a moderate 35 degree of uncertainty. Instream sediment and turbidity levels would be expected to 36 continue to improve in the long term under this alternative as riparian buffers and current 37 rules related to mass wasting and erosion are implemented. Relative to No Action 38 Alternative 1-Scenario 2, these alternatives have a low likelihood of sediment and 39 turbidity impacts. Alternative 4 would result in a moderate likelihood of sediment 40 delivery in the short term (next 10 years) and a low likelihood of sediment delivery to 41 streams in the long term; this conclusion has a moderate degree of uncertainty. 42
Water Resources Draft EIS
4-70
Chapter 4 This alternative would be expected to result in the most rapid improvement to instream 1 sediment and turbidity levels in forested watersheds as a result of forest practices over the 2 long term. Alternative 4 would the lowest likelihood of sediment and turbidity impacts 3 relative to No Action Alternative 1 and of all the other alternatives. 4
Detailed Effects Analysis 5 No Action Alternative 1-Scenario 2 6 Based on the criteria presented in subsection 4.4 (Geology, Soils, and Erosional 7 Processes), and this subsection, No Action Alternative 1-Scenario 2 would result in 8 increased sediment delivery relative to No Action Alternative 1-Scenario 1 and all other 9 alternatives due to reduced protection for potentially unstable slopes, a lack of RMAPS, 10 and reduced buffer widths. Under No Action Alternative 1-Scenario 2, the Washington 11 Forest Practices Board Manual would provide prescriptive-based BMPs, as required by 12 the January 1, 1999 Washington Forest Practices Rules that were approved by the 13 Washington Department of Ecology (Ecology). However, as multiple studies have 14 shown, the implementation of past BMPs did not always reduce water quality-related 15 impacts from sediments (Rashin et al. 1999). The slow rate at which road maintenance 16 plans were completed under these rules indicated that this alternative would present a 17 high likelihood of sediment delivery to streams. However, if Watershed Analysis were 18 applied, there would be an effective mechanism for addressing road maintenance and 19 abandonment in watersheds with identified sediment input and water quality problems. 20
No Action Alternative 1-Scenario 1, Alternative 2, and Alternative 3 21 Under No Action Alternative 1-Scenario 1, Alternative 2, and Alternative 3, the 22 cumulative effects of the implementation of RMAPs, BMPs, and specific road 23 management, use, maintenance, and construction guidelines in the Washington Forest 24 Practices Board Manual, RMZs, and Equipment Limitation Zones on all perennial and 25 intermittent streams, and greater environmental review of practices on potentially 26 unstable slopes should substantially reduce sediment delivery to streams compared to No 27 Action Alternative 1-Scenario 2. As discussed above in subsection 4.4 (Geology, Soils, 28 and Erosional Processes), the effect in sediment reduction would occur over time as 29 RMAPs are implemented and completed by 2016. In addition, all these alternatives 30 would result in less ground disturbance because of no-harvest RMZs and/or Equipment 31 Limitation Zones than under No Action Alternative 1-Scenario 2. 32
Alternative 4 33 Under Alternative 4, sediment reductions would be greater overall and would occur in a 34 shorter timeframe than under either scenario of No Action Alternative 1. As discussed in 35 subsection 4.4 (Geology, Soils, and Erosional Processes), a shorter timeframe for 36 implementation of RMAPs, the no-net-increase rule for forest roads, and the more rapid 37 road maintenance and abandonment of orphan roads would reduce sediment delivery to 38 streams to a greater degree than No Action Alternative 1-Scenario 1 and Scenario 2. 39 Additionally, increased no-harvest buffer widths would provide greater protection to 40 surface waters, as shown in subsection 4.4.1 (Surface Erosion). 41
Draft EIS Water Resources
4-71
Chapter 4 Dissolved Oxygen and Nutrients 1 In general, wide buffers would offer greater protection for dissolved oxygen levels due to 2 cooler stream temperatures, additional wood recruitment, and reduced sediment and 3 nutrient inputs to streams (Beschta et al. 1997; Washington Department of Ecology 4 2002c). 5
Based on the previous discussions of temperature and sediment, none of the alternatives 6 are expected to result in major long-term effects on dissolved oxygen or nutrient 7 concentrations in streams. Although short-term influences, such as algal blooms, from 8 large inputs of organic material (fertilizer spills, runoff, or severe blowdown in riparian 9 zones) might occur, they would be relatively independent of the alternatives considered. 10 The 1998 303(d) listings suggest that forestry effects on dissolved oxygen were more 11 limited than temperature effects (Washington DNR 2004c). 12
No Action Alternative 1-Scenario 2 has the highest likelihood of producing dissolved 13 oxygen and nutrient impacts of all of the alternatives because it requires the narrowest 14 buffers (See equivalent buffer area index discussion in subsections 3.4 and 4.4, Geology, 15 Soils and Sedimentation) and the lowest shade retention of all of the alternatives 16 considered. 17
No Action Alternative 1-Scenario 1 and Alternatives 2 and 3 would offer more protection 18 for dissolved oxygen and nutrients than No Action Alternative 1-Scenario 2 due to wider, 19 more extensive buffers. 20
Alternative 4 would have the lowest likelihood of producing dissolved oxygen and 21 nutrient impacts relative to either scenario of the No Action Alternative due to high levels 22 of riparian protection and reduced sediment inputs. 23
Pesticides (Insecticides, Herbicides, and Fungicides) 24 Overview of Effects 25
This subsection evaluates the alternatives in terms of the likelihood for negative effects 26 on water quality from pesticide application. A summary comparison of the effects of the 27 alternatives is provided in the next few paragraphs, and a detailed analysis of the effects 28 is provided by alternative in the following subsections. 29
Based on required buffer widths, No Action Alternative 1-Scenario 2 is assumed to have 30 a low to moderate likelihood of short-term negative water quality effects from improperly 31 applied pesticides, spills, or input to streams due to erosion. Relative to all other 32 alternatives however, this alternative would have the highest likelihood of water quality 33 impacts from pesticides. 34
Additional requirements targeting the protection of surface waters under No Action 35 Alternative 1-Scenario 1, Alternative 2, and Alternative 3, would result in a continued, 36 reduced likelihood of impacts to surface water and groundwater (through a reduction in 37 exchange with contaminated surface water). 38
Water Resources Draft EIS
4-72
Chapter 4 Increased buffer widths required for hand applications of pesticides near surface waters 1 under Alternative 4 means this alternative has a much lower likelihood of surface water 2 contamination compared with No Action Alternative 1-Scenario 2, and a slightly lower 3 likelihood of contamination compared with No Action Alternative 1-Scenario 1. 4
Detailed Effects Analysis 5 No Action Alternative 1-Scenario 2 6 Hand application of pesticides within the RMZ would not result in direct entry into 7 surface waters. However, application of highly persistent pesticides, or pesticides with 8 high mobility, could result in measurable surface water contamination through localized 9 erosion or storm runoff. The overall impact would be situation- and chemical-specific, 10 depending on the specific chemical properties as well as the timing, duration, and extent 11 of contamination. In general, because of the slow surface and subsurface runoff from 12 forested lands and the relatively infrequent pesticide applications, most pesticide 13 applications in the RMZ are not expected to result in meaningful impacts on water 14 quality. 15
In the January 1, 1999 Washington Forest Practices Rules, a 50-foot buffer required for 16 aerial applications on all Type 1, 2, and 3 waters and flowing portions of Type 4 and 5 17 waters does not provide sufficient protection to prevent pesticides from entering surface 18 waters. Wind conditions favoring atmospheric drift toward surface water could result in 19 a direct application of pesticides to the surface water. No Action Alternative 1-Scenario 20 2 does not include any special provisions or modifications for pesticide application based 21 on weather conditions or equipment (e.g., wind speed, application height, nozzle type, or 22 droplet size). Variations in wind conditions, droplet size, air shear (a function of nozzle 23 angle and air speed), nozzle height, and boom length all have a significant influence on 24 pesticide spray drift (Spray Drift Task Force 1997; Washington Department of Ecology 25 1993a). By not accounting for these variations, No Action Alternative 1-Scenario 2 26 poses a higher likelihood of surface water contamination caused by spray drift, adverse 27 weather, or inappropriate equipment selection and use than No Action Alternative 1-28 Scenario 1. Although the entry of pesticides into surface waters does not necessarily 29 result in meaningful impacts (e.g., very low levels of pesticide contamination may not 30 even be measurable), Ecology (1993a) found a 50-foot buffer to be partially effective to 31 ineffective at meeting applicable water quality standards, Forest Practices Rule 32 requirements, and certain product label restrictions. 33
In addition, the application of pesticides to dry portions of Type 4 and 5 waters and other 34 ponds and sloughs could result in high instream concentrations if future runoff returns 35 flow to the dry streams (Washington Department of Ecology 1993a). Research has 36 shown instances where applications over dry channels resulted in very high instream 37 concentrations of chemicals. The results were generally temporary but important enough 38 to cause adverse impacts on water quality and aquatic organisms (Neary and Michael 39 1996; Washington Department of Ecology 1993a). Because none of the alternatives 40 provide any greater protection of dry streambeds, the impacts would be the same under 41 all alternatives. 42
Draft EIS Water Resources
4-73
Chapter 4 When applying pesticides using power equipment from the ground, the 25-foot buffer 1 required for all typed waters (excluding dry Type 4 and 5 waters) and all Type A and B 2 wetlands should adequately protect surface waters from receiving significant pesticide 3 overspray. However, as with the hand and aerial applications, the 25-foot buffer does not 4 provide a high level of protection from highly mobile or highly persistent pesticides that 5 may be transported to surface waters through erosion or storm runoff. However, slow 6 runoff from forested lands, the relatively infrequent application of pesticides, and the 7 generally low toxicity of most pesticides are likely to limit surface water contamination. 8 Hand application of pesticides within Wetland Management Zones should not result in 9 meaningful impacts to surface waters, provided that those pesticides are only applied to 10 specific targets and the required application rates are not exceeded. 11
Any leaks, drips, and spills of pesticides could contaminate forest soils. The potential 12 impacts of an accidental spill are highly dependent on the effectiveness of the required 13 containment and cleanup procedures. If effective safety and cleanup measures are not 14 implemented and contaminated soils erode, the contaminants could be passed to 15 downstream waters. 16
Finally, possible impacts on surface waters could occur through contaminated 17 groundwater flow to surface waters. The extent of these impacts is difficult to predict but 18 depends on the degree of groundwater contamination, the volume of water exchanged, 19 the length of time between groundwater contamination and contact with surface water, 20 and the persistence and mobility of the pesticide in question. 21
Overall, pesticide applications under No Action Alternative 1-Scenario 2 would have a 22 moderate likelihood of surface water contamination and may result in impacts on surface 23 waters, primarily for newer products that have not had buffer determinations made by 24 EPA, and for which a 50-foot buffer may not be adequate (Washington Forest Practices 25 Board 2001a, Appendix J). 26
No Action Alternative 1-Scenario 1, Alternative 2, and Alternative 3 27 Note: The reviewer is reminded to consider the differences in effectiveness over time of 28 the adaptive management programs among this group of alternatives (No Action 29 Alternative 1-Scenario 1[low], Alternative 2 [high], Alternative 3 [moderate]) in 30 evaluating the effects discussed below (subsection 4.1.5, Adaptive Management). 31
Compared to No Action Alternative 1-Scenario 2, No Action Alternative 1-Scenario 1, 32 Alternative 2, and Alternative 3 contain additional requirements targeting the protection 33 of water resources from pesticide applications. These alternatives include implementation 34 of BMPs designed to “eliminate the direct entry of pesticides to water (defined as the 35 entry of medium to large droplets), while minimizing off-target drift” in aerial application 36 of pesticides (Washington DNR 1999). By recommending variable buffer widths for 37 aerial applications depending on water type, environmental conditions, and the method of 38 application, No Action Alternative 1-Scenario 1, Alternative 2, and Alternative 3 would 39 result in a lower likelihood of water quality impacts compared to No Action Alternative 40 1-Scenario 2. Specifically, by adjusting the buffer widths to suit wind conditions, nozzle 41 types, and application heights during aerial application of pesticides, these alternatives 42
Water Resources Draft EIS
4-74
Chapter 4 would reduce the pesticide drift into surface waters compared to No Action Alternative 1-1 Scenario 2 (Washington Department of Ecology 1993a). Buffer widths specified for 2 these alternatives also are correlated with the critical management or habitat zones 3 identified for each water type. Therefore, No Action Alternative 1-Scenario 1, 4 Alternative 2, and Alternative 3 would also minimize impacts within the RMZs identified 5 for each water type. Moreover, these alternatives recommend using the maximum 6 applicable buffer width in situations where the recommended buffer width and 7 recommended offset from surface waters are different. 8
Under this group of alternatives, restrictions on ground applications of pesticides with 9 power or hand equipment provide for greater protection of Type S or F waters compared 10 to No Action Alternative 1-Scenario 2. Specifically, ground application with power 11 equipment would not be permitted within the core and inner zones of Type S and F 12 waters, and hand applications would not be allowed within the core zones of Type S or F 13 waters (unless prescribed to meet specific localized requirements). These buffers can 14 total to 100 feet or more for RMZs on Site Class II (Figures 2-1 and 2-2). These 15 increased buffer widths afforded by these alternatives would result in a lower likelihood 16 of drift and erosive transport of pesticides than under No Action Alternative 1-Scenario 2. 17
Overall, the increased attention given to the required buffer widths under No Action 18 Alternative 1-Scenario 1 (and Alternatives 2 and 3) would reduce the likelihood of 19 surface water impacts compared to No Action Alternative 1-Scenario 2. However, 20 because this group of alternatives still allow for pesticide application over dry segments 21 of some watercourses, some contamination of surface waters is possible if flow returns to 22 the stream soon after the application. Likewise, even with the increased buffer width for 23 most surface waters, these alternatives could allow low levels of pesticides to reach 24 surface waters either directly or through storm water runoff, soil erosion, and sediment 25 transport. Nevertheless, the net impacts would be less than those expected under No 26 Action Alternative 1-Scenario 2. 27
Alternative 4 28 Alternative 4 is nearly identical to No Action Alternative 1-Scenario 1with the exception 29 of three main additions. Under Alternative 4, plants with cultural value would be 30 protected from forest pesticides, hand application of forest pesticides would be prohibited 31 within 50 feet of all typed waters, and forest pesticide applications needed to restore 32 RMZ functions would require an alternate plan. Therefore, surface water impacts from 33 pesticide applications under Alternative 4 are expected to be slightly less than under No 34 Action Alternative 1-Scenario 1and considerably less than under No Action Alternative 35 1-Scenario 2. 36
The increased buffer required for hand applications near surface waters under Alternative 37 4 would greatly reduce the amount of pesticides that reach surface waters directly via 38 spray drift compared to No Action Alternative 1-Scenario 2, and only slightly reduce the 39 potential for contamination compared to No Action Alternative 1-Scenario 1. The 40 recommended 50-foot buffer for hand applications is greater than that required under the 41 scenarios of the No Action Alternative, with the exception of the core zone buffer on 42
Draft EIS Water Resources
4-75
Chapter 4 westside Type S and F streams required under No Action Alternative 1-Scenario 1 1 (westside core zone is 50 feet). In addition, alternative plans required for forest pesticide 2 applications when restoring RMZs under Alternative 4 are expected to reduce the amount 3 of pesticides that enter surface waters. However, as with all other alternatives, low levels 4 of pesticides may reach surface waters through storm runoff, soil erosion, and sediment 5 transport. 6
4.5.2 Surface Water Quantity 7 Surface water quantity is evaluated in terms of the effects of timber harvest activities on 8 water yield, low flows, and peak flows. The effects of individual forest practices in 9 general will contribute to short-term effects on water quantity that will improve over the 10 course of a few years to a few decades following harvest, except for road-related effects. 11
4.5.2.1 Evaluation Criteria 12 Water Yield 13 An increase in overall annual water yield is generally not considered to adversely affect 14 the beneficial uses of the stream system. However, differences between the alternatives 15 and the No Action Alternative are evaluated qualitatively based on the literature. As 16 discussed in subsection 3.5.2.1 (Water Yield (Annual)), timber harvest has been shown to 17 increase water yields in the short term following timber harvest due to reduced 18 evapotranspiration. As forests re-grow, these effects are reduced (subsection 3.5.2.1, 19 Water Yield (Annual)). Further discussion is included under the subsection titled Peak 20 Flows, below. 21
Low Flows 22 As discussed in subsection 3.5.2.2 (Low Flows), studies of low flows following timber 23 harvest have shown that summer low flows in western Oregon and northern California 24 have increased over pre-harvest levels for approximately 5 years following timber 25 harvest. An increase in low flows during the summer months generally does not 26 adversely affect the beneficial uses of the aquatic system. Small volumetric increases 27 may provide improved habitat conditions (lower stream temperatures, increased instream 28 wetted area, and volume) and increased aquatic productivity (subsection 3.5.2.2, Low 29 Flows). Differences among the alternatives are evaluated qualitatively based on the 30 literature. 31
Peak Flows 32 Peak flows are evaluated in terms of the effects of roads and the effects of timber harvest, 33 as described below. Peak flow impacts are episodic, occurring during storm events. 34
Road Influence on Peak Flows 35 The FFR set an objective to “maintain surface and groundwater hydrologic regimes 36 (magnitude, frequency, timing, and routing of stream flows) by disconnecting road 37 drainage from the stream network, preventing increases in peak flows causing scour, and 38 maintaining hydrologic continuity of wetlands” (FPHCP Appendix B). As discussed in 39 subsection 3.5.2.7, (Management Influences on Peak Flows), two summaries of recent 40
Water Resources Draft EIS
4-76
Chapter 4 research studies on roads in forested areas demonstrate that roads can have significant 1 effects on peak flows if roads are improperly constructed and if road drainage is 2 connected to the stream network through improper construction or neglect (USDA Forest 3 Service 2001; CMER 2004). A potential exists that road drainage may increase peak 4 flow magnitudes, which would have greater impacts on first and second order drainages. 5 This potential may be substantial in certain basins, and is based upon the road 6 management and drainage criteria, and potential for decrease (e.g., abandonment) in 7 roads under each alternative (further discussion of RMAPs and abandonment is included 8 in subsection 3.4, Geology, Soils, and Erosional Processes). 9
Timber Harvest Influence on Peak Flows 10 Many studies have found a correlation between the hydrologic maturity of a basin, 11 especially in the rain-on-snow zone (also known as the transient snow zone), and the 12 potential for increased peak flows (subsection 3.5.2.7, Management Influence on Peak 13 Flows). The evaluation criteria for timber harvest-related peak flows is how well the 14 Washington Forest Practices Rules under each alternative would reduce the potential for 15 large areas in the rain-on-snow zone of a basin to become hydrologically immature (e.g., 16 early-seral stage). Although the effect of rain-on-snow events is most pronounced in the 17 rain-on-snow zone, they can potentially occur at any elevation, depending on storm 18 temperature and antecedent snow conditions. Therefore, the effects of timber harvest on 19 peak flows in rain-dominated and snowmelt-dominated watersheds were also considered. 20
4.5.2.2 Evaluation of Alternatives 21 The effects of the alternatives on surface water quantity are analyzed in this subsection. 22 In reading this analysis, it should be remembered from Chapter 2 (Alternatives) that 23 under the No Action Alternative 1 no ITPs or ESA Section 4(d) authorization would be 24 issued. However, this lack of action would likely affect the Forest Practices Regulatory 25 Program in a way that is difficult to predict. Therefore, two scenarios, which represent 26 the endpoints of the reasonable range of possible outcomes for the Forest Practices 27 Regulatory Program, have been defined (subsection 2.3.1, No Action Alternative 1 (No 28 Action)) to represent the No-Action Alternative. The effects of No Action are displayed 29 for both of these endpoints in the following subsections, but the actual outcome and the 30 actual effects of No Action on water quality are likely to fall between these two 31 scenarios. 32
Water Yield 33 The alternatives may be ranked in terms of their relative probability of increasing short-34 term annual water yield based on the total amount of harvest allowed. No Action 35 Alternative 1-Scenario 2 would have the least restrictions on harvest area and would have 36 the greatest probability among the alternatives of increasing short-term water yield for 37 any given watershed as a result of timber harvest because it would assume the least 38 acreage of buffered areas adjacent to surface water and wetland features. It would also be 39 the least restrictive alternative in terms of harvest on potentially unstable slopes and road 40 placement. No Action Alternative 1-Scenario 1 (and Alternatives 2 and 3) would have 41 similar probabilities of increasing water yield as a result of timber harvest as No Action 42
Draft EIS Water Resources
4-77
Chapter 4 Alternative 1-Scenario 2, but would have a lower probability of increasing short-term 1 annual water yield for a given watershed as a result of timber harvest. Alternative 4 2 would have the lowest probability among the alternatives of increasing water yield as a 3 result of timber harvest because it has: 1) the greatest acreage of no-harvest buffers 4 adjacent to surface water and wetland features, 2) a requirement that there be no net 5 increase in roaded areas, and 3) the most conservative restrictions on areas that may be 6 buffered due to potential slope instability. 7
Low Flows 8 A qualitative comparison of alternatives would yield identical conclusions to the 9 discussion in subsection 4.5.2.1 (Evaluation Criteria), ranking No Action Alternative 1-10 Scenario 2 as having the greatest probability to increase low flows following harvest, 11 followed by the group of No Action Alternative 1-Scenario 1, Alternative 2, and 12 Alternative 3. Alternative 4 would be least likely to increase low flows in the short term 13 for a given watershed as a result of timber harvest. 14
Peak Flows 15 The discussion of alternatives based on peak flow effects is divided into effects from 16 timber harvest and effects from roads. 17
Timber Harvest Influence on Peak Flows 18 Overview of Effects 19 This subsection evaluates the degree to which each alternative is likely to produce 20 increases in peak flows due to timber harvest. A summary comparison of the effects of 21 the alternatives is provided in the next few paragraphs, and a detailed analysis of the 22 effects is provided by alternative, in the following subsections. 23
No Action Alternative 1-Scenario 2 has a moderate likelihood of peak flow increases. 24 Under this alternative, peak flow effects would be addressed through Watershed Analysis 25 or the rain-on-snow rule (See discussion about this rule under the Detailed Effects 26 Analysis below). 27
No Action Alternative 1-Scenario 1, Alternative 2, and Alternative 3 would have a 28 slightly lower likelihood of peak flow effects relative to No Action Alternative 1-29 Scenario 2. Under these alternatives, forest landowners would have less incentive to 30 conduct Watershed Analyses, which includes an assessment of peak flow impacts. Rain-31 on-snow peak flow impacts would continue to be addressed through the rain-on-snow 32 rule under these alternatives. 33
Alternative 4 would provide the lowest likelihood of harvest-related peak flow impacts 34 relative to all other alternatives because the rules would directly address the cumulative 35 hydrologic maturity in rain-on-snow zones. 36
Detailed Effects Analysis 37 No Action Alternative 1-Scenario 2. The Washington Forest Practices Rules in effect 38 on January 1, 1999 address the effects of timber harvest on peak flows in two ways. 39 First, the rules authorize the Washington DNR to condition the size of clearcuts in the 40
Water Resources Draft EIS
4-78
Chapter 4 “significant” (WAC 222-22-100(2)) rain-on-snow zone where peak flows can potentially 1 result in material damage to public resources. This rule is commonly referred to as the 2 “rain-on-snow” rule. Second, harvest-related effects on rain-on-snow-generated peak 3 flows are addressed as part of Watershed Analysis. In Watershed Analysis, the 4 hydrologic change module assesses the sensitivity of sub-basins within a Watershed 5 Administrative Unit to increased peak flows resulting from the effects of timber harvest 6 on snow accumulation and melt during rain-on-snow precipitation events. However, 7 Watershed Analysis has only been applied to a small percentage of the State and is 8 voluntary for private landowners. Lack of Federal ESA assurances under this alternative 9 may increase the frequency and rate at which Watershed Analyses are conducted. 10
No Action Alternative 1-Scenario 1, Alternative 2, and Alternative 3. Note: The 11 reviewer is reminded to consider the differences in effectiveness over time of the 12 adaptive management programs among this group of alternatives (No Action Alternative 13 1-Scenario 1[low], Alternative 2 [high], Alternative 3 [moderate]) in evaluating the 14 effects discussed below (subsection 4.1.5, Adaptive Management). 15
No Action Alternative 1-Scenario 1, Alternative 2, and Alternative 3 would result in an 16 increase in the level of tree retention across the landscape relative to No Action 17 Alternative 1-Scenario 2 due to additional protections associated with RMZs, Channel 18 Migration Zones, sensitive sites, and unstable slopes. Also, the rain-on-snow rule and 19 Watershed Analysis would address the effects of harvest on rain-on-snow-generated peak 20 flows under these alternatives. Watershed Analysis would be required of the Washington 21 DNR to the extent that funding is available and landowners voluntarily participate. No 22 new Watershed Analyses have been initiated since the Forest and Fish rules were 23 implemented in 2000, and none are anticipated for the near future. Although it is part of 24 the current Washington Forest Practices Rules, it remains unfunded. Under No Action 25 Alternative 1-Scenario 1, Alternative 2, and Alternative 3, there would be less incentive 26 to conduct Watershed Analysis. However, the results of past Watershed Analyses 27 suggest that rain-on-snow peak flow impacts associated with timber harvest are very 28 limited. 29
Management prescriptions to limit harvest-induced peak flow increases have been 30 developed for only two of approximately 62 Watershed Administrative Units that have 31 undergone analysis (Personal Communication, Jeff Grizzel, DNR, September 16, 2004). 32 The likelihood of negative effects associated with timber-harvest induced peak flows 33 could be slightly lower than under No Action Alternative 1-Scenario 2. 34
Alternative 4. Under Alternative 4, a new eastside hydrology module would be 35 developed as part of Watershed Analysis and would be applied to eastside watersheds 36 that undergo Watershed Analysis. As in the other alternatives, Watershed Analysis 37 would remain mandatory for the Washington DNR depending on available funding, and 38 voluntary for private landowners. In addition, a landscape rule would be applied to all 39 forest practices applications to limit the amount of hydrologically immature (based upon 40 crown closure) forest within rain-on-snow zones. The rule states that a minimum of two-41 thirds of lands by ownership, within the rain-on-snow zone of basins 1,000 acres or larger 42
Draft EIS Water Resources
4-79
Chapter 4 in size must be maintained in stands that are at least 25 years old. This alternative would 1 provide the greatest protection among all alternatives, substantially more than No Action 2 Alternative 1-Scenario 2, and more than No Action Alternative 1-Scenario 1, from 3 potential management-related peak flows from rain-on-snow events. 4
Road Influence on Peak Flows 5 Overview of Effects 6 This subsection evaluates the alternatives in terms of the likelihood of road-induced peak 7 flow increases. A summary comparison of the effects of the alternatives is provided in 8 the next few paragraphs, and a detailed analysis of the effects is provided by alternative 9 in the following subsections. 10
All alternatives would be expected to reduce road-induced peak flow increases through 11 improved road construction, maintenance, and abandonment over historical conditions 12 (DEIS Appendix A). 13
No Action Alternative 1-Scenario 2 would not encourage disconnection of road drainage 14 from the stream network; therefore, there would be a moderate likelihood of road-15 induced peak flow increases. Further, the potential for an increase in road-influenced 16 peak flows compared to current conditions would exist. 17
No Action Alternative 1-Scenario 1 (and Alternatives 2 and 3) would reduce the potential 18 for road-related peak flow increases because the Washington Forest Practices Rules 19 would require that road drainage be disconnected from the stream network. 20
Alternative 4 would have a similar or lower likelihood of road-related peak flow 21 increases relative to No Action Alternative 1-Scenario 1, Alternative 2, and Alternative 3 22 because the more rapid implementation of RMAPs under this alternative would 23 accelerate the disconnection of road drainage from stream networks. 24
Detailed Effects Analysis 25 No Action Alternative 1-Scenario 2. Under No Action Alternative 1-Scenario 2, the 26 road drainage BMPs included in the January 1, 1999 Washington Forest Practices Rules 27 such as rolling grade dips, water bars, and grade dips at stream crossings would be 28 encouraged and their use would be required if deemed necessary, but specifics are not 29 given that make those requirements clear on when implementation is necessary. Because 30 the January 1, 1999 Washington Forest Practices Rules do not explicitly require 31 outsloping of roads, but do require ditching, relief culverts, and other BMPs that reduce 32 the volume of surface water reaching streams, the implementation of these rules may 33 have a greater effect in extending the drainage network and potentially influencing peak 34 flows than would the rules under the other alternatives (subsection 4.1.2.5, Alternative 35 Groupings). 36
Requirements for locating roads in the January 1, 1999 Washington Forest Practices 37 Rules included the following requirements: stream crossings are required to be 38 minimized, as well as road locations in RMZs, wetlands, Wetland Management Zones 39 and narrow canyons. Except where crossings are necessary, roads shall not be located in 40
Water Resources Draft EIS
4-80
Chapter 4 natural channels or RMZs except where the Washington DNR determines the risk to 1 public resources is too great to relocate the road. 2
No Action Alternative 1-Scenario 1, Alternative 2, and Alternative 3. Note: The 3 reviewer is reminded to consider the differences in effectiveness over time of the 4 adaptive management programs among this group of alternatives (No Action Alternative 5 1-Scenario 1[low], Alternative 2 [high], Alternative 3 [moderate]) in evaluating the 6 effects discussed below (subsection 4.1.5, Adaptive Management). 7
Under No Action Alternative 1-Scenario 1, Alternative 2, and Alternative 3, closer 8 spacing of ditch relief culverts compared to No Action Alternative 1-Scenario 2 would be 9 required, and outlets of ditch relief culverts would have to be located to allow the 10 dispersal of water to the forest floor before reaching any stream. RMAPs would have to 11 be implemented by 2016. These include abandonment of roads and the upgrade of all 12 roads (except orphaned roads) to current construction standards, which includes drainage. 13 The reduction in road surface drainage would reduce the potential of road influences on 14 peak flows. 15
Requirements for locating roads are similar to No Action Alternative 1-Scenario 2. 16 Stream crossings would be required to be minimized, and except for crossings, roads 17 would be kept out of natural channels, Channel Migration Zones, RMZs, Equipment 18 Limitation Zones, or sensitive sites, when there would be substantial damage to fish or 19 wildlife habitat. Additionally, an interdisciplinary team would be required to review the 20 placement of roads in such areas. These additional requirements and levels of review 21 may prevent excessive hydrologic connection between new roads and streams in some 22 areas. 23
Alternative 4. Under Alternative 4, road effects on peak flows would be similar to No 24 Action Alternative 1-Scenario 1. In addition, there would be no net increase in roads 25 allowed for large landowners. However, RMAPs would be implemented sooner than 26 under No Action Alternative 1-Scenario 1 (10 years versus 15 years). The no-net 27 increase in roads and similar drainage guidelines as under No Action Alternative 1-28 Scenario 1would likely reduce the impacts of roads on peak flows. The road effects on 29 peak flows would be less compared to No Action Alternative 1-Scenario 2 because of the 30 requirements for no-net increase in roads and the accelerated schedule for RMAPS. 31
4.5.3 Groundwater 32 4.5.3.1 Evaluation Criteria 33 Water Quality 34 The primary concerns for groundwater quality are the effects of forest practices on 35 groundwater temperature and effects from pesticide applications or fertilization (CH2M 36 Hill 2000). These effects are qualitatively assessed under each alternative. 37
Studies of hyporheic zones (regions within the streambed and near streams where surface 38 water and shallow groundwater mix at the reach scale (e.g., Naiman and Bilby 1998)), 39 show complex flow patterns and locations of upwelling and downwelling of groundwater 40
Draft EIS Water Resources
4-81
Chapter 4 along alluvial channels. Colluvial and bedrock channels tend to have more limited 1 hyporheic zones. Upwelling hyporheic waters are sought out by salmonids during 2 spawning and rearing (subsection 4.8, Fish and Fish Habitat). Alterations to the 3 hyporheic zone due to local decreases in groundwater input, disturbances to floodplains 4 and channels by debris flows, timber harvest, or road building could potentially alter the 5 hydrology of the hyporheic zone and associated surface waters and fish habitat. 6 However, due to the complexity of hyporheic zone hydrology, even a qualitative 7 evaluation of the proposed alternatives on this resource is somewhat speculative. An 8 assumption is made that larger buffers and more conservative protections for the riparian 9 zone would have a lower likelihood of disturbing groundwater hydrology and water 10 quality of the hyporheic zone, which would also be beneficial to associated resources, 11 such as fish and amphibians. The hyporheic zone resource is especially important for 12 streams with Channel Migration Zones and broad floodplains (subsection 3.5, Water 13 Resources). 14
Water Quantity 15
Timber harvest increases peak flows and water yield to surface water by decreasing 16 infiltration rates and evapotranspiration within a watershed or landscape (Lewis et al. 17 2001). There are potentially competing effects on groundwater on a watershed or Water 18 Resource Inventory Area (WRIA) scale: groundwater inputs to lower reaches of stream 19 systems decrease over time due to a reduction in infiltration during storm events on a 20 watershed or WRIA scale (Harr et al. 1979). Cumulative effects may increase the effects 21 on aquifer systems where forestlands occur on recharge areas for groundwater. However, 22 analysis at regional or statewide scales is speculative due to the complexity of 23 groundwater hydrology and groundwater-surface water interactions. The differences 24 among the alternatives in terms of the effects of forest practices on groundwater quantity 25 are qualitatively assessed. 26
4.5.3.2 Evaluation of Alternatives 27 The effects of the alternatives on water quantity are analyzed in this subsection. In 28 reading this analysis, it should be remembered from Chapter 2 (Alternatives) that under 29 the No Action Alternative 1, no ITPs or ESA Section 4(d) take authorization would be 30 issued. However, this lack of action would likely affect the Forest Practices Regulatory 31 Program in a way that is difficult to predict. Therefore, two scenarios, which represent 32 the endpoints of the reasonable range of possible outcomes for the Forest Practices 33 Regulatory Program, have been defined (subsection 2.3.1, No Action Alternative 1 (No 34 Action)) to represent the No-Action Alternative. The effects of No Action are displayed 35 for both of these endpoints in the following subsections, but the actual outcome and the 36 actual effects of No Action on water quantity are likely to fall between these two 37 scenarios. 38
Water Quality 39 Overview of Effects 40 Because all alternatives are subject to specific provisions for the protection of 41 groundwater having a high susceptibility for contamination (WAC 222-16-070), 42
Water Resources Draft EIS
4-82
Chapter 4 application of forest pesticides should not result in substantial impacts on groundwater 1 and hyporheic zone water quality. Groundwater temperature is not discussed, except in 2 terms of impacts to hyporheic zone upwelling areas. Effects on municipal or sole source 3 aquifer temperatures from forestry are not anticipated to vary among alternatives, or to be 4 substantial. 5
Detailed Effects Analysis 6 No Action Alternative 1-Scenario 2 7 No Action Alternative 1-Scenario 2 includes provisions to limit groundwater 8 contamination resulting from forest pesticide applications. Groundwater protection is 9 provided under WAC 222-16-070 (pesticide uses with the potential for a substantial 10 impact on the environment), where the Washington Forest Practices Rules require an 11 evaluation of site-specific use of aerially applied pesticides or fertilizers. However, 12 localized groundwater impacts could also occur through contaminated surface water 13 recharge to groundwater. The extent of these impacts is difficult to predict but depends 14 on the degree of contamination of the surface water, the volume of water exchanged, and 15 the mobility and persistence of the chemical contaminant. 16
The likelihood that a given pesticide or fertilizer would impact a groundwater aquifer 17 depends in part on geologic and hydrologic conditions that vary considerably across the 18 State. Local conditions determine how rapidly groundwater moves, whether it is 19 connected directly or indirectly to surface waters and how groundwater withdrawals 20 affect surface waters, the depth of the water below the soil surface, and how effectively 21 soils attenuate or filter out chemical contaminants (Environmental Protection Agency 22 1986). This complex interaction between soil and water makes it difficult to predict the 23 likelihood and extent of groundwater contamination. 24
Because No Action Alternative 1-Scenario 2 would provide provisions for groundwater 25 protection, application of forest pesticides and fertilizers should not result in substantial 26 impacts to groundwater quality. However, groundwater impacts could occur in localized 27 areas with particularly vulnerable aquifers and in areas where highly persistent and 28 mobile pesticides are applied. Likewise, the application of forest pesticides and 29 fertilizers to forested lands may contribute to cumulative effects on groundwater quality, 30 the net effects of which are area- or site-specific and somewhat unpredictable. Additional 31 details on the potential impacts to groundwater quality from pesticides and fertilizers are 32 discussed in Appendix J of the recent Forest Practices Alternatives SEPA EIS 33 (Washington Forest Practices Board 2001a). 34
The widespread use of pesticides and fertilizers could lead to contamination of 35 groundwater aquifers unless adequate protective measures are implemented. No Action 36 Alternative 1-Scenario 2 does not include any specific provisions for the protection of 37 aquifers, but does provide for the protection of groundwater having a high susceptibility 38 for contamination. In general, No Action Alternative 1-Scenario 2 is not expected to 39 result in substantial impacts on aquifers. To date, there are no data that indicate that 40 forest pesticide applications under the January 1, 1999 Washington Forest Practices Rules 41 (No Action Alternative 1-Scenario 2) resulted in substantial impacts to aquifers, 42
Draft EIS Water Resources
4-83
Chapter 4 therefore, no substantial impacts are expected to occur under this alternative. Application 1 of forest pesticides and fertilizers, however, could contribute to cumulative impacts 2 associated with contamination of aquifers. Appendix J in the Washington Forest 3 Practices Board (2001) contains additional details on the potential for sole-source aquifer 4 contamination from forest chemicals. 5
No Action Alternative 1-Scenario 1, Alternative 2, and Alternative 3 6 Groundwater impacts associated with No Action Alternative 1-Scenario 1, Alternative 2, 7 and Alternative 3 are expected to be similar but slightly less than under No Action 8 Alternative 1-Scenario 2. Direct impacts on groundwater from pesticide or fertilizer 9 leaching to groundwater aquifers could potentially occur at the same rate under No 10 Action Alternative 1-Scenario 1, Alternative 2, and Alternative 3 as with No Action 11 Alternative 1-Scenario 2. However, because the increased buffer widths required under 12 No Action Alternative 1-Scenario 1, Alternative 2, and Alternative 3 would result in 13 fewer surface water impacts, the likelihood that contaminated surface water would reach 14 and contaminate groundwater (via water exchange with a susceptible aquifer or within 15 the hyporheic zone) is also reduced. 16
No Action Alternative 1-Scenario 1, Alternative 2, and Alternative 3 is expected to result 17 in similar but slightly lower impacts on aquifers compared to No Action Alternative 1-18 Scenario 2. The increased buffer widths required for pesticide applications under No 19 Action Alternative 1-Scenario 1, Alternative 2, and Alternative 3 would result in slightly 20 less impact on surface waters resulting in a reduction in the potential for the interaction of 21 contaminated surface water with aquifers. Overall, impacts are expected to be similar to 22 or slightly lower than those described for No Action Alternative 1-Scenario 2 (i.e., no 23 substantial impacts). 24
Alternative 4 25 The potential groundwater impacts resulting from pesticide or fertilizer application under 26 Alternative 4 are expected to be nearly identical to the impacts associated with No Action 27 Alternative 1-Scenario 1, but lower than No Action Alternative 1-Scenario 2. The 28 biggest difference is that the minor reduction in the potential for pesticide drift to surface 29 waters during aerial application under Alternative 4 could result in a decrease in the level 30 of pesticides reaching groundwater or hyporheic zones (through a reduction in the 31 exchange with potentially contaminated surface waters, as discussed above); a slight 32 decrease compared to No Action Alternative 1-Scenario 1 and more of a decrease 33 compared to No Action Alternative 1-Scenario 2. 34
Alternative 4 is expected to result in similar but slightly lower impacts on aquifers 35 compared to No Action Alternative 1-Scenario 1 and even less of an impact when 36 compared to No Action Alternative 1-Scenario 2. The increased buffer widths required 37 for pesticide and fertilizer applications under Alternative 4 may result in slightly less 38 sole-source aquifer contamination, through a reduction in the potential for contaminated 39 surface water to interact with and adversely impact groundwater. 40
Water Resources Draft EIS
4-84
Chapter 4 Water Quantity 1 Overview of Effects 2 None of the alternatives are expected to measurably alter the availability of water to 3 aquifers. Therefore, only effects to hyporheic zone water quantity are considered. 4
Detailed Effects Analysis 5 No Action Alternative 1-Scenario 2 6 Based on the assumptions stated above, No Action Alternative 1-Scenario 2 would have 7 the highest likelihood for adverse impacts to the hydrology of hyporheic zones due to the 8 narrow buffers on streams, especially Type 1 and 2 streams, which would contain most of 9 the alluvial channels with significant hyporheic zones. A mitigating factor for large 10 streams (Type 1 or S) is the Shoreline Management Act that requires a 200-foot Shoreline 11 Management Zone buffers on each side of these streams, and allows no more than 30 12 percent timber volume removal every 10 years. The Shoreline Management Act applies 13 regardless of alternative. 14
No Action Alternative 1-Scenario 1, Alternative 2, and Alternative 3 15 No Action Alternative 1-Scenario 1 (and Alternatives 2 and 3) would have a lower 16 likelihood for adverse hyporheic zone impacts than No Action Alternative 1-Scenario 2 17 based on buffer width and the increased protection of riparian areas on all streams, 18 particularly Type S and F streams. No Action Alternative 1-Scenario 1 (and Alternatives 19 2 and 3) all include protection of Channel Migration Zones, which also provides 20 additional protection for hyporheic zones. 21
Alternative 4 22 Alternative 4 would offer the greatest protection concerning riparian areas, particularly 23 on low-gradient streams that would be most likely to have extensive hyporheic zones in 24 alluvial channels. The protection of hyporheic zones would be substantially greater 25 under Alternative 4, and impacts would be less, compared to either scenario of No Action 26 Alternative 1 because of the larger no-harvest riparian zones. 27
28
Draft EIS Vegetation
4-85
Chapter 4
4.6 VEGETATION 1 This subsection considers the effects of the alternatives on forest vegetation, including 2 the potential indirect effects that may result from an increased occurrence of fire. It also 3 considers the potential effects to threatened and endangered plants and invasive weeds. 4
In reading this analysis, it should be remembered from Chapter 2 (Alternatives) hat under 5 No Action Alternative 1 no ITPs or ESA Section 4(d) take authorization would be issued. 6 This lack of action would likely affect the Forest Practices Program in a way that is 7 difficult to predict. Therefore, two scenarios, which represent the endpoints of the 8 reasonable range of possible outcomes for the Washington Forest Practices Rules, have 9 been defined (subsection 2.3.1, No Action Alternative 1 (No Action)) to represent the 10 No-Action Alternative. The effects of No Action are displayed for both of these 11 endpoints in the following subsections, but the actual outcome and the actual effects of 12 No Action on forest vegetation, threatened and endangered plants, and invasive weeds are 13 likely to fall between these two scenarios. 14
4.6.1 Evaluation Criteria 15 Evaluation criteria used in this analysis include the amount of: 16
• Early-, mid-, and late-seral vegetation, both short term (next 10 years) and long term. 17 This measure considers the differences in riparian buffer widths under each 18 alternative. 19
• Landowner support for, and participation in, forest management programs. This 20 measure considers the likelihood that investment in silvicultural treatments would be 21 implemented to speed the development of complex forest structures under some 22 alternatives. 23
• Area with a high potential for fire. This measure considers the amount of area with 24 snags and standing trees surrounded by logging slash. 25
• Area with potential for adverse effects to existing threatened and endangered plants. 26 This measure considers the amount of disturbance from timber harvest, including 27 thinning, roads, and yarding corridors, as well as likely disturbance from windthrow. 28
• Area with increased exposure to invasive weeds. This measure considers the amount 29 of disturbance from roads, skid trails, and regeneration harvest. 30
4.6.2 Forest Vegetation 31 4.6.2.1 Overview of Effects 32 Forest vegetation is shaped by both natural events and human activities, past, present, and 33 future. Currently, available vegetation data indicate that early- and mid-seral stands 34 dominate State, county, city, and private forestlands in Washington; that is, the lands 35 covered by the Washington Forest Practices Rules (covered lands). The covered lands 36 are expected to continue to support primarily early- and mid-seral vegetation for the 37 foreseeable future, except within RMZs. Riparian buffers proposed under the alternatives 38 would result in changes over time, depending on their width and prescriptions. The 39
Vegetation Draft EIS
4-86
Chapter 4 buffers proposed for the westside of the Cascades differ from those proposed for the 1 eastside under No Action Alternative 1, both scenarios, and Alternatives 2 and 3. They 2 would be the same for both sides of the Cascades under Alternative 4. Figure 4.2-1 3 presents a summary of the estimated RMZ acres for western (private lands only) and 4 eastern (private and State lands) Washington under each of the alternatives, and indicates 5 the level of management or protection afforded different portions of these RMZs. 6
The covered lands include approximately 72 percent of the Sitka Spruce vegetation zone, 7 62 percent of the Western Hemlock zone, and 28 percent of the Grand fir/Douglas-fir and 8 Ponderosa Pine zones (subsection 3.6.1, Forest Vegetation). The alternatives would have 9 a greater effect on the Sitka Spruce and Western Hemlock zones than on forests in other 10 vegetation zones. Only minor amounts of the other zones would be affected by the 11 proposed alternatives. 12
Under all alternatives, westside State trust lands (approximately 1,390,000 acres) would 13 continue to be managed under the State Trust Lands HCP, approximately 31 percent of 14 which would be within RMZs (Washington DNR 2004c). These lands would not be 15 affected by changes proposed in this analysis. 16
4.6.2.2 Detailed Effects Analysis 17 No Action Alternative 1-Scenario 2 18 No Action Alternative 1-Scenario 2 assumes that the Washington Forest Practices Rules 19 that were in effect on January 1, 1999 would be implemented. Covered lands on the 20 westside (approximately 6,289,000 acres) would be managed under the January 1, 1999 21 Washington Forest Practices Rules. Approximately 7 percent of these lands would be 22 within the no-harvest or light selective harvest riparian zones (Figure 4.2-1). Another 1 23 percent would be in the moderate to heavy selective harvest zone (Figure 4.2-1). These 24 buffers would retain early to mid-seral forest characteristics and, in time, would develop 25 into late-seral forest. In total, almost 9 percent of the covered lands on the westside 26 would develop late-seral forest characteristics over the long term, compared to 27 approximately 1 percent now (Washington Forest Practices Board 2001a). As the 28 amount of acres in late-seral conditions increases, there would naturally be a 29 corresponding decrease in early and mid-seral forest. 30
Approximately 3 percent of the covered lands on the eastside would be within the no-31 harvest or light selective harvest riparian zones (Figure 4.2-2). Almost 2 percent would 32 be in the moderate to heavy selective harvest zone (Figure 4.2-2). These buffers would 33 retain mid-seral forest characteristics and, in time, would develop into late-seral forest. 34 In total, approximately 5 percent of the covered lands on the eastside would develop into 35 late-seral forest characteristics over the long term, compared to approximately 5 percent 36 now (Washington Forest Practices Board 2001a). Also, 50 percent of the area outside of 37 the RMZ is likely to be managed using a selection harvest prescription (Personal 38 Communication, Charlene Rodgers, Washington DNR, April 6, 2004) and may retain 39 enough trees to develop some of the characteristics associated with mid- or late-seral 40 forest. 41
Draft EIS Vegetation
4-87
Chapter 4 Management under No Action Alternative 1-Scenario 2 may result in a reduction of 1 landowner participation in non-regulatory programs and further reductions in silvicultural 2 investments by private forest landowners and the State compared to the status quo (or No 3 Action Alternative 1-Scenario 1). There would be substantially less land in protective 4 stream buffers than under No Action Alternative 1-Scenario 1. Under this scenario, there 5 would be little or no incentive to implement thinning and fertilization programs to speed 6 the development of late-seral conditions in riparian areas. No Action Alternative 1-7 Scenario 2 would not likely increase the fire potential because the area with standing 8 trees and snags adjacent to logging slash would not increase over current conditions. 9
No Action Alternative 1-Scenario 1 10 No Action Alternative 1-Scenario 1 assumes that current Washington Forest Practices 11 Rules would continue to be implemented. Covered lands on the westside (approximately 12 6,289,000 acres) would continue to be managed under the current Washington Forest 13 Practices Rules. Approximately 16 percent of these lands would be within the no-harvest 14 or light selective harvest riparian zones (RMZ core zone or inner zone, respectively) 15 (Figures 4.2-1). Another 4 percent would be in the moderate to heavy selective harvest 16 zone (RMZ outer zone) (Figure 4.2-1). These buffers would retain early- to mid-seral 17 forest characteristics and, in time, would develop into late-seral stands. In total, 18 approximately 20 percent of the covered lands on the westside would develop late-seral 19 characteristics over the long term, compared to approximately 1 percent under current 20 conditions (Washington Forest Practices Board 2001a). As the amount of acres in late-21 seral conditions increases, there would naturally be a corresponding decrease in early- 22 and mid-seral forest. 23
About 3,365,000 acres of covered lands exist on the eastside of the Cascades. 24 Approximately 9 percent of these lands would be within the no-harvest or light selective 25 harvest riparian zones (Figure 4.2-2). Another 1 percent would be in the moderate to 26 heavy selective harvest zone (Figure 4.2-2). These buffers would retain mid-seral forest 27 characteristics and, in time, would develop into late-seral forest. In total, approximately 28 9 percent of the covered lands on the eastside would develop late-seral characteristics 29 over the long term, compared to approximately 5 percent at present (Washington Forest 30 Practices Board 2001a). There would be a small corresponding decrease in early- and 31 mid-seral forest. Also, 50 percent of the area outside of the RMZ would likely be 32 managed using a selection harvest prescription (Personal Communication, Charlene 33 Rodgers, Washington DNR , May 2004) and may retain enough trees to develop some of 34 the characteristics associated with mid- or late-seral forest. 35
In general, No Action Alternative 1-Scenario 1 would likely result in substantially 36 reduced silvicultural investments by private forest landowners and the State. Less 37 thinning and fertilization would likely delay development of late-seral conditions in 38 riparian areas. This alternative may increase the short-term fire potential slightly by 39 increasing the area with standing trees and snags adjacent to logging slash. Also, No 40 Action Alternative 1-Scenario 1 would “feather” the edges of riparian buffers by allowing 41 moderate to heavy selective harvest in the outer zone of the buffer, light selective harvest 42
Vegetation Draft EIS
4-88
Chapter 4 in the inner zone, and no harvest in the core zone (Note: there is no outer, inner, or core 1 zone equivalent under No Action Alternative 1-Scenario 2). 2
Alternative 2 3 Under Alternative 2, riparian buffer areas on covered lands would be similar to those 4 described under No Action Alternative 1-Scenario 1 but substantially more protective 5 than under No Action Alternative 1-Scenario 2. In addition, implementation and 6 participation in non-regulatory programs by all parties is expected to continue at a high 7 rate, leading to increased investment in silvicultural activities, such as thinning, designed 8 to speed development of late-seral conditions in riparian areas and on some upland lands 9 owned by the State. Alternative 2 may result in a short-term increase in fires as 10 compared to No Action Alternative 1-Scenario 1 because of the expected increase in 11 thinning, which would increase the area with standing trees and snags intermixed with 12 slash (from thinning). However, over the longer-term, thinning, particularly in eastern 13 Washington, would reduce dangerous fuel loads in riparian buffers that would 14 accumulate over time. Additionally, as under No Action Alternative 1-Scenario 1, 15 Alternative 2 would “feather” the edges of buffer areas by allowing moderate to heavy 16 selective harvest in the outer zone of the buffer, light selective harvest in the inner zone, 17 and no harvest in the core zone. 18
Alternative 3 19 Under Alternative 3, riparian buffer areas on covered lands would be similar to those 20 described under No Action Alternative 1-Scenario 1 but substantially more protective 21 than under No Action Alternative 1-Scenario 2. In addition, implementation and 22 participation in non-regulatory programs by all parties is expected to continue at a 23 moderate rate but higher than under No Action Alternative 1-Scenario 1. Investment in 24 silvicultural activities designed to speed development of late-seral conditions in riparian 25 areas and on some uplands owned by the State is, therefore, expected to be more than 26 under No Action Alternative 1-Scenario 1 (but less than under Alternative 2). As under 27 No Action Alternative 1-Scenario 1, Alternative 3 would “feather” the edges of buffer 28 areas by allowing moderate to heavy selective harvest in the outer zone of the buffer, 29 light selective harvest in the inner zone, and no harvest in the core zone. 30
Alternative 4 31 Alternative 4 assumes that current Washington Forest Practices Rules would be repealed 32 and that new, more protective, Washington Forest Practices Rules would be developed 33 and implemented. Covered lands on the westside (approximately 6,289,300 acres) would 34 be managed under more restrictive Washington Forest Practices Rules. Nearly 41 35 percent of these lands would be within the no-harvest riparian zones (Figure 4.2-1). 36 These buffers would retain early to mid-seral forest characteristics and, in time, would 37 develop into late-seral forest. Therefore, approximately 41 percent of the covered lands 38 on the westside would develop late-seral characteristics over the long term, compared to 39 less than 1 percent now (Washington Forest Practices Board 2001a). As the amount of 40 acres in late-seral conditions increases, there would naturally be a corresponding decrease 41 in early and mid-seral forest. 42
Draft EIS Vegetation
4-89
Chapter 4 Over 25 percent of the covered lands on the eastside lands would be within the no-harvest 1 riparian buffers (Figure 4.2-2). These buffers would retain early to mid-seral forest 2 characteristics and, in time, would develop into late-seral forest, compared to 3 approximately 5 percent at present (Washington Forest Practices Board 2001a). This 4 would result in a large decrease in early- and mid-seral forest over that period. Another 5 50 percent are likely to be managed using a selection harvest prescription and may retain 6 enough trees to develop some of the characteristics associated with mid- or late-seral 7 forest. 8
While management under this alternative would result in much larger no-harvest RMZs 9 compared to the No Action Alternative 1 scenarios, a reduction in landowner 10 participation in non-regulatory programs would also likely result. Silvicultural 11 investments by private forest landowners and the State (thinning and fertilization) are 12 likely to be substantially reduced below current conditions and any of the other 13 alternatives. Substantially more forestland would likely be converted to other uses, such 14 as housing, because of the more restrictive regulations governing forest management 15 compared to either scenario of No Action Alternative 1. 16
Alternative 4 would be expected to result in an increase in fires, especially in eastern 17 Washington, as compared to the No Action Alternative 1 scenarios because of wider no-18 harvest RMZs that would contain more trees and snags than the other alternatives. Also, 19 all existing down woody debris would be retained. The increased amount of standing and 20 down wood and the “ladder effect” that would result from the mixture of understory trees 21 and other plants, mid canopy trees, and upper canopy trees would result in an increase in 22 fires. Any fires that do start would likely burn hotter and for a longer time under 23 Alternative 4 than under either scenario of No Action Alternative 1. Therefore, the 24 potential for intense, stand-replacement fires would be highest compared to other 25 alternatives because of the lack of thinning or understory burning within the riparian 26 zone. 27
4.6.3 Threatened and Endangered Plants 28 4.6.3.1 Overview of Effects 29 The species list on Table 3-16 shows that the federally listed and candidate species on 30 covered lands have varying habitat needs, such as wetlands, stream edges, open meadows 31 and forested areas. Several species (Arenaria paludicola, Hackelia venusta, Castilleja 32 leviseta, Lupinus sulphureus spp. Kindaidii) prefer habitats such as open grassland, rock 33 crevices, prairies, or bogs that are unlikely to be directly affected by tree harvest. 34 However, they may occur adjacent to harvest areas and could be affected by related 35 activities. Other species can occur in forest openings, edges, or along streams with 36 relatively open canopies and could be affected by harvest or related activities. Direct 37 effects to federally listed or candidate plants include physical damage or destruction of 38 the plant due to harvest, including thinning, or related activities such as road construction 39 or use of yarding corridors. Indirect effects include changes in the micro-environment, 40 such as changes in canopy (i.e., available sunlight), changes in hydrology, and increases 41 in competition from invasive weeds or other plants. The range of effects is varied 42
Vegetation Draft EIS
4-90
Chapter 4 because the species have different habitat requirements and life histories. Therefore, each 1 species would potentially have a different sensitivity to particular disturbances. 2
The alternatives considered in this analysis do not propose to change any policies or 3 procedures for managing threatened, endangered, and candidate plants. Under all 4 alternatives, Washington DNR is required to consult with WDFW regarding State-5 designated threatened and endangered species and their habitats before approving forest 6 practices applications. The difference in potential effects of the alternatives is a function 7 of the type and amount of harvest in habitats that may contain federally listed or 8 candidate plant species. Although the majority of species listed in Table 3-16 prefer open 9 habitat, for purposes of this DEIS, it is assumed that more harvest and harvest related 10 disturbance has a greater probability of physically disturbing existing plant populations or 11 their habitat. For this analysis, it is assumed light management practices combined with 12 large RMZs and significant wetland protection decreases the potential for adversely 13 affecting currently existing federally listed and candidate plants. 14
4.6.3.2 Detailed Effects Analysis 15 No Action Alternative 1-Scenario 2 16 No Action Alternative 1-Scenario 2 has the greatest potential for effects on federally 17 listed and candidate plants currently existing on the landscape because the amount of 18 disturbed habitat would be highest under this alternative. Additionally, RMZs would be 19 relatively narrow and allow broader management practices compared to the other 20 alternatives, increasing the potential of additional direct and indirect affects from 21 windthrow. 22
No Action Alternative 1-Scenario 1, Alternative 2, and Alternative 3 23 No Action Alternative 1-Scenario 1, and Alternatives 2 and 3 all would protect a similar 24 amount of riparian and wetland area. However, Alternative 2 is likely to include greater 25 amounts of thinning in the RMZ to speed the development of complex forest structure, 26 depending on the results of research conducted under the Alternative 2 adaptive 27 management program. This may result in greater direct and indirect effects on listed and 28 candidate plants currently existing on the landscape than under No Action Alternative 1-29 Scenario 1 but less effect compared to No Action Alternative 1-Scenario 2. 30
Alternative 4 31 Alternative 4 would provide the most protection among all alternatives for listed and 32 candidate plants currently existing on the landscape, because of the wide no-harvest 33 buffers for RMZs (Figure 4.2-1), limited cutting of forested wetlands (70 percent canopy 34 to remain), and buffers for all non-forested wetlands. However, there may be changes to 35 available light, damage due to windthrow or fire, or increased competition due to noxious 36 weed introduction. Protection of listed and candidate plants would be greater under this 37 alternative than under No Action Alternative 1-Scenario 1 and much greater than under 38 No Action Alternative 1-Scenario 2 because of the substantially more protective riparian 39 buffers expected under this alternative. 40
Draft EIS Vegetation
4-91
Chapter 4 4.6.4 Invasive Plants 1 4.6.4.1 Overview of Effects 2 Many invasive plants thrive in disturbed areas. Once they become established, they often 3 out-compete native species because they often benefit from changes in microclimate, 4 such as increased sunlight, changes in hydrology, and creation of bare mineral soil. It is 5 assumed for this analysis that greater disturbance would result in increased opportunities 6 for invasive plant species to become established. 7
State requirements under the Weed Law (RCW Chapter 17.10) would apply to all 8 alternatives. Management programs to prevent new infestations and to contain existing 9 ones would continue under all alternatives. 10
No Action Alternative 1-Scenario 2 is likely to provide the best conditions for invasive 11 plants to colonize because there would be relatively little undisturbed habitat under this 12 alternative. 13
No Action Alternative 1-Scenario 1, Alternative 2, and Alternative 3 would all protect a 14 similar amount of riparian area, although much of the protected area would be available 15 for partial harvest. In particular, Alternative 2 is likely to include greater amounts of 16 thinning designed to speed the development of complex forest structure than No Action 17 Alternative 1-Scenario 1. However, thinning and partial harvest may allow invasive 18 plants to become established, increasing competition with desirable understory plant 19 communities. 20
Alternative 4 would provide the largest amount of undisturbed area among all 21 alternatives, especially when compared to No Action Alternative 1-Scenario 2 but also 22 No Action Alternative 1-Scenario 1 because of the wide, no-harvest buffers (Figures 4.2-23 1 and 4.2-2); although there may be some disturbance from windthrow and fire. 24 Alternative 4 may also result in less road construction because of the requirement of “no 25 net increase” in roads within a watershed; this factor may also reduce the spread of 26 invasive plants, allowing more desirable understory plant communities to have less 27 competition from invasive species over large portions of the landscape. Approximately 28 41 percent of the westside covered lands and 25 percent of the eastside covered lands 29 would be protected in no-harvest RMZs (Figures 4.2-1 and 4.2-2). 30
31
32
Vegetation Draft EIS
4-92
Chapter 4 This page is intentionally left blank. 1
2
Draft EIS Riparian and Wetland Processes
4-93
Chapter 4
4.7 RIPARIAN AND WETLAND PROCESSES 1
4.7.1 Riparian Processes 2 The establishment of RMZs is generally accepted as the most effective way of protecting 3 aquatic and riparian habitats (Cummins et al. 1994; Spence et al. 1996; FEMAT 1993). 4 Evaluation of the anticipated effects of the proposed alternatives on riparian habitats is 5 based primarily on the current or proposed widths and management prescriptions within 6 RMZs and the associated acreages. 7
4.7.1.1 Evaluation Criteria for Riparian Processes 8 Criteria used to determine the effectiveness of the proposed RMZ management allowed 9 under each alternative are based on the riparian functions that were described in 10 subsection 3.7.1 (Riparian Functions). The effectiveness of each alternative can best be 11 evaluated within the context of specific protection goals. Most functions are evaluated in 12 terms of protection goals for fish and water quality. However, for microclimate, which is 13 more likely to affect semi-aquatic species such as amphibians, a variety of components 14 was considered including humidity, soil moisture and temperature, and air temperature. 15 As a result, riparian functions are evaluated in terms of the estimated level of protection 16 necessary to provide full protection (i.e., near 100 percent effectiveness), and is intended 17 to serve only as a comparative method to evaluate each alternative. 18
The evaluation criteria are mostly defined in terms of curves, which represent the 19 relationship between the cumulative effectiveness of the riparian function and the 20 distance from the streambank. Therefore, these curves show the estimated degree of 21 protection of riparian function provided by different RMZ widths. The curves are based 22 on a wide variety of literature, and are generally conservative, (i.e., they reflect the widest 23 RMZs needed to provide complete protection, as identified in the literature), although the 24 discussions also consider lesser widths and other circumstances as appropriate. The 25 relationships between distance from stream and the percent of function maintained are 26 not all linear, and some are more theoretical than empirical. In all cases, the area closest 27 to the stream is more important for providing function than the areas further away 28 (FEMAT 1993). 29
Depending on the function, RMZ requirements may be defined as fixed RMZ widths or 30 based on site potential tree height. A site potential tree height is sometimes defined as 31 the average maximum height of the tallest dominant trees that can grow on a certain site 32 (FEMAT 1993). However, to maintain consistency with Washington Forest Practices 33 Rules, site potential tree height in this DEIS is defined as the average height of a stand at 34 a given age (more commonly referred to as site index). Site potential tree height in 35 Washington varies with site-class, species, and region (Table 4.7-1). Less productive 36 forestlands (Site Classes IV and V) will have a shorter site potential tree height, and more 37 productive forestlands (Site Classes I and II) will have a taller site potential tree height. 38 Additionally, westside trees tend to grow taller than eastside trees for the same site class, 39 due to climatic conditions and other factors on the westside (USDA Forest Service 1984). 40
Riparian and Wetland Processes Draft EIS
4-94
Chapter 4 Table 4.7-1. Site Potential Tree Height (SPTH) for Douglas-fir at 100 years 1
and 250 years for Western and Eastern Washington. 2 SPTH100 (feet) SPTH250 (feet)
Site Class Westside Eastside Westside Eastside I 200 130 247 195 II 170 110 210 170 III 140 90 174 135 IV 110 70 136 105 V 90 60 100 85
Sources: McArdle 1949, USDA Forest Service 1984. 3
Two stand ages, 100 years and 250 years, were used to evaluate the level of protection for 4 riparian functions. Forests and Fish Agreement stakeholders agreed to a site potential 5 tree height projected at a stand age of 100 years to represent the site potential tree height 6 for a mature riparian stand. However, old-growth stand characteristics may be a more 7 appropriate baseline from which to define adequate riparian effectiveness. Consequently, 8 riparian function effectiveness was analyzed for both 100-year and 250-year stands. The 9 choice of a 250-year stand was based upon the age at which stands begin to display old-10 growth characteristics (Franklin and Spies 1991) and the return intervals for fire and 11 blowdown for westside forests (Agee 1993). Site potential tree heights were based upon 12 an average of Site Class II and III areas; these site classes represent the most frequent site 13 classes on covered lands managed for timber production. The site potential tree height 14 for Douglas-fir stands was chosen for both the westside (McArdle 1949) and eastside 15 (extrapolated from Table I-12 in USDA Forest Service 1984). Notably, the site potential 16 tree height for ponderosa pine (Meyer 1961) at 250 years is approximately the same as 17 for Douglas-fir on the eastside. Neither of these stand-age criteria has been 18 experimentally tested for providing an adequate level of riparian function that is 19 sufficient for maintaining robust populations of salmonids. 20
It is assumed that RMZ widths based on 100- and 250-year site potential tree heights 21 represent the range of site potential tree heights over which most riparian functions are 22 likely to be fully expressed. For example, for an eastside Site Class II riparian area, 23 adequate protection would be provided with a RMZ somewhere between 110 and 170 24 feet. This range represents the uncertainty surrounding the tree height that provides 25 complete protection. If a 250-year site potential tree height is chosen as the standard 26 against which to compare RMZ widths, but complete protection is actually provided by a 27 100-year site potential tree height, then 60 feet of the 170-foot RMZ width would 28 represent over-protection. Conversely, if a 100-year site potential tree height is chosen 29 for measuring RMZ widths, but a 250-year site potential tree height is the true site 30 potential tree height that provides full protection, then the 110-foot RMZ would represent 31 under-protection by 60 feet. It is possible that an intermediate site potential tree height is 32 more appropriate or that streams with different morphological and riparian characteristics 33 have different site potential tree height levels that provide full protection for that stream 34 type. 35
Draft EIS Riparian and Wetland Processes
4-95
Chapter 4 LWD Recruitment 1 This evaluation is based on the level of protection provided for LWD recruitment 2 potential from the riparian area using the RMZ width and silvicultural prescription. 3 Based on a review of the literature (e.g., McDade et al. 1990; FEMAT 1993; Spence et al. 4 1996), it was concluded that an RMZ width of about one site potential tree height is 5 needed to provide full protection of LWD recruitment by toppling, windthrow, or stream 6 undercutting. An exception to this may occur in second-growth stands where hardwoods 7 have excluded regeneration of conifers or overstocking of stands has lead to the depletion 8 of large size classes of recruitable LWD (Spence et al. 1996). As a result, consideration 9 was also given to stand manipulation to increase tree size over time. Therefore, growth 10 rate modeling of tree diameter and age to reach functional and key piece recruitment size, 11 based on different silvicultural prescriptions and different stream sizes, was also used 12 when evaluating alternatives. The relationship between the estimated level of LWD 13 recruitment potential and RMZ width used in the alternative evaluation is shown in 14 Figure 4.7-1. The modeling assumes the effects of LWD recruitment when trees reach 15 the designated age (i.e., 100 or 250 years). Actual recruitment of LWD, to the modeled 16 level in most areas, will take decades or longer as most riparian areas have been 17 harvested in the past and likely are only 50 years or less in age. To quantify this 18 relationship over all streams under different alternatives, an equivalent buffer area index 19 was calculated for each alternative using both 100-year and 250-year site potential tree 20 height as baselines for full protection of LWD recruitment potential (DEIS Appendix B). 21 The equivalent buffer area index provides a weighted measure of the degree of protection 22
Figure 4.7-1. Relationship between the Estimated Level of LWD Recruitment 23 Potential and RMZ Width Used in the Alternative Evaluation. 24
25
Sources: McDade et al. 1990; FEMAT 1993.
Riparian and Wetland Processes Draft EIS
4-96
Chapter 4 provided by all streams giving consideration to stream size, RMZ widths, RMZ 1 prescriptions, source distance, and the relative length of each stream type over the 2 landscape. 3
The actual LWD model assumes that all major wood sources arrive at the stream 4 primarily in a chronic manner through mortality of trees adjacent to the stream and does 5 not attempt to determine wood from other sources (McDade et al. 1990). However, the 6 actual sources of wood can vary quite widely in streams depending on natural tree 7 mortality rate, topography, climate, substrate, natural disasters (fires, wind storms, large 8 floods) (Benda et al 2003; Martin and Benda 2001; Reeves et al. 2003). Drainages with 9 high mass wasting potential could have a substantial portion of the LWD originate 10 outside of the riparian area (Reeves et al. 2003; Benda et al. 2003). The opposite is true 11 for streams with eroding banks where active channel movement undercut trees along the 12 stream edge. In the first case (i.e., mass wasting-dominated recruitment) the model 13 would overestimate the contribution of wood from the protected RMZ in which case the 14 model would overestimate the protection provided by an RMZ. While in the second case 15 (bank erosion-dominated recruitment) the model would underestimate the contribution 16 from the RMZ nearest the stream, and the model would underestimate the LWD 17 contribution from the RMZ. It is likely that some of both situations will occur in 18 different regions of the analysis area, so that the model both over and under estimates the 19 RMZ protection provided. But the McDade et al. 1990 information is considered a useful 20 tool for evaluating the effect of buffer width on LWD recruitment (Spence et al. 1996) 21 and has been used by others (Welty et al. 2002) as a good representation of LWD sources 22 for Pacific Northwest streams. 23
While McDade et al. (1990) served as the quantitative basis for establishing the 24 equivalent buffer area index for LWD recruitment originating from RMZs, the analysis 25 also considered supplemental LWD recruitment that would occur as a result of unstable 26 slope protection under each alternative. Many unstable slopes and landforms (e.g., 27 channel heads, bedrock hollows, inner gorges) are located in close proximity to stream 28 channels and as such, serve as potential source areas for wood recruitment. Protection of 29 these areas through tree retention increases potential LWD recruitment where unstable 30 slopes and landforms extend beyond required RMZs. While not quantified in this 31 analysis, unstable slopes protection under each alternative was considered when 32 evaluating the effects on LWD recruitment. 33
Leaf and Needle Litter Production 34 This evaluation is based on width of the respective RMZs and activities allowed within 35 the RMZ that may affect leaf and needle litter inputs (i.e., “detrital input”). Leaves and 36 needles, as well as other biological inputs (e.g., terrestrial insects), enter the stream from 37 riparian vegetation and supply nutrients and food to stream systems. Due to historical 38 harvest practices, leaf and needle litter supply has been substantially reduced. Leaf and 39 needle inputs can be a major contributor to fish food production in streams (Wipfli 1997; 40 Piccolo and Wipfli 2002; Bilby and Bisson 1992; Bisson and Bilby 1998). Little direct 41 information is available that describes leaf and litter source distances from streams. 42
Draft EIS Riparian and Wetland Processes
4-97
Chapter 4 Spence et al. (1996) stated buffers designed to supply LWD recruitment would provide 1 100 percent of allochthonous detritus (See Glossary) (i.e., FEMAT (1993)) hypothesized 2 that a distance of approximately 0.5 site potential tree height would provide most leaf and 3 litter inputs. The estimated relationship used in this analysis is shown in Figure 4.7-2. 4 FEMAT (1993) based this hypothesis on a study (Erman et al. 1977) of benthic 5 invertebrate diversity in buffered and unbuffered streams in northern California. Others 6 have found litter input to streams decreases exponentially with distance (Conners and 7 Naiman 1984) so the curve (Figure 4.7-2) may be conservative relative to contribution by 8 distance. 9
The amount of detrital input may remain high, and benthic invertebrate production 10 diverse even in recently harvested riparian areas depending on the type of vegetation that 11 regrows in the short term. But as the riparian area ages, following riparian zone tree 12 harvest, it passes through stages where terrestrial input (e.g., leaf litter, needles) decreases 13 substantially from old growth levels (Piccolo and Wipfli 2002). Although uncertainty 14 exists about the validity of the leaf and litter distance hypothesis developed by FEMAT 15 (1993) for use in the Pacific Northwest, it was used in this analysis because no other 16 criteria are available. 17
Figure 4.7-2. Relationship between the Estimated Level of Leaf and Needle 18 Litter Recruitment and RMZ Width Used in the Alternative 19 Evaluation. 20
21
Source: FEMAT 1993.
Riparian and Wetland Processes Draft EIS
4-98
Chapter 4 Stream Shade 1 Given that there is site-specific variation that determines shade, it was concluded that 2 RMZ widths of approximately 0.75 site potential tree height for both east and westsides 3 are needed to provide full protection of stream shading capacity along most perennial 4 streams. The criterion used here is not intended to correspond specifically to State water 5 quality temperature standards, which do not necessarily require full shade retention, but 6 instead, the criterion is used as a method of comparing the degree to which each 7 alternative meets full shading capacity. The criterion is based upon the shade curve in 8 FEMAT (1993). The estimated relationship used in our analysis for most perennial 9 streams is shown in Figure 4.7-3. However, for small streams (less than 5 feet wide) that 10 are often completely shaded by understory vegetation and therefore lack riparian canopy 11 openings in their undisturbed state, an RMZ width of less than 0.75 site potential tree 12 height was determined sufficient to provide enough shade to maintain stream 13 temperatures. Broderson (1973) reported that for small streams (less than 5 cubic 14 feet/second mean flow) a 50-foot buffer supplied 85 percent of maximum shade. As a 15 result, a 50-foot buffer was used as the evaluation criterion for shade along small 16 perennial streams. For seasonal streams that do not flow during the summer, stream 17 shade should have minimal to no effect on temperature and therefore, were not 18 considered when evaluating shade requirements. 19
According to this DEIS analysis, the protection of unstable slopes under each alternative 20 supplements shade provided by RMZs. This is particularly true where unstable slopes 21 and landforms such as channel heads, bedrock hollows, and inner gorges are located 22 immediately adjacent to stream channels. While not quantified, the degree to which each 23 alternative supplements shade levels via unstable slopes protection was also considered in 24 the effects analysis. 25
Microclimate 26 While there are differing recommendations on RMZ widths for maintaining microclimate 27 gradients, the results of Brosofske et al. (1997); Dong et al. (1998); and FEMAT (1993) 28 provide basic guidelines to evaluate the alternatives. Brosofske et al. (1997) noted that a 29 buffer of at least 147 feet was needed to maintain natural microclimate conditions along 30 small forest streams that they studied, but for some microclimate variables, buffer widths 31 may need to be much greater. Because the conclusions of these studies were generally 32 site specific, their applicability as evaluation criteria is uncertain. Dong et al. (1998) 33 found that buffer widths ranging from 52 to 236 feet had similar effects on air 34 temperature near the stream, with little correlation of temperature to buffer width. But 35 this study also found that air temperature near all streams increased following harvest to 36 the buffer edge, including those with buffers greater than 235 feet. While the results of 37 these and other studies used by FEMAT (1993) do not show a clear correlation between 38 buffer width and microclimate, they are useful in helping to narrow the range of possible 39 buffer effects. Based on curves shown in Figure 4.7-4 and information provided in the 40 above studies, a minimum of 147 feet is considered necessary to maintain most 41 microclimatic gradients while for air temperature, buffer widths greater than 230 feet are 42 thought to be required. 43
Riparian and Wetland Processes Draft EIS
4-100
Chapter 4 Bank Stability 1 Bank stability is of direct and indirect importance to aquatic resources because it affects 2 such factors as sediment inputs to streams and streambank habitat. Based on information 3 presented in Spence et al. (1996), a buffer width of 0.3 site potential tree height is 4 adequate to maintain bank stability of most streams (Figure 4.4-3). The details of the 5 criteria used for assessing bank stability are discussed in detail in subsection 4.4.2.1 6 (Mass Wasting Evaluation Criteria). 7
4.7.1.1.1 Sediment Filtration 8 The amount of sediment reaching streams from timber harvest activity, independent of 9 that entering directly from tributary streams but related to timber harvest activities, is 10 dependent on many factors. These factors are often influenced by buffer width and type 11 of ground disturbing activities. The details of the criteria used to evaluate the level of 12 sediment filtration, or capacity for buffers to intercept sediment, are presented in 13 subsection 4.4.1.1 (Surface Erosion Evaluation Criteria). The evaluation is based on the 14 development of a simple sediment equivalent buffer area index that relates the relative 15 filtration capacity to the buffer width and type of ground disturbance occurring. This 16 equivalent buffer area index is explained in DEIS Appendix B. 17
The analysis also considers floodplain and riparian roughness in the form of trees, 18 understory vegetation and downed wood, which helps to dissipate energy and capture 19 sediment delivered to the riparian area during overbank flows (Fetherson et al. 1995). 20 The sediment equivalent buffer area index is used to evaluate this function as well, 21 although its primary purpose is to measure sediment filtration function. 22
4.1.1.2 Evaluation of Effects of Alternatives on Riparian Processes 23 As noted in subsection 4.1.2 (Review of the Alternatives), because of the similarities of 24 expected actions among some alternatives, especially relative to riparian RMZs, the 25 effects discussion for the alternatives is primarily divided into three groups: 1) No 26 Action Alternative 1-Senario 2; 2) No Action Alternative 1-Scenario 1, Alternative 2, and 27 Alternative 3; and 3) Alternative 4. 28
Because each alternative has a different stream classification scheme and different buffer 29 requirements, it is difficult to quantitatively compare the effectiveness of the different 30 alternatives in protecting riparian functions. Nevertheless, a quantitative sense of the 31 level of protection afforded to specific processes can be gained by considering riparian 32 RMZ width together with allowable level of activity within that RMZ. Therefore, for 33 each function analyzed, an evaluation is made of both the RMZ widths and the allowable 34 prescriptions that occur within the RMZ. Figure 4.7-5 compares the RMZ widths and the 35 allowable prescriptions for each stream type under each alternative in western 36 Washington, and Figure 4.7-6 provides the same comparison for the eastside. 37
Draft EIS Riparian and Wetland Processes
4-101
Chapter 4
Figure 4.7-5. Western Washington RMZ Characteristics by Alternative (using Site Class II, Site Potential Tree Height = 170 feet, as an example1/) (Note: Does not include Channel Migration Zone or Beaver Habitat Zone).
1/ Under No Action Alternative 1-Scenario 1, Alternative 2, and Alternative 3, total width of the RMZ varies by site class, ranging from 90 feet (Site Class V) to 200 feet (Site Class I). 2/ For Type S and F streams, Option 1 calls for thinning from below in the inner zone, and 20 riparian leave trees per acre in the outer zone. 3/ For Type S and F streams, Options 2 calls for leaving enough riparian leave trees in the inner zone to meet the stand requirements (a basal area of 275 ft2/acre at stand age 140 years, in
this example of a Site Class II stand), plus an additional 20 riparian leave trees per acre in the outer zone. If no-harvest restrictions in the core zone result in conditions that will exceed the stand requirements, fewer trees may be left in the outer zone.
4/ For most Type Np streams, a no-harvest buffer is established along the first 300 to 500 feet upstream of the confluence of an Np stream with a Type S or F stream and adjacent to specified areas so that no less than 50 percent of the length of the stream is buffered.
≤ = less than or equal to < = less than > = greater than
Draft EIS Riparian and Wetland Processes
4-102
Chapter 4Figure 4.7-6. Eastern Washington RMZ Characteristics by Alternative (using Site Class II, Site Potential Tree Height =
110 feet, as an example1/) (Note: Does not include Channel Mitigation Zone or Beaver Habitat Zone).[k13]
1/ Under No Action Alternative 1-Scenario 1, Alternative 2, and Alternative 3, total width of the RMZ varies by site class, ranging from 75 feet (Site Class V) to 130 feet (Site Class I). Note that the minimum RMZ width for streams greater than 15 feet wide is 100 feet.
2/ For Type S and F streams, the inner zone prescription requires leaving at least 50 trees per acre after harvest, of which 21 are the largest trees and 29 are at least 10 inches diameter breast height (dbh). If the resulting basal area is less than 90 feet2/acre, then enough additional 10-inch-or-greater trees must be left to meet this target.
3/ For Type S and F streams, the outer zone prescription requires leaving 50 trees per acres, of which 15 are at least 20 inches dbh. 4/ Clearcut strategy may be implemented in no more than 30 percent of the stream reach in a harvest unit, and only if an equal area is designated as a no-harvest zone. 5/ For most Type Np streams in partial cut areas, the 10 largest trees per acre, plus as many additional trees greater than 6 inches dbh as will result in a basal area of at least 90 ft2/acre,
must be left.
≤ = less than or equal to < = less than > = greater than
Draft EIS Riparian and Wetland Processes
4-103
Chapter 4 Another important aspect considered when evaluating the alternatives was susceptibility 1 to windthrow or blowdown. If an RMZ experiences substantial windthrow, it may not be 2 capable of maintaining desired functions. However, windthrow does improve LWD 3 recruitment during the short-term, and many channels (especially on the westside) are 4 currently in need of wood as a result of past riparian harvest and wood removal. The 5 RMZs under all alternatives are likely to experience some degree of windthrow in 6 localized areas. Windthrow is a normal occurrence in forests, but is known to increase 7 along harvest unit edges after timber harvest opens formerly interior forest trees to more 8 direct wind effects (Harris 1989). 9
RMZs along streams are subject to similar increases in windthrow. Several studies have 10 attempted to define the relationship between riparian windthrow and various physical and 11 biological features such as topography, valley morphology, aspect, slope, soil wetness, 12 and tree type (Steinblums 1978; Steinblums et al. 1984; Harris 1989). Though these site-13 specific factors may increase the vulnerability of an RMZ to wind events, no single factor 14 has emerged as being of particular importance on a landscape scale. However, since 15 blowdown is generally greater at the windward edge of a buffer, alternatives with wider 16 RMZs would provide more protection for riparian function. 17
Pollock and Kennard (1998) reanalyzed several windthrow data sets looking at the 18 relationship between buffer width and the likelihood of windthrow. They reached the 19 conclusion that buffers of less than 75 feet have a higher probability of suffering 20 appreciable mortality from windthrow than forests with wider buffers. 21
Data for blowdown within buffers from seven studies reported in Grizzel and Wolff 22 (1998) had a mean windthrow level of about 15 percent for 344 sites in western 23 Washington and Oregon with maximum windthrow levels ranging from 17 to 100 24 percent. Median windthrow levels were usually somewhat lower than the mean because 25 the data are not normally distributed with relatively few sites having extensive 26 blowdown. For example, the mean windthrow level for sites reported by Andrus and 27 Froelich (1986) was 21.5 percent while the median value was 15.5 percent (i.e., half of 28 the sites had less than 15.5 percent windthrow). Windthrow levels in Southeast Alaska 29 were found to average about 9 percent in 66-foot no-harvest RMZs over a 4 to 6 year 30 period following harvest, and most windthrow levels were less than 15 percent (Martin et 31 al. 1998). Martin et al. (1998) also suggested that increased windthrow from buffers 32 adjacent to geomorphic stream types with limited natural recruitment (via bank erosion) 33 could be beneficial for fish habitat. Susceptibility to blowdown is addressed as 34 appropriate in the effects analysis using a 75-feet buffer width as a general guideline. 35
Evaluation of the effects of the proposed alternatives on riparian habitats is also based on 36 a comparison of the estimated changes in total riparian area protected in some way. The 37 estimated amount of RMZ area, presented in terms of the total acreage protected in 38 different protection levels, is compared by alternative in Figure 4.2-1 for both western 39 and eastern Washington (See DEIS Appendix B for a description of the methods and 40 assumptions used to derive these estimates). This analysis differs by making more 41 simplified assumptions about tree density and removal quantity from that presented in 42
Riparian and Wetland Processes Draft EIS
4-104
Chapter 4 Appendix D of the Forest Practices Alternatives SEPA EIS (Washington Forest Practices 1 Board 2001a), but draws similar conclusions about levels of protection. 2
Changes in riparian management and its effects on riparian habitat are addressed for the 3 short term (10 years) and long term (50+ years). For each riparian function, the 4 timeframe to transition from a non-functional riparian system to one that could provide 5 most riparian functions is considered (Table 4.7-2). As discussed in subsection 3.7.1, 6 (Riparian Processes), most of the riparian landscape occurring in forested areas appears 7 to not be currently fully functioning. 8
Where some level of disturbance has occurred in riparian areas, an extended period 9 would be needed to attain DFCs that approach full function (Table 4.7-2). Although a 10 large proportion of State and private lands subject to Washington Forest Practices Rules 11 is currently in early-seral stages, riparian habitat should improve over time (10 to 100+ 12 years) to increase the amount of healthy riparian areas (Table 4.7-2). 13
LWD Recruitment 14 The effects of the alternatives on LWD recruitment are analyzed in this subsection. In 15 reading this analysis, it should be remembered from Chapter 2 (Alternatives) that under 16 the No Action Alternative no ITPs or ESA Section 4(d) take authorization would be 17 issued. However, this lack of action would likely affect the Forest Practices Regularoty 18 Program in a way that is difficult to predict. Therefore, two scenarios, which represent 19 the endpoints of the reasonable range of possible outcomes for the Forest Practices 20 Regulatory Program, have been defined (subsection 2.3.1, No Action Alternative 1 [No 21
Table 4.7-2. Percentage of Total Stream Miles Found in the Sample Sections1/ 22 by Seral Stage, and Estimated Time Scales for Recovery2/ of 23 Each Riparian Parameter.3/ 24
Recovery Periods (in years)
Seral Stage4/
Percent Seral
Stage on the
Westside
Percent Seral
Stage on the
Eastside Shade LWD
Recruitment
Leaf and Needle Lifter Microclimate
Early-seral 78 61 5 to 40+ Years
100+ Years 30 to 80 Years
10 to 40+ Years
Mid-seral 21 34 20 to Full Functioning5/
50 to 100+ Years
30 to 60 Years
20 to Full Functioning7/
Late-seral 1 5 Full Functioning
Full Functioning to 100+ Years6/
30 to Full Functioning
Full Functioning
1/ Subsection 3.7.1.7, Current Condition of Riparian Areas, for a description of study. 2/ Estimated time scales for recovery are based largely on Gregory and Bisson in Stouder et al. 1997. 3/ Hardwoods were excluded because it is unknown if they would convert to coniferous forest in the future.
Site-specific investigation would be required to determine whether this is a natural condition. 4/ Subsection 3.7.1.7, Current Condition of Riparian Areas, for definitions of seral stage. 5/ The upper end of the seral stage size range is fully functioning. The lower end of the seral stage size range requires
more recovery time prior to being fully functioning. 6/ Full functioning LWD recruitment also depends on stream size for determining recovery. Larger streams require a
larger proportion of big trees and, therefore, need a longer period to recover. 7/ Estimated to be the same timeframe as shade.
Draft EIS Riparian and Wetland Processes
4-105
Chapter 4 Action]) to represent the No-Action Alternative. The effects of No Action are displayed 1 for both of these endpoints in the following subsections, but the actual outcome and the 2 actual effects of No Action on LWD recruitment are likely to fall between these two 3 scenarios. 4
Overview of Effects 5 An overview of the effects of the alternatives on LWD supply to streams is presented in 6 this subsection. For perspective, LWD in streams has been greatly reduced in nearly all 7 streams within the State due to historic logging practices, but also other land uses (e.g., 8 agriculture, urbanization) (subsection 3.7.1.6, Historic Protection of Riparian Areas, and 9 subsection 3.7.1.7, Current Condition of Riparian Areas). However, the current 10 Washington Forest Practices Rules, as well as the January 1, 1999 Washington Forest 11 Practices Rules, would provide for substantially higher levels of LWD over the long term 12 than was provided under historic harvest practices, especially along fish-bearing streams. 13 The amount of LWD produced within riparian zones on covered forestlands is increasing 14 due to tree growth and because the rules under any of the alternatives would result in the 15 retention of a substantial portion of trees in the RMZ along fish-bearing streams, 16 especially relative to historic practices. However, LWD in streams will continue to 17 decrease in the near term, especially in larger streams (larger streams require larger LWD 18 to be functional), as LWD supplied by previously logged old growth is naturally being 19 removed due to decay and fluvial transport. In the long term, LWD in streams would 20 remain close to baseline conditions or increase depending on the alternative. Since some 21 LWD in fish-bearing streams is supplied from non-fish-bearing streams, those 22 alternatives with no RMZs on non-fish-bearing streams would limit the increase in LWD 23 supply to fish-bearing streams over the long term. Increases in LWD due to tree growth 24 takes a long time and represents long-term improvements. The following paragraphs 25 describe the relative LWD recruitment levels of the alternatives and summarize the 26 degree to which each alternative meets the evaluation criteria for LWD recruitment. 27
The LWD equivalent buffer area index was calculated to facilitate comparison of the 28 LWD recruitment function among the alternatives. It is displayed graphically in Figures 29 4.7-7 to 4.7-10. The LWD equivalent buffer area index analysis is applied in this 30 subsection as a relative measure of the protection of streams from loss of LWD 31 recruitment potential. The equivalent buffer area index is only an approximate measure 32 of full recruitment potential because it does not account for all factors that either 33 contribute to recruitment or reduce the amount of recruitment of LWD. For example, the 34 equivalent buffer area index does not account for redistribution of LWD within streams, 35 reductions that could occur from yarding corridors or roads, LWD enhancement, or 36 additions from mass wasting or channel migration. 37
No Action Alternative 1-Scenario 2 would provide the lowest level of LWD recruitment 38 to both fish-bearing (Type 1, 2, and 3), and non-fish-bearing (Type 4 and 5) streams. 39 Low recruitment levels are attributable to narrow RMZ widths on fish-bearing streams 40 and the lack of RMZs along non-fish-bearing streams. No Action Alternative 1-Scenario 41 2 would provide an estimated 60 to 67 percent of full LWD recruitment potential along 42 fish-bearing streams based on the 100-year site potential tree height criterion and an 43
Riparian and Wetland Processes Draft EIS
4-106
Chapter 4 estimated 37 to 53 percent based on the 250-year site potential tree height criterion 1 (Figures 4.7-7 to 4.7-10). For Type Np streams, this alternative would provide between 0 2 and 18 percent of full LWD recruitment potential based on either the 100-year or 250-3 year site potential tree height criterion. Shoreline Management Act requirements would 4 increase LWD recruitment to many Type 1 streams due to increased buffer widths. 5
No Action Alternative 1-Scenario 1 (and Alternatives 2 and 3) would provide higher 6 levels of LWD recruitment for fish-bearing streams (Types S and F), and substantially 7 higher levels for non-fish-bearing streams (Type N) than No Action Alternative 1-8 Scenario 2. No Action Alternative 1-Scenario 1 (and Alternatives 2 and 3) would 9 provide greater than 90 percent of full LWD recruitment to fish-bearing streams based on 10 the 100-year site potential tree height criterion and greater than 80 percent based on the 11 250-year site potential tree height criterion. For Type Np streams, these three alternatives 12 would provide 43 to 51 percent of full LWD recruitment based on the 100-year site 13 potential tree height criterion and between 38 and 44 percent of full LWD recruitment 14 based on the 250-year site potential tree height criterion. In reality, recruitment to Type 15 Np streams is likely to exceed these estimates due to protection of unstable slopes and 16 landforms that are located in close proximity to non-fish-bearing streams. Supplemental 17 LWD recruitment from unstable slopes protection was not quantified in this analysis due 18 to the difficulty in precisely and accurately identifying unstable slopes and landforms 19 using remote (i.e., map and/or aerial photo) means as would be necessary to estimate 20 statewide coverage. 21
Alternative 4 would provide higher levels of LWD recruitment to fish-bearing streams 22 and substantially higher levels to non-fish-bearing streams than No Action Alternative 1-23 Scenario 2. Relative to No Action Alternative 1-Scenario 1 (and Alternatives 2 and 3), 24 Alternative 4 would provide slightly higher levels of LWD recruitment to fish-bearing 25 streams and moderately higher levels to non-fish-bearing streams. This alternative would 26 provide full (i.e., 100 percent) LWD recruitment for fish-bearing streams based on both 27 the 100-year and 250-year site potential tree height criteria and would provide over 28 95 percent of full recruitment for Type Np streams based on both evaluation criteria. It is 29 likely that supplemental protection of unstable slopes would further increase LWD 30 recruitment to Type Np streams, providing full LWD recruitment in some areas. 31
32 33
Draft EIS Riparian and Wetland Processes
4-107
Chapter 4 Figure 4.7-7. Equivalent Buffer Area Index (EBAI) for LWD Summed for All 1
Fish-Bearing, Non-Fish Perennial, and Non-Fish Seasonal 2 Streams on the Westside, by Alternative, Assuming a 100-year 3 Site Potential Tree Height. 4
0%
10%
20%
30%
40%
50%
60%
70%
80%
90%
100%
All Streams Fish-bearing Non-fish Perennial Non-fish Seasonal
LWD
EB
AI
Alternative 1-Scenario 2Alternative 1-Scenario 1, Alternative 2, & Alternative 3Alternative 4
5 6
7
Riparian and Wetland Processes Draft EIS
4-108
Chapter 4 Figure 4.7-8. Equivalent Buffer Area Index (EBAI) for LWD for All Fish-Bearing, 1
Non-Fish Perennial, and Non-Fish Seasonal Streams on the 2 Eastside, by Alternative, Assuming a 100-year Site Potential Tree 3 Height. 4
0%
10%
20%
30%
40%
50%
60%
70%
80%
90%
100%
All Streams Fish-bearing Non-fish Perennial Non-fish Seasonal
LWD
EB
AI
Alternative 1-Scenario 2Alternative 1-Scenario 1, Alternative 2, & Alternative 3Alternative 4
5 6
Draft EIS Riparian and Wetland Processes
4-109
Chapter 4 Figure 4.7-9. Equivalent Buffer Area Index (EBAI) for LWD Summed for All 1
Fish-Bearing, Non-Fish Perennial, and Non-Fish Seasonal 2 Streams on the Westside, by Alternative, Assuming a 250-year 3 Site Potential Tree Height. 4
0%
10%
20%
30%
40%
50%
60%
70%
80%
90%
100%
All Streams Fish-bearing Non-fish Perennial Non-fish Seasonal
LWD
EB
AI
Alternative 1-Scenario 2Alternative 1-Scenario 1, Alternative 2, & Alternative 3Alternative 4
5 6
7
Riparian and Wetland Processes Draft EIS
4-110
Chapter 4 Figure 4.7-10. Equivalent Buffer Area Index (EBAI) for LWD for All Fish-Bearing, 1
Non-Fish Perennial, and Non-Fish Seasonal Streams on the 2 Eastside, by Alternative, Assuming a 250-year Site Potential Tree 3 Height. 4
5
0%
10%
20%
30%
40%
50%
60%
70%
80%
90%
100%
A ll S tream s F ish-bearing N on-fish P erenn ia l N on-fish S easona l
Chapter 4 Redistribution of LWD is difficult to quantitatively model because additions to one 1 stream section can represent a loss in another. However, provided wood is available for 2 transport, headwater streams can be considered net sources of LWD because streamflows 3 and mass wasting facilitate downstream transport. Consequently, reductions in LWD 4 recruitment in low order, high-gradient streams may also indicate some level of reduction 5 of LWD recruitment to higher order streams. In coastal Oregon, preliminary results 6 suggested LWD recruitment from upstream sources ranged between 11 and 59 percent 7 (Gresswell and May 2000). This may be an appropriate range for basins in Washington 8 with a similar geomorphology (i.e., steep to moderate gradient second and third order 9 streams with relatively narrow valleys) and precipitation, but may be an over-estimate for 10 other areas, particularly eastside watersheds with substantially lower precipitation and 11 likelihood of debris flows. 12
All alternatives would allow yarding corridors to be established through RMZs and over 13 streams. Under No Action Alternative 1-Scenario 2, there would be no requirements for 14 leaving trees harvested for yarding corridors (generally they are removed). Under No 15 Action Alternative 1-Scenario 1 and Alternatives 2 and 3, trees harvested in the core zone 16 would have to be left, and only the volume of trees in excess of the stand requirement 17 could be removed from the inner or outer zone. 18
Under Alternative 4, all trees harvested for yarding corridors would remain in the RMZ. 19 Under No Action Alternative 1-Scenario 1 and Alternatives 2, 3, and 4, any harvested 20 trees retained in the RMZ could provide potential habitat for wildlife species that utilize 21 down wood. However, yarding across (over) fish-bearing streams requires a Hydraulic 22 Project Approval from the WDFW that includes mitigation for trees harvested and/or 23 removed from yarding corridors, requires removal of debris, and provides an opportunity 24 for LWD placement. 25
Existing roads were not considered in the equivalent buffer area index because they are 26 present under all of the alternatives, and their location is site-specific and difficult to 27 incorporate in a representative fashion within the equivalent buffer area index model. 28 Incorporating existing roads would, therefore, introduce additional complexity to the 29 analysis while providing only limited insight into the differences among the alternatives 30 in terms of LWD recruitment potential. However, the presence of roads would reduce the 31 area available for LWD recruitment in an RMZ by approximately 5 percent or less 32 depending upon the alternative and region of the State (based on Geographic Information 33 System [GIS] analyses). No Action Alternative 1-Scenario 1 and Alternatives 2 and 3 34 include requirements that would partially mitigate the presence of roads in RMZs. This 35 mitigation will be discussed below under the No Action Alternative 1-Scenario 1 and 36 Alternatives 2 and 3 information. 37
Detailed Effects Analysis 38 No Action Alternative 1-Scenario 2 39 Westside - Type 1, 2, and 3 Waters. On the westside, the January 1, 1999 Washington 40 Forest Practices Rules would provide a minimum RMZ width of 25 feet on Type 1-3 41 waters. The maximum width would depend on stream type and size, the extent of 42
Riparian and Wetland Processes Draft EIS
4-112
Chapter 4 wetland vegetation, or the width needed for implementation of the shade rule (WAC 222-1 30-040), which would range from 25 to 100 feet. Full LWD recruitment potential to the 2 stream channel for most site classes would not be maintained. The RMZs would all be 3 less than one site potential tree height (both 100- and 250-year) with the exception of 4 those on Site Class V lands. As indicated earlier, 100-year and 250-year site potential 5 tree height assumptions were used to express the range over which full LWD recruitment 6 is likely to be met. The 100-year site potential tree height assumption is derived from the 7 FRR and is the basis for RMZ widths under No Action Alternative 1-Scenario 1 and 8 Alternatives 2 and 3, while the 250-year site potential tree height assumption is the age of 9 stands beginning to display old-growth characteristics (Franklin and Spies 1991). Based 10 on the more prevalent Site Classes (Classes II and III) found on State and private lands, 11 the 100-year site potential tree height would equal 140 and 170 feet, respectively, and the 12 250-year site potential tree height would equal 174 and 210 feet, respectively. In 13 addition, there would be a potential for increased blowdown along all streams that would 14 have an RMZ under No Action Alternative 1-Scenario 2, since the average widths 15 implemented would be relatively narrow (less than 75 feet) and therefore, would be more 16 susceptible to blowdown. In addition, Channel Migration Zones would not be protected 17 under this alternative. 18
Under No Action Alternative 1-Scenario 2, selective harvest could occur throughout the 19 RMZ (Figure 4.7-5). Based on modeling (DEIS Appendix B), the post-harvest 20 proportion of LWD recruitment potential remaining in the riparian zone would range 21 from 37 to 60 percent based on the 250- and 100-year site potential tree height 22 assumptions, respectively. Yarding corridors and roads would decrease these values. 23 Under No Action Alternative 1-Scenario 2, no additional measures would be provided to 24 address the reduction of LWD recruitment due to current or future roads. In addition, 25 there would be no incentives for landowners to undertake LWD enhancement projects, so 26 these would seldom be implemented. 27
Under No Action Alternative 1-Scenario 2, there would be few restrictions on the harvest 28 of large trees. Therefore, a substantial reduction in trees of functional size would occur 29 in the RMZ. Though only a percentage of functionally sized LWD may actually create 30 pools, the greater the amount recruited, the greater the potential for pool formation. For 31 larger streams, the size of LWD would need to be substantially larger than for small 32 streams. For example, for a stream averaging 45 feet wide, the mean diameter of 33 functional LWD is 22 inches compared to 8 inches in a 5-foot-wide stream (Bilby and 34 Ward 1989) (subsection 3.7, Riparian and Wetland Processes). When considering key 35 piece size (pieces with the capability of trapping other smaller pieces of LWD and 36 forming log jams; subsection 3.7.1.2, LWD Recruitment) a much smaller proportion of 37 trees would be left in the RMZ that would be considered large enough to be functional. 38 The LWD equivalent buffer area index takes into consideration both RMZ width and the 39 management activities that occur within the RMZ. The equivalent buffer area index 40 demonstrates that No Action Alternative 1-Scenario 2 would provide the lowest level of 41 protection for future recruitment of LWD (Figures 4.7-7 and 4.7-9). 42
Draft EIS Riparian and Wetland Processes
4-113
Chapter 4 Shorelines of Statewide Significance (which include a portion of Type 1 waters) are 1 managed under the dual jurisdiction of the Forest Practices Act and the Shoreline 2 Management Act. During implementation of forest practices, the more restrictive of the 3 two acts is applied along Type 1 waters. Restrictions of the Shoreline Management Act 4 along Shorelines of Statewide Significance include a 200-foot Shoreline Management 5 Zone above the ordinary high water mark that is implemented and enforced at the county 6 level. Within the Shoreline Management Zone, a landowner may remove no more than 7 30 percent of the available merchantable trees within a 10-year period. As a result, a 8 200-foot zone would complement the 25- to 100-foot RMZ applied under this alternative 9 along Shorelines of Statewide Significance. Therefore, the area outside the RMZ, but 10 within the Shoreline Management Zone, would receive the protection required under the 11 Shoreline Management Act. 12
Under No Action Alternative 1-Scenario 2, the Shoreline Management Zone would 13 provide for substantially higher protection for some Type 1 streams in the short-term than 14 the standard Washington Forest Practices Rules. However, additional entries in 15 Shoreline Management Zones could be conducted at 10-year intervals to remove 30 16 percent of the standing stock of trees. Although this would tend to reduce the level of 17 protection over time, the Shoreline Management Zone would continue to maintain a 18 higher level of protection than the standard rules under No Action Alternative 1-19 Scenario 2. 20
On the westside, most harvests occur on relatively young stands (e.g., 50 years old). 21 Thus, the quality of LWD input would be substantially less than optimum until these 22 stands grow to a point where trees of a sufficient size are prevalent. In addition, the 23 January 1, 1999 Washington Forest Practices Rules would not encourage landowners to 24 improve riparian stands for long-term gains in LWD recruitment. Under this alternative, 25 young conifer stands and hardwood-dominated stands could require many years to grow 26 to (and may never reach) the size where they can supply functional LWD. Compared to 27 larger streams, riparian zones along smaller Type 2 and 3 streams would have a greater 28 proportion of the available tree function with younger stand age because small tree sizes 29 more often meet the criteria for functional wood in small streams than in large streams 30 (Bisson et al. 1987). Key piece size would be more difficult to attain than if harvest 31 rotation were longer. 32
RMZs are not static since trees left in an RMZ continue to grow, and regeneration occurs 33 in harvested areas. Based on growth modeling that was conducted for the Forest 34 Practices Alternatives SEPA EIS (Washington Forest Practices Board 2001a), it is 35 apparent that there is an increase in tree growth rate in RMZs when thinning occurs. 36 Under No Action Alternative 1-Scenario 2, thinning would increase the size of trees over 37 the mid- and long-term (50 to 100 years). However, under No Action Alternative 1-38 Scenario 2 there would be no limitation on timber harvest re-entry within the RMZ. For 39 the westside, it was assumed that the harvest rotation averages 50 years. Therefore, long-40 term growth projections are unrealistic, and riparian stands would not likely have enough 41 large trees to provide for stable LWD in medium and large streams. In very large 42 streams, (using a 120-foot wide stream as an example), trees as great as 40 inches in 43
Riparian and Wetland Processes Draft EIS
4-114
Chapter 4 diameter (at a minimum) are needed as key pieces for long-term contributions to aquatic 1 habitat (Abbe and Montgomery 1996). Otherwise the trees may be mobilized and 2 transported downstream in large flood events. In addition, under No Action Alternative 3 1-Scenario 2 selective harvest would not encourage riparian stand improvements within 4 the RMZ for long-term gains, but would instead encourage the maintenance of the status 5 quo (i.e., maintaining the same ratio of conifers to hardwoods). 6
Westside - Type 4 and 5 Waters. For Type 4 and 5 waters under No Action Alternative 7 1-Scenario 2, RMZs would not be required except for site-specific conditions, and would 8 not exceed 25 feet. For Type 4 and 5 streams under most scenarios, harvest would be 9 allowed to the streambank. Consequently, there would be very limited LWD recruitment 10 potential for these small streams. This is shown in the equivalent buffer area index for 11 non-fish-bearing streams (Figures 4.7-7 and 4.7-9). However, there would be some 12 potential for non-merchantable trees to provide some function if left in the short-term, 13 because of the smaller LWD needed in small streams. Some supplemental LWD 14 recruitment from the protection of unstable slopes may occur in certain areas. 15
Along Type 4 and 5 streams that are clearcut to the bankfull width, long-term modeling 16 indicated that wood of functional and key piece sizes begins to be delivered to the 17 channel in approximately 45 to 50 years (Bilby and Ward 1989; Bilby and Wasserman 18 1989; Washington Forest Practices Board 2001a, Appendix D). This was assuming an 19 average channel width of 2 to 5 feet. If the harvest rotation rate is 50 years, minimal to 20 no recruitment to the stream would occur over the near and long-term along Type 4 and 5 21 waters, except in areas where unstable slopes are protected. 22
Eastside - Type 1, 2, and 3 Waters. Under No Action Alternative 1- Scenario 2, the 23 rules for eastern Washington would be generally similar to those for the westside. The 24 RMZ width for Type 1, 2, and 3 waters would range between 30 and 50 feet on each side 25 of the stream for areas under the partial cut strategy, and averages about 50 feet under the 26 clearcut strategy, but could extend up to 300 feet if there is a channel-associated wetland. 27 As for most RMZ prescriptions on the westside, the range of eastside RMZ widths under 28 the January 1, 1999 Washington Forest Practices Rules would not maintain full LWD 29 recruitment potential because the buffers would be less than one site potential tree height 30 (which ranges from 60 to 130 feet depending on the site class for a 100-year old stand 31 and 85 to 195 feet for a 250-year old stand). 32
However, an exception would occur when riparian vegetation is not adequate to provide 33 required shading of the stream. In these cases the RMZ could be expanded far beyond 34 the average 50 feet and could meet or exceed one site potential tree height. However, 35 most timber harvest on the eastside is selective harvest and, therefore, would not require 36 the more expansive RMZ widths (DEIS Appendix B). However, where the shade rule 37 would be implemented, additional trees may be left in the RMZ. As a result, there would 38 likely be an increase in the proportion of recruitable trees available in the RMZ under 39 some conditions. In addition, under No Action Alternative 1-Scenario 2, there may be a 40 potential of increased blowdown since the average RMZ widths (30 to 50 feet on the 41 eastside) are relatively narrow (less than 75 feet) and therefore more susceptible to wind 42
Draft EIS Riparian and Wetland Processes
4-115
Chapter 4 damage. Along streams that are prone to channel migration, no additional protection of 1 potential recruitment is provided if the channel shifts to a previously harvested area. The 2 maximum RMZ width of 300 feet for protection of channel-associated wetlands would be 3 the only potential protection for migrating channels. 4
Similar to the westside, selective harvest in eastern Washington could occur throughout 5 the RMZ under No Action Alternative 1-Scenario 2 (Figure 4.7-6). This would lead to 6 soils and microclimate that are less favorable for tree growth bringing the average 7 rotation length to an average age of 80 to 100 years for stands at timber harvest 8 (Bolsinger et al. 1997). Therefore, 80 to 100-year-old stands were assumed for 9 evaluating immediate post-harvest stand conditions. 10
The equivalent buffer area index for LWD under the 100-year site potential tree height 11 and 250-year site potential tree height assumptions shows that this alternative provides 12 the lowest level of protection for future recruitment of LWD when compared to other 13 alternatives on the eastside (Figures 4.7-8 and 4.7-10). LWD recruitment potential along 14 fish-bearing streams would range from 53 to 67 percent of the levels needed for adequate 15 protection based on the 100-year site potential tree height and 250-year site potential tree 16 height criteria, respectively. 17
On the eastside, the mean diameter required for LWD to be considered functional for a 18 stream averaging 45 feet in width would be 12 inches, and for a stream averaging 5 feet 19 in width it would be 8 inches (Bilby and Wasserman 1989). Key piece size has not yet 20 been defined for the eastside, although pieces larger than what is considered functional 21 would likely be required to provide the long-term stability that defines key piece size. 22 Similar to functional LWD, key piece size would vary depending on channel size. 23
For some Type 1 streams, additional leave trees would likely be provided to larger 24 streams due to their designation of Shorelines of Statewide Significance. The Shoreline 25 Management Act defines a 200-foot Shoreline Management Zone for streams with flow 26 greater than 1,000 cubic feet/second measured from the stream’s ordinary high water 27 mark. The Shoreline Management Act requires that no more than 30 percent of the 28 merchantable trees within this zone be removed every 10 years using a selective harvest 29 strategy. However, because the selective harvest strategy occurs more often than the 30 even-aged strategy on the eastside (See Glossary), additional trees outside of the RMZ, 31 but inside the one site potential tree height width, would frequently be available for 32 recruitment. 33
In addition, no additional measures would be provided under No Action Alternative 1-34 Scenario 2 to address the reduction of LWD recruitment due to current or future roads. 35
On the eastside, younger seral stages currently dominate most riparian areas. Similar to 36 the westside, the quality of LWD recruitment potential on the eastside would be less than 37 optimal. Also, similar to the westside, there would be no limitation of timber harvest 38 entries within the RMZ on the eastside. For the eastside it was assumed that harvest 39 would occur on approximately an 80-year rotation, and the largest trees could be removed 40 within the RMZ so long as leave tree requirements were met. The selective harvest 41
Riparian and Wetland Processes Draft EIS
4-116
Chapter 4 requirements within the RMZ under No Action Alternative 1-Scenario 2 would not 1 encourage improvement of the stand for LWD recruitment, but instead would require a 2 minimum number of trees of a specific size and type along all Type 1 to 3 streams, 3 without differentiating between stream size and riparian stand quality. Therefore, it is 4 unlikely that a sufficient number of larger trees in riparian stands would be maintained. 5
Eastside - Type 4 and 5 Waters. Under No Action Alternative 1-Scenario 2, for Type 4 6 and 5 streams in most conditions, harvest would be allowed to the streambank. However, 7 the trend on the eastside is that a relatively large proportion (approximately 60 percent) of 8 forestland has been harvested under a selective harvest strategy that leaves some riparian 9 trees. Along streams with a clearcut harvest strategy, there would be no protection of 10 LWD sources and, therefore, no short-term and minimal long-term recruitment potential; 11 an exception is where trees are retained on stream-adjacent unstable slopes to prevent 12 harvest-related mass wasting. Together, the equivalent buffer area index suggests these 13 harvest strategies would result in recruitment potential along non-fish-bearing streams of 14 approximately 18 percent of adequate protection levels under both site potential tree 15 height assumptions. 16
No Action Alternative 1-Scenario 1 and Alternatives 2 and 3 17 General. The silvicultural prescriptions for RMZs under No Action Alternative 1-18 Scenario 1 and Alternatives 2 and 3 would be implemented within three zones: the core 19 zone is nearest to the water, the inner zone is the middle zone, and the outer zone is 20 furthest from the water. In addition to the RMZ and silvicultural prescription discussions 21 below, it is important to note that additional measures would be implemented to replace 22 lost LWD recruitment due to the presence of roads under No Action Alternative 1-23 Scenario 1 and Alternatives 2 and 3. These mitigation measures include one of the 24 following two measures: 25
• Stand requirements must be met regardless of the presence of stream crossings and 26 stream adjacent roads; basal area shortfalls are made up in the inner and outer zones, 27 if possible, or in nearby RMZs of the same harvest unit. 28
• An optional LWD placement plan (WDFW approval required) would be 29 implemented. 30
The additional measures would provide greater LWD recruitment potential compared to 31 No Action Alternative 1-Scenario 2. The first mitigation measure would mitigate the 32 basal area of trees lost due to the road, but would not mitigate the same level of riparian 33 recruitment potential because the location of mitigation leave trees would be further from 34 the stream, and the mitigation leave trees have no size distribution requirements (i.e., the 35 mitigation basal area could be reached entirely with small trees). 36
No Action Alternative 1-Scenario 1 and Alternatives 2 and 3 are the only alternatives that 37 provide incentives for an LWD placement plan by reducing leave-tree requirements in the 38 outer zone. An LWD placement plan would increase instream LWD in the short-term in 39 exchange for trees in the portion of the RMZ that has the lowest probability of providing 40 LWD in the future. The number of trees that a landowner may remove in the outer zone 41
Draft EIS Riparian and Wetland Processes
4-117
Chapter 4 would depend on the plan approved by the WDFW, but leave-tree requirements could not 1 be reduced below 10 trees per acre under an LWD placement plan. 2
Similar to some Type 1 streams under No Action Alternative 1-Scenario 2, some Type S 3 streams may provide additional leave trees under all harvest strategy options because of 4 the Shoreline Management Act. As indicated earlier, the more restrictive rules would be 5 implemented for any given situation where both the Shoreline Management Act and the 6 Forest Practices Act are applied. In general, a Shoreline Management Zone would likely 7 provide more leave trees in the short-term than an RMZ, particularly for Type S streams 8 that do not have a Channel Migration Zone. A Shoreline Management Zone is measured 9 from the ordinary high water mark regardless of whether a Channel Migration Zone is 10 present. Consequently, the added level of protection from a Shoreline Management Zone 11 would be reduced depending upon the width of the Channel Migration Zone. Similar to 12 No Action Alternative 1-Scenario 2, the areas outside the RMZ, but inside the Shoreline 13 Management Zone, would have a higher level of short-term protection due to the harvest 14 restrictions required by the Shoreline Management Act. However, the level of added 15 protection in the Shoreline Management Zone could decline over time because of 16 additional harvest entries that would allow removal of up to 30 percent of the trees during 17 each decade. Nevertheless, the overall level of protection to selected Type S waters 18 would be equivalent to, or higher than, the standard rules. 19
Hardwood Conversion. Landowners would have the option of conducting hardwood 20 conversion in the inner zone of the RMZ on the westside only. The riparian areas would 21 have to be hardwood-dominated stands with evidence that conifers were present in the 22 area in the past. The objective of the hardwood conversion rule would be to improve 23 long-term riparian function by allowing landowners to remove hardwoods in the 24 conversion area and to restock the area with conifers. There would be numerous 25 requirements for implementing the hardwood conversion rules. These would include, but 26 would not be limited to, the following: 27
• The combined core and inner zone do not meet stand requirements. 28 • There are fewer than 57 conifer trees per acre 8 inches or larger diameter at breast 29
height (dbh). 30 • There are fewer than 100 conifer trees per acre 4 inches or larger dbh. 31 • Conversion areas are limited to 500 feet in length. 32 • Landowners must own the land 500 feet above and 500 feet below the conversion 33
area. 34 • No stream-adjacent parallel roads are present in the core or inner zone. 35 • Several shade restrictions apply (WAC 222-30-021(1)(b)(i)). 36
When the hardwood conversion takes place, the harvest would be required to adhere to 37 the following: 38
• Conifer trees greater than 20 inches dbh shall not be harvested in the conversion area. 39
Riparian and Wetland Processes Draft EIS
4-118
Chapter 4 • No more than 10 percent of the conifer trees greater than 8 inches dbh may be 1
harvested. 2 • The conversion area must be restocked with conifers and provided with post-harvest 3
treatment. 4
The hardwood conversion rule may slightly reduce short-term LWD recruitment from 5 hardwood trees. The loss of LWD recruitment potential from harvested conifers would 6 be insignificant because most of the larger trees are protected. The conversion areas 7 would create a small to moderate reduction in shade in the immediate area, but the 8 potential adverse effects on a larger scale may be reduced by the additional shade 9 restrictions required for hardwood conversion to take place. Conversely, the potential 10 long-term benefit from restoring the riparian stands to conifer would likely outweigh the 11 short-term losses. As indicated earlier, conifers have the potential to provide larger and 12 longer lasting LWD than hardwood trees (Harmon et al. 1986). Nevertheless, the 13 Washington DNR recognizes there is some uncertainty about the adverse effects of the 14 hardwood conversion rule, and thus would be required to track conversion rates on a 15 watershed basis. 16
20-Acre Exemption Rule. Under No Action Alternative 1-Scenario 1 and Alternatives 2 17 and 3, small landowners (20-acre exempt parcels) would be permitted to implement less 18 protective RMZs on non-contiguous parcels less than 20 acres in size (subsection 2.3, 19 Alternatives Analyzed in Detail). Although these parcels represent a small fraction of the 20 forestlands subject to Washington Forest Practices Rules (about 0.5 to 5 percent of all 21 private forestlands, depending on the region, Rogers 2003), and the rate of forest 22 practices to be implemented on these lands is unknown, this reduced protection increases 23 the level of concern. In watersheds with a high proportion of small landowners, 24 especially where a high level of past harvest has occurred, this rule would increase the 25 likelihood that LWD recruitment would be inadequate to maintain a properly functioning 26 system. 27
However, some factors suggest that while protections would be less, overall effects to 28 riparian function (e.g., LWD, shade retention) would not be reduced substantially. While 29 the rules would allow for selective harvest within the RMZ, in practice it is likely this 30 would rarely occur. In a recent evaluation of 20-acre exempt parcels, 86 percent of 37 31 parcels examined had no RMZ harvest, and all but 1 parcel had greater than 85 percent 32 retention (Personal Communication, Jeff Grizzel, Washington DNR, May 10, 2004). 33 This may be partly because of the shade rule, which would require retention of trees in 34 the RMZ to meet the shade requirements. Since many of these parcels are at relatively 35 low elevations, the Washington Forest Practices Rules under No Action Alternative 1-36 Scenario 1and Alternatives 2 and 3 would require a high degree of shade. This 37 requirement would also benefit LWD supply since a greater proportion of trees would be 38 retained near the shoreline where a higher probability of LWD exists (McDade et al. 39 1990). Based on the estimated portion of LWD contributed by distance for mature 40 conifer trees (from McDade et al. 1990) and the estimated range of RMZ requirements 41 for fish-bearing streams, exempt parcels would supply 45 to 95 percent of total LWD, 42
Draft EIS Riparian and Wetland Processes
4-119
Chapter 4 depending on RMZ width. This would be on average slightly lower than for other streams 1 under No Action Alternative 1-Scenario 1 and Alternatives 2 and 3, as indicated by the 2 LWD equivalent buffer area index for fish-bearing streams; the estimated LWD 3 equivalent buffer area index for both westside and eastside fish-bearing streams ranges 4 from 82 to 90 percent for the 250-year site potential tree height assumption and from 91 5 to 93 percent for the 100-year assumption (Figures 4.7-7 to 4.7-10). No RMZ would be 6 required on non-fish-bearing streams, which would reduce LWD supply to these 7 segments directly and would likely be less than other non-fish-bearing streams under 8 these alternatives. 9
Shade provided by 20-acre exempt parcels varies with RMZ width and the species, age, 10 and density of riparian vegetation. Retention of RMZs on fish-bearing streams that are 11 29 to 115 feet (9 to 35 meters) wide would likely provide between 25 and 85 percent 12 shade or canopy cover (measured as angular canopy density). This conclusion is based 13 on data from Brazier and Brown (1973) and Steinblums et al. (1984) (See Beschta et al. 14 1987). The smaller streams would typically have the lower estimated shade, but smaller 15 stream channels can have shade requirement more easily met with smaller buffers than 16 large streams (Broderson 1973). While the amount of shade in 20-acre exempt parcels 17 may be slightly lower than that supplied by No Action Alternative 1-Scenario 1 and 18 Alternatives 2 and 3, moderate to high levels of protection in most fish-bearing streams 19 would be maintained. As noted above, the limited amount of forest area affected by this 20 exemption would limit the overall effects to stream systems in most areas. 21
Westside: Inner Zone Options. No Action Alternative 1-Scenario 1 and Alternatives 2 22 and 3 would provide two options for harvesting within the inner zone on the westside, 23 providing that the riparian stand exceeds the requirements for meeting the DFC. The 24 Option 1 approach is designed for riparian stands that have a skewed distribution with 25 more numerous, but relatively small trees. In contrast, the Option 2 approach is designed 26 for stands that have a more normal distribution of tree sizes. Option 1 would allow 27 harvest by thinning from below. That is, surplus basal area could be harvested, but is 28 limited to smaller diameter trees. Option 1 was developed with the objective of 29 shortening the time required to meet LWD and water quality needs. Option 2 would 30 allow harvest of surplus basal area by prioritizing harvest of inner zone trees furthest 31 from the stream and leaving inner zone trees closest to the stream. The objective of 32 Option 2 would be to retain those trees closest to the stream that provide proportionally 33 more functional benefit than trees farther from the stream. As described in Chapter 2 34 (Alternatives), both options would have specific leave-tree requirements. 35
Westside: Type S and F Waters – Option 1 (Thinning From Below). On the westside, 36 Type S and F RMZ widths under No Action Alternative 1-Scenario 1 and Alternatives 2 37 and 3 would be based on the average height of a 100-year-old stand. These RMZs would 38 be measured from the edge of the Channel Migration Zone, where present, or from the 39 edge of the bankfull channel. Where Channel Migration Zones are present, additional 40 protection would be provided if a change in channel location occurs. Protection of the 41 Channel Migration Zone would ensure that an established stand of trees would be 42 available for recruitment in a relocated stream channel. 43
Riparian and Wetland Processes Draft EIS
4-120
Chapter 4 Some harvest could occur in some portions of the RMZ. For Type S and F streams under 1 Option 1, no harvest would occur in the core zone, which would be 50 feet from the outer 2 edge of either the bankfull width or Channel Migration Zone (whichever is greater). 3 Approximately 48 to 92 percent of LWD recruitment potential comes from the core zone 4 of the RMZ, based on McDade et al. (1990), site class, and the two site potential tree 5 height assumptions for stand age (e.g., 100 and 250 years) (Table 4.7-1). For Site Class 6 II, the core zone accounts for 56 percent (site potential tree height 210 feet) to 70 percent 7 (site potential tree height 170 feet) of total recruitment. 8
Selective harvest (thinning from below) would be allowed in the inner zone, or the 9 middle zone, of the RMZ. Specific stand requirements would exist, and thinning would 10 be based on an assessment of specific site characteristics including site class, species, 11 trees-per-acre, ratio of hardwoods to conifers, average stand age, and basal area. The 12 objective of this strategy would be to shorten the time required for trees in the inner zone 13 to reach a size adequate to provide functional LWD. This strategy would allow for the 14 removal of a portion of the smaller trees present in the inner zone while leaving the 15 largest trees. The width of the inner zone under Option 1 would vary depending on site 16 class and stream size. Using a Site Class II modeled stand, approximately 24 percent of 17 LWD recruitment potential comes from the 50- to 100-foot portion of the RMZ if all 18 trees are left uncut (Figure 4.7-1, which is a normalized representation of LWD supply 19 for any site potential tree height). 20
The inner zone selective harvest prescription would initially reduce the LWD recruitment 21 potential in the RMZ inner zone by approximately 5 percent along small streams (less 22 than or equal to 10 feet wide) with no reduction in recruitable size trees along the larger 23 streams. However, because stand requirements are intended to mimic mature forest stand 24 characteristics, full recruitment from the inner zone should be maintained over the long 25 term. Stream size affects both functional LWD size and the width of the inner zone. In 26 general, a wider range of tree sizes along smaller streams would function if recruited (i.e., 27 smaller LWD would also be functional); therefore, a larger percentage of source trees 28 would be lost if harvested compared to a larger river that requires larger trees to function. 29
The outer zone under Option 1 would provide for commercial harvest with requirements 30 for a specific number and size of leave trees. Similar to the inner zone, the outer zone 31 width would also vary depending on site class and stream width and would range from 22 32 to 67 feet. However, based on the stand modeling developed in the Forest Practices 33 Alternatives SEPA EIS (Washington Forest Practices Board 2001a), functional LWD 34 recruitment would be unlikely to occur from the outer zone for over 200 years after 35 harvest for most fish-bearing streams assuming an age 50 stand at the time of harvest. 36 Approximately 6 to 14 percent of the LWD recruitment potential would come from the 37 outer zone of a Site Class II stand under no-harvest conditions depending upon the site 38 potential tree height assumptions. Under the 250-year site potential tree height 39 assumption, about 6 percent of the recruitment potential would be derive from outside the 40 outer zone (i.e., 170 to 210 feet) and would receive no RMZ protection. Based on the 41 modeled harvest, the outer zone would contribute approximately 2 to 5 percent of the 42 recruitment potential (Washington Forest Practices Board 2001a, Appendix D). 43
Draft EIS Riparian and Wetland Processes
4-121
Chapter 4 The total post-harvest proportion of recruitable trees remaining in the three zones of the 1 RMZ would range between 91 percent (for smaller streams less than 10 feet wide) and 96 2 percent (for larger streams greater than 10 feet wide) based on the 100-year site potential 3 tree height assumption and between 80 and 85 percent based on the 250-year site 4 potential tree height assumption (Washington Forest Practices Board 2001a, 5 Appendix D). 6
A sensitivity analysis was conducted using the 100-year site potential tree height 7 assumption to see if recruitment potential would vary substantially between stands of 8 different site classes. Four channel widths (5 to 44 feet) representative of each stream 9 type were compared by site classes to estimate the proportion of trees (those that would 10 contribute to LWD without harvest) that would be present after harvest. The variation in 11 recruitment potential based on the stands modeled (which included a low, medium and 12 high Site Classes II and III) was relatively small, ranging between 87 and 93 percent for 13 smaller streams and between 93 and 96 percent for larger streams (Washington Forest 14 Practices Board 2001a, Appendix D). 15
Based on the modeled harvest, the same proportion of trees sufficiently large to be 16 considered key pieces would be present in the RMZ both pre- and post-harvest. This 17 would occur because the inner zone would be thinned from below, leaving the largest 18 trees in the inner zone available for potential recruitment. Therefore, depending on 19 stream size, trees of key piece size could be maintained under this option if they already 20 exist in the stand. However, as stream size increases, the proportion of trees of key piece 21 size decreases because minimum key piece size increases with stream size. This was 22 highlighted in the sensitivity analysis where no trees of functional size (or larger key 23 pieces) were available for recruitment along modeled Site Class III stands. Growth 24 modeling using the Riparian Aquatic Interaction Simulator model suggests that stands 25 would need to be at least 160 years old to obtain key pieces for streams 44 feet wide 26 (Washington Forest Practices Board 2001a, Appendix D). Therefore, the concern is over 27 the long-term (well beyond the expected life span of No Action Alternative 1-Scenario 1 28 and Alternatives 2 and 3) because many stands would not have sufficient trees of key 29 piece size immediately after harvest. 30
The equivalent buffer area index for LWD on the westside shows that under both the 31 100-year site potential tree height and 250-year site potential tree height assumptions 32 these alternatives would produce substantially greater recruitment to Type S and F 33 streams when compared to No Action Alternative 1-Scenario 2, (but lower recruitment 34 when compared to Alternative 4) (Figures 4.7-7 and 4.7-9). In addition, it is clear that 35 fish-bearing streams receive more protection than non-fish-bearing streams under No 36 Action Alternative 1-Scenario 1 and Alternatives 2 and 3. However, the equivalent buffer 37 area index does not reflect the long-term benefits associated with thinning, which boosts 38 the growth rates of source trees remaining in the RMZ. 39
The current quality of LWD input potential along most westside streams is well below 40 the optimum, and will remain that way until riparian areas grow to a point when trees are 41 of sufficient size to provide functional LWD. The 50-year old stand modeled for long-42
Riparian and Wetland Processes Draft EIS
4-122
Chapter 4 term recruitment using the Riparian Aquatic Interaction Simulator demonstrates there 1 would be an increase in tree growth rate under Option 1 (Washington Forest Practices 2 Board 2001a). However, the modeling suggested that thinning adjacent to small streams 3 (less than 10 feet) would not result in a decrease in the time required for trees to reach a 4 functional size (about an 80-year old stand, regardless of thinning). In addition, a wider 5 range of tree sizes along small streams would provide functional LWD if recruited; 6 therefore, a larger percentage of potential source trees would be lost if harvested. 7
However, the benefit of thinning appears to be substantial when considering large 8 streams and key piece size, especially in highly productive stands (100-year site index of 9 128 or greater). For streams 44 feet wide, the modeling suggested that compared to no 10 harvest, thinning resulted in a shorter time period for trees to reach key piece size (160-11 year stand if thinned and 290-year stand with no harvest). In addition, the modeling 12 suggested there could be an increase in the amount of LWD. The Riparian Aquatic 13 Interaction Simulator model indicated that a 300-year old, Site Class II stand would have 14 about 14 percent (nearly 2 pieces per 1,000 feet) more functional LWD following 15 thinning under Option 1 compared to Option 2 or Alternative 4. The modeling suggests 16 that for lower productivity riparian stands or streams less than 30 feet wide, thinning does 17 not provide a substantial benefit for producing functional and key piece side LWD more 18 rapidly than no-harvest (Washington Forest Practices Board 2001a, Appendix D). 19
Westside: Type S and F Waters – Option 2 (Leaving Trees Closest to the Water). 20 Under Option 2 of No Action Alternative 1-Scenario 1, Alternative 2, and Alternative 3, 21 no-harvest RMZs would be 80 feet wide on streams less than 10 feet wide and 100 feet 22 wide on streams greater than 10 feet wide. Similar to Option 1, no harvest would occur 23 under Option 2 in the 50-foot-wide core zone measured from the bankfull width or 24 Channel Migration Zone (if present). Consequently, the core zone would provide the 25 same level of protection under Option 2 as it would under Option 1. In addition to the 26 core zone, the next 30 feet of the inner zone on streams less than 10 feet wide and the 27 next 50 feet on streams greater than 10 feet wide would also be no-harvest zones. Option 28 2 could only be applied to Site Class I, II, and III sites on streams less than or equal to 10 29 feet wide and Site Class I and II sites on streams greater than 10 feet wide. Depending 30 upon the site potential tree height assumption (for Site Class II), the combined no-harvest 31 RMZs from the core zone and inner zone would provide from 73 to 86.5 percent of full 32 LWD recruitment potential for smaller streams (less than 10 feet) and 80 to 95 percent of 33 full potential for larger streams. 34
Selective harvest would be allowed in the remaining portion of the inner zone, which 35 varies in width, depending on site class and stream size. Based on modeling in the Forest 36 Practices Alternatives SEPA EIS (Washington Forest Practices Board 2001a), the total 37 inner zone LWD recruitment potential for streams greater than 10 feet wide would be 38 maintained. For streams less than or equal to 10 feet in width, a reduction of 39 approximately 3 percent of potentially recruitable trees would occur over the short term. 40
Under Option 2, if prescriptions in the core and inner zone result in a basal area that 41 exceeds the basal area target, a greater reduction of trees would be allowed in the outer 42
Draft EIS Riparian and Wetland Processes
4-123
Chapter 4 zone. In the modeled example, there was no excess (i.e., all 20 trees per acre were 1 retained in the outer zone) resulting in a range of 0 to 2 percent of the recruitable trees 2 remaining, depending on stream size. The leave tree requirement for the outer zone could 3 also be reduced if conifers are retained in the Channel Migration Zone. 4
The post-harvest proportion of potentially recruitable trees remaining in the combined 5 three zones of the RMZ would range from 94 to 95 percent of the pre-harvest condition 6 (Washington Forest Practices Board 2001a, Appendix D). The overall recruitment 7 potential of smaller streams (less than 10 feet) under Option 2 would be higher than the 8 recruitment potential under Option 1. In contrast, Option 1 would produce greater 9 recruitment potential for larger streams (greater than 10 feet). However, the differences 10 between the two options would not be large; less than 3 percent of the pre-harvest 11 potential. Consequently, the different strategies would not substantially change the 12 number of recruitable trees. A sensitivity analysis using the 100-year site potential tree 13 height assumption and Site Class III (low) to Site Class II (high) showed similar patterns. 14 The differences between options were 5 percent or less, and both options retained 87 15 percent or more of the potentially recruitable trees. 16
Under Option 2, the equivalent buffer area index ranged from 90 to 93 percent for fish-17 bearing (Type S and F) streams under the 250-year site potential tree height and 100-year 18 site potential tree height assumptions, respectively. The equivalent buffer area index 19 under both site potential tree height assumptions, suggests that Option 2 of No Action 20 Alternative 1-Scenario 1 and Alternatives 2 and 3 would produce a substantially greater 21 recruitment potential along Type S and F streams compared to No Action Alternative 1-22 Scenario 2, a similar recruitment potential compared to Option 1, but a lower recruitment 23 potential compared to Alternative 4. 24
One limitation of the equivalent buffer area index is that it fails to take into consideration 25 the growth rate of trees remaining in the RMZ following harvest. Stand growth modeling 26 suggests the rate of growth would be slower with the wider no-harvest area of Option 2 27 compared to Option 1. Consequently, under this option, wider streams would require a 28 longer period of time to produce the larger trees needed to provide functional LWD. 29 However, for smaller streams where smaller size LWD will function, a greater number of 30 source trees would be retained in the RMZ. 31
Westside: Non-fish Waters. On portions of Type Np streams, RMZ widths would be 50 32 feet, which is less than the one site potential tree height (both 100-year site potential tree 33 height and 250-year site potential tree height) evaluation criteria recommended in most 34 literature to provide an adequate level of LWD recruitment. The 50-foot buffer would 35 provide approximately 48 to 92 percent of the LWD recruitment potential of a mature 36 stand where the buffer would be implemented, depending upon site class (McDade et al. 37 1990). At least 50 percent of the length of Np streams, which would include all sensitive 38 sites within the harvest unit, would be required to have the 50-foot no-harvest RMZ. 39 Depending on the number of sensitive sites, more than 50 percent of the Np stream length 40 could be protected with an RMZ. In practice, substantially more than 50 percent of Np 41 stream lengths would have RMZs under the current rules and this would likely continue 42
Riparian and Wetland Processes Draft EIS
4-124
Chapter 4 in the future under these alternatives (Personal Communication, Jeff Grizzel, Washington 1 DNR, April 6, 2004). This is primarily because additional protection would be provided 2 in the form of unstable slopes buffers, which would often be retained as no-harvest areas 3 in close proximity to small, headwater streams (i.e., Type Np and Ns streams). 4
Because of the relatively narrow RMZs, there would be a greater potential that blowdown 5 would occur. As mentioned previously, observed blowdown levels average about 15 6 percent, but vary widely depending upon site characteristics and could approach 100 7 percent in rare circumstances (Steinblums 1978; Steinblums et al. 1984; Harris 1989; 8 Grizzel and Wolf 1998). On Type Ns and all other Type Np streams, harvest would be 9 allowed to the streambank. Therefore, there would be no direct protection of LWD 10 recruitment potential. However, as mentioned above, because many unstable landforms 11 (e.g., inner gorges, bedrock hollows, channel heads) are located along Type Np and Ns 12 streams, LWD recruitment would be provided for some streams even though RMZs 13 would not be required (Personal Communication, Jeff Grizzel, Washington DNR, April 14 6, 2004). 15
While processes for LWD inputs from Type Np and Ns streams to Type S and F (fish-16 bearing) streams are reasonably well understood, rates of LWD input are not well 17 documented (Benda et al. 2003; Reeves et al. 2003; Potts and Anderson 1990). In narrow 18 coastal streams in Oregon, movement of LWD in second- and third-order streams has 19 been observed between 11 and 49 percent (Gresswell and May 2000). In some streams, 20 the level of input can be very high as a result of debris torrents. In addition, trees that fall 21 into streams are important for sediment retention (Keller and Swanson 1979; Sedell et al. 22 1988), gradient modification (Bilby 1979), and nutrient production (Cummins 1974) in 23 Type Np and Ns streams. 24
Eastside: Type S and F Waters. On the eastside, No Action Alternative 1-Scenario 1 25 and Alternatives 2 and 3 would require an RMZ width of at least one 100-year site 26 potential tree height along Type S and F streams. A few exceptions would exist, 27 including streams less than 15 feet wide on Site Class V soils and streams greater than 15 28 feet wide on Site Class of III, IV, or V (which all exceed the 100-year site potential tree 29 height). Therefore, Type S and F RMZs would meet the width recommended in the 30 literature for maintaining full LWD recruitment. In addition, because these RMZs are 31 measured from the Channel Migration Zone or the bankfull width, additional protection 32 would be provided in cases where the stream channel shifts or migrates. This would 33 ensure that an established stand of trees would be available for recruitment in the 34 relocated stream channel. 35
For Type S and F streams, no harvest would occur in the core zone, which would be 30 36 feet from the Channel Migration Zone or bankfull width. Approximately 65 percent of 37 LWD recruitment potential comes from the core zone, based on McDade et al. (1990) 38 using a 100-year site potential tree height of 110 feet and 44 percent of the recruitment 39 potential using a 250-year site potential tree height of 170 feet. 40
Selective harvest would be allowed in the inner zone, which would vary in width 41 depending on stream width. For streams less than 15 feet wide, the inner zone would be 42
Draft EIS Riparian and Wetland Processes
4-125
Chapter 4 45 feet wide, and for streams greater than 15 feet wide the inner zone would equal 70 1 feet. Using a Site Class II modeled stand for comparative purposes, approximately 31 2 (100-year site potential tree height) to 33 (250-year site potential tree height) percent of 3 LWD recruitment potential would come from the 30 to 75-foot zone of the RMZ if all 4 source trees are left uncut along a stream less than 15 feet wide. For streams wider than 5 15 feet, 33.5 (100-year site potential tree height) to 42 (250-year site potential tree height) 6 percent of recruitment potential would originate from between 30 and 100 feet (i.e., the 7 inner zone) of the RMZ. The inner zone selective harvest prescription (using the 8 modeled stand) would maintain 8 (100-year site potential tree height) to 9 (250-year site 9 potential tree height) percent of the no-harvest LWD recruitment potential along streams 10 less than 15 feet wide. For streams greater than 15 feet wide, the inner zone selective 11 harvest prescription would maintain between 6 (100-year site potential tree height) and 12 14 (250-year site potential tree height) percent of the LWD recruitment potential. 13
More restrictive prescriptions would be implemented within the bull trout overlay. The 14 bull trout overlay would include those portions of eastern Washington streams containing 15 bull trout habitat as identified on the WDFW’s bull trout overlay map (Washington 16 Forest Practices Board 2002). The more restrictive prescriptions would be designed for a 17 higher level of protection for trees that contribute towards “all available” shade, which 18 could also provide increased protection for trees that could become LWD. For purposes 19 of this DEIS, the inner zone was modeled as no-harvest between 30 and 75 feet for all 20 streams within the bull trout overlay to represent the maximum likely shade-retention 21 strategy. For streams greater than 15 feet wide, the area 75 to 100 feet from the stream or 22 Channel Migration Zone edge was modeled as a partial harvest leaving at least 50 trees 23 per acre including the 21 largest trees, at least 29 trees greater than 10 inches dbh, and 24 basal area of at least 90 feet2 per acre. Under this scenario, 31 (100-year site potential 25 tree height) to 36 (250-year site potential tree height) percent of the no-harvest LWD 26 recruitment potential would come from the inner zone (Washington Forest Practices 27 Board 2001a, Appendix D, Tables 31a and 31b). 28
The outer zone would have prescriptions that allow for a more intensive selective harvest. 29 Similar to the inner zone, the outer zone width would also vary, depending on site class 30 and stream width, and range between 0 and 55 feet. The outer zone would provide 31 approximately 1.5 (100-year site potential tree height) to 2.5 (250-year site potential tree 32 height) percent of the LWD recruitment potential if all trees are left unharvested. Under 33 the 250-year site potential tree height assumption for Site Class II soils, about 11.5 34 percent of the recruitment potential would originate from outside the outer zone (i.e., 110 35 to 170 feet) and would receive no RMZ protection. The outer zone would maintain less 36 than 1 percent of the recruitment potential under the 100-year site potential tree height 37 assumption, but would provide about 2 percent of the potential under the 250-year site 38 potential tree height assumption. This would result from the different cumulative 39 recruitment potential curves used under the two assumptions. The 100-year site potential 40 tree height assumption was based upon the mature stand curve, and the 250-year site 41 potential tree height assumption was based upon the old-growth curve from McDade et 42
Riparian and Wetland Processes Draft EIS
4-126
Chapter 4 al. (1990). Compared to the mature curve, the old-growth curve has a higher percentage 1 of the total recruitment derived farther from the stream. 2
With all zones combined, in areas outside the bull trout overlay, the post-harvest 3 recruitment potential in the three zones of the RMZ would range from 55 (250-year site 4 potential tree height) to 74 (100-year site potential tree height) percent of the no-harvest 5 potential for smaller streams less than 15 feet. The range for larger streams greater than 6 15 feet would range from 52 (250-year site potential tree height) to 76 (100-year site 7 potential tree height) percent (Washington Forest Practices Board 2001a, Appendix D). 8 Within the bull trout overlay, the post-harvest recruitment potential would range from 80 9 (250-year site potential tree height) to 96 (100-year site potential tree height) percent for 10 streams less than 15 feet and 79 (250-year site potential tree height) to 97 (100-year site 11 potential tree height) percent for streams greater than 15 feet. However, these estimates 12 are likely conservative, because the “all available shade” rule within the bull trout overlay 13 does not necessarily equate to “no-harvest” within the inner zone. 14
A sensitivity analysis was prepared using the 100-year site potential tree height 15 assumption to determine the variation in post-harvest recruitment potential between 16 vegetative habitat types (mixed conifer versus ponderosa pine), areas within or outside 17 the bull trout habitat overlay, site classes, and stream size. The results suggested there 18 were moderate differences between vegetative habitat types (8 percent or less), large 19 differences (10 to 28 percent) between areas in or out of the bull trout overlay, large 20 differences (up to 19 percent) between site classes, and small differences (less than 5 21 percent) between stream sizes (Washington Forest Practices Board 2001a, Appendix D). 22 For both the mixed conifer and ponderosa pine habitat types the post-harvest LWD 23 recruitment potential was consistently higher on sites with lower productivity 24 (Washington Forest Practices Board 2001a, Appendix D). This is because sites with 25 lower productivity (e.g., Site Class IV and V) have a lower site potential tree height than 26 those with higher productivity. Therefore, the 30-foot core zone represents a greater 27 percentage of the total site potential tree height and recruitment potential on lower site 28 classes. 29
Also, for most of the stands modeled in the sensitivity analysis, it was apparent that larger 30 streams that require large wood (greater than 10 inch dbh) to function may not benefit 31 from the 29 smaller trees retained in addition to the 21 largest trees (to make up the 32 minimum of 50 trees per acre) retained in the inner zone over the short term. 33 Recruitment potential for these larger streams would likely only come from the 21 largest 34 trees per acre left in the RMZ until the rest of the trees grew to a size that would be 35 functional when recruited. This disparity would likely be even larger for the recruitment 36 of key piece LWD. For these large streams, depending on the size class distribution in 37 the stand, there is a greater likelihood that trees that could provide functional LWD 38 would be harvested (i.e., trees that fall between the minimum size trees that are retained 39 [10 inch dbh] and the largest trees in the stand that are required to be retained). Mid-size 40 streams, with a wider inner zone compared to streams less than 15 feet wide, would have 41 the lowest likelihood of LWD recruitment reduction due to harvest, though some 42 reduction would occur. 43
Draft EIS Riparian and Wetland Processes
4-127
Chapter 4 The equivalent buffer area index for LWD weights the recruitment potential for each 1 stream type and size by the length of the stream in those categories and provides an 2 overall measure of recruitment potential by alternative. The equivalent buffer area index 3 for LWD on the eastside ranges from 82 (250-year site potential tree height) to 93 percent 4 (100-year site potential tree height) of the no-harvest potential along Type S and F 5 streams. The equivalent buffer area index suggests that there is substantially greater 6 recruitment for Type S and F streams under No Action Alternative 1-Scenario 1 and 7 Alternatives 2 and 3 compared to No Action Alternative 1-Scenario 2, but less when 8 compared to Alternative 4 under both site potential tree height assumptions (Figures 9 4.7-8 and 4.7-10). 10
Within the bull trout overlay, which covers most of the eastside forested areas, if all trees 11 within 75 feet of the stream must be retained because they provide shade (See the Stream 12 Shade discussion, below), then the level of protection would increase substantially over 13 the standard shade rule (applied outside the bull trout overlay). Notably, shade-producing 14 trees in the inner zone are those most likely to be the larger trees that would provide 15 LWD if they reach the stream. In practice, it is expected that most landowners would 16 harvest some trees (not identified as shade trees) between the outer edge of the core zone 17 (i.e., 30 feet) and 75 feet. 18
The equivalent buffer area index under the 250-year site potential tree height assumption 19 is lower than the 100-year site potential tree height assumption. Consequently, less 20 protection would be provided under the 250-year site potential tree height than under the 21 100-year assumption. Overall, it is likely that LWD recruitment to Type F and S streams 22 would be at levels adequate to sustain robust salmonid populations, given the 23 implementation of the shade rule, which would effectively reduce harvest opportunities 24 within the bull trout overlay. 25
On the eastside under current conditions, most riparian areas are dominated by forests in 26 early-seral stages. Thus, the quality of LWD input potential is currently less than optimal 27 to provide LWD recruitment. Using the Riparian Aquatic Interaction Simulator growth 28 model to predict tree growth rate, it is apparent that thinning results in increasing tree 29 diameter at a faster rate. Under No Action Alternative 1-Scenario 1 and Alternatives 2 30 and 3, thinning the inner zone would increase the size of trees over the mid- and long-31 term, and would produce larger trees sooner (See discussion under Westside, above). 32 However, because the growth rate is slower on much of the eastside, the time frame 33 would likely be extended. Though key piece sizes have not been calculated for the 34 eastside specifically, the time to reach key piece size would likely be reduced to some 35 extent, similar to the westside. However, the actual timeframe required to reach key 36 piece size would likely be longer than for the westside. For large streams there may be a 37 greater lag time before a larger proportion of trees would be of recruitable size, since 38 some of the medium/large size trees would have the most potential of being harvested in 39 the short-term. 40
Eastside: Non-fish Waters. On Type Np streams, the RMZ width would be 50 feet. 41 Harvest within Type Np RMZs could follow a partial cut, clearcut, or no-harvest strategy 42
Riparian and Wetland Processes Draft EIS
4-128
Chapter 4 and would be identified by the landowner as part of a forest practices application. The 1 RMZ would be less than the one site potential tree width recommended in most literature 2 to encompass the entire LWD recruitment source area. The 50-foot buffer would provide 3 approximately 48 to 92 percent of full LWD recruitment potential, depending upon site 4 class and site potential tree height assumption (McDade et al. 1990). On some Np and all 5 Ns stream reaches, harvest would be allowed to the streambank. Consequently, there 6 would be no direct requirement for protection of LWD recruitment potential along these 7 stream reaches. However substantial buffering would occur in some areas as a result of 8 unstable slope protections, which would often restrict harvest along many Np and Np 9 stream channels (Personal Communication, Jeff Grizzel, Washington DNR, April 6, 10 2004). Trees along Type Np and Ns streams (like Type S and F streams) that reach the 11 channel are important for sediment retention (Keller and Swanson 1979; Sedell et al. 12 1988), gradient modification (Bilby 1979), and nutrient production (Cummins 1974). 13
Harvest opportunities within RMZs along Type Np streams would include a partial cut 14 and a clearcut option. The partial cut option would have a selective harvest prescription 15 that would be the same as the inner zone along Type S and F streams. The clearcut 16 option could be implemented along no more than 30 percent of the stream length within 17 the harvest unit, could not be more than 300 feet in length, and would be at least 500 feet 18 upstream from the confluence with a Type S or F stream. A no-harvest prescription 19 would be implemented on both sides of the stream over a length similar to that 20 implemented for the clearcut prescription. Under the partial cut option, 24 to 36 percent 21 of the potentially recruitable trees would be left in the RMZ depending on site-class and 22 vegetation zone (i.e., timber habitat type) under the 100-year site potential tree height 23 assumption. Once a partial cut or clearcut strategy is selected, there would be no 24 opportunity to change it during the term of the ITP under No Action Alternative 1-25 Scenario 1 and Alternatives 2 and 3. Under the modeled clearcut option, 55 to 59 percent 26 of the potentially recruitable trees were retained in the RMZ (Washington Forest 27 Practices Board 2001a). For all Type Ns streams, no RMZs would be maintained, and, 28 therefore, no protection of LWD recruitment potential would occur except in cases where 29 unstable slopes buffers were retained to prevent management-related mass wasting. 30
Alternative 4 31 General. Unlike No Action Alternative 1-Scenario 1 (and Alternatives 2 and 3), the 20-32 acre exemption for small landowners would not apply to the riparian rules under 33 Alternative 4; there would also be no such exemption under No Action Alternative 1-34 Scenario 2. Small landowners (owning less than 80 acres of forestland) would not be 35 permitted to implement less protective RMZs on non-contiguous parcels less than 20 36 acres in size (subsection 2.3, Alternatives Analyzed in Detail). Therefore, there would be 37 no increased likelihood of inadequate LWD recruitment in watersheds with a high 38 proportion of small landowners. 39
Under Alternative 4, the Shoreline Management Act would not result in additional 40 retention of riparian trees along Shorelines of Statewide Significance as under the other 41 alternatives. This is because Alternative 4 would provide a greater level of protection 42
Draft EIS Riparian and Wetland Processes
4-129
Chapter 4 than the Shoreline Management Act because the 200-foot RMZs would be no-harvest 1 areas, measured from the outer edge of the Channel Migration Zone. 2
Westside. On the westside, Alternative 4 would implement 200-foot, no-harvest RMZs 3 along streams with less than 20 percent gradient; 100-foot, no-harvest RMZs along 4 streams with 20 to 30 percent gradient; and 70-foot, no-harvest RMZs along streams with 5 greater than 30 percent gradient. These RMZs would provide 94 to 100 percent, 75 to 6 100 percent, and 62 to 98 percent of full LWD recruitment potential for a Site Class II 7 stand, respectively, depending upon the site potential tree height assumption (i.e., 100-8 year or 250-year). 9
Similar to No Action Alternative 1-Scenario 1 and Alternatives 2 and 3, additional 10 protection of LWD recruitment potential would be provided by beginning the RMZ at the 11 outer edge of the Channel Migration Zone. Other zones that would provide additional 12 protection for LWD recruitment potential include measuring the RMZ from the edge of 13 Beaver Habitat Zones and Channel Disturbance Zones. These no-harvest zones would 14 provide additional LWD recruitment in areas that are unprotected under either scenario of 15 No Action Alternative 1. Also, because of the relatively wide RMZs under Alternative 4, 16 the likelihood for blowdown within RMZs would be slightly lower compared to No 17 Action Alternative 1-Scenario 1, and much lower than No Action Alternative 1-Scenario 18 2 (Pollock and Kennard 1998). 19
For all three stream types, no harvest would be allowed within the RMZ except for 20 specific cases, which include: 1) converting a hardwood-dominated stand to one that is 21 conifer-dominated, or 2) facilitating the development of 200 year-old stand conditions. 22 As a result, most if not all of the LWD recruitment potential (described above) would be 23 maintained unless stand manipulation was deemed necessary to improve riparian 24 condition and function. 25
Under both the 100-year and 250-year site potential tree height assumptions, the 26 equivalent buffer area index analysis suggests that Alternative 4 would provide 100 27 percent of the LWD recruitment potential to fish-bearing streams (i.e., those less than 20 28 percent gradient) (Figures 4.7-7 and 4.7-9). Although the higher gradient streams would 29 not fully meet the one site potential tree height width to provide complete recruitment 30 potential, virtually all high gradient streams (i.e., those greater than 20 percent gradient) 31 are non-fish-bearing streams. 32
Using growth modeling, tree diameters clearly increase at a faster rate when thinning is 33 implemented. Therefore, within riparian stands adjacent to larger streams, thinning as 34 provided by Option 1 of No Action Alternative 1-Scenario 1 may be important to 35 increase tree growth rate depending on the channel condition. However, along smaller 36 fish-bearing and non-fish-bearing streams that do not necessarily benefit from thinning, 37 Alternative 4 would provide the highest LWD recruitment potential of all the alternatives. 38
Eastside. Silvicultural prescriptions in RMZs are the same on the eastside as on the 39 westside, although site potential tree height would be less than on the westside. 40 Therefore, there would be some differences in the level of protection for LWD 41
Riparian and Wetland Processes Draft EIS
4-130
Chapter 4 recruitment potential. On the eastside, Alternative 4 would provide full LWD 1 recruitment potential for streams less than 20 percent gradient on all site classes through 2 the designation of a 200-foot RMZ. This would apply to both the 100-year and 250-year 3 site potential tree height assumptions. 4
For non-fish-bearing streams on Site Class II and III lands, LWD recruitment potential 5 would range from 97 to 100 percent of full potential on perennial streams and between 93 6 and 99 percent for seasonal streams, depending on the site potential tree height 7 assumption. Similar to No Action Alternative 1-Scenario 1, additional protection of 8 LWD recruitment potential would be provided by beginning the RMZ at the outer edge of 9 the Channel Migration Zone and by requiring no-harvest within the Channel Migration 10 Zone. Other zones that would provide additional protection of recruitment potential 11 include measuring the RMZ from the edge of Beaver Habitat Zones and Channel 12 Disturbance Zones where they apply. Also, because of the relatively wide RMZs under 13 Alternative 4, the likelihood of RMZ blowdown would be relatively low (Pollock and 14 Kennard 1998). 15
For all three stream types, no harvest could occur within RMZs except for specific cases, 16 which are described above under the Westside discussion. As a result, most if not all of 17 the LWD recruitment potential (described above) would be maintained unless stand 18 manipulation was deemed necessary to improve riparian condition and function. 19
Similar to the westside, under both the 100-year site potential tree height and 250-year 20 site potential tree height assumptions, the equivalent buffer area index suggests 21 Alternative 4 would provide the highest level of recruitment potential compared to No 22 Action Alternative 1-Scenario 2, No Action Alternative 1-Scenario 1, and Alternatives 2 23 and 3 (Figure 4.7-8 and 4.7-10). 24
The major differences in the two site potential tree height assumptions would occur along 25 steeper (greater than 20 percent gradient) channels that are generally (but not always) 26 non-fish-bearing streams. In particular, the equivalent buffer area index for all streams 27 demonstrates almost complete protection under the 100-year site potential tree height 28 assumption and almost complete protection for fish-bearing streams under the 250-year 29 site potential tree height assumption as well. These results are primarily due to the fact 30 that, although high gradient stream RMZ width would be less than one site potential tree 31 height, most of the LWD recruitment potential would exist within 70 feet of the stream. 32 In addition, a large proportion of seasonal streams (defined under No Action Alternative 33 1-Scenario 1), which make up a large proportion of stream miles across the landscape, 34 would fall within the 0 to 20 percent gradient category and therefore, receive a 200-foot, 35 no-harvest RMZ. 36
Stream Shade 37 The effects of the alternatives on stream shade are analyzed in this subsection. In reading 38 this analysis, it should be remembered from Chapter 2 (Alternatives) that under the No 39 Action Alternative no ITPs or ESA Section 4(d) take authorization would be issued. 40 However, this lack of action would likely affect the Forest Practices Regulatory Program 41
Draft EIS Riparian and Wetland Processes
4-131
Chapter 4 in a way that is difficult to predict. Therefore, two scenarios, which represent the 1 endpoints of the reasonable range of possible outcomes for the Forest Practices 2 Regulatory Program, have been defined (subsection 2.3.1, Alternative 1 (No Action)) to 3 represent the No-Action Alternative. The effects of No Action are displayed for both of 4 these endpoints in the following subsections, but the actual outcome and the actual effects 5 of No Action on stream shade are likely to fall between these two scenarios. 6
Overview of Effects 7 An overview of the effects of the alternatives on stream shade is presented in this 8 subsection. Stream shade has already been greatly reduced along many streams within 9 the State due to historical logging practices, as well as other land uses (e.g., agriculture, 10 urbanization) (subsection 3.7.1.6, Historic Protection of Riparian Areas, and subsection 11 3.7.1.7, Current Condition of Riparian Areas). However, the current Washington Forest 12 Practices Rules, as well as the January 1, 1999 Washington Forest Practices Rules, 13 provide for substantially more shade retention than was provided historically, especially 14 along fish-bearing streams. Therefore, the amount of shade produced within riparian 15 zones on covered forestlands is increasing due to tree growth and because the rules under 16 any of the alternatives would result in the retention of most existing stream shade along 17 fish-bearing streams during harvest operations. This means that shade along fish-bearing 18 streams would be expected to increase under any of the alternatives, relative to baseline 19 conditions. Along non-fish-bearing streams, the amount of shade would likely remain 20 close to baseline conditions or increase depending on the alternative. Note that increases 21 in shade due to tree growth would be very slow to occur and would represent long-term 22 improvements. Changes in shade due to greater retention during harvest operations can 23 have positive effects over the short-term as well as long-term. The following paragraph 24 summarizes the degree to which each alternative is expected to affect shade levels. 25
Because of the shade rule, No Action Alternative 1-Scenario 2 would result in a moderate 26 reduction in shade along fish-bearing streams relative to all other alternatives. The lack 27 of a shade rule for non-fish-bearing streams would greatly reduce shade along these 28 streams. Of all the alternatives, No Action Alternative 1-Scenario 2 would provide the 29 lowest level of shade protection. 30
The amount of shade retention along fish-bearing streams would be slightly higher under 31 No Action Alternative 1-Scenario 1, Alternative 2, and Alternative 3, relative to No 32 Action Alternative 1-Scenario 2, as a result of wider RMZs and higher leave tree 33 requirements. RMZs along Np streams and the protection of unstable landforms and 34 other sensitive sites would provide increased shade retention along non-fish-bearing 35 streams relative to No Action Alternative 1-Scenario 2. Compared to Alternative 4, No 36 Action Alternative 1-Scenario 1 and Alternatives 2 and 3 provide slightly less shade 37 along fish-bearing streams and moderately less shade along non-fish-bearing streams. 38
Under Alternative 4, the amount of shade retention would be increased relative to No 39 Action Alternative 1-Scenario 1, Alternative 2, and Alternative 3, but would be only 40 slightly increased along fish-bearing streams (since most shade would already be 41 protected under these alternatives). Shade levels along non-fish-bearing streams would 42
Riparian and Wetland Processes Draft EIS
4-132
Chapter 4 be moderately higher under Alternative 4 relative to No Action Alternative 1-Scenario 1 1 and Alternatives 2 and 3. The amount of shade retention provided by Alternative 4 2 would be substantially higher for all streams compared to No Action Alternative 1-3 Scenario 2. 4
The comparisons among the alternatives described in the preceding paragraphs would 5 hold true for both western and eastern Washington. A detailed analysis of the 6 alternatives is presented in the following subsections. 7
Detailed Effects Analysis 8 No Action Alternative 1-Scenario 2 9 Westside: Type 1, 2, and 3 Waters. The evaluation criterion for stream shade is 0.75 10 site potential tree height, which represents full protection (Figure 4.7-3). Generally, trees 11 closer to the stream would be more likely to provide shade than those farther away 12 (Figure 4.7-3). On the westside, a 0.75 site potential tree height, which would range from 13 68 to 150 feet based on the 100-year site potential tree height and 75 to 185 feet based on 14 the 250-year site potential tree height, would provide full protection for stream shade 15 along Type 1-3 streams. Along most Type 1, 2, and 3 streams, the RMZ widths would 16 not meet this requirement under No Action Alternative 1-Scenario 2. The few exceptions 17 would be primarily where maximum RMZ widths are applied to low site classes. 18
The RMZs under this alternative would be, for the most part, less than the evaluation 19 criterion used for stream shade (0.75 site potential tree height). Also, some tree removal 20 could occur within the RMZ, which may reduce shade, although the shade rule would 21 specify the conditions under which trees can be removed (WAC 222-30-040). However, 22 these conditions suggest that full shade would not be provided in most cases. This has 23 the potential to allow some increase in stream temperatures relative to fully shaded 24 conditions. 25
Under No Action Alternative 1-Scenario 2, the Washington Forest Practices Rules would 26 include the shade rule, which would be designed to retain shade so water temperatures 27 will not exceed State water quality standards. As guidance for meeting the requirements 28 of the shade rule, the Washington Forest Practices Board Manual would include a shade 29 screening tool and, if necessary, water temperature modeling to determine the likely 30 effect of reducing shade levels. The shade rule would require maintenance of specific 31 shade levels depending upon the waterbody class (Class A or AA, designated by 32 Ecology) and elevation. The screening tool would use overhead canopy closure 33 (measured mid-stream using a spherical densiometer) as an index for shade. Depending 34 on elevation (particularly lower elevations) there would be increased shade requirements 35 along Type 1-3 streams due to the implementation of the shade rule. As a result, the 36 width of the RMZ and leave tree requirements within the RMZ may increase to the 37 maximum and shade levels are likely to increase. The shade rule would apply to trees 38 within the RMZ, which would range in width from 25 to 100 feet for Type 1-3 waters. 39
In tests of the shade screening tool, Rashin and Graber (1992) found that the screening 40 tool was effective at seven of the nine sites examined (excluding those with flow loss 41
Draft EIS Riparian and Wetland Processes
4-133
Chapter 4 within the reach). These results suggest that some streams may not be fully protected 1 from increases in temperature even with implementation of the shade rule guidelines. 2 The results from Rashin and Graber (1992) also suggested that prior to implementation of 3 the shade rule, low elevation streams less than 1,640 feet were at higher risk of exceeding 4 water quality standards than higher elevation streams. It is not known to what degree the 5 shade rule has been effective at protecting these low elevation streams. 6
Currently, the majority of trees in riparian zones are in early-seral stages (Table 3-18 and 7 3-19). Therefore, many riparian areas may not provide effective shade under existing 8 conditions, and it may take many years before riparian stands will be capable of 9 providing adequate shade. However, because there is no limitation on entry into RMZs 10 under No Action Alternative 1-Scenario 2, it is likely that many stands would be 11 harvested again during the next rotation, prior to or near the time that riparian stands 12 approach full shade function. 13
Westside: Type 4 and 5 Waters. Under No Action Alternative 1-Scenario 2, RMZs 14 would not be required for Type 4 waters except under limited site-specific conditions or 15 where stream-adjacent unstable slopes are protected through tree retention. Therefore, in 16 most cases, RMZs for Type 4 streams would not meet the minimum widths required to 17 maintain adequate shade. 18
Type 4 streams are most susceptible to alteration in shade since there are no RMZ or 19 leave tree requirements. Temperature effects in some Type 4 streams are likely to be 20 partially mitigated due to the fact that smaller streams can be partially or fully shaded 21 with overhanging shrubs, young trees, and slash (timber harvest debris), which are not 22 large enough to shade larger streams. 23
Eastside: Type 1, 2, and 3 Waters. A 0.75 site potential tree height, which ranges from 24 45 to 98 feet based on the 100-year site potential tree height and from 64 to 147 feet 25 based on the 250-year site potential tree height, is assumed to provide full shade retention 26 on the eastside (Spence et al. 1996; FEMAT 1993). Most RMZ widths for Type 1, 2, and 27 3 streams would not meet this requirement since the minimum RMZ width is 30 feet, 28 which is less than 0.75 site potential tree height for all site classes. The few exceptions 29 where the 0.75 site potential tree height would be met would be primarily where 30 maximum RMZs are applied to low site classes. 31
Similar to the westside, the potential for harvest within the RMZ under No Action 32 Alternative 1-Scenario 2, for all stream types would increase the likelihood that shade 33 will be further reduced. However, the shade rule would also be implemented on the 34 eastside, and RMZ width (30 to 300 feet) and leave tree requirements could be increased 35 to the maximum in order to meet required shade levels. The magnitude of temperature 36 increases resulting from canopy removal on the eastside might be expected to be slightly 37 less than for the westside because more open forest types (e.g., ponderosa pine) provide 38 less shading than coastal and western Cascade forests. However, many streams east of 39 the Cascades approach the maximum thermal tolerance level for salmonids during the 40 summer, and these smaller increases in temperature might be equally or more detrimental 41 to salmonids. 42
Riparian and Wetland Processes Draft EIS
4-134
Chapter 4 Similar to the westside, a majority of riparian stands are currently in early-seral stages, 1 and most of the remaining stands are in a mid-seral stage condition (Table 3-19). The 2 younger stands are not expected to provide shade that provides adequate function in the 3 short-term. Similar to the westside, the riparian stands would likely be harvested again 4 before reaching adequate shade along all streams. However, because the rotation is 5 longer in eastern Washington than on the westside, a greater proportion of the landscape 6 would likely be functioning prior to the subsequent rotation. 7
Eastside: Type 4 and 5 Waters. Under No Action Alternative 1-Scenario 2, RMZs 8 would not be required for Type 4 and 5 streams, except for limited site-specific 9 conditions and in cases where unstable slopes protection results in tree retention along 10 non-fish-bearing streams. Therefore, in most cases, RMZs for Type 4 and 5 streams 11 would be less than the minimum buffer width required for adequate retention of shade. 12
The greatest potential for adverse effects is for Type 4 and 5 streams with no leave tree 13 requirement and consequently no provisions for retention of shade. However, for many 14 Type 4 and 5 streams, the loss of shade would be somewhat mitigated because 15 overhanging shrubs, young trees, and slash are thought to provide effective shade. In 16 addition, selective harvest is the main silvicultural strategy (approximately 60 percent of 17 the landbase) applied to the eastside (Personal Communication, Charlene Rodgers, 18 Washington DNR, April 6, 2004). Therefore, some protection may be provided even if 19 no RMZ is established. Overall, however, the lack of RMZs on Type 4 streams would 20 not meet the level recommended for minimum protection, at least in the short- and mid-21 term. 22
No Action Alternative 1-Scenario 1 and Alternatives 2 and 3 23 Note: The reviewer is reminded to consider the differences in effectiveness over time of 24 the adaptive management programs among this group of alternatives (No Action 25 Alternative 1-Scenario 1[low], Alternative 2 [high], Alternative 3 [moderate]) in 26 evaluating the effects discussed below (subsection 4.1.5, Adaptive Management). 27
Westside: Type S and F Streams. Under No Action Alternative 1-Scenario 1 and 28 Alternatives 2 and 3, the Type S and F RMZ widths under the 100-year site potential tree 29 height and 250-year assumptions would nominally exceed the width recommended in the 30 literature to provide complete shade if considering only the RMZ width and not the RMZ 31 prescriptions. However, a substantial portion of inner and outer zone trees could be 32 harvested. Consequently some level of shade reduction would be expected under No 33 Action Alternative 1-Scenario 1 and Alternatives 2 and 3. Nevertheless, the cumulative 34 percent curve for shade (Figure 4.7-3) shows that the relationship between buffer width 35 and potential shade is non-linear, with more shade provided from trees closer to the 36 stream. For example, approximately 75 percent of shade effectiveness is within 0.5 site 37 potential tree height. In addition, RMZ widths begin at the edge of the Channel 38 Migration Zone where they are present, which provides additional protection to 39 vegetation in close proximity to the stream. Also, the shade rule would require that 40 minimum shade levels be maintained to meet State water temperature standards. 41
Draft EIS Riparian and Wetland Processes
4-135
Chapter 4 Additionally, it would be required that all trees within 75 feet of the stream (or Channel 1 Migration Zone) that contribute to minimum shade levels be retained. 2
While exempt 20-acre parcels would have less protective RMZ requirements, they would 3 be required to follow the shade rule. Therefore, RMZs on exempt parcels would be 4 required to include enough trees to meet the minimum shade requirements for achieving 5 State water temperature standards. However, exempt parcel RMZs would still not meet 6 the 0.75 site potential tree height evaluation criteria for full shade protection. 7
The no-harvest zones adjacent to the stream or Channel Migration Zone would range 8 from 50 feet under Option 1 (thinning from below) to 80 to 100 feet under Option 2 9 (leaving trees closest to the water). A 50-foot no-harvest RMZ would be expected to 10 provide 53 to 91 percent of full shade based on the 100-year site potential tree height and 11 from 44 to 86 percent of full shade based on the 250-year site potential tree height, 12 depending upon site class. Under Option 2, an 80-foot no-harvest zone would provide 13 between 75 and 100 percent of full shade based on the 100-year site potential tree height 14 and from 64 to 100 percent based on the 250-year site potential tree height. A 100-foot 15 no-harvest zone would provide between 86 and 100 percent (100-year site potential tree 16 height) or 76 and 100 percent (250-year site potential tree height) of full shade. Because 17 no harvest would be allowed in the core zone, all available shade within 50 feet of the 18 stream (or Channel Migration Zone) would be retained along Type S and F waters. 19
Under Option 1, besides the core zone adjacent to the stream or Channel Migration Zone, 20 the inner zone would extend out to 0.66 of the 100-year site potential tree height for 21 streams less than or equal to 10 feet wide and to 0.75 of the 100-year site potential tree 22 height for streams greater than 10 feet wide. These widths would equate to 0.54 and 0.61 23 site potential tree height for small and large streams, respectively, based on the 250-year 24 site potential tree height for Site Classes I-IV. The combined core and inner zone width 25 would exceed 100 feet for Site Class I and II soils and Site Class III soils for streams 26 greater than 10 feet wide. However, no data exists in the literature that demonstrates the 27 level of shade retention that is available from the combination of a no-harvest zone (i.e., 28 core) and a selective harvest zone (i.e., inner). The selective harvest that would occur 29 within the inner zone of Option 1 would leave the largest, and therefore the tallest, trees 30 which have the highest likelihood to provide shade. It is possible that under some 31 circumstances leave trees in the outer zone would also provide shade, but this would 32 likely be minimal or none in most cases. 33
Similar to No Action Alternative 1-Scenario 2, No Action Alternative 1-Scenario 1 and 34 Alternatives 2 and 3 would include the shade rule. The rule would require that minimum 35 shade levels be met within the RMZ to meet State water temperature standards. 36 However, the shade rule would be implemented slightly differently under these 37 alternatives compared to No Action Alternative 1-Scenario 2. 38
Under No Action Alternative 1-Scenario 2 the shade rule would apply to trees up to the 39 maximum RMZ width for that stream type and width. Under No Action Alternative 1-40 Scenario 1 and Alternatives 2 and 3, the shade rule would apply to the area within 75 feet 41 of the stream or Channel Migration Zone. In addition, canopy closure measurements 42
Riparian and Wetland Processes Draft EIS
4-136
Chapter 4 would be made at the edge of the Channel Migration Zone when it is present or, 1 otherwise, measurements would be made mid-stream. Nevertheless, it is unclear to what 2 extent the shade rule would actually contribute additional shade retention when 3 implemented because most shade producing trees that would be retained by the shade 4 rule would already be protected by the no-harvest core zone, the “thin from below” 5 requirements under Option 1, and the no-harvest portions of the inner zone under Option 6 2. Similar to all other alternatives, reductions in shade would occur from yarding 7 corridors and roads located in or across the RMZ. 8
All factors considered, the overall RMZ effectiveness for providing shade protection to 9 Type S and F streams under these alternatives is moderate to high based upon the 10 FEMAT (1993) shade curve, but high under most situations. Consequently, the likelihood 11 of negative temperature effects is considered low to moderate. No-harvest buffers 100 12 feet wide have been suggested to have similar levels of shade retention as old-growth 13 forests in western Oregon and Washington (Murphy 1995; Johnson and Ryba 1992), and 14 this width would be met under many Option 2 situations. In addition, if the channel shifts 15 within the Channel Migration Zone, the stream would still be provided shade. 16
The large proportion of RMZs that are in early-seral stages are not expected to reach full 17 shade capacity within the short-term (Tables 3-18 and 3-19), and some of these stands are 18 under-stocked by conifers and dominated by hardwoods. Many mid-seral stands would 19 develop to a point where canopy closure would be sufficient to produce shade 20 comparable to a late-seral stand in 20 or so years (Table 4.7-2); however, core zones that 21 are developing as under-stocked, hardwood-dominated stands may not attain shade levels 22 typical of an old-growth conifer forest (Washington Forest Practices Board 2001a). 23 Consequently, even no-harvest zones may not meet long-term shade needs. 24
Westside: Type N Streams. At least 50 percent of the Type Np stream length would be 25 protected with a 50-foot RMZ under No Action Alternative 1-Scenario 1, Alternative 2, 26 and Alternative 3, which would meet the small stream width criterion. Sensitive sites 27 (which include seeps, springs, perennial initiation points, and others) would also receive 28 protection from 50-foot RMZs. In addition, a 50-foot RMZ would be required for the 29 first 500 feet upstream of the confluence with a Type F or S stream. These 50-foot RMZs 30 would provide 53 to 91 percent of full shade protection based on the 100-year site 31 potential tree height and from 44 to 86 percent of full shade based on the 250-year site 32 potential tree height, depending upon site class. Higher levels of shade may be retained 33 along Type Np stream reaches where the protection of stream-adjacent unstable slopes 34 results in the retention of no- or limited-harvest buffers. Because many unstable 35 landforms (e.g., inner gorges, channel heads, bedrock hollows) are often located in close 36 proximity to non-fish-bearing waters, there is a high likelihood (particularly in western 37 Washington) that additional shade would be retained along Type Np streams as a result of 38 unstable slopes protection. For all other Type N streams, no RMZ would be provided 39 and, therefore, no shade protection is guaranteed, although some shade would be 40 maintained from understory vegetation. 41
Draft EIS Riparian and Wetland Processes
4-137
Chapter 4 The greatest potential for shade reduction would be along the portion of Np streams that 1 have no leave tree requirement, resulting in even-aged timber harvest adjacent to the 2 stream and no shade protection. Similar to Type 4 waters under No Action Alternative 1-3 Scenario 2, these streams would not receive adequate shade protection, at least in the 4 short term, which could result in water temperature increases. 5
However, the potential for increased temperatures would be partially mitigated by 6 overhanging shrubs and young trees, which provide effective shade for Type Np waters in 7 many cases. As discussed above, at least 50 percent of these streams would be provided 8 50-foot no-harvest RMZs. The intent of the 50-foot no-harvest RMZs along the lower 9 500 feet of Type Np streams would be to allow water temperatures to equilibrate to 10 shaded conditions prior to mixing with, or becoming, a Type F or S stream. Also, as 11 observed from current harvest practices, many additional Np and Ns streams would 12 receive additional protection due to restrictions on forest practices activities on unstable 13 slopes, where many of these streams are located (Personal Communication, Jeff Grizzel, 14 Washington DNR, April 6, 2004). There is a moderate level of uncertainty that the 15 cumulative protection for Type Np waters would be effective at providing adequate shade 16 for these small streams. Consequently, this is a priority research topic under the adaptive 17 management program under the current Washington Forest Practices Rules. 18
In watersheds with high proportions of exempt 20-acre parcels, the lack of RMZs on all 19 Type 4 and 5 streams required under No Action Alternative 1-Scenario 1 and 20 Alternatives 2 and 3, would increase the likelihood of adverse temperature effects. These 21 effects on Type N streams could also be transferred to downstream fish-bearing streams 22 until stream temperatures equilibrated with local environmental conditions. 23
Eastside: Type S and F Streams. Under No Action Alternative 1-Scenario 1 and 24 Alternatives 2 and 3, the total RMZ widths would nominally exceed the evaluation 25 criteria for widths recommended in the literature for shade along Type S and F streams, 26 but would include both no-harvest and partial cut silvicultural prescriptions. The 30-foot 27 no-harvest core zone adjacent to the stream or Channel Migration Zone would provide 28 between 49 and 86 percent of full shade based on the 100-year site potential tree height 29 and between 35 and 69 percent of full shade based on the 250-year site potential tree 30 height. Inner zone widths would be 45 feet for streams less than or equal to 15 feet wide 31 and 70 feet for streams greater than 15 feet wide. In cases where the inner zone is treated 32 as no-harvest, 75 feet would provide between 93 and 100 percent of full shade based on 33 the 100-year site potential tree height, and between 73 and 100 percent based on the 250-34 year site potential tree height. A 100-foot buffer would provide 100 percent of full shade 35 based on the 100-year site potential tree height and between 87 and 100 percent of full 36 shade based on the 250-year site potential tree height. However, some reduction in shade 37 would occur in many cases because some harvest would be allowed within the inner 38 zone. Leave tree requirements for inner zones would be dependent upon habitat type 39 (ponderosa pine, mixed conifer, or high elevation) and site class. Leave trees would 40 include 21 to 50 of the largest, and consequently tallest, trees per acre in the ponderosa 41 pine and mixed conifer habitat types. The high elevation timber habitat type would 42 follow the “thin from below” prescriptions used in western Washington. 43
Riparian and Wetland Processes Draft EIS
4-138
Chapter 4 There is a moderate level of uncertainty that leave tree requirements in the inner zone 1 would provide adequate shade protection, particularly if the core zone is not fully 2 stocked. In regions with higher ambient air temperature, any shade reduction could 3 increase the likelihood of adverse temperature effects (subsection 4.4.2.2, Evaluation of 4 Alternatives). However, other prescriptions may reduce this uncertainty, including 5 implementation of the “all available shade” rule within the bull trout overlay. This rule 6 would require that all available shade within 75 feet of the stream edge or Channel 7 Migration Zone be retained on Type S and F streams located within the bull trout overlay. 8 All available shade would be equivalent to the existing pre-harvest canopy closure, which 9 is measured with a densiometer (See above). 10
Under the shade rule, areas within the bull trout overlay, an additional 45 feet outside the 11 core zone (75 feet total) would be prescribed to maintain all available shade. This does 12 not necessarily imply no-harvest since the level of additional protection would be highly 13 site specific. As discussed previously for the westside, the shade rule would be based 14 upon canopy closure and shade protection under the bull trout overlay would be 15 implemented similarly. The shade rule would protect existing shade rather than potential 16 future shade. Consequently, some inner zone trees (or trees within 75 feet of the stream 17 within the bull trout overlay) could be harvested because they do not currently provide 18 shade, but could if they were taller. This limitation of the rule would be more important 19 on the eastside than the westside because stands tend to be more open on the eastside. 20
In a fully stocked stand, the trees closest to the stream would provide the bulk of the 21 shade protection with trees farther out providing relatively little additional shade. In 22 contrast, trees further from the stream have a higher potential to provide shade in a more 23 open stand. Compared to the westside, there would be a greater likelihood that the shade 24 rule would protect additional shade producing trees on the eastside, particularly within 25 the bull trout overlay, because the core zone would be narrower, and the shade rule would 26 consequently be applied to a larger area. 27
Also, while the 20-acre exemption lands would have narrower RMZ requirements, they 28 would still be required to follow the shade rule. Therefore, stream temperature could be 29 adversely affected. But the shade rule should moderate potential adverse effects in these 30 sites. 31
Similar to the westside, any yarding corridors and roads located within the RMZ would 32 reduce shade. All factors considered, No Action Alternative 1-Scenario 1 and 33 Alternatives 2 and 3 would have a low to moderate likelihood of negative temperature 34 effects along Type S and F streams. This assessment is based on the fact that some 35 shading would be diminished because the shade rule would only require that trees be left 36 within 75 feet of the stream, which would be less than what is considered full shade 37 protection based on the 0.75 site potential tree height criterion (FEMAT 1993). It would 38 also be based on the fact that some non-fish-bearing perennial streams would have no or 39 limited shade protection from RMZs. However, the basis of the shade rule would 40 consider the likely adverse effects from increased temperature and should help mitigate 41 negative effects. There is a moderate level of uncertainty in the effects assessment for 42
Draft EIS Riparian and Wetland Processes
4-139
Chapter 4 shade under No Action Alternative 1-Scenario 1, Alternative 2, and Alternative 3 because 1 of the lack of specific information on the assessment method (actual site-specific tree 2 height may vary among harvest sites, independent of stream temperature) and the overall 3 effectiveness of the shade rule at regulating stream temperature. 4
A large proportion of riparian stands are in the early-seral stages of development, so the 5 resulting levels of shade are lower than full potential. Most of the early-seral stages are 6 maturing and, in the absence of harvest, increased canopy cover development over the 7 mid-term would provide increased stream shade over most streams. 8
Eastside: Type N Streams. Type Np streams with 50-foot RMZs would meet the shade 9 criterion for smaller streams (less than 5 feet). For some other Type Np streams, no RMZ 10 would be provided and, therefore, no overstory shade protection would be provided 11 either. 12
The 50-foot no-harvest RMZ along some Type Np streams would provide complete shade 13 protection. Type Np streams with 50-foot selective harvest RMZs would be less likely to 14 provide complete shade protection. However, for small Type Np streams, the likelihood 15 for negative temperature effects would be reduced because overhanging shrubs and 16 young trees are thought to effectively shade these streams. Also, protection of stream-17 adjacent unstable slopes would result in the retention of additional shade along Type Np 18 streams in some cases. The highest likelihood for negative temperature effects would be 19 along Np streams that lack RMZs, similar to the westside because these streams are most 20 susceptible to shade loss over the short- and long term until new trees grow large enough. 21
As is the case for the westside, under No Action Alternative 1-Scenario 1 and 22 Alternatives 2 and 3, watersheds on the eastside with high proportions of exempt 20-acre 23 parcels would have a higher likelihood of adverse temperature effects because no RMZs 24 would be required for Type Np streams, and leave tree requirements would be reduced 25 relative to the standard rules. Water temperature increases could affect downstream fish-26 bearing streams until temperatures reach equilibrium with local environmental 27 conditions. 28
Alternative 4 29 Under Alternative 4, the 200-foot RMZs for streams with gradients of 0 to 20 percent 30 would meet or exceed the width recommended in the literature for full protection of 31 shade based on both the 100-year and 250-year site potential tree height. Streams with 20 32 to 30 percent gradient would receive a 100-foot no-harvest RMZ that would provide full 33 shade protection based on the 100-year site potential tree height and between 87 and 100 34 percent of full protection based on the 250-year site potential tree height. Assuming that 35 nearly all channels greater than 30 percent slope would be very small (less than 5 feet 36 wide), it would be expected that nearly 100 percent would meet the 50-foot buffer 37 criterion for small streams on both the west and eastsides with the 70-foot no-harvest 38 RMZ. Overall, the RMZ width provided should be sufficient to maintain most if not all 39 sources of shade on these streams. The recovery period for shade along early- and mid-40 seral stage riparian stands would be similar to No Action Alternative 1-Scenario 1. 41
Riparian and Wetland Processes Draft EIS
4-140
Chapter 4 Overall, most if not all shade would be protected under Alternative 4 for all streams on 1 both the east and westsides. In general, the no-harvest RMZs would provide a high level 2 of protection, and would pose a low likelihood of negative temperature effects. In 3 addition, all RMZ widths would be less likely to be susceptible to appreciable mortality 4 from windthrow. Alternative 4 would provide a higher to much higher level of shade 5 protection compared to either scenario of No Action Alternative 1 for all streams. 6
Leaf and Needle Litter Production 7 Overview of Effects 8 The effects of the alternatives on leaf and needle litter delivery (i.e., “detritus;” See 9 Glossary) are analyzed in this subsection. Leaves and needles, as well as other biological 10 inputs (e.g., terrestrial insects), enter the stream from riparian vegetation and supply 11 nutrients and food to stream systems. Due to historical harvest practices, leaf and needle 12 litter supply has been substantially reduced. Therefore, compared to baseline conditions, 13 the amount of leaf and needle litter delivery and the resulting effects on riparian 14 processes are expected to increase under any of the alternatives. The following 15 paragraphs address leaf and needle supply and associated effects under each alternative. 16
No Action Alternative 1-Scenario 2 would result in moderate (Type 1, 2, and 3 waters) to 17 very high (for Type 4 and 5 waters) reductions in leaf and needle litter recruitment 18 potential relative to all other alternatives. However, negative effects on aquatic food and 19 nutrient supply would be less likely, as some early-successional trees, shrubs, and 20 herbaceous plants supply leaf and needle litter and other detritus that may be of high 21 quality as food and nutrient sources. The amount and quality depends on the type of re-22 growth (e.g., alder leaves appear to be high quality) that occurs. Also, increased short-23 term autochthonous production (See Glossary) following harvesting would be expected to 24 supplement allocthonous food sources (See Glossary) such as leaf and needle fall. 25
No Action Alternative 1-Scenario 1 and Alternatives 2 and 3 would provide high (for 26 Type S and F waters) to moderate (for Type N waters) levels of leaf and needle litter 27 recruitment potential compared to No Action Alternative 1-Scenario 2. The supply of 28 leaf and needle litter would be expected to be the same among No Action Alternative 1-29 Scenario 1, Alternative 2, and Alternative 3 since the rules among the alternatives are the 30 same. Like No Action Alternative 1-Scenario 2, these alternatives would compensate for 31 reduced coniferous leaf and needle litter through non-coniferous riparian vegetation along 32 streams, reducing the likelihood for negative effects. 33
Alternative 4 would provide the highest level of leaf and needle litter recruitment 34 potential of all the alternatives. Alternative 4 would provide much greater leaf and 35 needle recruitment than No Action Alternative 1-Scenario 2 and slightly greater 36 recruitment than No Action Alternative 1-Scenario 1. The likelihood for negative effects 37 associated with reductions or changes in leaf and needle supply would be very low under 38 Alternative 4. 39
Draft EIS Riparian and Wetland Processes
4-141
Chapter 4 Detailed Effects Analysis 1 No Action Alternative 1-Scenario 2 2 Westside. A 0.5 site potential tree height, which ranges from 45 to 100 feet depending 3 on site class based on the 100-year site potential tree height and from 50 to 124 feet based 4 on the 250-year site potential tree height, is considered to provide full protection for leaf 5 and needle litter inputs based on FEMAT (1993). For January 1, 1999 Washington 6 Forest Practices Rules, depending on site class, full protection would be provided based 7 on maximum RMZ widths for Type 1, 2, and 3 streams. However, the minimum RMZ 8 width of 25 feet would not meet the 0.5 site potential tree height required for complete 9 protection of leaf and needle litter (Figure 4.7-2). 10
For each stream type, RMZ width could vary between the minimum and maximum 11 values, depending on the extent of wetland vegetation or the width needed to meet shade 12 requirements. For Type 4 and 5 waters, RMZs would not be required except for site-13 specific conditions and, in all cases, would not exceed 25 feet. Therefore, RMZs for 14 Type 4 and 5 streams would not meet the 0.5 site potential tree height required for 15 complete protection. 16
Under No Action Alternative 1-Scenario 2, leaf and needle litter recruitment would be 17 compromised along Type 1 through 3 streams because the January 1, 1999 Washington 18 Forest Practices Rules allow substantial reduction in overstory conifers and hardwood 19 removal through selective harvest within the RMZ, thus reducing the biomass that would 20 likely be recruited. For streams with RMZs that do not meet the 0.5 site potential tree 21 height criterion combined with the selective harvest prescriptions, the likelihood for 22 reduced leaf and needle litter recruitment would increase. The likelihood would be 23 further increased when both the required RMZ width is not met and selective harvest is 24 allowed within the RMZ. 25
Further reductions in leaf and needle recruitment would be associated with Type 4 and 5 26 streams that lack an RMZ or leave-tree requirement. The size and morphology of small 27 low-order streams greatly influences the deposition and processing of organic materials. 28 Litter is primarily deposited in small steep-gradient streams in forested areas high in a 29 watershed. Small (low-order) streams are important to the productivity of larger (high-30 order) stream in lower reaches of the watershed because they are a major source of 31 organic material (IMST 1999). The exact proportion of detrital production that comes 32 from Type 4 and 5 streams is poorly documented in the literature; however, it may be 33 important to overall productivity. The lack of RMZs on Type 4 and 5 streams would not 34 meet the protection recommended for detrital input needs, at least in the short term, and 35 probably only in localized areas while vegetation grows back. 36
There would likely be an interruption of detrital inputs (i.e., fine organic matter; often 37 leaves, needles, and small sticks) and terrestrial insects to Type 4 and 5 streams until the 38 riparian forest becomes reestablished after harvest. Riparian stands would then produce 39 some leaf and needle litter, although production might not reach full potential in the short 40 or long term. In addition, the type of the litter may be different than that provided by pre-41 harvest stands because of shifts in the ratio of coniferous versus deciduous vegetation. 42
Riparian and Wetland Processes Draft EIS
4-142
Chapter 4 The type of detrital input can affect not only its nutritional value, but also the amount of 1 time needed for decomposition (Gregory et al. 1987). 2
In some cases detrital input has been found to be quite high shortly after clearcutting 3 (within 5 years) depending on the type of riparian vegetation that develops (such as red 4 alder) although still lower than old-growth input (Piccolo and Wipfli 2001; Bilby and 5 Bisson 1992). Also, as the forest develops, possibly progressing through a deciduous 6 forest stage to a young coniferous forest and finally to mature and old-growth forest, the 7 type and amount of detrital input changes both in type and amount, often with a decrease 8 in supply during the young conifer stage (Piccolo and Wipfli 2002). The degree to which 9 leaf and needle litter composition is altered is difficult to determine because: 1) timber 10 harvest occurs in localized areas at varying times within a watershed, and 2) all seral 11 stages provide some level of leaf and needle input, although in varying quantities. 12
Currently, most riparian vegetation is in early to mid-seral stages (Tables 3-18 and 3-19). 13 Stand age significantly influences detrital input to a stream system. Therefore, these 14 stands will not produce leaf and needle litter in quantities that approach natural 15 background levels in the short term (Table 4.7-2). Mid-seral stands would develop to the 16 point that canopy structure would be sufficient to produce leaf and needle litter 17 comparable to a late-seral stand near the end of a 50-year period (Table 4.7-2). As a 18 result, just as the stand is meeting detrital input production levels, the stand would likely 19 be harvested again for the next rotation, never allowing complete return to pre-harvest 20 production levels. 21
Eastside. A 0.5 site potential tree height, which ranges from 30 to 65 feet, depending on 22 site class based on the 100-year site potential tree height and from 43 to 98 feet based on 23 the 250-year site potential tree height, would be considered to provide full protection of 24 leaf and litter inputs on the eastside. Under January 1, 1999 Washington Forest Practices 25 Rules in eastern Washington, full protection would be provided based on the maximum 26 and average RMZ widths for Type 1, 2, and 3 streams. The only exception is for Site 27 Class I, which would require a wider RMZ to meet the 0.5 site potential tree height 28 necessary for complete protection. The minimum RMZ width of 30 feet only meets the 29 0.5 site potential tree height criterion for Site Class V sites based on the 100-year site 30 potential tree height (Figure 4.7-2). RMZs are not required for Type 4 and 5 waters and, 31 therefore, these streams do not meet the 0.5 site potential tree height required for 32 complete protection. 33
As for the westside, the possibility of harvest activity within the RMZ under No Action 34 Alternative 1-Scenario 2 for all stream types leaves the possibility that leaf and needle 35 litter production would be compromised. The greatest reductions would be associated 36 with Type 4 and 5 streams that lack a leave tree requirement and where timber harvest 37 could occur adjacent to the stream. The lack of an RMZ on these smaller streams would 38 indicate that Type 4 and 5 waters receive no protection of leaf and needle litter 39 recruitment. However, uneven-aged (partial cut) timber harvest strategies are the most 40 common harvest method used on the eastside (about 60% of eastside forestland) 41 (Personal Communication, Charlene Rodgers, Washington DNR, April 6, 2004). 42
Draft EIS Riparian and Wetland Processes
4-143
Chapter 4 Therefore, some incidental protection would exist even if no RMZ is applied. Overall, 1 the lack of RMZs on Type 4 and 5 streams would not meet the level required for full 2 protection of leaf and needle litter input, at least in the short term, and probably in most 3 areas for the mid- and long-term. 4
Currently, most riparian vegetation is in early-seral and mid-seral stages (Tables 3-18 and 5 3-19). These young stands would not be producing leaf and needle litter that approach 6 pre-harvest levels in the short term (Table 4.7-2). Similar to the westside, most stands 7 would likely be entered again prior to the complete return of detrital production. 8
No Action Alternative 1-Scenario 1, Alternatives 2 and 3 9 Note: The reviewer is reminded to consider the differences in effectiveness over time of 10 the adaptive management programs among this group of alternatives (No Action 11 Alternative 1-Scenario 1[low], Alternative 2 [high], Alternative 3 [moderate]) in 12 evaluating the effects discussed below (subsection 4.1.5, Adaptive Management). 13
Westside. Under No Action Alternative 1-Scenario 1 and Alternatives 2 and 3 the 14 overall RMZ widths would exceed the evaluation criteria for widths recommended in the 15 literature for leaf and needle litter production for Type S and F streams. Type Np streams 16 with a 50-foot RMZ would receive most of the protection required to maintain leaf and 17 needle litter input, but not at the level recommended by the literature for full protection. 18 For some portions of Type Np and Ns streams, no RMZ would be provided and, therefore, 19 no protection of leaf and needle litter would be provided. 20
The no-harvest zone would range from 50 feet under Option 1 to between 80 and 100 feet 21 under Option 2 and would maintain most leaf and needle litter input along Type S and F 22 streams. In addition, harvesting within the inner zone would not be expected to 23 appreciably reduce the capacity of the RMZ to contribute leaf and needle litter, especially 24 when combined with the core zone no-harvest area. These RMZs would provide 25 continuous inputs for leaf and needle litter to streams and would allow the maintenance 26 of stream productivity in the short and long term depending on the stand age and 27 structure. 28
The greatest reductions in leaf and needle input would be along Type Np and Ns streams 29 that have no leave tree requirement along some of their lengths due to even-aged timber 30 harvest adjacent to the stream. However, implementation of the rules under No Action 31 Alternative 1-Scenario 1 and Alternatives 2 and 3 related to operations on unstable slopes 32 would result in the protection of many streams located in close proximity to unstable 33 areas (Personal Communication, Jeff Grizzel, Washington DNR, April 6, 2004). While 34 the lack of an RMZ requirement on most of these smaller streams would indicate that 35 these waters receive little protection of leaf and needle litter recruitment, the application 36 of the unstable slopes rules and the RMZ requirement on portions of Np streams would 37 maintain the sources of much natural detrital input. While some protection would occur, 38 these streams would not meet the requirements for adequate protection of detrital input, at 39 least in the short term, and probably only in localized areas while vegetation grows back. 40 Similar to No Action Alternative 1-Scenario 2, a shift in the initial type of detrital input 41 would be expected from coniferous needles to deciduous vegetation in many areas. 42
Riparian and Wetland Processes Draft EIS
4-144
Chapter 4 Because of the large proportion of RMZs that are in early- and mid-seral stages, they 1 would not be expected to produce leaf and needle litter that approaches pre-harvest levels 2 in the short term (Tables 3-18 and 3-19). Mid-seral stands would develop to the point 3 that canopy closure would be sufficient to produce leaf and needle litter comparable to 4 late-seral stands near the end of a 50-year period (Table 4.7-2). Because RMZs would 5 not be re-entered until the DFC was met, most stands would have the opportunity to 6 return to natural production levels over the long-term. 7
Eastside. Under No Action Alternative 1-Scenario 1 and Alternatives 2 and 3, all RMZ 8 widths for Type S and F streams would exceed the 0.5 site potential tree height 9 recommended in the literature for leaf and needle litter production. For Type Np streams 10 that receive a 50-foot RMZ, the 0.5 site potential tree height would be met for Site 11 Classes II through V and would protect most of the Site Class I riparian areas. Under the 12 partial cut strategy, all Np streams would be provided with an RMZ, and under the 13 clearcut strategy, at least 70 percent of the Np streams would be provided with an RMZ. 14 For all other Type Np and Ns streams, no RMZ would be provided, and, therefore, no 15 protection of leaf and needle litter would be directly provided. However, as noted for 16 westside streams above, unstable slope protection would provide additional protection for 17 these streams where unstable slopes and landforms are located in streamside areas. 18
Along Type S and F streams, the 30-foot core zone combined with the selective harvest 19 inner zone should maintain most leaf and needle litter input. Type S and F RMZs would 20 provide continuous inputs of leaf and needle litter to streams and would allow the 21 maintenance of stream productivity in the short- and long-term depending on the stand 22 age and structure. 23
As described earlier, landowners must identify either a partial cut and/or clearcut strategy 24 within the 50-foot RMZ along Type Np waters when they submit a forest practices 25 application to Washington DNR. When the clearcut strategy is identified along no more 26 than 30 percent of the stream in the harvest unit, no-harvest RMZs of equal length on 27 both sides of the stream must also be identified. The 50-foot no-harvest RMZ along 28 some Type Np streams and the 50-foot selective harvest RMZ along others would 29 maintain some if not all of the leaf and needle recruitment capacity. However, some 30 reduction in leaf and needle recruitment would occur along Type Np streams designated 31 for the clearcut strategy and Type Ns stream reaches without any leave tree requirements. 32 Therefore, these streams would be most susceptible to reduced detrital inputs over the 33 short- and long-term until new trees grow back in localized areas. For a large proportion 34 of the RMZs in early-seral stage, production of leaf and needle litter is currently 35 compromised. As a result, only over time will the increased tree biomass occur to allow 36 for increased litter recruitment to streams. 37
Alternative 4 38 Statewide. Under Alternative 4, the RMZ width for most streams (0 to 30 percent 39 gradient) would meet or exceed the evaluation criteria for widths recommended in the 40 literature for maintaining full leaf and needle litter recruitment potential. In addition, 41 there would be no harvest in the RMZs, which would provide complete protection of leaf 42
Draft EIS Riparian and Wetland Processes
4-145
Chapter 4 and needle litter production. The only exceptions would be along streams with a gradient 1 greater than 30 percent. These high gradient streams would meet the 0.5 site potential 2 tree height for westside Site Classes III through V and all site classes on the eastside. 3 These streams would be protected with no-harvest RMZs 70 feet in width. Although the 4 exact proportion of detrital production that comes from these streams is poorly 5 documented in the literature, it may be important to overall productivity. However, the 6 RMZs provided should be sufficient to maintain most the detrital inputs to these streams 7 at or near pre-harvest conditions. The timing for recovery of leaf and needle input along 8 streams dominated by early and mid-seral stage riparian forests would be similar to No 9 Action Alternative 1-Scenario 1. 10
Overall, most if not all leaf and needle litter input would be protected for all streams 11 statewide under Alternative 4. Alternative 4 would provide more to substantially more 12 protection of leaf and needle input when compared to either scenario of No Action 13 Alternative 1 for all streams. 14
Microclimate 15 Overview of Effects 16 An overview of the effects of the alternatives on microclimate is presented in this 17 subsection. Microclimate can be greatly influenced by the size of the riparian buffer and 18 also adjacent management practices. For perspective, it is important to note that 19 microclimate has already been greatly diminished from removal of trees along many 20 streams within the State due to historical logging practices, as well as other development 21 impacts (e.g., agriculture, urbanization) (subsection 3.7.1.6, Historic Protection of 22 Riparian Areas, and subsection 3.7.1.7, Current Condition of Riparian Areas). However, 23 the current Washington Forest Practices Rules, as well as the January 1, 1999 24 Washington Forest Practices Rules, provide for substantially more riparian area 25 protection than was provided historically, especially along fish-bearing streams. 26 Therefore, the amount of forested riparian zones on covered forestlands, which benefit 27 microclimate, is increasing due to tree growth. It is also increasing because the rules 28 under any of the alternatives would result in the retention of more trees along fish-bearing 29 streams during harvest operations, resulting in more desirable microclimate conditions 30 relative to baseline conditions. Along non-fish-bearing streams, microclimate conditions 31 would likely remain close to baseline. Changes in microclimate due to greater retention 32 during harvest operations can have positive effects over the short-term as well as long-33 term. The following paragraphs summarize the extent to which each alternative is 34 expected to affect microclimate function. 35
Relative to No Action Alternative 1-Scenario 1, Alternative 2, and Alternative 3, the 36 likelihood under No Action Alternative 1-Scenario 2 for reduced microclimate function 37 would be moderate for fish-bearing streams and high for non-fish-bearing streams. This 38 is because RMZs are relatively narrow and microclimate is markedly affected by both 39 riparian retention and clearcutting or substantial removal of vegetation adjacent to the 40 riparian area. The result from this alternative would be an increased likelihood for higher 41 air temperatures and reduced humidity within RMZs along fish-bearing, and particularly 42
Riparian and Wetland Processes Draft EIS
4-146
Chapter 4 non-fish-bearing, streams. The retention of buffers along more than half of the length of 1 Np channels due to RMZs and unstable slopes protection under No Action Alternative 1-2 Scenario 1 and Alternatives 2 and 3 explains the high likelihood of increased 3 microclimate function compared to No Action Alternative 1-Scenario 2. 4
Microclimate function would not be expected to differ between No Action Alternative 1-5 Scenario 1, Alternative 2, and Alternative 3 since the rules are the same for each 6 alternative. 7
Relative to No Action Alternative 1-Scenario 2, Alternative 4 would have a low 8 likelihood for reduced microclimate function along streams with less than 20 percent 9 gradient (primarily inclusive of all fish-bearing streams) and a very low likelihood for all 10 other streams. The likelihood for reduced microclimate function would be moderate 11 relative to No Action Alternative 1-Scenario 1 and Alternatives 2 and 3. 12
Detailed Effects Analysis 13 No Action Alternative 1-Scenario 2 14 Statewide. Under this alternative, microclimatic gradients, and particularly relative 15 humidity and air temperature, would be negatively affected. Sullivan et al. (1990) 16 studied the effects of current Washington Forest Practices Rules on water and air 17 temperature in riparian areas and found significant increases in air temperature. A nearly 18 one-to-one correlation was found between air temperature and percent shade. 19
Microclimatic conditions would be negatively affected, relative to pre-harvest conditions, 20 on all stream types. This is anticipated because the RMZ widths would, at most, be only 21 about two-thirds or less of the 147 feet minimum (maximum of 100 feet on Type 1 and 2 22 streams on the westside and generally 50 feet on the eastside). Microclimate conditions 23 would also be negatively affected because harvest would be allowed within RMZs. 24
Under No Action Alternative 1-Scenario 2, air temperature and humidity would be 25 adversely affected on both the west and eastsides. On the eastside, which has high 26 average ambient air temperatures, the change in microclimate could further increase air 27 temperature. 28
No Action Alternative 1-Scenario 1 and Alternatives 2 and 3 29 Note: The reviewer is reminded to consider the differences in effectiveness over time of 30 the adaptive management programs among this group of alternatives (No Action 31 Alternative 1-Scenario 1[low], Alternative 2 [high], Alternative 3 [moderate]) in 32 evaluating the effects discussed below (subsection 4.1.5, Adaptive Management). 33
Statewide. Although there are some differences between the two westside harvest 34 options under these alternatives that might affect air temperature and overall 35 microclimatic gradients, there is enough existing knowledge of microclimatic gradients to 36 distinguish between the effects of Options 1 and 2. Therefore, they are treated the same. 37
In contrast to No Action Alternative 1-Scenario 2, total RMZ widths for Site Classes I 38 and II would approach or exceed the evaluation criteria for minimum buffer widths for 39
Draft EIS Riparian and Wetland Processes
4-147
Chapter 4 overall microclimate gradient maintenance, at least on fish-bearing streams. However, 1 because some level of harvest would be allowed within the RMZs, the natural gradients 2 would not likely be maintained. Within the no-harvest zone of RMZs on fish-bearing 3 streams, relative humidity, and other parameters would probably be somewhat lower than 4 under natural conditions since decreased humidity in the adjacent selectively harvested 5 inner and outer zones would affect the core zone to some extent. 6
The adverse effects to microclimate along non-fish-bearing streams would be greater than 7 along fish-bearing streams. For Type Np and Ns stream segments that would not have 8 RMZs, no protection would be provided. On Type Np stream segments that would 9 receive some protection from no-harvest RMZs, the 50-foot width would be at most one-10 third of the minimum recommended buffer for the various microclimate variables. In 11 cases where stream-adjacent unstable slopes would extend out to or beyond the minimum 12 147 feet needed to maintain microclimatic gradients, little or no adverse effect on 13 microclimate function would be expected. However, the degree to which this would 14 occur is solely a function of the distribution of unstable slopes and would most likely 15 occur in western Washington where unstable slopes are more common. 16
Air temperature and humidity would be affected under this alternative because the buffer 17 width for maintaining these gradients would be even greater than for other microclimatic 18 gradients. Eastside air temperatures within RMZs would be likely to experience a greater 19 change since ambient air temperatures tend to be higher on the eastside than on the 20 westside. 21
Alternative 4 22 Statewide. Alternative 4 would provide the highest degree of protection of 23 microclimatic gradients. Streams with channel gradients of less than 20 percent would 24 receive 200-foot no-harvest RMZs. This would be sufficient to maintain microclimatic 25 gradients for most variables. Air temperature, humidity, and wind speed would 26 nonetheless be affected to some extent since they would require wider buffers (240 to 787 27 feet) to maintain pre-harvest gradients. 28
Streams with higher channel gradients would receive somewhat less protection. Streams 29 with gradients between 20 and 30 percent would receive 100-foot, no-harvest RMZs, 30 while streams with higher gradients would receive 70-foot, no-harvest RMZs, which 31 would be unlikely to maintain most microclimate gradients. Under both situations, pre-32 harvest microclimate gradients would be modified, but the extent of modification would 33 be lower than under either scenario of No Action Alternative 1. However, as with lower 34 gradient streams, air temperature, humidity, and wind speed would be substantially 35 affected across riparian areas. 36
Bank Stability 37 Overview of Effects 38 The effects of the alternatives on bank stability, which results in streambank erosion, are 39 summarized in this subsection. From an historical perspective, bank stability was 40 affected much more from past harvest practices than recent management actions 41
Riparian and Wetland Processes Draft EIS
4-148
Chapter 4 (subsection 3.4.2.3, History of Forest Practices Affecting Erosion and Sedimentation). 1 Therefore, compared to baseline conditions, bank stability and resulting effects on 2 streambank erosion would be expected to improve under any of the alternatives. The 3 following paragraphs address the effects of each alternative on bank erosion. 4
No Action Alternative 1-Scenario 2 would maintain bank stability for all fish-bearing 5 streams (Type 1, 2, and 3) except those with minimum (25- to 30-foot) RMZs. Bank 6 stability would not be maintained along non-fish-bearing streams (Type 4 and 5), which 7 generally have no RMZ requirement. Bank stability in these smaller streams, however, 8 would have less effect on fish-bearing streams than bank stability in fish-bearing streams 9 because of their lower erosion potential. Relative to all other alternatives, No Action 10 Alternative 1-Scenario 2 provides the lowest level of bank stability maintenance. 11
No Action Alternative 1-Scenario 1 and Alternatives 2 and 3 would fully maintain bank 12 stability of fish-bearing streams due to RMZ widths. The 50-foot no-harvest RMZ would 13 fully maintain bank stability along more than 50 percent of Type Np channels (non-fish-14 bearing perennial streams), and partial cutting on the eastside should be nearly as 15 effective. The unstable slope protection rules would supplement the protection provided 16 by RMZs along a substantial proportion of Np and Ns channels. These alternatives would 17 provide higher levels of bank stability and maintenance on streams, especially non-fish-18 bearing streams, than No Action Alternative 1-Scenario 2. 19
Alternative 4 would fully maintain bank stability on all stream channels. It would 20 maintain bank stability at slightly higher levels than No Action Alternative 1-Scenario 1 21 and at much higher levels than No Action Alternative 1-Scenario 2. 22
Detailed Effects Analysis 23 The analysis and details of the alternative assessments on bank stability are presented in 24 subsection 4.4.2.2 (Evaluation of Alternatives) and are only summarized here because of 25 the function that riparian zones serve in maintaining bank stability. Readers should refer 26 to the noted subsection for further details. 27
No Action Alternative 1-Scenario 2 28 Statewide. Along westside fish-bearing streams (Type 1, 2, and 3), bank stability under 29 No Action Alternative 1-Scenario 2 would be fully maintained if maximum RMZs are 30 implemented. However, the 25-foot minimum RMZ would be less than needed to fully 31 maintain bank stability on most fish-bearing streams. Therefore, in some situations, fish-32 bearing streams would be only partly protected on the westside. 33
Bank stability would be fully maintained with maximum and average RMZ widths for all 34 fish-bearing streams on the eastside, except along some Site Class I streams, which 35 would require greater width for full maintenance. Full maintenance for all other site 36 classes would be provided with 30-foot RMZs on fish-bearing streams. 37
The general lack of any RMZs or leave tree requirements along all Type 4 and 5 streams 38 would mean that bank stability would rarely be fully maintained. But because of their 39
Draft EIS Riparian and Wetland Processes
4-149
Chapter 4 small size and low stream power, these streams would likely be less adversely affected 1 relative to reduced bank stability than larger Type 1, 2, and 3 streams. 2
No Action Alternative 1-Scenario 1 and Alternatives 2 and 3 3 Note: The reviewer is reminded to consider the differences in effectiveness over time of 4 the adaptive management programs among this group of alternatives (No Action 5 Alternative 1-Scenario 1[low], Alternative 2 [high], Alternative 3 [moderate]) in 6 evaluating the effects discussed below (subsection 4.1.5, Adaptive Management). 7
Statewide. In both western and eastern Washington, Type S and Type F bank stability 8 would be fully maintained based on suggested minimum no-harvest RMZs for one-half 9 crown diameter (0.3 site potential tree height) (FEMAT 1993). No Action Alternative 1-10 Scenario 1 (and Alternatives 2 and 3) would supply much greater maintenance of bank 11 stability than No Action Alternative 1-Scenario 2. 12
Most reaches on Type Np streams would be fully maintained due to the combined 13 protection afforded by 50-foot no-harvest RMZs on at least 50 percent of the stream 14 length, along with the incidental protection realized by the presence and protection of 15 unstable slopes and sensitive sites, and partial cuts occurring on some eastside streams. 16 The lower power of the typically more confined stream channels would likely reduce the 17 need for the widest buffers stated in the literature for full maintenance, so even in reaches 18 without RMZs, adverse effects would likely be relatively low. 19
Other than a 30-foot Equipment Limitation Zone no direct protection would be provided 20 for bank stability for small Ns channels. However, some protection would be provided 21 from unstable slope buffering, which would often include these channels (Personal 22 Communication, Jeff Grizzel, Washington DNR, April 6, 2004). As noted above, the 23 small size of Type Np streams would reduce the chance of adverse effects to these stream 24 systems from bank instability. Maintenance levels for Type N streams, which correspond 25 to Type 4 and 5 streams under No Action Alternative 1-Scenario 2, would generally be 26 much greater than under No Action Alternative 1-Scenario 2. 27
Alternative 4 28 Statewide. Overall, bank stability would be fully maintained under Alternative 4 for all 29 streams on both the east and westside, due to the width of RMZs. This alternative would 30 provide much greater bank stability maintenance than No Action Alternative 1-Scenario 31 2. Alternative 4 would be only slightly better than No Action Alternative 1-Scenario 1 at 32 maintaining bank stability because most fish-bearing streams would be protected under 33 all alternatives. Also, a majority of the smaller streams that would have potential to 34 contribute sediment through bank erosion would also be protected; although there still 35 would be greater protection under Alternative 4 as all of these streams would be fully 36 protected. 37
Riparian and Wetland Processes Draft EIS
4-150
Chapter 4 Sediment Filtration 1 Overview of Effects 2 The effects of the alternatives on sediment filtration are summarized in this subsection 3 (See subsection 3.4.2.2, Forest Practices Effects on Erosion and Sedimentation). 4 Historically, providing filtration of overland sediment movement to streams was not part 5 of harvest prescriptions. But retention of RMZs has been increasing, improving sediment 6 filtration. These practices represent a small portion of total past harvest. Filtration 7 mechanisms likely have their greatest benefit over the short term (a few years). As 8 vegetation reestablishes, the need for filtration decreases (subsection 3.4.2.3, History of 9 Forest Practices Affecting Erosion and Sedimentation). Therefore, relative to baseline, 10 any alternative that does not supply full filtration would reduce protections of overland 11 sediment entering streams. So some alternatives would increase overland sediment 12 delivery to streams relative to baseline. The following paragraphs address the effects of 13 each alternative on sediment filtration. 14
No Action Alternative 1-Scenario 2 would maintain moderate to high levels of sediment 15 filtration capacity for fish-bearing streams, depending on the assumptions used. If a 30-16 foot buffer were adequate to prevent most overland sediment from entering streams, 17 maintenance would be high if the buffer was a no-harvest buffer. If 200-foot buffers 18 were needed, the maintenance would be low. A 30-foot buffer may be adequate under 19 some conditions, but information is not available for confirmation in all situations. 20 Maintenance would be low for non-fish-bearing streams since no RMZs would be 21 required. Overall, No Action Alternative 1-Scenario 2 would maintain the lowest level of 22 sediment filtration capacity of all the alternatives. 23
Sediment filtration capacity would be expected to be the same for No Action Alternative 24 1-Scenario 1, Alternative 2, and Alternative 3 because the rules governing hillslope 25 erosion would be the same among these alternatives. No Action Alternative 1- Scenario 1 26 and Alternatives 2 and 3 would provide mostly high maintenance of sediment filtration 27 for fish-bearing streams, although it could be lower depending on the assumptions used. 28 Maintenance of filtration capacity on non-fish-bearing, perennial streams would be 29 mostly moderate due to inclusion of RMZs over more than 50 percent of perennial 30 channels. Overall, maintenance of sediment filtration capacity would be higher than 31 under No Action Alternative 1-Scenario 2 but lower than that provided by Alternative 4. 32
Alternative 4 would maintain the highest level of sediment filtration capacity of all the 33 alternatives. Maintenance would be substantially higher than under No Action 34 Alternative 1- Scenario 2, but only slightly higher than under No Action Alternative 1-35 Scenario 1 and Alternatives 2 and 3, assuming a 30-foot buffer is adequate to filter most 36 sediment. 37
Detailed Effects Analysis 38 The current status and types of sediment filtration is presented under Harvest-Related 39 Surface Erosion in subsection 3.4.2.2 (Forest Practices Effects on Erosion and 40 Sedimentation). The analysis and details of the alternatives’ assessment on the capacity 41
Draft EIS Riparian and Wetland Processes
4-151
Chapter 4 of riparian zones to filter sediment are presented in subsection 4.4.1.2 (Evaluation of 1 Alternatives) and are only summarized here. This analysis uses an equivalent buffer area 2 index for sediment filtration. Readers should refer to the noted subsection and Appendix 3 B, Riparian Modeling, for further details. 4
No Action Alternative 1-Scenario 2 5 Statewide. The sediment equivalent buffer area index analysis was similar for east and 6 westside streams (Figures 4.4-1 and 4.4-2). Although there were slight differences for 7 east and westside conditions, sediment equivalent buffer area index values for fish-8 bearing streams were estimated at over 92 percent and about 70 percent for 30- and 200-9 foot buffer assumptions, respectively. For comparison, a clearcut sediment equivalent 10 buffer area index would be 60 percent, and a gravel or dirt road equivalent buffer area 11 index would be 0 percent. While full protection of filtration is site-specific, as noted in 12 subsection 4.4.1.2 (Evaluation of Alternatives), most erosion features that were identified 13 as delivering sediment, occurred within 30 feet of the stream. This indicates that 14 protection would only be modest if 200-foot buffers were needed to adequately filter 15 sediment for fish-bearing streams. If a 30-foot buffer was adequate to prevent most 16 overland flow of sediment, fish-bearing stream protection would be high. For non-fish-17 bearing streams (Type 4 and 5) potential filtration of overland sediment would be much 18 less than for fish-bearing streams. Filtration for either the 30- or 200-foot equivalent 19 buffer area index is nearly at the same level as that provided by clearcuts for non-fish-20 bearing, perennial or seasonal streams. This result would be expected due to a lack of 21 RMZs on non-fish-bearing streams under No Action Alternative 1-Scenario 2. Sediment 22 that enters non-fish-bearing streams would eventually enter fish-bearing streams, 23 although the rate of delivery may vary with stream conditions. So, the likelihood of 24 sediment not being filtered from non-fish-bearing streams is high for this alternative. 25
No Action Alternative 1-Scenario 1 and Alternatives 2 and 3 26 Note: The reviewer is reminded to consider the differences in effectiveness over time of 27 the adaptive management programs among this group of alternatives (No Action 28 Alternative 1-Scenario 1[low], Alternative 2 [high], Alternative 3 [moderate]) in 29 evaluating the effects discussed below (subsection 4.1.5, Adaptive Management). 30
Statewide. The no-harvest portion of RMZs of 50 feet (westside) or 30 feet (eastside) 31 would result in full protection (equivalent buffer area indexes of 100 percent) of sediment 32 filtration for fish-bearing streams on the west and eastsides. The addition of 50-foot 33 RMZs on many perennial, non-fish-bearing streams on both the west and eastsides (over 34 more than 50 percent of stream length) would maintain modest protections of 85 to 92 35 percent for the 30-foot equivalent buffer area index on the west and eastside, 36 respectively. The 200-foot equivalent buffer area index is much lower at 67 and 70 37 percent, for the west and eastside, respectively. Because of unstable slope protections that 38 include many Np and Ns streams, overall sediment filtration protection would be higher 39 than estimated by the equivalent buffer area indexes. The Np streams, because of 40 perennial flow, would be more likely to carry sediment downstream to fish-bearing 41 streams than the smaller seasonal streams, so protection of these streams may benefit 42 downstream fish-bearing streams. The seasonal Ns streams have equivalent buffer area 43
Riparian and Wetland Processes Draft EIS
4-152
Chapter 4 indexes of 80 percent for 30-foot, and 62 to 68 percent for 200-foot equivalent buffer area 1 index assessments. Considering that 30-foot buffers may be adequate to prevent most 2 overland sediment transport, these alternatives would supply much greater sediment 3 filtration protection than No Action Alternative 1-Scenario 2, although they would still be 4 low for many seasonal Ns non-fish-bearing streams. 5
Alternative 4 6 Statewide. Because of the large RMZs on all streams, Alternative 4 had the highest 7 estimated equivalent buffer area indexes. The sediment equivalent buffer area index for 8 all fish-bearing streams (30- or 200-foot assumptions) was estimated at 100 percent, 9 which was the same as No Action Alternative 1-Scenario 1 for the 30-foot buffer 10 assessment. But the largest differences between this and other alternatives would be in 11 non-fish-bearing streams, which had an equivalent buffer area index of 100 percent for 12 30-foot buffers in all areas; the range was about 91 percent for Np streams and 79 percent 13 of all Ns streams for 200-foot buffers. Considering that most overland sediment transport 14 is likely protected with a 30-foot buffer, these non-fish-bearing streams would likely be 15 fully protected under Alternative 4. 16
4.7.2 Wetlands 17 4.7.2.1 Wetlands Evaluation Criteria 18 The evaluation criteria for wetland resources includes an analysis of the degree of 19 protection provided by the Washington Forest Practices Rules for wetlands and their 20 associated functions (i.e., water quality, hydrology, and fish and wildlife habitat). 21 Provisions under the alternatives that are evaluated against the evaluation criteria include 22 timber harvest (application of protective buffers [Wetland Management Zones and 23 RMZs] and the degree of harvest or disturbance allowed in forested wetlands), road 24 management practices, and application of new wetland mapping and classification 25 systems. 26
Timber Harvest 27 Forested Wetlands 28 Timber harvest and associated activities can affect wetland sites by changing species 29 composition, reducing stand density and shading, changing fuel profiles, and altering 30 disturbance regimes (Castelle et al. 1992; Harris and Marshall 1963; Darnell 1976). 31 Timber harvest may alter wetland hydrology and cause a rise in the water table elevation 32 (Verry 1997). Changes in hydrologic patterns of wetland sites can directly influence 33 plant species and growth within the wetland site resulting in an increase in undesirable 34 plant species. Additionally, the altered water table and associated streamflow relationship 35 could increase localized runoff and flooding (Grigal and Brooks 1997). Soil rutting and 36 compaction from timber harvest activities can reduce infiltration, redirect flow, and alter 37 pathways by which water moves through and from wetlands. 38
Water quality of wetland sites can be affected by harvest activities (Shepard 1994). 39 Harvest and associated activities can deliver sediment to wetlands, diminish water 40
Draft EIS Riparian and Wetland Processes
4-153
Chapter 4 quality, and lead to the filling of wetland sites. Nutrient pathways within wetlands can 1 also be affected. 2
Alterations of forested wetland sites discussed above can impact microclimates within 3 wetland sites and can affect habitats of associated fish and wildlife species. Changes to 4 wetland hydrology may diminish suitable amphibian breeding, feeding, and rearing 5 habitat (Hruby et al. 1998). Reduced cover and changes in plant species composition can 6 influence invertebrate populations (Cyr and Downing 1988) and impact food sources, 7 den/nest sites for aquatic mammals, birds, and amphibians (Hruby et al. 1998). 8 Additionally, fish populations in waterways associated with harvested forested wetlands 9 may be affected by increased sedimentation and hydrologic and temperature alterations. 10
A method of reducing impacts to forested wetland sites is to implement reduced harvest 11 scenarios such as selective harvest, and to restrict equipment operation and yarding 12 practices in these areas. Residual vegetation left behind after reduced harvest and 13 associated activities would provide shading for wetland sites and act as a buffer to filter 14 out sediments and pollutants (Broderson 1973; Corbett and Lynch 1985). Effects on 15 wetland hydrology would be reduced in light harvest areas. As a result, impacts to fish 16 and wildlife would be reduced. 17
Non-Forested Wetlands 18 Non-forested wetland habitats would not be harvested due to the lack of commercial 19 timber within these areas. However, adjacent timber harvest may indirectly impact these 20 sites through increased sedimentation from upslope timber harvest activities and potential 21 reduction of shading from removal of adjacent trees. These disturbances could disrupt 22 nutrient pathways, affect water temperatures, and affect hydrology within these non-23 forested wetlands, causing short-term indirect effects on water quality, vegetation 24 composition, and microclimates. 25
A method of reducing impacts on wetlands from land management activities is to apply a 26 protective buffer (i.e., Wetland Management Zone) around wetland sites. Characteristics 27 of Wetland Management Zones, particularly slope and vegetative cover, directly 28 influence zone effectiveness. The effectiveness of removing sediments, nutrients, 29 bacteria, and other pollutants from surface water runoff increases with buffer width 30 (FEMAT 1993). Although Wetland Management Zone protection distances from 31 wetlands can vary markedly, depending upon site conditions, buffers of 100 feet or 32 greater have been found to control coarse and fine sediments if channelization in the 33 buffer zone does not occur (Broderson 1973; Corbett and Lynch 1985; Lynch et al. 34 1985). Additionally, buffers of at least 100 feet have been found to minimize water 35 temperature fluctuations (Lynch et al. 1985). To protect wetland values for wetland-36 associated wildlife species, slightly larger buffers, ranging from 200-300 feet, may be 37 needed (Washington Department of Wildlife 1992). 38
Wetland buffers (Wetland Management Zones) that are required under the alternatives 39 are described in Table 4.7-3. 40
41
Riparian and Wetland Processes Draft EIS
4-154
Chapter 4 Table 4.7-3. Wetland Management Zone (WMZ) Characteristics By Alternative. 1
Wetland Type
Size of Non-forested Wetland
(in acres)
No Action Alternative 1-Scenario 1 and Scenario 2,
Alternative 2, and Alternative 3 Average WMZ Width (feet)
Alternative 4 Average WMZ Width
(feet) A (including bogs) > 5 100 200 A (including bogs) 0.5 to 5 50 200 A (bogs only) 0.25 to 0.5 50 200 A (including bogs) < 0.25 No WMZ required No WMZ required B > 5 50 100 B .5 to 5 25 100 B 0.25 to 0.5 No WMZ required 100 B < 0.25 No WMZ required No WMZ required Forested No WMZ required, some
restrictions may apply Leave 70 percent canopy
closure, understory vegetation, snags, and
non-merchantable trees. Note: > means greater than; < means less than. 2 Source: Chapter 2, Subsection 2.3, Alternatives Analyzed in Detail. 3 4
Road and Landing Management 5 Road construction in wetland areas can directly impact wetland sites by permanently 6 removing or eliminating the biological functions (i.e., water quality, hydrology, and fish 7 and wildlife habitat) from the affected portion of the wetland (CH2M Hill 2000). 8 Additionally, crossing wetlands with roads, without adequate provision for cross-9 drainage, can lead to flooding on the upslope side and drainage changes on the 10 downslope side of crossings (Stoeckeler 1967; Boelter and Close 1974). Road and 11 landing construction and use can deliver sediment to wetlands, diminish water quality, 12 and lead to the filling of wetland sites. Nutrient pathways within wetlands can also be 13 affected (CH2M Hill 2000). 14
Avoidance of wetlands during road and landing layout is a primary method for 15 eliminating direct impacts to wetlands associated with road and landing establishment. 16 Where wetlands cannot be avoided, a method of offsetting impacts from road 17 construction includes the implementation of wetland replacement mitigation measures. 18 Mitigation ratios may vary depending upon the type, size, and health of an 19 affectedwetland site. Additionally, BMPs implemented during road and landing 20 construction and use can minimize associated impacts to wetland sites. Road 21 management options under the alternatives are outlined in Chapter 2 (Alternatives) 22 (Washington Forest Practices Board 2001a, Appendix F). 23
Wetland Classification System 24 Wetland ecosystems in the United States occur under a wide range of climatic, geologic, 25 geomorphic, and hydrologic conditions. This diversity of conditions makes the task of 26 assessing wetland functions difficult because not all wetlands perform functions in the 27 same manner, or to the same degree. Therefore, to simplify the assessment process, it is 28 useful to classify wetlands into groups that function similarly. Classification narrows the 29 focus of attention to: 1) the functions a particular type of wetland is most likely to 30
Draft EIS Riparian and Wetland Processes
4-155
Chapter 4 perform, and 2) the characteristics of the ecosystem and landscape that control these 1 functions. Classification provides a faster and more accurate assessment procedure, 2 thereby providing land managers a better tool for identifying and protecting wetlands, or 3 for mitigating for lost wetlands or wetland functions (water quality, hydrology, and fish 4 and wildlife habitat). 5
Current Washington DNR wetland classification and mapping is based on the National 6 Wetland Inventory (a.k.a. NWI) maps, which uses the Cowardin classification system 7 (Cowardin et al. 1979). Wetlands are mapped and classified based on size, vegetative 8 structure, and hydrology. A shortcoming of this classification system is that it does not 9 identify functional values of wetland sites. In contrast, hydrogeomorphic classifications 10 group wetlands on the basis of three fundamental characteristics: 1)geomorphic setting, 11 2) water source, and 3) hydrodynamics. At the highest level of the classification, 12 wetlands fall into one of five basic hydrogeomorphic classes including: 1) depressional, 13 2) slope-flat, 3) riverine, 4) fringe, and 5) extensive peatland. 14
A hydrogeomorphic classification can be applied at a regional level to narrow the focus 15 even further. The regions identified by Omernik (1987), Bailey (1994), or Bailey et al. 16 (1994) are based on climatic, geologic, physiographic, and other criteria and provide a 17 convenient starting point for applying the classification within a region. Any number of 18 regional hydrogeomorphic wetland subclasses can be identified based on landscape scale 19 factors such as geomorphic setting, water source, soil type, and vegetation. The number 20 of regional subclasses identified depends on the diversity of conditions in a region and on 21 assessment objectives. 22
A description of wetland mapping and classification provisions under the alternatives can 23 be found in Chapter 2 (subsection 2.3, Alternatives Analyzed in Detail). 24
4.7.2.2 Evaluation of Effects of Alternatives on Wetland Processes 25 The effects of the alternatives on wetlands are analyzed in this subsection. In reading this 26 analysis, it should be remembered from Chapter 2 (Alternatives) that under the No Action 27 Alternative no ITPs or ESA Section 4(d) take authorization would be issued. This lack of 28 action would likely affect the Forest Practices Regulatory Program in a way that is 29 difficult to predict. Therefore, two scenarios, which represent the endpoints of the 30 reasonable range of possible outcomes for the Forest Practices Regulatory Program, have 31 been defined (subsection 2.3.1, No Action Alternative 1 [(No Action]) to represent the 32 No-Action Alternative. The effects of No Action are displayed for both of these 33 endpoints in the following subsections, but the actual outcome and the actual effects of 34 No Action on wetlands are likely to fall between these two scenarios. 35
Timber Harvest 36 Forested Wetlands 37 Under all the alternatives, forested wetlands may be harvested with some restrictions 38 (Table 4.7-3). Harvest of forested areas on or adjacent to wetland sites would have the 39 greatest short-term impacts on these resources by changing species composition, reducing 40 stand density and shading, altering disturbance regimes, altering successional rates and 41
Riparian and Wetland Processes Draft EIS
4-156
Chapter 4 pathways, altering hydrologic regimes, increasing undesirable vegetation, and altering 1 nutrient/chemical cycles (Castelle et al. 1992; Harris and Marshall 1963; Darnell 1976). 2
The greatest restrictions (protection) for forested wetlands would occur under Alternative 3 4 since a minimum of 70 percent canopy closure along with understory vegetation, snags, 4 and non-merchantable timber would be retained. This harvest restriction associated with 5 Alternative 4 would lessen impacts to wetlands, particularly hydrologic alterations and 6 impacts on fish and wildlife habitat. Under No Action Alternative 1-Scenario 1, 7 Alternative 2, and Alternative 3, protection would be afforded to forested wetlands 8 associated with non-forested wetlands sites. Harvest of forested wetlands that are 9 surrounded by open water and emergent wetlands would require a plan approved in 10 writing by Washington DNR. Additionally, under No Action Alternative 1-Scenario 1 11 and Alternatives 2 and 3, forested seeps and springs with an obvious connection to Type 12 N perennial streams would be protected. 13
Wetland Management Zones and RMZs established under the alternatives would provide 14 varying levels of incidental protection to forested wetlands sites. Many Wetland 15 Management Zones and RMZs, which would be intended to protect non-forested 16 wetlands or riparian zones, overlap with forested wetlands and, in this way, would 17 provide incidental protection for forested wetlands as well. Reduced management could 18 occur in these Wetland Management Zones and RMZs to varying degrees (subsection 19 2.3, Alternatives Analyzed in Detail); however, impacts to hydrologic, water quality, and 20 fish and wildlife functions of incidentally protected wetlands would likely be reduced. 21
The greatest degree of incidental protection would occur under Alternative 4 where 52 22 percent of forested wetlands would be protected under established Wetland Management 23 Zones and RMZs followed by No Action Alternative 1-Scenario 1, Alternative 2 and 24 Alternative 3 (27 percent), and No Action Alternative 1-Scenario 2 (20 percent) (Table 25 4.7-4). The high degree of incidental wetland protection provided under the alternatives 26 would be mainly due to protection provided to riparian-associated wetlands through the 27 establishment or RMZs. Incidental protection would also occur to non-forested wetland 28 sites; however, because these sites are non-forested, no management activity in these 29 areas is anticipated. 30
Non-forested Wetlands 31 Under all alternatives, non-forested wetlands would be provided varying levels of 32 protection through the application of Wetland Management Zones. Wetland type and size 33 determine the widths of Wetland Management Zones and their application (Table 4.7-3). 34 The greatest level of protection to wetland sites would occur under Alternative 4 due to 35 greater widths of established Wetland Management Zones, and application of a Wetland 36 Management Zone for Type B wetlands between 0.25 and 0.5 acre (Table 4.7-3). Under 37 this alternative, all Type A non-forested wetlands greater than 0.25 acre would receive a 38 minimum average Wetland Management Zone of 200 feet, and all Type B wetlands 39 greater than 0.25 acre would receive a minimum average Wetland Management Zone of 40 100 feet. 41
Draft EIS Riparian and Wetland Processes
4-157
Chapter 4 Table 4.7-4. Percent of Forested Wetlands in Sample Sections Incidentally 1
Protected through Establishment of Wetland Management Zones 2 and RMZs. 3
Percent of Wetlands Protected by WMZs
Only
Percent of Wetlands Protected by RMZs
Only
Percent of Wetlands Protected by Both WMZs and RMZs
Percent Total
Incidental ProtectionAlternative
and Wetland Type
East-side
West-side
State-wide
East-side
West-side
State-wide
East-side
West-side
State-wide Statewide
No Action Alternative 1-Scenario 2
15 5 6 6 14 13 1 1 1 20
No Action Alternative 1-Scenario 1, Alternative 2, and Alternative 3
12 4 6 12 21 20 4 1 2 27
Alternative 4 13 9 10 27 35 34 20 7 8 52
Source: These estimates are based on an evaluation of wetlands and RMZs on sample sections 4 conducted for the Forest Practices Alternatives SEPA EIS (Washington Forest Practices 5 Board 2001a, Appendix G). 6
No Action Alternative 1-Scenario 1 and Scenario 2, Alternative 2, and Alternative 3 7 would provide similar levels of protection to non-forested wetland sites (Table 4.7-3). 8
As stated earlier, although site-specific characteristics of wetland sites dictate Wetland 9 Management Zone requirements, in general, a protective Wetland Management Zone 10 width of 100 feet or greater has been found to provide protection to wetland sites from 11 hydrologic and water quality impacts including sedimentation and temperature alteration 12 and water table fluctuations. Larger Wetland Management Zones may be required to 13 provide protection to habitat for fish and wildlife species associated with wetland sites. 14 Therefore, using this rationale, Alternative 4 would provide the greatest level of 15 protection by providing Wetland Management Zones of 100 feet or greater to areas of 16 Type A and B wetlands. Additionally, unlike Alternatives 1, 2, and 3, Alternative 4 17 would provide a Wetland Management Zone for Type B wetlands between 0.25 and 0.5 18 acre (Tables 4.7-3). No Action Alternative 1-Scenario 2 and Alternative 2 would provide 19 less protection to non-forested wetland sites due to reduced Wetland Management Zone 20 widths and Wetland Management Zone applications. 21
Management may also occur within established Wetland Management Zones under all 22 the alternatives. Management activities within these Wetland Management Zones can 23 reduce the functional value of the Wetland Management Zones. Additionally, timber 24 harvest may indirectly impact wetlands through increased sedimentation from upslope 25 timber harvest activities and potential reduction of shading from removal of adjacent 26 trees. These disturbances can disrupt nutrient pathways within these wetland sites causing 27 short-term indirect effects on water quality, vegetation composition, and fish and wildlife. 28 Additionally, harvest of adjacent areas could initially increase water tables in harvested 29
Riparian and Wetland Processes Draft EIS
4-158
Chapter 4 areas due to reduced transpiration from tree removal. However, if the Wetland 1 Management Zone is revegetated quickly, impacts may be reduced. Consequently, long-2 term effects are expected to be minor. Additionally, some areas of the Wetland 3 Management Zones are provided incidental protection by the establishment of RMZs. 4 Prescriptions within RMZs are dependent upon water types and other site conditions. 5
Table 4.7-5 presents an estimate of the percent of Wetland Management Zones that 6 overlap with RMZs, under each of the alternatives. Under Alternative 4 approximately 43 7 percent of Wetland Management Zones overlap established RMZs and, therefore, would 8 be provided a high degree of incidental protection (Table 4.7-5). Under No Action 9 Alternative 1-Scenario 1, Alternative 2, and Alternative 3, approximately 27 percent 10 would occur within RMZs. Under No Action Alternative 1-Scenario 2 approximately 15 11 percent would occur within RMZs. These Wetland Management Zones would be 12 expected to receive fewer disturbances due to their inclusion in RMZs although the level 13 of incidental protection in these areas would be dependent upon the specific prescriptions 14 of the RMZs and location of the Wetland Management Zones in relation to the RMZs 15 (i.e., core zone, inner zone, or outer zone of the RMZ). 16
Road Management 17 As stated earlier, road construction and use may have the greatest direct impact on 18 wetland sites by permanently removing portions of the affected wetland from the 19 landscape. Further, roads that cross wetlands without adequate provision for cross-20 drainage can lead to hydrologic changes (Stoeckeler 1967; Boelter and Close 1974). 21 Additionally, sedimentation from road construction and use has been found to indirectly 22 impact wetland ecosystems (Stoeckeler 1967; Boelter and Close 1974). To offset impacts 23 to wetland sites from these actions, BMPs and wetland replacement mitigation is 24 proposed under the alternatives. 25
Under No Action Alternative 1-Scenario 2 wetlands would be avoided during road and 26 landing construction. If wetlands could not be avoided, impacts would be reduced by 27 minimizing subgrade width and spoil areas. Applications that propose to fill or drain 28 more than 0.5 acre of an individual wetland (Class IV-special) would require an accurate 29 wetland delineation and replacement of the lost wetland functions. This would be 30
Table 4.7-5. Percent of Wetland Management Zones in Sample Sections on 31 Forestlands Incidentally Protected through the Establishment of 32 RMZs Under the Alternatives. 33
Alternative Percent of WMZ within RMZ (%) No Action Alternative 1-Scenario 2 15 No Action Alternative 1-Scenario 1, Alternatives 2, and Alternative 3
27
Alternative 4 43 Source: These estimates are based on an evaluation of wetlands and RMZs on sample sections 34
conducted for the Forest Practices Alternatives SEPA EIS (Washington Forest Practices 35 Board 2001a, Appendix G). 36
Draft EIS Riparian and Wetland Processes
4-159
Chapter 4 accomplished by replacing the lost wetland functions by enhancement of existing 1 wetlands or creation of new wetlands, generally on an acre-for-acre basis and of the same 2 type and in the same general location. 3
No Action Alternative 1-Scenario 1 and Alternatives 2, 3, and 4 would contain the most 4 stringent protection/mitigation measures by implementing a policy of no net loss of 5 wetland functions following road and landing construction. Under these alternatives, 6 roads could not be constructed in bogs or fens or in wetlands if substantial loss or damage 7 to wetland functions or acreage would occur. Additionally, accurate wetland delineations 8 must be performed if road or landing construction would fill or drain more than one-tenth 9 of an acre of wetland, which would better quantify wetland impacts than No Action 10 Alternative 1-Scenario 2. Filling or draining more than 0.5 acre of a wetland would be 11 classified as a Class IV-special action and would require replacement by substitution or 12 enhancement of the lost wetland functions, generally on a two-for-one basis of the same 13 type and in the same general location. Additionally, sediment deposition to wetland sites 14 would likely be reduced (compared to No Action Alternative 1-Scenario 2) during road 15 and landing construction and use due to the implementation of new BMPs (Washington 16 Forest Practices Board 2001a, Appendix F). 17
Classification System and Wetland Mapping 18 As described earlier, the current wetland classification and mapping system (No Action 19 Alternative 1-Scenario 2) used by Washington DNR is based on the National Wetland 20 Inventory system. This wetland classification system does not identify functions of 21 wetland types within the affected landscape, and therefore, is a less effective tool for 22 evaluating wetland impacts or for developing protection or mitigation measures. 23
Under Alternative 4, a new wetland classification system, likely hydrogeomorphic, would 24 be adopted. A hydrogeomorphic system could provide additional protection to wetland 25 areas by identifying functions of wetland types within the landscape, thereby providing a 26 mechanism for implementing appropriate protection measures. This system could provide 27 a tool for comparing project alternatives and pre- and post-project conditions for 28 determining impacts. Additionally, it could compare mitigation success to provide 29 guidance for avoiding and minimizing project impacts and to determine mitigation 30 requirements. 31
Under No Action Alternative 1-Scenario 1 and Alternatives 2 and 3, landowners would 32 be required to perform additional wetland mapping procedures (Chapter 2, Alternatives) 33 (Washington Forest Practices Board 2001a, Appendix G). The Washington DNR would 34 incorporate the mapped wetlands into a GIS layer. This increased mapping effort would 35 enhance the ability to apply wetland protection measures outlined in the Washington 36 Forest Practices Rules. 37
Summary of Alternatives 38 Overall, Alternative 4 would provide the highest level of protection for wetland resources 39 due to Wetland Management Zone and RMZ widths and the level of forested wetland 40 protection. For road and landing construction, No Action Alternative 1-Scenario 1 and 41
Riparian and Wetland Processes Draft EIS
4-160
Chapter 4 Alternatives 2, 3, and 4 would provide greater protection to wetlands than No Action 1 Alternative 1-Scenario 2 by implementing a policy of no net loss of wetland functions, 2 outlining higher replacement mitigation ratios for wetlands (of 0.5 acre in size) that are 3 filled or drained, and avoiding roads and landings in bogs and fens. Additionally, No 4 Action Alternative 1-Scenario 1 and Alternatives 2, 3, and 4 would require accurate 5 delineation of wetlands where impacts to wetlands would be 0.1 acre or more. These 6 alternatives would also reduce potential sedimentation of wetland sites through the 7 application of new BMPs. 8
Alternative 4 would mandate the adoption of a new classification system that would 9 incorporate the evaluation of wetland functions, thus providing a better tool for 10 evaluating wetland impacts and designing wetland protection and mitigation measures. 11 No Action Alternative 1-Scenario 1 and Alternatives 2 and 3 would provide more 12 protection than No Action Alternative 1-Scenario 2 because these alternatives would 13 mandate the mapping of select wetland types and would incorporate these into a 14 Washington DNR GIS database that would provide data for wetland evaluation and 15 protection measure development. 16
To some extent, wetland functions (i.e., hydrology, water quality, and fish and wildlife 17 habitat) would be allowed to be reduced under all the alternatives since forested wetlands 18 may be harvested; however, wetland impacts under Alternative 4 would be expected to be 19 less due to the 70 percent canopy retention in forested wetlands. Non-forested wetlands 20 receiving a Wetland Management Zone of less than 100 feet may be impacted by 21 adjacent timber harvest. However, these functions would likely be reduced for the short-22 term if the wetland sites or Wetland Management Zones become revegetated. All of the 23 alternatives would contain provisions for mitigating wetland loss due to road and landing 24 construction. However, “no net loss” of wetlands or wetland functions due to road or 25 landing construction would be anticipated only under No Action Alternative 1-Scenario 1 26 and Alternatives 2, 3, and 4. 27
28
Draft EIS Fish and Fish Habitat
4-161
Chapter 4
4.8 FISH AND FISH HABITAT 1
4.8.1 Introduction 2 The Washington Forest Practices Rules are designed to protect public resources while 3 maintaining an economically viable commercial forest industry (Washington Forest 4 Practices Board 2001c, 2002). Public resource protection includes maintaining aquatic 5 habitat and fish populations at levels that comply with the ESA. Evaluation of the 6 potential effects of the alternatives on fish and aquatic habitat was based on two factors: 7
• Management approaches under each alternative in riparian and upslope areas. 8 • Habitat needs and biological requirements of listed and covered fish species. 9
This analysis addresses the effects on all species (subsection 3.8, Fish and Fish Habitat). 10 Salmonids are emphasized in the analysis because: 1) they include all species listed as 11 federally threatened or endangered in the analysis area, 2) they are covered species in the 12 FPHCP, 3) they are present within covered lands, and 4) they are typically most sensitive 13 to forest practices impacts and, therefore, determination of the relative effects of 14 alternatives on the habitats of these species should be a conservative indicator of effects 15 on other covered species. Also, the evaluation criteria primarily relate to the maintenance 16 or improvement of aquatic ecosystems, which is beneficial for all aquatic species. 17 Deviations from this general approach are noted. 18
Aquatic habitat in the planning area is extensive and complex. Current freshwater habitat 19 conditions in many areas do not meet requirements for covered fish species. For 20 example, at certain times of the year (e.g., during late summer), water temperatures in 21 some streams exceed levels suitable for salmonid species (MacDonald et al. 1991). This 22 is often associated with lack of streamside vegetation to provide shading. Reduced shade 23 can increase water temperature, but it can also be influenced by other factors such as 24 weather conditions, air temperatures, elevation, water withdrawals, and groundwater 25 inflow (Adams and Sullivan 1989; Beschta 1997a; Beschta et al. 1987). 26
The nearshore marine and estuary conditions in Washington State have been severely 27 modified. Many freshwater fish species rear or pass through these areas during their life 28 cycle (subsection 3.8, Fish and Fish Habitat). Approximately, 39 percent of coastal 29 wetlands and 70 percent of Puget Sound emergent wetlands have been lost due to human 30 development (Palmisano et al. 1993). All of the major estuaries in Puget Sound, except 31 the Nisqually River, have undergone major modification including dredging, diking, and 32 filling, which has reduced the quantity and quality of rearing habitat for many species 33 including many salmonids (DEIS Appendix A). Other estuaries along the coast and 34 Columbia River have also had substantial modifications. 35
In a broad sense, management approaches under each alternative are expected to affect 36 aquatic habitat and nearshore marine conditions in similar ways. However, the 37 magnitude of the effects may be different depending upon site-specific conditions. For 38 example, conditions in some areas may be at or near levels that would support healthy 39 populations of covered fish species, and a change in management approach might not 40
Fish and Fish Habitat Draft EIS
4-162
Chapter 4 appreciably change those conditions. This is particularly true for regions of the State that 1 do not have much State or commercial forestlands or that lack covered species for 2 reasons unrelated to forest practices. In contrast, conditions in water quality limited 3 streams may be less capable of fully supporting populations of covered fish species, and 4 management changes could substantially change those conditions. 5
Predicting aquatic habitat conditions under a specific alternative is difficult, particularly 6 if predictions are long term and could include significant changes in the Washington 7 Forest Practices Rules resulting from adaptive management. To varying degrees, 8 adaptive management is incorporated under all alternatives (subsection 4.1.5, Adaptive 9 Management). The reason for this difficulty is the complex and dynamic nature of the 10 aquatic systems and their surrounding terrestrial environments. 11
Trends in aquatic habitat conditions also involve temporal considerations. For example, 12 many covered fish species such as most salmon and trout, have a relatively short life 13 cycle (usually less than 6 years). In areas where habitat is degraded, habitat restoration 14 would only begin to take effect after a longer period (greater than 10 years). Therefore, 15 specific populations of fish species may encounter less than desirable habitat conditions 16 before any management measures become effective. However, an improvement in any 17 factor that limits aquatic habitat during the short term (e.g., a reduction in stream 18 temperatures) should establish a trend toward more favorable conditions for maintaining 19 or recovering fish species. 20
When predictions cannot be precisely made, as is the situation when applying any of the 21 alternatives to the planning area, monitoring is often required to determine if a trend 22 toward favorable or target conditions is occurring and the strength of that trend. For 23 example, monitoring of water temperature at various locations over a number of years 24 would provide the information needed to determine if a trend toward lower summer 25 temperatures is correlated with growth of streamside vegetation. 26
Evaluation of the environmental consequences for aquatic resources focused on the 27 strength of the trends that management conditions would have in achieving target 28 conditions under each alternative. A strong trend in changes leading to attainment of 29 target conditions would indicate that maintaining or restoring fish populations is more 30 probable than under weaker trends. Even with conditions meeting requirements for a 31 properly functioning aquatic system, however, no certainty exists that current populations 32 would be maintained or recover because of off-site factors (e.g., ocean conditions, 33 harvest, and non-forestland use practices). 34
For any particular alternative, predicting population numbers for any salmon species is 35 difficult. It is also difficult to predict the degree to which other factors (e.g., ocean 36 conditions, predation, disease, harvest, or competition) affect populations. Therefore, the 37 assessment of potential effects focuses on habitat requirements. If habitat is properly 38 functioning, then other factors need to be assessed to determine why Pacific salmon and 39 other salmonid species may either be depressed or at risk of extinction. 40
Draft EIS Fish and Fish Habitat
4-163
Chapter 4 Full protection across a landscape may not be necessary to maintain a properly 1 functioning aquatic system and to safeguard fish species or populations. A point exists 2 beyond which, for example, the width of an RMZ would not provide additional benefit 3 from an aquatic habitat standpoint. For instance, stream buffers greater than about 0.75 4 site potential tree height on most streams would not provide additional shade to maintain 5 or recover stream temperatures (subsection 4.7.1, Riparian Processes). Less than full 6 protection can achieve target conditions because it is the complete set of protection 7 measures (both riparian and upland) that must be considered. In addition, forest practices 8 often occur within a mosaic of other land uses that provide different levels of protection. 9 For example, private or State timberlands can be adjacent to National Forest lands that 10 are managed to meet different goals under the Northwest Forest Plan (USDA Forest 11 Service and USDI Bureau of Land Management 1994). Prescriptions that provide 12 substantial LWD, detrital input, shade, coarse and fine sediment control, and streambank 13 stability, for example, can set a trend toward achieving target conditions and a properly 14 functioning aquatic system. 15
This subsection relies on the conclusions of several other subsections. This is because 16 the threshold of significance for fish and aquatic habitat must consider the effects of an 17 aggregate of management prescriptions under each alternative. For example, the amount 18 of LWD that is recruited to a stream is determined by RMZ width and the number of 19 trees retained within the zone (subsection 4.7.1, Riparian Processes). Similarly, changes 20 in erosion and sediment from upslope areas or from roads also directly affect aquatic 21 habitat conditions (subsection 4.4, Geology, Soils, and Erosional Processes, and 22 subsection 4.7.1, Riparian Processes). Evaluation criteria for measuring effects from 23 riparian and upslope management are identified below in subsection 4.8.2 (Evaluation 24 Criteria). 25
The following subsection (subsection 4.8.2, Evaluation Criteria) evaluates these 26 individual criteria and aggregates their overall effects on the aquatic system to determine 27 if an individual alternative is likely to achieve target conditions (i.e., properly functioning 28 aquatic system) and does not threaten individual fish species or fish populations. The 29 concluding subsection (subsection 4.8.4, Synthesis by Region) places lands regulated 30 under the Washington Forest Practices Rules in perspective with other practices that 31 affect the viability of Pacific salmon, trout, and other fish species. 32
4.8.2 Evaluation Criteria 33 Issues relevant to fish resources were identified during the scoping process described in 34 Chapter 1 (Purpose and Need). The issues were categorized according to the NMFS 35 matrix of pathways and indicators of a properly functioning aquatic ecosystem (NMFS 36 1996a); the pathways and indicators are relevant to most anadromous and non-37 anadromous fish species. A few special habitats were added to this matrix, including 38 lakes, reservoirs, and nearshore marine habitat. These areas provide important habitat for 39 fish that were not directly assessed in the NMFS matrix (which was primarily directed at 40
41
Fish and Fish Habitat Draft EIS
4-164
Chapter 4 watershed activities away from marine or lake environments). The issue categories 1 evaluated here includes the following: 2
• Coarse sediment 3 • Fine sediment 4 • Hydrology 5 • Large woody debris 6 • Leaf/needle litter recruitment 7 • Floodplains, off-channel areas, and the hyporheic zones 8 • Lakes, reservoirs, and nearshore marine areas 9 • Water temperature 10 • Dissolved oxygen 11 • Forest chemicals 12 • Fish passage 13
Evaluation criteria were identified for each of the issues and are used to compare and 14 contrast the likely effects of implementing each of the alternatives. As described earlier, 15 the measures used in this subsection are drawn primarily from analyses described in other 16 subsections of this document and from DEIS Appendix A, Regional Summaries, which 17 include details on current conditions by region. The goal of this chapter section is to 18 synthesize and examine these measures and others as they relate to covered fish species 19 and a properly functioning aquatic ecosystem. The following is a brief description of the 20 issues and their measures and criteria. Most of the descriptions will refer the reader to 21 previous subsections where more complete descriptions have been provided. 22
4.8.2.1 Coarse Sediment 23 Coarse sediment (particles typically larger than sand) affects the amount of spawning 24 habitat, pool filling, bank stability, and stream hydrology (Spence et al. 1996) (subsection 25 3.8.3.1, Fine Sediment). The four alternatives address management-related coarse 26 sediment inputs by preventing or minimizing accelerated coarse sediment production 27 from mass wasting and reducing coarse sediment production from roads and culvert 28 failures. 29
The effects of the alternatives on coarse sediment production from mass wasting and 30 roads were evaluated in subsection 4.4 (Geology, Soils, and Erosional Processes). Mass 31 wasting was evaluated by comparing the strategies used in defining and detecting 32 unstable slopes and landforms during the forest practices application review process and 33 by comparing the measures used in avoiding and mitigating management-related mass 34 wasting. Coarse sediment production from roads was analyzed by qualitative evaluation 35 of road management practices under the alternatives. 36
4.8.2.2 Fine Sediment 37 High levels of fine sediment in streams can be detrimental to the survival of eggs and fry 38 incubating in redds (Iwamoto et al. 1978; Chapman 1988; Chapman and McLeod 1987; 39
Draft EIS Fish and Fish Habitat
4-165
Chapter 4 Gregory and Bisson 1997). Sources of fine sediment include hillslope erosion, surface 1 erosion from roads, streambanks, mass wasting, and culvert failure (Furniss et al. 1991; 2 Chamberlin et al. 1991; Swanson et al. 1987). Vegetation in RMZs provides filtering of 3 fine sediments from upslope areas and stability to streambanks. Overbank sediments are 4 trapped by roughness elements such as vegetation and downed woody debris (Johnson 5 and Ryba 1992; FEMAT 1993; Belt et al. 1992; Gregory et al. 1991). 6
The effect of the alternatives on hillslope erosion and bank stability was evaluated in 7 subsection 4.4 (Geology, Soils, and Erosional Processes). Hillslope erosion was 8 evaluated by comparing the percent of riparian vegetation that is protected under the 9 different management prescriptions for the different stream types and regions using the 10 sediment equivalent buffer area index. The bank stability evaluation was based upon the 11 percentage of the riparian area that is protected by different management prescriptions. 12
Improperly constructed and maintained forest roads can also be an important source of 13 fine sediment (Furniss et al. 1991; Chamberlin et al 1991; Spence et al. 1996). 14 Furthermore, stream crossings can be the location of direct delivery of fine sediment to 15 streams (Furniss et al. 1991; Swanson et al. 1987). Numerous factors can affect the 16 production and delivery of fine sediment from roads including the number of road miles, 17 the construction materials, road drainage structures, the level of use and maintenance, and 18 the number of stream crossings (subsection 4.4, Geology, Soils, and Erosional Processes) 19 (Furniss et al. 1991; Swanson et al. 1987). 20
4.8.2.3 Hydrology 21 The amount of timber harvest in a watershed and the forest road density can affect the 22 hydrologic regime of a stream. Particularly in rain-on-snow regions, immature forest 23 stands and high road densities can result in higher frequency and higher magnitude peak 24 flows (Spence et al 1996; Chamberlin et al. 1991). This issue was evaluated for the 25 alternatives in subsection 4.5.2 (Surface Water Quantity) by considering the effect of the 26 alternatives on the percentage of a watershed that can be harvested and on limiting road 27 densities. 28
4.8.2.4 Large Woody Debris 29 LWD is one of the most important components of high quality fish habitat affecting 30 nutrients, food, cover, and channel morphology (Dolloff and Warren 2003; Zalewski and 31 Lapinska 2003; Bilby and Bisson 1998; Spence et al. 1996; Beechie and Sibley 1997; 32 Gregory et al. 1991). The effects of the alternatives on LWD recruitment have been 33 evaluated previously in the Riparian Processes subsection (subsection 4.7.1) using the 34 LWD equivalent buffer area index as a comparative tool. 35
4.8.2.5 Leaf/Needle Litter Recruitment 36 Harvest within or near riparian zones can affect the recruitment of leaf and needle litter, 37 an important nutrient source for forested streams (Bilby and Bisson 1992). Effects of the 38 alternatives on leaf and needle litter recruitment have been evaluated previously in the 39 Riparian Processes subsection (subsection 4.7.1) using 0.5 site potential tree height as a 40 criterion for protecting most leaf and needle litter inputs to streams. 41
Fish and Fish Habitat Draft EIS
4-166
Chapter 4 4.8.2.6 Floodplains, Off-channel Areas, and the Hyporheic Zone 1 Floodplains and off-channel areas are an important component of aquatic habitat and 2 include side channels, backwater alcoves, ponds, and wetlands. These areas are often 3 associated with significant hyporheic zones, as they commonly occur with alluvial 4 conditions that are often found in floodplains and off-channel areas (Edwards 1998; 5 Naiman et al. 2000). Hyporheic zones are the saturated sediment region under and along 6 streams. As noted in subsection 3.8.4.6 (Floodplains, Off-channel Habitats, and 7 Hyporheic Zones), hyporheic zones often connect between groundwater and surface 8 water and often supply important habitat for hyporheic organisms such as insects, 9 bacteria, and fungi (Edwards 1998; Naiman et al. 2000). The effects of the alternatives 10 on floodplain and off-channel areas were evaluated in the subsection 4.4 (Geology, Soils, 11 and Erosional Processes), and, in the case of the hyporheic zone, in subsection 4.5.3.2 12 (Groundwater). Evaluations were based upon a qualitative analysis of the different 13 prescriptive features of the alternatives. 14
4.8.2.7 Lakes, Reservoirs, and Nearshore Marine Areas 15 Lakes, reservoirs, and nearshore marine areas have some common features that need to 16 be maintained to ensure protection of native anadromous and freshwater fishes. Lakes 17 and reservoirs supply rearing, spawning, and migratory habitat for many fishes, while 18 nearshore marine areas are primarily of importance as habitat for juvenile salmonids and 19 baitfish (Wydoski and Whitney 2003; Groot and Margolis 1991; Emmett et al. 1991). 20 The shallow water regions of all these areas may include rearing habitat for juvenile 21 species and, in some cases, spawning (e.g., for kokanee or sockeye in some lakes) 22 (subsection 3.8.2, Life History of Affected Species; FPHCP Chapter 3). 23
The recruitment of LWD to all these areas contributes organic input to the system but 24 also influences the development of habitat structure for potential fish rearing habitat. The 25 rate and type of sediment accumulation in the shallows also influences habitat, foodwebs, 26 and production (Simenstad et al. 1979). The maintenance of estuarine habitat through 27 sediment and LWD inputs is important. For example, Collins et al. (2002) reported that 28 large wood jams in major Puget Sound estuaries historically influenced intertidal channel 29 formation, pool depth, and sediment distribution. Also, excessive sedimentation in 30 lakeshores has been found to adversely affect spawning sockeye salmon (McHenry et al. 31 1996). The criteria used to evaluate the effects of the alternatives on these areas is the 32 degree to which each alternative protects LWD recruitment, especially in the larger fish-33 bearing streams and lake shores, and how well each controls sediment input. 34
4.8.2.8 Water Temperature 35 As described in subsection 3.8.1 (Fish and Fish Habitat, Introduction), Pacific salmon and 36 trout require cool, clean water to thrive (subsection 3.8.2, Life History of Affected 37 Species) (Washington Department of Ecology 2002a; Bjornn and Reiser 1991). Stream 38 shade is important in regulating stream temperatures (subsection 4.5.1, Surface Water 39 Quality). The effect of the alternatives on shade levels has been evaluated in the Riparian 40 Processes subsection (subsection 4.7.1.2) by comparing the retention of riparian 41
Draft EIS Fish and Fish Habitat
4-167
Chapter 4 vegetation under the different management prescriptions for the different stream types 1 and regions. 2
4.8.2.9 Forest Chemicals 3 Presence of pesticides used to control undesirable plants, insects, and fungi may also 4 affect fish production and water quality (Spence et al. 1996). Pesticide use is an important 5 management tool for speeding reforestation by reducing competition and disease. 6 Pesticide use under each alternative is described and evaluated in subsection 4.5.1 7 (Surface Water Quality) and subsection 4.5.3 (Groundwater). For evaluation of this 8 water quality component, minimum buffer widths along surface waters were used as the 9 evaluation criterion (Note: The reader is reminded that forest chemical activities are not 10 included as a proposed covered activity in the State’s application for incidental take 11 authorization). 12
4.8.2.10 Dissolved Oxygen 13 High and consistent dissolved oxygen levels are critical for all life stages of salmon and 14 trout (Spence et al. 1996). Acceptable dissolved oxygen levels vary by life stage, but one 15 of the most critical areas for maintaining dissolved oxygen levels is in the stream gravels 16 during egg deposition and intergravel development and growth of alevins and fry. 17 Generally, higher levels in the water column are needed to ensure adequate levels are 18 present in the gravel for egg and alevin development (Hicks 2002). Factors reducing 19 dissolved oxygen concentration include increased sediment deposition (for intergravel 20 concentrations), increased stream temperature, and substantially increased nutrient levels 21 or high amounts of easily decaying organic debris (Welch et al. 1998; Spence et al. 22 1996). Alternatives that maintain these parameters at low or acceptable levels would 23 most likely maintain adequate dissolved oxygen levels. Evaluation of the alternatives 24 was tied to likelihood of increased fine sediment inputs and stream temperatures. 25
4.8.2.11 Fish Passage 26 Barriers to fish passage from road crossings affect the ability of fish to access available 27 habitat (U.S. General Accounting Office 2001; Furniss 1991; Palmisano et al. 1993). 28 Historical road building under much less protective forest practices rules is thought to 29 have led to many fish barriers and associated habitat loss. Current fish distribution is 30 generally recognized to be more limited than historical distribution. Criteria for 31 construction of stream crossing structures are currently based, in part, on whether a 32 stream is fish-bearing (WAC 222-24-040). For example, culverts must have a minimum 33 diameter of 24 inches for streams with anadromous fish and a minimum diameter of 18 34 inches for streams with resident game fish. Therefore, the assumptions made in 35 determining if a stream is fish-bearing are critical for the construction of new stream 36 crossings and for evaluating whether existing stream crossings meet current Washington 37 Forest Practices Rules. 38
Fish passage also can be affected by stream flow, water temperature, and suspended and 39 bedload sediment delivery and routing through streams (subsection 3.8.4.10, Fish 40 Passage). However, these effects are temporally and spatially difficult to assess as 41 affected by forest practices. 42
Fish and Fish Habitat Draft EIS
4-168
Chapter 4 Evaluation of the potential effects of the alternatives on fish passage will be based 1 primarily on how the rules modify stream typing assumptions and the effect this will have 2 on new stream crossing construction and treatment of existing structures. The measure to 3 be utilized will be the proportion of stream miles that are considered fish-bearing versus 4 non-fish-bearing stream miles. In addition, a qualitative comparison will be made of 5 alternative programs for decommissioning and maintaining roads and replacing problem 6 culverts. 7
4.8.3 Evaluation of Alternatives 8 As with the other resources, expected effects on fish and their habitats can most readily 9 be compared if the alternatives are discussed in three distinct alternative groups since the 10 most pronounced differences are based on management of riparian buffers, which do not 11 vary among all alternatives. The three groups are: 1) No Action Alternative 1-Scenario 12 2; 2) No Action Alternative 1-Scenario 1, Alternative 2, and Alternative 3; and 3) 13 Alternative 4. This subsection presents a synthesis of the results of the alternative 14 evaluations for each issue as they relate to the fish resource. The effects of the 15 alternatives on the 11 fish and fish habitat issues identified above, are analyzed in this 16 subsection. 17
In reading this analysis, it should be remembered from Chapter 2 (Alternatives) that 18 under the No Action Alternative no ITPs or ESA Section 4(d) take authorization would 19 be issued. However, this lack of action would likely affect the Forest Practices 20 Regulatory Program in a way that is difficult to predict. Therefore, two scenarios, which 21 represent the endpoints of the reasonable range of possible outcomes for the Forest 22 Practices Regulatory Program, have been defined (subsection 2.3.1, No Action 23 Alternative 1) to represent the No-Action Alternative. The effects of No Action are 24 displayed for both of these endpoints in the following subsections, but the actual outcome 25 and the actual effects of No Action on each of these issues are likely to fall between these 26 two scenarios. With respect to Alternative 4, the level of resource protection provided 27 depends on the rate at which landowners convert forestland to other uses. These other 28 uses would most likely result in negative impacts to fish and their habitat. However, the 29 following discussion of impacts on fish and their habitat resulting under Alternative 4 30 focuses on the benefits to fish from more protective Forest Practices Rules, because the 31 rate of forestland conversion is difficult to predict. 32
4.8.3.1 Coarse Sediment 33 Overview of Effects 34 The effects of the alternatives on coarse sediment delivery are analyzed in this 35 subsection. It is important to note that, from an historical perspective, coarse sediment 36 delivery to streams has been substantially reduced over time because of improvements in 37 road construction methods, the frequency of maintenance, and the implementation of 38 BMPs (subsection 3.4.2.3, History of Forest Practices Affecting Erosion and 39 Sedimentation). Therefore, compared to baseline conditions, coarse sediment delivery 40 and the resulting effects on fish habitat is not expected to increase under any of the 41 alternatives, although the rate of reduction would vary substantially. The following 42
Draft EIS Fish and Fish Habitat
4-169
Chapter 4 paragraphs address the degree to which each alternative would affect coarse sediment 1 delivery. 2
No Action Alternative 1-Scenario 2 would result in a moderate likelihood of coarse 3 sediment delivery from harvest and road-related mass wasting events. The likelihood 4 would be somewhat reduced where Watershed Analysis occurs due to the development of 5 management prescriptions that address coarse sediment inputs. Relative to the other 6 alternatives, No Action Alternative 1-Scenario 2 would have the highest rate of coarse 7 sediment input. 8
No Action Alternative 1-Scenario 1 and Alternatives 2 and 3, would all result in a low to 9 moderate likelihood of coarse sediment delivery due to wider buffers and improved 10 harvest and road maintenance practices relative to No Action Alternative 1-Scenario 2. 11 However, existing roads would have a moderate likelihood of coarse sediment delivery in 12 the short term since RMAP implementation would not be complete until 2016. Higher 13 levels of protection would result in less streambed aggradations resulting from forest 14 practices and a reduction in the likelihood of habitat degradation from pool filling and 15 modified channel capacity. 16
The likelihood of coarse sediment delivery would be low for Alternative 4, because it 17 includes extensive no-harvest buffers, an accelerated schedule for implementing RMAPs, 18 and no net increase in road densities. Relative to all other alternatives, Alternative 4 19 would have the lowest rate of coarse sediment input. A detailed analysis of the 20 alternatives is presented in the following subsection. 21
Detailed Effects Analysis 22 Coarse sediment delivery to streams primarily originates from two sources: 1) mass 23 wasting and 2) streambank erosion (Spence et al. 1996; Swanston 1991). Mass wasting 24 can deliver large, but infrequent inputs of coarse and fine sediment to streams (Swanston 25 1991; Swanson et al. 1987). In contrast, streambank erosion can be a chronic problem 26 resulting from changes in riparian root-strength and/or hydrology (Swanston 1991; 27 FEMAT 1993; Montgomery and Wohl 2004). Mass wasting is a natural phenomenon 28 that occurs in watersheds without any major land-use activities. Both mass wasting 29 (including debris flows) and streambank erosion are natural processes and can be 30 important sources of coarse sediment and LWD to streams (Swanston 1991; Reeves et al. 31 2003; Benda et al. 2003; Swanson et al. 1987). However, forest practices have been 32 shown to increase the frequency of mass wasting and the level of streambank erosion. 33
The two main management-related factors that contribute to increased mass wasting and 34 streambank erosion are timber harvest and roads (Swanston et al. 1987; Chamberlin et al. 35 1991; Furniss et al. 1991; Spence et al. 1996). Timber harvest on unstable slopes can 36 increase the potential for mass wasting by reducing tree root strength that helps maintain 37 soil cohesion. Forest roads can increase mass wasting by reducing the structural strength 38 of soil materials, concentrating water drainage in high hazard areas, and creating 39 conditions that result in culvert failures. Because the initiation point of road-related mass 40 wasting can occur at stream crossings, adverse effects to streams from a large quantity of 41
Fish and Fish Habitat Draft EIS
4-170
Chapter 4 sediment and debris over a short period is often more severe than hillslope mass wasting 1 that does not directly enter streams, or only does so gradually. 2
No Action Alternative 1-Scenario 2 3 Under No Action Alternative 1-Scenario 2, the rate of harvest-related and road-related 4 mass wasting events under the Washington Forest Practices Rules in effect on January 1, 5 1999 is expected to continue, and the likelihood of mass wasting would be considered 6 moderate (subsection 4.4, Geology, Soils, and Erosional Processes). New roads crossing 7 unstable slopes require Class IV-Special permits, but no standardized method is currently 8 in use for identifying unstable slopes. Currently, to the extent possible, unstable slopes 9 are identified in Watershed Analysis and through forest practices application review. 10 Existing roads would only be upgraded following Watershed Analysis or as part of a 11 forest practices application. Infrequently used roads greater than 10 years old and 12 orphaned roads would continue to be at high likelihood of failure in some areas. 13
Streambank stability is also likely to be periodically reduced along all westside and 14 eastside streams subject to adjacent harvest. Fish-bearing streams (Types 1 to 3) would 15 have some protection provided by RMZs, but selective harvest within the RMZs would 16 result in less than full protection. In addition, Type 4 and 5 waters would have no 17 protection resulting from RMZs. Depending on tree species, loss of root strength and 18 decline of streambank stability after timber harvest can take as long as 5 years while 19 restoration of stability from new tree and vegetation growth may take more than 12 years. 20
No Action Alternative 1-Scenario 1 and Alternatives 2 and 3 21 Note: The reviewer is reminded to consider the differences in effectiveness over time of 22 the adaptive management program among this group of alternatives (No Action 23 Alternative 1-Scenario 1 [low], Alternative 2 [high], Alternative 3 [moderate]) in 24 evaluating the effects discussed below (subsection 4.1.5, Adaptive Management). 25
Relative to No Action Alternative 1-Scenario 2, No Action Alternative 1-Scenario 1 and 26 Alternatives 2 and 3 would offer greater protection from harvest-related mass wasting 27 because a more-refined and uniform screening method would be implemented. Greater 28 success in identifying high hazard slopes should result in more Class IV-special 29 applications, greater environmental review, and implementation of more restrictive 30 harvest prescriptions for these areas. Overall, No Action Alternative 1-Scenario 1 and 31 Alternatives 2 and 3 are rated as having moderate potential for harvest-related mass 32 wasting. 33
Under No Action Alternative 1-Scenario 1 and Alternatives 2 and 3, substantial 34 improvements would occur in the planning and construction of new roads. Relative to 35 No Action Alternative 1-Scenario 2, more new roads planned for potentially unstable 36 slopes (based upon new Washington DNR hazard maps) would require a Class IV-special 37 application that would result in greater environmental review. No Action Alternative 1-38 Scenario 1 and Alternatives 2 and 3 would also require the preparation of RMAPs. 39 RMAPs would require inventories of roads and schedules and plans for correcting 40 identified problems. No Action Alternative 1-Scenario 1 and Alternatives 2 and 3 would 41
Draft EIS Fish and Fish Habitat
4-171
Chapter 4 also require road upgrades to new standards within 10 to 15 years. Relative to roads, No 1 Action Alternative 1-Scenario 1 and Alternatives 2 and 3 are considered to have low to 2 moderate likelihood of adverse effects. Some coarse sediment delivery to streams from 3 forest roads would likely occur regardless of management activities; however, the 4 frequency and magnitude of events should be substantially reduced. 5
Under both harvest prescription options, No Action Alternative 1-Scenario 1, Alternative 6 2, and Alternative 3 would provide substantial streambank protection compared to No 7 Action Alternative 1-Scenario 2, but would not provide full protection. Changes in the 8 stream typing system (See Fish Passage information below) and the presence of no-9 harvest core zones would substantially increase the number of Type F and S stream miles 10 that receive a relatively high level of protection. However, up to 50 percent of Type NP 11 stream reaches and all Type NS reaches would receive no protection from harvest, but 12 would have Equipment Limitation Zones. Consequently, a moderate likelihood of coarse 13 sediment delivery due to accelerated streambank erosion would exist for Type N streams. 14
Alternative 4 15 Alternative 4 has higher protection to streams from harvest-related mass wasting events 16 compared to both scenarios of No Action Alternative 1 and Alternatives 2 and 3 because 17 it includes wider no-harvest buffers on all streams and greater restrictions on activities on 18 unstable slopes. Alternative 4 also requires a cap on road densities at current levels. 19 Alternative 4 would provide for complete bank stability (erosion) functions of riparian 20 vegetation for nearly all streams. The RMZ widths proposed under this alternative are at 21 least 70 feet and exceed the criterion for full protection of streambank stability (i.e., 0.3 22 site potential tree height) under most situations. In addition, the RMZs would include a 23 no-harvest prescription. Consequently, Alternative 4 is rated as having a low likelihood 24 of coarse sediment delivery due to accelerated streambank erosion, compared to No 25 Action Alternative 1-Scenario 1 and No Action Alternative 1-Scenario 2. 26
4.8.3.2 Fine Sediment 27 Overview of Effects 28 The effects of the alternatives on fine sediment delivery are analyzed in this subsection. 29 It is important to note that, from a historical perspective, fine sediment delivery to 30 streams has been substantially reduced over time because of improvements in road 31 construction methods, the frequency of road maintenance, and the implementation of 32 BMPs (subsection 3.4.2.3, History of Forest Practices Affecting Erosion and 33 Sedimentation). Therefore, compared to baseline conditions, the amount of fine sediment 34 delivery and resulting effects on fish habitat is not expected to increase under any of the 35 alternatives although the rate of reduction would vary substantially. The following 36 paragraphs address the likelihood of fine sediment delivery and associated effects by 37 alternative in a comparative manner 38
Considering both harvest-related and road-related management prescriptions (See below), 39 No Action Alternative 1-Scenario 2 would result in a high likelihood of fine sediment 40 delivery and associated adverse effects relative to all other alternatives. 41
Fish and Fish Habitat Draft EIS
4-172
Chapter 4 No Action Alternative 1-Scenario 1 and Alternatives 2 and 3 would result in a low to 1 moderate likelihood of fine sediment delivery and associated adverse effects primarily 2 because of the requirements for RMAPs and road upgrades. However, there is a high 3 degree of uncertainty regarding the effectiveness of protection measures along Type N 4 streams under No Action Alternative 1-Scenario 1 and Alternatives 2 and 3. Although 5 No Action Alternative 1-Scenario 1 and Alternatives 2 and 3 would provide substantial 6 improvements over No Action Alternative 1-Scenario 2, none of the alternatives would 7 be expected to eliminate all management-related fine sediment delivery. 8
Alternative 4 would result in a low likelihood of fine sediment delivery and associated 9 effects because no-harvest buffers would be more extensive, RMAP implementation 10 would be accelerated, and because it includes a “no net increase” clause for road density. 11 Otherwise, protections are similar to No Action Alternative 1-Scenario 1 and Alternatives 12 2 and 3. The likelihood for sediment delivery would be reduced relative to all other 13 alternatives, but not eliminated. A detailed analysis of the alternatives is presented in the 14 following subsection. 15
Detailed Effects Analysis 16 Fine sediment loading to streams affects the quality and quantity of spawning and rearing 17 habitat by filling in the spaces between gravels and cobbles and by filling pools (Hicks et 18 al. 1991; Everest et al. 1987; Cedarholm and Reid 1987). Similar to coarse sediment 19 loading, fine sediment production is related to both timber harvest and road management 20 practices (Furniss et al. 1991; Spence et al. 1996). Vegetation in riparian zones is 21 important for filtering and retaining fine sediment eroding from hillslope areas (Naiman 22 et al. 1998). Similar to coarse sediment, some fine sediment is delivered to streams 23 during infrequent mass wasting events (Furniss et al. 1991). In addition, roads can be a 24 chronic source of fine sediment from surface erosion, and harvest activities can 25 contribute to increases in hillslope erosion (Furniss et al. 1991; Hicks et al. 1991; Everest 26 et al. 1987). 27
The sediment equivalent buffer area index was calculated for the proposed management 28 prescriptions under the three alternative groupings. The sediment equivalent buffer area 29 index values are standardized as percentages with the maximum equivalent buffer area 30 index of 100 percent defined for a no-harvest condition and a clearcut providing a 60 31 percent value (Figures 4.4-1 and 4.4-2). 32
Many watersheds are currently at road densities considered too high for a properly 33 functioning aquatic ecosystem (less than 2 miles/mile2 , NMFS 1996a; less than 1 34 mile/mile2, USFWS 1998). Information on existing road density is contained in 35 subsection 3.4.2.2 (Forest Practices Effects on Erosion and Sedimentation) and DEIS 36 Appendix D (Road Density). However, road density criteria should be viewed with 37 caution because the functional relationship between road density and effects to the 38 aquatic ecosystem can vary among different watersheds depending upon watershed 39 characteristics (soil, climate, and topography) and characteristics of the road system (age, 40 usage, and level of maintenance). Nevertheless, road density can be a useful descriptor to 41 enhance understanding of the overall level of disturbance to a watershed. Road density is 42
Draft EIS Fish and Fish Habitat
4-173
Chapter 4 one of 19 physical indicators recommended by the Services to assess a properly 1 functioning aquatic ecosystem, including several that evaluate road effects more directly 2 (e.g., sediment and channel condition). 3
No Action Alternative 1-Scenario 2 4 Under No Action Alternative 1-Scenario 2, the equivalent buffer area index for sediment 5 was calculated at 65 to 78 percent of the maximum equivalent buffer area index (full 6 protection) for all westside streams and at 67 to 76 percent for all eastside streams. This 7 is dependent upon the buffer width criteria that is assumed to fully filter fine sediment 8 from hillslope surface erosion (i.e., 30 feet or 200 feet) (DEIS Appendix B). 9 Consequently, No Action Alternative 1-Scenario 2 would result in a high likelihood of 10 fine sediment delivery resulting from hillslope erosion. 11
Under No Action Alternative 1-Scenario 2, the approach to road management is based 12 primarily upon the implementation of BMPs that were approved by Ecology and 13 described in the January 1, 1999 Washington Forest Practices Rules and the Washington 14 Forest Practices Board Manual (Washington Forest Practices Board 2001c, 2002; 15 Washington Forest Practices Board 2001b). In addition, many of the rules include 16 discretionary language by encouraging, but not requiring, certain activities. A study on 17 the effectiveness of these BMPs found that many practices were ineffective even when 18 implemented according to standards and guidelines (Rashin et al. 1999). Other activities, 19 such as preparation of an RMAP or additional maintenance on culverts only occur when 20 required by Washington DNR. However, there are no descriptions of specific triggers 21 that would prompt Washington DNR to require these activities. Under the Washington 22 Forest Practices Rules for No Action Alternative 1-Scenario 2, there is little incentive for 23 landowners to abandon (i.e., close and remediate) roads. Consequently, many roads 24 would remain in an inactive status with minimal maintenance. Roads built before 1974 25 and unused since 1974 have been termed “orphan” roads. The Washington Forest 26 Practices Rules under No Action Alternative 1-Scenario 2 would have no policies 27 directed towards management of orphan roads. Consequently, No Action Alternative 1-28 Scenario 2 is considered to pose a high likelihood for fine sediment delivery from roads. 29
No Action Alternative 1-Scenario 1 and Alternatives 2 and 3 30 Note: The reviewer is reminded to consider the differences in effectiveness over time of 31 the adaptive management program among this group of alternatives (No Action 32 Alternative 1-Scenario 1 [low], Alternative 2 [high], Alternative 3 [moderate]) in 33 evaluating the effects discussed below (subsection 4.1.5, Adaptive Management). 34
The sediment equivalent buffer area index (Figures 4.4-1 and 4.4-2) suggests that No 35 Action Alternative 1-Scenario 1 and Alternatives 2 and 3 would provide about 73 to 91 36 percent protection relative to no-harvest for westside streams and 71 to 88 percent for 37 eastside streams, depending on the evaluation criterion (i.e., buffer width of 30 feet or 38 200 feet). No Action Alternative 1-Scenario 1 and Alternatives 2 and 3 would provide a 39 relatively high level of sediment filtering capacity. No Action Alternative 1-Scenario 1 40 and Alternatives 2 and 3 would provide substantially more sediment filtering protection 41 than No Action Alternative 1-Scenario 2. 42
Fish and Fish Habitat Draft EIS
4-174
Chapter 4 No Action Alternative 1-Scenario 1 and Alternatives 2 and 3 would require large forest 1 landowners to fully implement RMAPs by December 2016 if Watershed Analysis has not 2 been completed within that watershed; and upgrades identified in the RMAPs must also 3 be completed by 2016. Under No Action Alternative 1-Scenario 1 and Alternatives 2 and 4 3, corrections of problem orphan roads would begin after all large landowner RMAPs 5 have been submitted, the hazard reduction statute RCW Chapter 76.09.300 has been 6 evaluated, and determination of need for public funding for repair or abandonment of 7 orphan roads has taken place. Small landowners would also be required to prepare 8 RMAPs, but would not be required to submit them until they file a forest practices 9 application with Washington DNR. 10
An important component to RMAP preparation is review. Under No Action Alternative 11 1-Scenario 1 and Alternatives 2 and 3, RMAPs would be open to review by WDFW, 12 tribal entities, and Ecology. However, the authority to require changes to an RMAP 13 would be held solely by Washington DNR. Thus, the requirements to address roads and 14 sediment delivery under No Action Alternative 1-Scenario (and Alternatives 2 and 3) 15 would result in low to moderate likelihood of fine sediment delivery and associated 16 adverse effects primarily because of the requirements for RMAPs and road upgrades; a 17 substantial improvement over No Action Alternative 1-Scenario 2. 18
Alternative 4 19 Under Alternative 4, the sediment equivalent buffer area index would be 91 to 100 20 percent for the westside and 94 to 100 percent for the eastside. The sediment index 21 suggests that Alternative 4 would provide at or near the maximum level of sediment 22 filtering capacity; more than No Action Alternative 1-Scenario 1, and substantially more 23 than No Action Alternative 1-Scenario 2. 24
In contrast to No Action Alternative 1-Scenario 1, Alternative 4 would require that 25 activities to fix problem orphan roads occur on the same schedule as other roads. In 26 addition to scheduling differences, Alternative 4 would require a no net increase in road 27 density within an ownership or watershed. Alternative 4 also provides an important, 28 added level of protection over No Action Alternative 1-Scenario 1 by capping road 29 densities at current levels, and by requiring upgrades by 2011. Thus, Alternative 4 has 30 the lowest potential for streams to be adversely affected by the delivery of fine sediment 31 from roads due to the “no net increase” road density clause and accelerated improvement 32 schedule. 33
4.8.3.3 Hydrology 34 Overview of Effects 35 The effects of the alternatives on hydrology, as affected by harvest practices and road 36 density, are analyzed in this subsection. Relative to historical practices (prior to the 37 Washington Forest Practices Rules in effect on January 1, 1999), which have modified 38 hydrologic conditions via road construction and maintenance and harvesting, all 39 alternatives would facilitate recovery of hydrology as roading and harvest practices that 40 could affect hydrology would improve. Therefore, compared to baseline conditions, flow 41 alterations (peak and low flows), and effects on fish habitat are not expected to increase 42
Draft EIS Fish and Fish Habitat
4-175
Chapter 4 under any of the alternatives, although the rate of recovery would vary slightly. The 1 following paragraphs address the likelihood of hydrologic change by alternative in a 2 comparative manner. 3
No Action Alternative 1-Scenario 2 would result in a moderate likelihood of peak flow 4 increases. Watershed analysis would reduce the likelihood in areas where it is conducted. 5
No Action Alternative 1-Scenario 1 and Alternatives 2 and 3 would also result in a 6 moderate likelihood of peak flow increases. Compared to No Action Alternative 1-7 Scenario 2, No Action Alternative 1-Scenario 1 and Alternatives 2 and 3 may have fewer 8 watershed analyses performed. However, these reduced protections would likely be 9 offset by improvements in riparian protection and the construction, maintenance, and 10 abandonment of roads under these alternatives. 11
Alternative 4 would result in a low likelihood of peak flow increases because it addresses 12 cumulative watershed harvest by limiting the size of clearcuts in the rain-on-snow zone, 13 and has a “no net increase” clause for road density. 14
Detailed Effects Analysis 15 Forest roads and timber harvest can affect the hydrologic regime of a stream. High road 16 densities and immature forest stands, particularly in rain-on-snow zones, can produce 17 larger and more frequent peak flows. Roads influence stream hydrology by routing water 18 collected on the road surface. The primary negative effect of peak flows on salmonids 19 occurs while eggs incubate in redds, but other effects include accelerated bank erosion 20 and changes in channel morphology. Peak flows can result in scour that disturbs the 21 highly sensitive eggs and causes increased mortality (subsection 3.5.2, Surface Water 22 Quantity, and subsection 4.5.2, Surface Water Quantity). 23
No Action Alternative 1-Scenario 2 24 Under No Action Alternative 1-Scenario 2, the likelihood for peak flow increases is 25 reduced in areas that have undergone Watershed Analysis. Washington DNR is required 26 by State law to conduct Watershed Analysis within all non-agricultural watersheds of the 27 State with more than 1,000 acres of forestland and less than 80 percent Federal 28 ownership. A Watershed Analysis can be conducted voluntarily by a private landowner. 29 Under No Action Alternative 1-Scenario 2, Watershed Analysis provides landowners 30 with increased certainty about the prescriptions that would be required on their lands. No 31 Action Alternative 1-Scenario 2 would result in a moderate likelihood of peak flow 32 increases because Watershed Analysis would provide more restrictive prescriptions 33 where peak-flow effects are probable, but not all watersheds are likely to undergo 34 analysis. 35
No Action Alternative 1-Scenario 1 and Alternatives 2 and 3 36 No Action Alternative 1-Scenario 1 and Alternatives 2 and 3 would have a slightly higher 37 likelihood of effects on peak flows in the near-term, relative to No Action Alternative 1-38 Scenario 2, because fewer watershed analyses are likely to be performed by private 39 landowners. Under No Action Alternative 1-Scenario 1 and Alternatives 2 and 3, 40 Watershed Analysis would have more modules that would make them more costly to 41
Fish and Fish Habitat Draft EIS
4-176
Chapter 4 conduct. Consequently, many of the benefits of Watershed Analysis would likely be 1 delayed until the Washington DNR conducted the analyses and incorporated the results 2 during its review of forest practices applications. 3
Alternative 4 4 In the long-term, Alternative 4 would likely provide the lowest likelihood of peak flow 5 increases relative to either scenario of the No Action Alternative 1 because it includes 6 rules limiting the amount of hydrologically immature forest cover within the rain-on-7 snow zone, and Watershed Analysis would incorporate a new eastside hydrology module. 8 The differences in the alternatives relative to potential effects on peak flows are more 9 apparent in westside watersheds than eastside watersheds because rain-on-snow is a more 10 common peak flow generating process on the westside. 11
Road-related effects on peak flows in forested watersheds are relatively minor compared 12 to harvest-related effects. Alternative 4 has similar road prescriptions to No Action 13 Alternative 1-Scenario 1 that would provide only slight improvements relative to No 14 Action Alternative 1-Scenario 2 for addressing peak flow issues. Although Alternative 4 15 does not require reductions in road density over current levels, it does provide a cap on 16 road density at current levels reducing the road-related effects on peak flow in the long-17 term compared to both scenarios of the No Action Alternative 1. 18
4.8.3.4 Large Woody Debris 19 Overview of Effects 20 An overview of the effects of the alternatives on LWD recruitment is presented in this 21 subsection. As noted below, LWD is a key component of fish habitat providing cover 22 and pools, and influencing sediment distribution and storage, forming floodplain and 23 offchannel habitats, and serving as food and habitat for aquatic organisms. For 24 perspective, LWD in streams has been greatly reduced in nearly all streams within the 25 State due to historical logging practices, but also other land use practices (e.g., 26 agriculture, urbanization) (subsection 3.7.1.6, Historic Protection of Riparian Areas, and 27 subsection 3.7.1.7, Current Condition of Riparian Areas). However, the current 28 Washington Forest Practices Rules, as well those in effect on January 1, 1999, would 29 provide substantially more LWD than was provided under historical harvest practices, 30 especially along fish-bearing streams. Therefore, the amount of LWD produced within 31 riparian zones on covered forestlands is increasing due to tree growth and because the 32 Washington Forest Practices Rules under any of the alternatives would result in the 33 retention of more trees along fish-bearing streams that could become LWD, especially 34 relative to historical practices. However, in the near-term LWD in streams would 35 continue to decrease, especially in larger streams, as LWD supplied by older forest stands 36 naturally declines due to the decay of trees and transport. LWD supplied from the 37 riparian area along fish-bearing streams, in the long term, would increase under any of 38 the alternatives, relative to baseline riparian conditions. Along non-fish-bearing streams, 39 the amount of LWD would likely reduce (from natural decay and transport) under all 40 alternatives in the short term but in the long term would remain close to baseline 41 conditions or increase depending on the alternative. Since some LWD in fish-bearing 42
Draft EIS Fish and Fish Habitat
4-177
Chapter 4 streams is supplied from upstream non-fish-bearing channels, those alternatives that do 1 not provide RMZs on non-fish-bearing streams would reduce future supply to fish-2 bearing streams. Increases in LWD due to tree growth would be very slow to occur and 3 represent long-term improvements. The following paragraphs summarize the degree to 4 which the alternatives affect LWD recruitment. A more detailed conclusion is included 5 at the end of this subsection. 6
No Action Alternative 1-Scenario 2 would likely reduce the quantity and quality of fish 7 habitat due to inadequate recruitment of LWD in both eastside and westside forests. 8 Because of the many important functions of instream LWD, this would ultimately reduce 9 fish habitat quality including reduced pools, sediment retention, food sources, channel 10 formation, and floodplain habitat development. Minimal inputs of LWD to non-fish-11 bearing streams would adversely affect LWD, food, and sediment supply in fish-bearing 12 streams. 13
No Action Alternative 1-Scenario 1 and Alternatives 2 and 3 would result in a low to 14 moderate likelihood of diminished LWD but would likely provide adequate LWD inputs 15 to fish-bearing streams. These alternatives would supply much more LWD to fish-16 bearing streams than No Action Alternative 1-Scenario 2. However, it is uncertain 17 whether No Action Alternative 1-Scenario 1 and Alternatives 2 and 3 would provide 18 adequate protection of LWD recruitment from non-fish-bearing streams to fish-bearing 19 streams, but inputs would be much greater than under No Action Alternative 1-Scenario 20 2. 21
Active wood placement strategies, which are an option under these alternatives, are 22 important for meeting near-term LWD needs in many fish-bearing streams. Streams with 23 low existing levels of LWD and early- to mid-seral riparian stands may require active 24 placement to meet adequate LWD levels over the near term (the next 30 or more years). 25
Alternative 4 would result in a low likelihood of diminished LWD recruitment in both 26 fish-bearing and non-bearing streams due to the extensive RMZs on nearly all streams. 27 The effect would be greater assurance of improving and maintaining important habitat 28 features (e.g. pool, channel formation) compared to the other alternatives, especially 29 relative to No Action Alternative 1-Scenario 2. 30
Detailed Effects Analysis 31 Instream LWD is considered to be one of the most important habitat components lacking 32 in most streams categorized as “not properly functioning” (Cullins et al. 2002; 33 Montgomery 2004; Beachie and Sibley 1997). LWD levels have declined since the 34 advent of timber harvesting for a number of reasons including splash dams, logjam 35 removal, removal at dam trashracks, removal for firewood, removal from marine areas, 36 and low recruitment from due to past forest practices (Maser and Sedell 1994; Bisson and 37 Bilby 1998; Spence et al. 1996). This portion of the assessment evaluates the level of 38 protection and enhancement the alternatives provide for instream LWD using the 39 equivalent buffer area index described in the subsection 4.7, (Riparian and Wetland 40 Processes) and DEIS Appendix B (Riparian Modeling). As a reference point, the analysis 41
Fish and Fish Habitat Draft EIS
4-178
Chapter 4 assumed that a no-harvest buffer width that was one site potential tree height would 1 provide full protection. Consequently, all LWD equivalent buffer area index values for 2 the alternatives were relative to the full protection equivalent buffer area index value (i.e., 3 0 percent is no protection, 100 percent is full protection). LWD equivalent buffer area 4 index analyses were conducted based on both the 100-year site potential tree height and 5 250-year site potential tree height (subsection 4.7.1, Riparian Processes, for details of 6 LWD recruitment assessment). 7
No Action Alternative 1-Scenario 2 8 Under No Action Alternative 1-Scenario 2, the January 1, 1999 Washington Forest 9 Practices Rules would continue to regulate RMZ widths. Westside RMZ widths would 10 range from 25 feet to 100 feet for fish-bearing streams (Types 1 to 3) depending upon the 11 stream type and width. Similarly, in eastside forests, RMZ widths would range from 30 12 feet to 300 feet for fish-bearing waters depending upon the harvest prescription (partial 13 versus even-aged) in the adjacent harvest unit. RMZs would not be required along non-14 fish-bearing streams (Types 4 and 5), except occasionally along the lower 1,000 feet of 15 Type 4 waters to protect water quality. In addition to the RMZ widths, the January 1, 16 1999 Washington Forest Practices Rules specify the number of leave trees required 17 within the RMZs. 18
The LWD equivalent buffer area index suggests that fish-bearing streams on the eastside 19 would receive about 67 percent of full protection compared to a no-harvest buffer based 20 on the 100-year site potential tree height and about 53 percent of full protection based on 21 the 250-year site potential tree height. All typed waters combined would receive about 22 46 to 57 percent of full protection (Tables 4.8-1 and 4.8-2). Consequently, No Action 23 Alternative 1-Scenario 2 is considered to have a high likelihood of inadequate LWD 24 recruitment. Westside fish-bearing streams would have about 60 percent of full 25 protection while all typed waters combined would have about 30 percent of full 26 protection based on the 100-year site potential tree height. Fish-bearing streams would 27 have about 37 percent of full protection and all streams combined would have about 28 19 percent of full protection, based on the 250-year site potential tree height (Tables 4.8-1 29 and 4.8-2). Under No Action Alternative 1-Scenario 2 there is a high likelihood of 30 reduced LWD recruitment potential. 31
No Action Alternative 1-Scenario 1 and Alternatives 2 and 3 32 Note: The reviewer is reminded to consider the differences in effectiveness over time of 33 the adaptive management program among this group of alternatives (No Action 34 Alternative 1-Scenario 1[low], Alternative 2 [high], Alternative 3 [moderate]) in 35 evaluating the effects discussed below (subsection 4.1.5, Adaptive Management). 36
Under No Action Alternative 1-Scenario 1 and Alternatives 2 and 3, the water typing 37 system would change and new rules for RMZ widths and harvest prescriptions would be 38 implemented. Total RMZ widths for fish-bearing streams would range from 90 feet to 39 200 feet on the westside and 75 feet to 130 feet on eastside depending upon the site class 40 (Chapter 2, Alternatives). Unlike No Action Alternative 1-Scenario 2, perennial, non-41 fish-bearing streams (Type Np) would have RMZs along at least 50 percent of their 42
Draft EIS Fish and Fish Habitat
4-179
Chapter 4 Table 4.8-1. Percentage of Full Protection for LWD Recruitment to Streams 1
under a 100-year Site Potential Tree Height Assumption Based 2 upon the LWD Equivalent Buffer Area Index Analysis. 3
Region/Stream Type
No Action Alternative 1-
Scenario 2
No Action Alternative 1-
Scenario 1, Alternative 2, and
Alternative 3 2/ Alternative 4 Westside-Non-Fish-bearing Seasonal
Eastside-Fish-bearing 67 911/ 100 Eastside-All streams 57 771/ 100 1/ Does not include additional potential protection within the bull trout overlay. 2/ Average of Option 1 and 2 characteristics.
4 Table 4.8-2. Percentage of Full Protection for LWD Recruitment to Streams 5
under a 250-year Site Potential Tree Height Assumption Based 6 upon the LWD Equivalent Buffer Area Index Analysis. 7
Region/Stream Type
No Action Alternative 1-
Scenario 2
No Action Alternative 1-Scenario 1, Alternative 2,
and Alternative 3 2/ Alternative 4 Westside-Non-Fish-bearing Seasonal
Eastside-Fish-bearing 53 821/ 100 Eastside-All streams 46 691/ 99 1/ Does not include additional potential protection within the bull trout overlay. 2/ Average of Option 1 and 2 characteristics.
Fish and Fish Habitat Draft EIS
4-180
Chapter 4 lengths and would have protection of sensitive areas. As described earlier, RMZs along 1 fish-bearing streams would incorporate three smaller zones, a no-harvest core zone, an 2 inner zone, and an outer zone. On the westside, landowners would have two harvest 3 prescription options for inner zones that meet stand requirements: Option 1, which allows 4 thinning in the inner zone to accelerate riparian tree growth; or Option 2, which requires 5 harvest in the inner zone to be concentrated at its outer edge. On the eastside, harvest 6 prescriptions would be dependent upon the timber habitat type and the basal area of the 7 stand in the inner zone. On both sides of the Cascades, outer zones would have leave tree 8 requirements that may be dispersed or clumped. 9
The LWD equivalent buffer area index indicates that No Action Alternative 1-Scenario 1 10 and Alternatives 2 and 3 would provide considerably more protection than No Action 11 Alternative 1-Scenario 2 based on both the 100-year and 250-year site potential tree 12 height. On the westside, these alternatives would provide a high level of protection to 13 Type S and F streams (90 to 93 percent of full protection) (Tables 4.8-1 and 4.8-2), but 14 for all streams, the level of protection would be much lower (about 50 to 52 percent of 15 full protection). 16
Non-fish-bearing perennial streams would have a much greater LWD supply than under 17 No Action Alternative 1-Scenario 2, due to the RMZs along much of their lengths, with 18 an LWD equivalent buffer area index of 51 and 44 percent for westside streams based on 19 the 100- and 250-year site potential tree heights, respectively. Non-fish-bearing seasonal 20 streams on the westside would have equivalent buffer area indexes of 0 percent (Tables 21 4.8-1 and 4.8-2). The actual LWD supplied to these non-fish-bearing seasonal streams 22 may be greater than estimated due to unstable slopes protection (i.e., protective buffers) 23 that often occurs adjacent to these channels. While LWD in these streams is much less 24 frequently a source of LWD for fish-bearing streams than that adjacent to fish-bearing 25 streams, in areas with a high frequency of mass wasting, LWD from non-fish-bearing 26 streams can be significant. This is because trees from the smaller non-fish-bearing 27 streams can be transported downstream during flood or debris flow events and become 28 functional for the creation of fish habitat. In some areas, these processes can contribute 29 substantially to the total wood load. 30
In coastal Oregon, 11 to 49 percent of the LWD in second and third order streams was 31 derived from debris flows (Gresswell and May 2000). Reeves et al. (2003) found that 32 about 65 percent of wood pieces in a fourth order watershed in Oregon coast came from 33 upslope sources. Benda et al. (2003) recently modeled wood source areas in a Southwest 34 Washington stream system and estimated that over the long term, debris flows would 35 provide about 16 percent of the total wood load. 36
While debris flows are not restricted to stream channels, high-gradient headwater 37 channels are noted as being common sources of these types of flows (Benda et al. 2003). 38 But Martin and Benda (2001) estimated in a southeast Alaska watershed that only about 1 39 percent of LWD originated from debris flows. So some of the wood that enters non-fish-40 bearing streams will contribute to habitat formation in fish-bearing streams, but the actual 41 contribution is highly variable and not well quantified. Thus, the scientific literature does 42
Draft EIS Fish and Fish Habitat
4-181
Chapter 4 not provide clear guidance that buffers on Type N streams under No Action Alternative 1 1-Scenario 1 and Alternatives 2 and 3 would be sufficient for providing LWD to fish-2 bearing streams. But the presence of buffers may ultimately contribute LWD to fish-3 bearing channels in some stream systems (subsection 4.7.1, Riparian Processes). Overall, 4 this suggests that under No Action Alternative 1-Scenario 1 and Alternatives 2 and 3, 5 most streams on the westside currently lacking wood should eventually return to at least a 6 moderate level of function. Depending upon site-specific conditions and the harvest 7 Option chosen by the landowner, LWD function could be even higher. Further, the 8 functions provided by LWD in non-fish-bearing streams such as sediment trapping, 9 nutrient processing, and energy dissipation would be compromised because of reduced 10 LWD recruitment. 11
On the eastside, No Action Alternative 1-Scenario 1 and Alternatives 2 and 3 would 12 provide substantial improvements over No Action Alternative 1-Scenario 2. For fish-13 bearing streams, the equivalent buffer area index would range from 82 to 91 percent of 14 full protection (Tables 4.8-1 and 4.8-2). Non-fish-bearing perennial streams, due to the 15 RMZ along much of their length, would have much higher LWD recruitment than No 16 Action Alternative 1-Scenario 2, with 43 and 38 percent for eastside streams based on the 17 100- and 250-year site potential tree heights. Non-fish-bearing seasonal streams on the 18 eastside streams had 18 percent of full protection (Tables 4.8-1 and 4.8-2). However, the 19 actual LWD supplied to these N streams would be greater than estimated due to unstable 20 slopes protection that often occurs adjacent to these channels. LWD recruitment to fish-21 bearing channels on the eastside would be the same as described for the westside. 22
One aspect of LWD recruitment that the equivalent buffer area index does not reflect is 23 the growth rate and future size of trees in the RMZ following harvest (subsection 4.7.1, 24 Riparian Processes). The tree growth model in the Riparian Aquatic Integration 25 Simulator indicated that thinning increases the growth rate of residual trees (Washington 26 Forest Practices Board 2001a, Appendix D). Larger streams require larger pieces of 27 LWD to function adequately (Abbe and Montgomery 2003; Bilby and Ward 1989; Hyatt 28 and Naiman 2001; Abbe and Montgomery 1996; Beschta and Robinson 1990; Beechie 29 and Sibley 1997). Consequently, for larger streams and rivers, the equivalent buffer area 30 index would underestimate the protection provided under Option 1 in western 31 Washington. In situations where the riparian stand is characterized by numerous, but 32 smaller trees, Option 1 (removing smaller trees throughout the inner zone) would 33 accelerate the development of stands with fewer, but larger trees. These larger trees 34 would have a higher potential to be functional LWD once recruited to the stream, than 35 those developed under Option 2. However, the Riparian Aquatic Integration Simulator 36 model suggests that stands with trees of functional size range from 80 to 150 years 37 depending upon stream size and site class. Consequently, the benefits of inner zone 38 thinning would only become realized over the long-term. 39
In addition to future stand conditions, the equivalent buffer area index does not account 40 for instream wood placement strategies that can be implemented when existing stream-41 adjacent roads limit the stands’ capacity to meet basal stand requirements. Under these 42 situations, a landowner may design an LWD placement strategy in cooperation with the 43
Fish and Fish Habitat Draft EIS
4-182
Chapter 4 WDFW. The LWD placement plan can include removing up to 10 trees per acre in the 1 outer zone as an incentive for landowners to implement the plan. Specifications for 2 LWD strategies are currently under development. 3
No Action Alternative 1-Scenario 1 and Alternatives 2 and 3 include an option for 4 converting hardwood dominated stands to conifers in cases where stands meet specific 5 requirements (Chapter 2, Alternatives). The hardwood conversion rule is intended to 6 improve inner zone stand conditions over the long-term in areas that cannot meet stand 7 requirements because of the predominance of hardwood trees. These areas must also 8 have evidence that conifers have historically been established on the site. The rule 9 provides for harvest of no more than 10 percent of the conifers 8 to 20 inches dbh, and 10 no-harvest of larger trees. In terms of LWD, the hardwood conversion rule is considered 11 a long-term benefit to these riparian areas even though it may reduce function in the short 12 term. Alternative 4 also includes a hardwood conversion option. 13
Similar to No Action Alternative 1-Scenario 2, downstream movement of LWD can be 14 restricted at culverts. However, No Action Alternative 1-Scenario 1 and Alternatives 2 15 and 3 include the preparation of RMAPs. These plans include culvert size requirements 16 based on the 100-year flood. All new culverts and culverts that currently degrade 17 resources would be required to meet the new standard. Larger culverts would be more 18 likely to pass larger pieces of wood as well as floodwaters. However, culverts would not 19 be capable of passing all wood, and some wood may build-up on the upstream side of a 20 culvert. To the extent practicable without significant soil disturbance, RMAPs would be 21 required to include measures for moving accumulated LWD from above to below 22 culverts during standard road maintenance. Consequently, both No Action Alternative 1-23 Scenario 1 and Alternatives 2 and 3 would result in less potential to limit LWD 24 redistribution than No Action Alternative 1-Scenario 2. 25
Alternative 4 26 Alternative 4 would result in a low to very low likelihood of reduced LWD recruitment. 27 Under Alternative 4, all streams would receive from 96 to 100 percent of full LWD 28 recruitment based on the 250-year and 100-year site potential tree heights, on both the 29 westside and the eastside, as a result of 70- to 200-foot no-harvest RMZs. The RMZs 30 under Alternative 4, even on small streams, would result in non-fish-bearing channels 31 also having high LWD recruitment ranging from 86 to 100 percent (Tables 4.8-1 and 32 4.8-2). Notably, heavily stocked stands with small trees near large streams would have 33 less opportunity for thinning to accelerate stand growth and average tree size. Under 34 Alternative 4, thinning can only be done to convert hardwood-dominated stands to 35 conifers and to accelerate development of 200-year-old stand characteristics. However, 36 these prescriptions would require SEPA review, and harvested trees could not be 37 removed unless monitoring determined that the prescriptions were effective. These 38 requirements would provide little incentive for landowners to pursue the thinning option. 39
Alternative 4 does not provide any incentives or mechanisms for implementing instream 40 wood placement strategies. Consequently, streams that have the potential for instream 41 LWD placement under No Action Alternative 1-Scenario 1 could require more time for 42
Draft EIS Fish and Fish Habitat
4-183
Chapter 4 recovery under Alternative 4. For LWD-poor streams surrounded by early- to mid-seral 1 stage riparian stands, recovery could require 40 or more years on the westside and 60 or 2 more years on the eastside. The relatively high supply of LWD to non-fish-bearing 3 streams relative to other alternatives would ensure that debris flows originating in non-4 fish-bearing streams would contribute to fish-bearing streams at a higher rate than under 5 the other alternatives, and that other LWD functions such as sediment storage and 6 nutrient processing would be fully maintained. 7
Large Woody Debris: Conclusion 8 Overall, instream LWD levels would be expected to gradually increase under No Action 9 Alternative 1-Scenario 1 and Alternatives 2, 3, and 4. In the absence of RMZ 10 management, Alternative 4 is likely to provide the highest level of long-term protection 11 and is considered to have the lowest likelihood of LWD-related habitat effects. On the 12 westside, No Action Alternative 1-Scenario 1 and Alternatives 2 and 3 are considered to 13 have a low to moderate likelihood of inadequate LWD recruitment over the long-term as 14 stands develop and are more capable of providing functional LWD. These alternatives 15 provide incentives for landowners to implement instream LWD placement plans and to 16 accelerate the recovery of over-stocked riparian zones through thinning. The moderate 17 likelihood of inadequate recruitment applies where LWD inputs are largely derived from 18 Type N streams. On the eastside, No Action Alternative 1-Scenario 1 and Alternatives 2 19 and 3 are considered to have a moderate likelihood of inadequate LWD recruitment. No 20 Action Alternative 1-Scenario 2 would provide the lowest level of LWD recruitment and 21 would likely further degrade fish habitat. 22
All alternatives would restrict downstream movement of LWD at stream crossings to 23 some degree. However, No Action Alternative 1-Scenario 1 and Alternatives 2, 3, and 4 24 would include RMAPs and requirements that would increase the likelihood of wood 25 passage. Blockages at culverts can result in fish passage problems and culvert failure. 26
The RMZ prescriptions under all of the alternatives would have a greater effect on 27 instream conditions over the mid- to long-term (westside: 20 to 60 years; eastside: 50 to 28 100 years) than over the short-term (westside: less than 20 years; eastside: less than 29 50 years). Currently, most stands along fish-bearing streams are in early-seral stages 30 (64 percent on westside; 60 percent on eastside) (Table 3-18). Assuming that these 31 conditions are representative of nearby upslope stands, new rules many not be applied for 32 many years along most streams because timber stands will be too young for commercial 33 harvest. In addition, the rate of natural recruitment of functional LWD will initially be 34 low but will increase as riparian stands mature. The recovery of instream LWD loads 35 will take decades to centuries (Bilby and Ward 1989). 36
Only No Action Alternative 1-Scenario 1 and Alternatives 2 and 3 provide incentives for 37 instream LWD placement. LWD placement would provide short term benefits by 38 providing more complex habitat structure, nutrient input, and substrate for invertebrate 39 colonization, all of which would benefit fish habitat. These benefits may improve current 40 conditions until riparian stands can develop to the point that they provide sustainable 41 inputs of functional LWD. Many Washington streams currently have low levels of 42
Fish and Fish Habitat Draft EIS
4-184
Chapter 4 instream LWD, and adjacent riparian stands are in early- to mid-seral stages. Thus, LWD 1 placement may be effective in supplementing instream LWD levels over the next 30 or 2 more years. 3
The development of methods for placing LWD is fairly advanced (Oregon Department of 4 Forestry and Oregon Department of Fish and Wildlife 1995), and there would be no 5 substantial negative effects to fish from the placement strategies outlined in the 6 Washington Forest Practices Board Manual (Washington Forest Practices Board 2001b, 7 Section 26). The incentive program under No Action Alternative 1-Scenario 1 and 8 Alternatives 2 and 3 would allow landowners to place wood in stream channels in 9 exchange for removal of additional trees from the outer zone, which has a relatively low 10 probability of providing LWD recruitment to streams. The improvement in current 11 habitat conditions would outweigh the potential reduction in LWD recruitment from the 12 outer zone over time. The recruitment of wood from the outer zone would be a very 13 small percentage of total recruitment and would not provide the same benefits of direct 14 placement of wood. The major risk of LWD placement is to the transportation 15 infrastructure, including culverts and bridges, which could be damaged or removed if 16 wood is mobilized and transported during flood flows. 17
All of the alternatives would allow yarding corridors through RMZs. Yarding corridors 18 provide landowners flexibility in accessing and harvesting timber when a road, stream-19 crossing, or helicopter yarding would otherwise be required. Requirements for leaving or 20 removing trees cut for yarding corridors would be different under the three alternatives, 21 and these differences would be more important for wildlife habitat than aquatic species. 22 Yarding across fish-bearing streams requires a Hydraulic Project Approval from the 23 WDFW. Hydraulic Project Approvals provide a regulatory mechanism for requiring 24 mitigation for the yarding corridor and an opportunity for LWD enhancement. 25
All of the alternatives would result in a small reduction in LWD recruitment relative to 26 unmanaged conditions from existing and future stream crossings and existing stream-27 adjacent parallel roads. No Action Alternative 1-Scenario 1 and Alternatives 2 and 3 also 28 include less restrictive rules for exempt 20-acre parcels that would reduce LWD 29 recruitment in areas with high densities of qualifying parcels. Forest landowners who 30 qualify for the exemptions are estimated to own approximately 0.5 to 5 percent of the 31 private forestlands in the State and an even smaller percentage of the total land base 32 (including State and Federal lands) (See subsection 4.7.2.7, 20-Acre Exemption Rule). 33 Existing roads in RMZs and rule exemptions provide a small increase in the overall 34 likelihood of reduced LWD recruitment relative to unmanaged conditions, but this does 35 not change the relative rankings among the three alternative groupings. 36
All of the alternatives are expected to result in RMZ blowdown along clearcut unit edges 37 (subsection 4.7.1, Riparian Processes). Blowdown levels would be expected to decrease 38 after about 5 years following harvest (when trees are most susceptible to blowdown). 39 Streams with low levels of LWD may benefit in the short-term from increased blowdown 40 rates, but this would also reduce the standing stock of trees available for future 41 recruitment. Streams with narrower buffers would likely have a higher proportion of 42
Draft EIS Fish and Fish Habitat
4-185
Chapter 4 fallen trees that become instream LWD because the unit edge would be closer to the 1 stream. 2
4.8.3.5 Leaf and Needle Recruitment 3 Overview of Effects 4 The effects of the alternatives on leaf and needle recruitment are analyzed in this 5 subsection. Leaves and needles, along with other biological inputs to streams from 6 riparian vegetation, supply nutrients and food for aquatic organisms (Gregory et al. 1991; 7 Richardson 1992). Compared to pre-management conditions, leaf and needle supply has 8 been substantially reduced as a result of past harvest activities. Under all alternatives, 9 future leaf and needle inputs would increase as riparian stands develop over the long 10 term. Therefore, compared to baseline conditions, the amount of leaf and needle delivery 11 and resulting effects on fish habitat are expected to improve under any of the alternatives. 12 The following paragraphs address the degree to which the alternatives affect leaf and 13 needle recruitment. 14
No Action Alternative 1-Scenario 2 would result in a high likelihood of reduced leaf and 15 needle recruitment. However, negative effects on food and nutrient supply, especially for 16 fish, would be less likely as increases in other food sources may compensate for 17 reductions in leaf and needle inputs. 18
No Action Alternative 1-Scenario 1 and Alternatives 2 and 3 would result in a moderate 19 likelihood of reduced leaf and needle recruitment, but like No Action Alternative 1-20 Scenario 2, increases in other food sources would somewhat compensate for those 21 reductions, reducing the potential for negative effects on fish. However, No Action 22 Alternative 1-Scenario 1 (and Alternatives 2 and 3) would have greater assurance of food 23 contribution from non-fish-bearing streams through RMZ retention along Type Np 24 streams. 25
Alternative 4 would result in a very low likelihood of reduced leaf and needle recruitment 26 due to extensive RMZs on most streams. 27
Detailed Effects Analysis 28 The likelihood of reduced leaf and needle recruitment under each alternative differs from 29 that of LWD recruitment. This is because small headwater streams, including seasonal 30 streams that usually flow when litterfall inputs are at their highest level, have a greater 31 influence on leaf and needle recruitment to fish-bearing streams than on LWD 32 recruitment because leaf and needle litter is more easily transported in smaller streams. 33 Furthermore, a large proportion of stream miles on forested land are smaller, non-fish-34 bearing streams (Type N or Type 4 and 5). However, the effects of reduced leaf and 35 needle production on aquatic resources, particularly fish, are likely to be much less than 36 the reduction in supply from tree removal along seasonal channels. 37
Unlike LWD, other sources of food and nutrients often augment or replace that lost from 38 reductions in former leaf and needle supplies. Some studies have found that 39 autochthonous production (i.e., algae growth) may increase following riparian harvest, 40 increasing usable food sources to downstream areas following harvest (Bisson and Bilby 41
Fish and Fish Habitat Draft EIS
4-186
Chapter 4 2001; Bilby and Bisson 1992; Gregory et al. 1987; Murphy and Hall 1981). Although, if 1 nutrients remain low, primary production and benthic macroinvertebrates may not 2 increase substantially in streams adjacent to clearcuts (Culp and Davies 1983). 3 Terrestrial food sources for fish may also be higher from some deciduous riparian forests 4 that regenerate in riparian areas following harvest of old growth (Wipfli 1997). Also, 5 some tree types that replace conifers (e.g., alder) in the short term may enhance 6 downstream food sources for fish (Wipfli 1997; Piccolo and Wipfli 2002). But 7 intermediate age coniferous stands do produce less exported detritus than old-growth 8 stands, and also may result in lower terrestrial insect food sources (Piccolo and Wipfli 9 2002; Gregory et al. 1991). So the overall effects of reduced leaf and litter recruitment 10 are not likely to be as detrimental to aquatic resources downstream as suggested by the 11 model used to estimate reductions in leaf and needle supply. Furthermore, short-term 12 gains in food supply and growth of fish may be offset by a lack of instream structure and 13 reduced fish survival (subsection 3.8.4.5, The Aquatic Food Chain). 14
In summary, No Action Alternative 1-Scenario 2 is expected to result in a high likelihood 15 of reduced leaf and needle recruitment, No Action Alternative 1-Scenario 1 and 16 Alternatives 2 and 3 are expected to result in a moderate likelihood of reduced 17 recruitment, and Alternative 4 is expected to result in a very low likelihood (subsection 18 4.7.1, Riparian Processes, Leaf and Needle Litter Production). 19
4.8.3.6 Floodplains, Off-channel Areas, and the Hyporheic Zone 20 Overview of Effects 21 The effects of the alternatives on maintaining floodplain and off-channel habitats and 22 hyporheic zones are analyzed in this subsection. Historically, floodplains and off-23 channel habitat have been modified or reduced from forest practices and other land use 24 practices (e.g., agriculture, urbanization), and these habitats remain in greatly modified 25 conditions. All alternatives would maintain or improve the condition of these habitats 26 relative to historical management. Therefore, compared to baseline conditions, these 27 habitats would be maintained or improved under any of the alternatives, although the 28 location and degree of improvement would vary. The following paragraphs address the 29 degree to which each alternative would maintain floodplain and off-channel habitat and 30 the hyporheic zones (subsection 4.5.3, Groundwater). 31
No Action Alternative 1-Scenario 2 would be less likely to maintain floodplains, off-32 channel habitats, and hyporheic zones than all other alternatives. Lack of protection of 33 the Channel Migration Zone, where these habitats most often occur, is one of the main 34 reasons for the low likelihood. 35
No Action Alternative 1-Scenario 1 and Alternatives 2 and 3 would protect Channel 36 Migration Zones and provide greater riparian protection, increasing the likelihood that 37 floodplains, off-channel habitats, and hyporheic zones would be maintained relative to 38 No Action Alternative 1-Scenario 2. 39
In addition to protecting the Channel Migration Zone, Alternative 4 would also protect 40 Beaver Habitat Zones and Channel Disturbance Zones on certain streams, which are 41
Draft EIS Fish and Fish Habitat
4-187
Chapter 4 important fish habitats or contributors to fish habitats, resulting in a high likelihood that 1 floodplains, off-channel habitats, and hyporheic zones would be maintained relative to all 2 other alternatives. The likelihood that these habitat features would be maintained is much 3 higher than under No Action Alternative 1-Scenario 2 and slightly higher than under No 4 Action Alternative 1-Scenario 1 and Alternatives 2 and 3. 5
Detailed Effects Analysis 6 As described earlier, floodplains and off-channel areas include side channels, backwater 7 alcoves, ponds, and wetlands connected at least seasonally to flowing waters. Hyporheic 8 zones are the saturated areas beneath and beside these features. Off-channel areas 9 provide important habitat seasonally or to particular life stages (Brown and Hartman 10 1988; Peterson and Reid 1984; Spence et al. 1996; Bjornn and Reiser 1991). Off-channel 11 areas may have shallow, low velocity water that is important during fry rearing periods. 12 These areas can also provide protection from high water velocities during flood flows. 13 Some backwater alcoves and ponds result from groundwater and hyporheic water seeps 14 and may have higher shade levels and lower temperatures than the main channel. These 15 areas provide cool-water refugia during high summertime temperatures. They also may 16 supply spawning areas where groundwater or hyporheic waters emerge (Edwards 1998). 17
Off channel habitat occurs most often in low gradient (less than 4 percent) reaches 18 (Lunetta et al. 1997), but occasionally occur in streams with gradients up to 8 percent 19 (Groot and Margolis 1991; Wydoski and Whitney 2003). Hyporheic waters are poorly 20 understood (Edwards 1998), but are known to be largest in alluvial channels where large 21 volumes of coarse sediment accumulate; these are often associated with floodplains and 22 larger stream channels. The hyporheic zone represents a connection between 23 groundwater and surface water and can influence stream temperature, nutrient supply, 24 stream water quality, and possibly invertebrate production. New off-channel habitats are 25 naturally created within the Channel Migration Zone, which the current Washington 26 Forest Practices Rules define as the area where the active channel is prone to move and 27 the movement results in a near-term loss of riparian function and associated habitat 28 adjacent to the stream (WAC 222-16-010). It is likely that most of the hyporheic zone 29 outside of the active stream channel would be contained within the Channel Migration 30 Zone. This subsection assesses the level of protection the alternatives afford off-channel 31 habitat through protection of Channel Migration Zones and groundwater source areas. 32
No Action Alternative 1-Scenario 2 would provide very little direct protection to 33 channels that are prone to migration. Widths of riparian buffers would be based entirely 34 on the current location of the active channel. Consequently, any new off-channel habitat 35 that develops after RMZ harvest prescriptions were implemented would potentially have 36 reduced riparian protections. For example, if a new side channel were to develop 25 feet 37 from a Type 2 stream with an average buffer width of 50 feet, the RMZ width to that side 38 channel would effectively be reduced to 25 feet. The hyporheic environment may also 39 have low protection under this alternative due to lack of Channel Migration Zone 40 protection and potential riparian groundwater and its connection to the hyporheic zone, 41 although literature is not available to confirm this groundwater assessment (subsection 42 4.5.3, Groundwater). 43
Fish and Fish Habitat Draft EIS
4-188
Chapter 4 Under No Action Alternative 1-Scenario 1, and Alternatives 2 and 3, RMZs would be 1 measured from the edge of the Channel Migration Zone (if present) or the bankfull 2 channel edge. Consequently, existing and potential off-channel habitat would receive 3 high levels of protection under No Action Alternative 1-Scenario 1 and Alternatives 2 4 and 3 compared to No Action Alternative 1-Scenario 2. The greater protection for 5 Channel Migration Zones under this group of alternatives should result in a high 6 likelihood for adequate hyporheic zone protection (subsection 4.5.3, Groundwater). 7
Under Alternative 4, RMZs are also measured from the edge of the Channel Migration 8 Zone (if present) or the bankfull channel edge. In addition, Alternative 4 RMZs would 9 also provide protection for potential beaver habitat. The presence of beaver ponds can be 10 particularly important to coho salmon production (Cederholm et al. 2001). Consequently, 11 existing and potential off-channel habitat under Alternative 4 would receive slightly 12 higher levels of protection than under No Action Alternative 1-Scenario 1 because of the 13 added protection for potential beaver habitat. The greater protection for Channel 14 Migration Zones under Alternative 4 should result in a high likelihood for adequate 15 hyporheic zone protection (subsection 4.5.3, Groundwater). 16
4.8.3.7 Lakes, Reservoirs, and Nearshore Marine Areas 17 Overview of Effects 18 The effects of the alternatives on lakes, reservoirs, and nearshore marine areas are 19 analyzed in this subsection. It is important to note that, from an historical perspective, 20 these environments have been modified as a result of past forest practices. Also, other 21 activities have played a greater role in the modification of many of these habitats, 22 including extensive shoreline (freshwater and marine) and estuarine development from 23 commercial and urban activities. Therefore, compared to baseline conditions, the quality 24 of these environments is not expected to decrease as result of these alternatives, although 25 specific locations may vary. The following paragraphs address the likely effects of each 26 alternative on lakes, reservoirs, and nearshore marine areas. 27
No Action Alternative 1-Scenario 2 has a low likelihood of maintaining lakes, reservoirs, 28 and nearshore marine environment functions primarily because this alternative would 29 provide the lowest level of recruitment of LWD, a primary structural element that 30 maintains functions, compared to all other alternatives (See LWD discussion above). 31 Also, sediment inputs influence the quality of habitat in these areas, and this alternative is 32 not expected to substantially reduce management-related sediment inputs (See Coarse 33 and Fine Sediment discussion above). 34
No Action Alternative 1-Scenario 1 and Alternatives 2 and 3 would provide higher levels 35 of LWD recruitment and reduced management-related sediment inputs relative to No 36 Action Alternative 1-Scenario 2. As a result, this group of alternatives has a moderate 37 likelihood of maintaining lakes, reservoirs, and nearshore marine environments. 38
Alternative 4 would not likely adversely affect lakes, reservoirs, and nearshore marine 39 habitats because of high LWD recruitment and reduced management-related sediment 40 inputs. 41
Draft EIS Fish and Fish Habitat
4-189
Chapter 4 Detailed Effects Analysis 1 Lakes and nearshore marine areas are critical for many life stages of salmonids and other 2 fish. Reservoirs may also be important to salmonids; however, human-altered reservoirs 3 may also have detrimental effects on salmonids. Many factors influence these areas. The 4 primary factors relative to forest practices are LWD input and sediment supply. LWD in 5 lakes and reservoirs provide cover for fish and substrates for plants and animals (e.g., 6 algae, benthic macroinvertebrates) (Moring et al. 1986; Moring et al. 1989; France 1997; 7 Christensen et al. 1996). LWD in lakeshore areas along undeveloped shorelines can be 8 very high (over 500 pieces per kilometer (802 pieces per mile)), and reductions in wood 9 recruitment can greatly reduce in-lake LWD (Christensen et al. 1996). 10
The role of LWD in the nearshore marine and estuaries is not fully understood, but its 11 role is not likely similar to its function and importance in river systems (Simenstad et al. 12 2003). In some cases wood has been found to be used as fish habitat in estuaries (Van de 13 Wetering 2001, as cited in Simenstad et al. 2003) while in another no correlation between 14 fish abundance and benthic production to wood in estuary channels was found (Wick 15 2002, as cited by Simenstad et al. 2003). However, historic wood abundance in estuaries 16 was high and is believed to play a role in delta habitat formation (Simenstad et al. 2003). 17 Without more specific information, (as noted in the Evaluation Criteria subsection above) 18 the assessment of LWD, especially as it relates to fish-bearing streams, and the 19 assessment of sediment are used to assess the likelihood of adverse effects to these areas. 20 Although LWD may be delivered to the aquatic environment from banks and slopes 21 adjacent to lakes, reservoirs, and nearshore marine areas, the relative supply of LWD 22 from fish-bearing streams to these habitats is used as the primary evaluation criteria to 23 analyze environmental effects. This is because streams would be the primary sources of 24 wood that would reach lakes and the nearshore marine areas (especially of the larger 25 pieces that would play a major role in habitat for fish and aquatic insects). 26
No Action Alternative 1-Scenario 2 27 Under No Action Alternative 1-Scenario 2, the supply of LWD from fish-bearing streams 28 on the westside would likely be low (See LWD Assessment discussion in subsection 29 4.7.1, Riparian Processes). Under this alternative the westside LWD equivalent buffer 30 area index for fish-bearing streams is only 60 or 38 percent based on the 100-year and 31 250-year site potential tree height, respectively, indicating a moderate to high likelihood 32 of inadequate LWD supply for lakes, reservoirs, and nearshore marine areas. The 33 eastside LWD supply would be greater at 70 and 57 percent of full protection based on 34 the 100-year and 250-year site potential tree height. This would result in a moderate 35 likelihood of inadequate LWD supply for eastside lakes and reservoirs. 36
This alternative has a moderate likelihood of continued management-related coarse 37 sediment inputs and a high likelihood of continued management-related fine sediment 38 inputs (subsection 4.7.1, Riparian Processes, Coarse Sediment, and Fine Sediment). This 39 could have adverse effects on nearshore conditions in lakes and reservoirs, especially 40 spawning areas. For nearshore marine areas the overall effect may be less pronounced as 41 these habitats have often been heavily affected by many other actions especially those 42 associated with removal of sediment (e.g., channel dredging in major estuaries), and other 43
Fish and Fish Habitat Draft EIS
4-190
Chapter 4 nearshore modifications, and active LWD removal for other uses to protect property or to 1 abate navigational hazards. Overall, No Action Alternative 1-Scenario 2 would have a 2 moderate likelihood of adverse effects to lakes, reservoirs, and nearshore marine areas 3 since these areas are less affected by actions that occur in streams and rivers, than are the 4 stream systems themselves. 5
No Action Alternative 1-Scenario 1 and Alternatives 2 and 3 6 The likelihood for adverse habitat effects in lakes, reservoirs, and nearshore marine areas 7 from an LWD standpoint would be low to very low in western Washington under No 8 Action Alternative 1-Scenario 1 and Alternatives 2 and 3. Under this group of 9 alternatives, the LWD equivalent buffer area index for westside fish-bearing streams was 10 95 or 82 percent based on the 100-year and 250-year site potential tree height, 11 respectively. Results would be similar in eastern Washington with LWD equivalent 12 buffer area indexes of 94 or 87 percent based on the 100-year and 250-year site potential 13 tree height, respectively. Some LWD reduction to these systems could occur under No 14 Action Alternative 1-Scenario 1 and Alternatives 2 and 3 because LWD inputs to non-15 fish-bearing streams could be low, but these sources would likely be of lower importance 16 to these areas. However, LWD inputs under this group of alternatives are expected to be 17 higher than LWD inputs under No Action Alternative 1-Scenario 2. The overall benefit 18 of increased LWD recruitment may not be realized as these habitats have often been 19 heavily affected by many other actions, especially those associated with removal of 20 sediment (e.g., channel dredging in major estuaries), other nearshore modifications, and 21 active LWD removal for other purposes (e.g. personal use, property protection, and 22 abatement of navigational hazards). 23
Sediment supply to lakes, reservoirs, and nearshore areas would primarily be moderate 24 under No Action Alternative 1-Scenario 1 and Alternatives 2 and 3 (subsection 4.7.1, 25 Riparian Processes, Coarse Sediment and Fine Sediment). The sediment equivalent 26 buffer area index is 91 percent for 30-foot buffers, but only 73 percent for 200-foot 27 buffers, suggesting a moderate likelihood for continued management-related sediment 28 inputs (DEIS Appendix B). RMAPs would reduce the likelihood of fine sediment inputs 29 from roads under this group of alternatives. 30
Alternative 4 31 Protection of LWD-related habitats would be highest under Alternative 4 with an LWD 32 equivalent buffer area index of 100 percent for all fish-bearing streams based on both site 33 potential tree heights on both sides of the State. Alternative 4 would have a very low 34 likelihood of management-related sediment inputs as its sediment equivalent buffer area 35 index exceeds 90 percent for all streams, and it also has a “no net increase” in road 36 density requirement. Alternative 4 would have a very low likelihood of adversely 37 affecting these areas because of high LWD recruitment and low management-related 38 sediment inputs. 39
Draft EIS Fish and Fish Habitat
4-191
Chapter 4 4.8.3.8 Water Temperature 1 Overview of Effects 2 An overview of the effects of the alternatives on temperature is presented in this 3 subsection. For perspective, it is important to note that factors important in controlling 4 temperature (primarily stream shade) have already been greatly diminished along many 5 streams within the State due to historical logging practices, as well as other land use 6 practices (e.g., agriculture, urbanization) (subsection 3.7.1.6, Historic Protection of 7 Riparian Areas, and subsection 3.7.1.7, Current Condition of Riparian Areas). However, 8 the current Washington Forest Practices Rules, as well as those in effect on January 1, 9 1999, provide for substantially more temperature protection by requiring greater shade 10 retention, especially along fish-bearing streams, than has been provided in the past. 11 Therefore, the amount of shade within riparian zones on covered forestlands is increasing 12 due to tree growth and because the Washington Forest Practices Rules under any of the 13 alternatives would result in the retention of most canopy cover along fish-bearing streams 14 during harvest operations. Along non-fish-bearing streams, the amount of shade would 15 likely remain close to baseline conditions or increase depending on the alternative. Note 16 that increases in shade due to tree growth would be very slow to occur and represent 17 long-term improvements. Changes in shade due to greater retention during harvest 18 operations can have positive effects over the short-term as well as long-term. The 19 following paragraph summarizes the likelihood of temperature effects by alternative. 20
Because of the shade rule, No Action Alternative 1-Scenario 2 has a moderate likelihood 21 of temperature increases along fish-bearing streams. The lack of a shade rule or other 22 forms of significant tree retention along non-fish-bearing streams would result in a very 23 high likelihood of increased temperatures along these streams. However, other factors 24 such as changes in groundwater temperatures from adjacent clearcuts (subsection 4.5.1, 25 Surface Water Quality) may affect stream temperatures and the survival and production 26 of fish in some systems. 27
The reduction of summer high temperatures along fish-bearing streams would be slightly 28 enhanced under No Action Alternative 1-Scenario 1 and Alternatives 2 and 3 relative to 29 No Action Alternative 1-Scenario 2. Therefore, the likelihood of elevated temperatures 30 in fish-bearing streams would be low relative to No Action Alternative 1-Scenario 2. As 31 a result of riparian buffers along Np streams and due to the presence of unstable 32 landforms and other sensitive sites, shade retention and related temperature control along 33 non-fish-bearing streams would be greatly enhanced under No Action Alternative 1-34 Scenario 1, Alternative 2, and Alternative 3 compared with No Action Alternative 1-35 Scenario 2 reducing the likelihood of elevated summer temperatures. 36
Under Alternative 4, the recovery and/or maintenance of stream temperatures would be 37 more likely relative to No Action Alternative 1-Scenario 1, but only slightly more so 38 along fish-bearing streams (since most shade would already be retained under these 39 alternatives). The degree of recovery and/or maintenance provided by Alternative 4 40 would be even greater compared with No Action Alternative 1-Scenario 2 because of 41 wider RMZs provided under Alternative 4. 42
Fish and Fish Habitat Draft EIS
4-192
Chapter 4 The general rankings among the alternatives described in the preceding paragraphs, 1 would hold true for both west and eastside streams. A detailed analysis of the 2 alternatives is presented in the following subsections. 3
Detailed Effects Analysis 4 Maintenance of natural water temperature regimes is important for all salmonids. As 5 described earlier, changes in water temperatures can have both lethal and sub-lethal 6 effects that can affect the species long-term fitness (Bjornn and Reiser 1991; Washington 7 Department of Ecology 2002a). Of the salmonids considered in this document, bull trout 8 have the lowest water temperature requirements and appear the most sensitive to 9 increases in temperature (Wydoski and Whitney 2003). 10
All of the alternatives have some potential for reduced shade and increased water 11 temperatures related to blowdown, yarding corridors, existing and future stream 12 crossings, and existing stream adjacent parallel roads. No Action Alternative 1-Scenario 13 1 and Alternatives 2 and 3 include slightly lower levels of shade retention for exempt 20-14 acre parcels, which may increase the potential for elevated water temperatures in some 15 areas. These effects are described in more detail in subsection 4.7.2.1 (Evaluation of 16 Alternatives, 20-Acre Exemption Rule). The effects of roads and yarding corridors are 17 expected to be relatively small, but are difficult to quantify. 18
No Action Alternative 1-Scenario 2 19 Under No Action Alternative 1-Scenario 2, RMZ widths for the eastside and westside do 20 not generally meet the 0.75 site potential tree height shade evaluation criterion for Type 21 1, 2, or 3 streams based on the 100-year and 250-year site potential tree heights. No 22 Action Alternative 1-Scenario 2 includes a shade rule that includes minimum shade levels 23 by elevation and water quality class (subsection 4.5.1, Surface Water Quality), but tree 24 retention requirements would be limited to the maximum RMZ width. Type 4 and 5 25 streams would not receive any protection except under limited circumstances, and RMZs 26 would be much smaller than needed for full shade protection. 27
The effects of increased stream temperatures in Type 4 and 5 streams on fish-bearing 28 stream temperatures are not clear (subsection 4.5.1, Surface Water Quality). Adverse 29 water temperature effects are generally more common in eastside watersheds because the 30 climate is warmer, and forest types are generally more open compared to the westside. 31 Overall, No Action Alternative 1-Scenario 2 is expected to have a moderate likelihood of 32 not meeting salmonid temperature requirements on the east and westside. 33
No Action Alternative 1-Scenario 1 and Alternatives 2 and 3 34 Note: The reviewer is reminded to consider the differences in effectiveness over time of 35 the adaptive management program among this group of alternatives (No Action 36 Alternative 1-Scenario 1[low], Alternative 2 [high], Alternative 3 [moderate]) in 37 evaluating the effects discussed below (subsection 4.1.5, Adaptive Management). 38
For No Action Alternative 1-Scenario 1 and Alternatives 2 and 3, RMZs for Type S and 39 F streams would be wider relative to No Action Alternative 1-Scenario 2 and would 40 include both no-harvest and selective harvest zones. Under some site class situations 41
Draft EIS Fish and Fish Habitat
4-193
Chapter 4 (e.g., Option 2 with Site Class III, IV, or V), the no-harvest portions of the RMZs would 1 provide complete shade protection based on the 100 year site potential tree height. Under 2 some situations, Option 1 could provide slightly less protection than Option 2 because 3 thinning in the inner zone could remove some shade-producing trees closer to the stream. 4 However, under No Action Alternative 1-Scenario 1 and Alternatives 2 and 3, RMZs 5 must maintain minimum canopy closure under the shade rule, regardless of the riparian 6 management option chosen by the landowner. 7
No Action Alternative 1-Scenario 1 and Alternatives 2 and 3 also provide additional 8 protection for eastside streams within the bull trout overlay by protecting all trees that 9 provide shade within 75 feet of the channel. The bull trout overlay includes those 10 portions of eastern Washington containing bull trout habitat as identified on the WDFW’s 11 bull trout map (WAC 222-16-010). 12
The shade rule protects trees that currently provide shade, but does not account for the 13 future growth of trees that might eventually provide shade. Consequently, there is some 14 uncertainty about the extent to which these rules would result in adequate protection, 15 given the silvicultural prescriptions to be implemented in the inner zones. Overall, the 16 likelihood of adverse temperature effects under No Action Alternative 1-Scenario 1 and 17 Alternatives 2 and 3 are considered low for Type S and F westside streams, moderate for 18 eastside streams outside the bull trout overlay, and low for eastside streams within the 19 bull trout overlay, which includes most of the project area on the eastside (subsection 20 4.5.1.2, Evaluation of Alternatives). Overall, temperature conditions and therefore 21 protection of fish resources are expected to improve relative to current conditions under 22 these alternatives because shade levels in previously harvested riparian areas would 23 continue to increase as tree growth continues into the future. Areas scheduled to be 24 harvested in the future would be provided greater protection than what was previously 25 required. 26
The bull trout overlay does not apply to the westside, although bull trout are present in 27 many westside watersheds. Under Option 1, the largest trees, which likely have the 28 greatest potential to provide shade, would be retained in the inner zone. Under Option 2, 29 the lack of the bull trout overlay would have no effect because no-harvest buffers would 30 be 80 to 100 feet wide depending upon stream width, which are wider than the 75 feet 31 width that applies in the bull trout overlay. Overall, the effect of not implementing the 32 “all available shade” rule on the westside is expected to be small. 33
On both the east and the westsides, protection of seeps and springs that provide cold 34 water is important for bull trout, which have lower temperature requirements compared to 35 other salmonids (subsection 3.8.3.1, Pacific Salmon and Trout – General, Bull Trout). 36 Sensitive sites (headwall seeps, side-slope seeps, and headwater springs) are provided 56-37 foot radius, no-harvest patch buffers under No Action Alternative 1-Scenario 1 and 38 Alternatives 2 and 3 that would provide some thermal protection. In addition, Ecology is 39 considering revisions to Washington State temperature standards (Chapter 5, Cumulative 40 Effects). These revisions are likely to include species- and life stage-specific standards to 41 be applied to stream reaches where bull trout are present or are expected to be present. 42
Fish and Fish Habitat Draft EIS
4-194
Chapter 4 No Action Alternative 1-Scenario 1 and Alternatives 2 and 3 would provide RMZs for at 1 least 50 percent of the length of Type Np stream reaches. Based on observed harvest 2 practices, additional Type Np and Ns protection results from the application of the 3 unstable slopes rules, which often leads to the retention of no-harvest buffers along more 4 than 50 percent of Type Np streams (Jeff Grizzel, Personal Communication, Washington 5 DNR April 6, 2004). In some cases, these buffer requirements would include 6 groundwater seeps and hyporheic zones that provide cool water. However, no RMZs are 7 required on Type Np streams on exempt 20-acre parcels. 8
Partial protection to small Type NP streams may occur within about 10 years of harvest 9 due to the growth of overhanging shrubs and young trees. Some increases in water 10 temperature within Type Np streams are expected following adjacent timber harvests. 11 Nevertheless, there is still high uncertainty regarding the influence Type Np streams on 12 downstream temperatures in Type S and F streams. Type Ns streams would not receive 13 any direct protection, but this should generally not affect fish because these streams 14 usually do not contain water during the summer low-flow period. 15
Overall, No Action Alternative 1-Scenario 1and Alternatives 2 and 3 are considered to 16 have a low to moderate likelihood of adverse temperature effects. Most westside regions 17 would have a low likelihood while a moderate likelihood applies to areas where Option 1 18 would be implemented and in lower elevation basins (less than 1,640 feet) where water 19 temperatures are more sensitive to changes in shade. A moderate likelihood also applies 20 to the eastside in areas outside the bull trout overlay. 21
One area of moderate uncertainty is the effect of nearby clearcuts on air temperatures 22 surrounding streams, even in the presence of RMZs. Substantial increases in air 23 temperatures could lead to negative effects on water temperatures, but the relationship is 24 not well understood. Another area of uncertainty involves the effects of nearby clearcuts 25 on groundwater temperature. Evidence of a cause-and-effect relationship between 26 groundwater temperatures and surface water temperatures is not available, but has been 27 hypothesized by Brosofske et al. (1997). 28
Alternative 4 29 Alternative 4 would include no-harvest RMZs for all streams. With the exception of 30 streams greater than 30 percent gradient, the widths of the RMZs are expected to provide 31 full shade protection relative to the 0.75 site potential tree height criterion. Consequently, 32 Alternative 4 has a very low likelihood of adverse temperature effects. Alternative 4 also 33 has some uncertainty concerning the effects of upslope clearcuts on stream temperature. 34 However, since RMZs would be wider under Alternative 4, the likelihood of adverse 35 effects is lower than under No Action Alternative 1-Scenario 1 and substantially lower 36 than under No Action Alternative 1-Scenario 2. 37
4.8.3.9 Dissolved Oxygen 38 Overview of Effects 39 The effects of the alternatives on maintaining instream dissolved oxygen levels are 40 analyzed in this subsection. Maintaining high dissolved oxygen levels is critical to most 41
Draft EIS Fish and Fish Habitat
4-195
Chapter 4 aquatic organisms. From an historical perspective, forestry-related occurrences of low 1 dissolved oxygen concentrations (particularly in sediment where they often have adverse 2 effects incubating salmonid eggs), have been reduced over time (subsection 3.4.2.3, 3 History of Forest Practices Affecting Erosion and Sedimentation, and subsection 4.5.1, 4 Surface Water Quality). Therefore, compared to baseline conditions, the dissolved 5 oxygen concentrations are not expected to decrease under any of the alternatives, 6 although specific locations may vary. The following paragraphs address the likelihood of 7 reduced oxygen concentrations by alternative in a comparative manner. 8
No Action Alternative 1-Scenario 2 would have a moderate likelihood of maintaining 9 adequate dissolved oxygen levels. The likelihood is moderate because there is an 10 increased chance of elevated water temperatures and continued management-related 11 sediment inputs, which could reduce dissolved oxygen levels. Lack of adequate 12 protection of dissolved oxygen has the potential to negatively affect developing salmon 13 and trout eggs. 14
No Action Alternative 1-Scenario 1 and Alternatives 2 and 3 would provide greater 15 protection of sediment inputs and stream temperatures, reducing the likelihood of low 16 dissolved oxygen levels. 17
Alternative 4 has a very low likelihood of adversely affecting dissolved oxygen levels 18 due to greater temperature and sediment-related protections than other alternatives. 19
Detailed Effects Analysis 20 Maintenance of sufficient levels of dissolved oxygen is critical for all fish species and 21 especially salmon and trout (Spence et al. 1996). Reduced levels can affect growth and 22 development of all stages, swimming ability, and juvenile and adult migration success. 23 For salmonids, oxygen levels of 8 to 9 mg/l are generally needed to ensure normal 24 physiological function of salmonids (Bjornn and Reiser 1991, as cited in Spence et al. 25 1996). Current State dissolved oxygen water quality criteria for Class AA and A streams 26 are 9.5 and 8.0 mg/l, respectively. However, even higher levels may be needed for 27 incubating eggs (Hicks 2002). 28
One of the most critical areas to maintain dissolved oxygen levels is incubating salmonid 29 eggs in the gravel as concentrations in the gravel are often less than those in the stream 30 water column (Hicks 2002). Dissolved oxygen concentration and supply are related to 31 stream temperature and fine sediment (Chapman and McLeod 1987). Low dissolved 32 oxygen has a negative effect on fish and aquatic insects. Fine sediment within the 33 streambed can restrict dissolved oxygen from reaching incubating eggs (Iwamoto and 34 Salo 1978). Generally, the effects of the alternatives on dissolved oxygen would be tied 35 to how well the alternatives protect stream temperature and, most importantly, addition of 36 fine sediment. While other factors such as addition of stream nutrients and highly 37 biodegradable organic matter can affect dissolved oxygen levels in water systems, these 38 are usually of minor concern in forest streams (Spence et al. 1986; Hicks et al. 1991), and 39 would have very low likelihood of affecting dissolved oxygen levels under any 40 alternative. 41
Fish and Fish Habitat Draft EIS
4-196
Chapter 4 No Action Alternative 1-Scenario 2 1 No Action Alternative 1-Scenario 2 would have the highest likelihood of management-2 related fine sediment inputs and elevated stream temperatures of any of the alternatives. 3 This is primarily due to its relatively low equivalent buffer area index for sediment. The 4 low sediment equivalent buffer area index stems from narrower RMZs and greater soil 5 disturbance allowed near non-fish-bearing streams relative to the other alternatives. 6 Overall the likelihood for elevated stream temperatures is considered moderate while the 7 likelihood for continued management-related sediment inputs is high on both the east and 8 westsides of the State. The resulting overall likelihood of low dissolved oxygen levels is 9 considered to be moderate. The lower rating for dissolved oxygen is based on the fact 10 that dissolved oxygen, while very important for all aquatic life, is less often noted as 11 being a concern for salmonids from forest practices (Spence et al. 1996; Hicks et al. 12 1991) and is not reported as being as frequent of a water quality concern in State streams 13 as temperature, as indicated by the relative frequency of 303(d) listed streams. 14
No Action Alternative 1-Scenario 1, Alternative 2, and Alternative 3 15 No Action Alternative 1-Scenario 1 and Alternatives 2 and 3 would provide better 16 protection of sediment input and stream temperatures than No Action Alternative 1-17 Scenario 2. The likelihood of management-related fine sediment inputs is moderate, and 18 the likelihood of adequate temperature protection is moderate to high, due primarily to: 19 1) increased buffer widths on S and F streams, 2) shade rules on the westside and the bull 20 trout overlay for most streams on the eastside, and 3) moderate RMZs on all non-fish-21 bearing streams. Based on the relative rating of these two factors and the relative 22 potential for dissolved oxygen problems in streams as noted in No Action Alternative 1-23 Scenario 2, the likelihood of low dissolved oxygen levels is low to moderate for this 24 group of alternatives. 25
Alternative 4 26 Alternative 4 would have a lower likelihood of low dissolved oxygen levels relative to 27 No Action Alternative 1-Scenario 1 and even lower likelihood relative to No Action 28 Alternative 1-Scenario 2. This is mainly due to adequate protection for stream 29 temperatures and management-related sediment inputs. The equivalent buffer area index 30 for sediment is considered at 100 percent of maximum, and other factors would reduce 31 sediment inputs and, therefore, reduce the potential for low dissolved oxygen levels in the 32 substrate, where salmonid eggs may be developing. Alternative 4 also has a “no net 33 increase” clause requirement for roads, which is not found in other alternatives. Since 34 roads are often the main source of fine sediment input to streams from timber operations 35 (Furniss et al. 1991) this would further reduce the potential for sediment inputs, and its 36 related effects on dissolved oxygen, relative to other alternatives. With large buffers on 37 all streams, the likelihood of elevated temperatures would be very low across the State. 38
4.8.3.10 Forest Chemicals 39 Overview of Effects 40 The effects of the alternatives on forest chemical entry into streams are analyzed in this 41 subsection. Relative to historical chemical use, all alternatives represent an 42
Draft EIS Fish and Fish Habitat
4-197
Chapter 4 improvement. Compared to baseline conditions, the amount of chemicals likely to enter 1 streams where aquatic organisms may be affected is expected to decrease under any of 2 the alternatives. While the Washington Forest Practices Rules under each alternative 3 govern the application of forest chemicals, other laws regulate the licensing of chemicals 4 and the individuals who apply them (subsection 4.5.1, Surface Water Quality). The 5 following paragraphs address the degree to which each alternative prevents forest 6 chemical entry to surface waters and wetlands. 7
There is a moderate likelihood that forest chemicals would enter surface waters and 8 wetlands under No Action Alternative 1-Scenario 2. The moderate likelihood is based on 9 the more limited spray buffers required by the Washington Forest Practices Rules under 10 this alternative. 11
There is a low to moderate likelihood that forest chemicals would enter surface waters 12 and wetlands under No Action Alternative 1-Scenario 1 and Alternatives 2 and 3. The 13 low likelihood is based on the wider spray buffers provided to fish-bearing waters under 14 these alternatives, however, some direct entry to dry, non-fish-bearing channels could 15 occur that could ultimately reach fish-bearing streams when flow returns. The moderate 16 likelihood applies to these situations. 17
There is a low likelihood that forest chemicals would enter surface waters and wetlands 18 under Alternative 4. This is because a minimum 50-foot no-spray buffer would be 19 present on all streams. 20
Detailed Effects Analysis 21 The application of forest chemicals commonly occurs on commercial forestlands to 22 decrease disease from fungal and insect pests and to decrease competition from 23 undesirable vegetation (Washington Forest Practices Board 2001a, Appendix J). Of these 24 categories of forest chemicals, herbicides are the most commonly used. Application 25 techniques include hand, machine, and aerial spraying. Improper application of forest 26 chemicals that result in delivery to fish-bearing streams can result in direct acute losses of 27 fish and chronic reductions in fitness through disease, stress, or reduced feeding (Norris 28 et al. 1991; Spence et al. 1996). 29
It should be recognized that evidence of acute or chronic negative effects of forest 30 chemical use to fish under the Washington Forest Practices Rules in effect on January 1, 31 1999 (No Action Alternative 1-Scenario 2) is generally lacking. However, it is also clear 32 that many of the commonly used chemicals have severe effects under laboratory 33 conditions and if improperly used, applied during adverse conditions, or otherwise are 34 allowed to enter fish-bearing waters at toxic concentrations, these effects could be 35 realized in the environment. Consequently, the use of many forest chemicals requires a 36 Class IV-Special permit (WAC 222-16-070) under all alternatives. 37
No Action Alternative 1-Scenario 2 38 Under No Action Alternative 1-Scenario 2, flowing streams and other areas with surface 39 water would have a 25-foot or 50-foot buffer that would exclude machine and aerial 40 spraying, respectively. However, no buffers are required for hand spraying. Based on 41
Fish and Fish Habitat Draft EIS
4-198
Chapter 4 required buffer widths, No Action Alternative 1-Scenario 2 is considered to have low to 1 moderate likelihood of negative effects to fish. 2
No Action Alternative 1-Scenario 1 and Alternatives 2 and 3 3 Based on required buffer widths, No Action Alternative 1-Scenario 1 and Alternatives 2 4 and 3 are expected to have a low likelihood of negative effects to fish. Under No Action 5 Alternative 1-Scenario 1 and Alternatives 2 and 3, buffers for aerial application would 6 include RMZ inner zones for fish-bearing waters plus an additional buffer (up to 325 7 feet) and offset (up to 50 feet) dictated by wind conditions and application height. Type 8 N streams with flowing water would have buffers ranging from 50 to 100 feet depending 9 upon wind conditions and application height. However, No Action Alternative 1-10 Scenario 1 and Alternatives 2 and 3 would allow spraying directly over seasonal streams 11 when water is not present. Consequently, persistent forest chemicals could be delivered 12 to fish-bearing streams when flow returns. Some uncertainty is present under No Action 13 Alternative 1-Scenario 1 and Alternatives 2 and 3 because implementation of buffer 14 widths relies entirely on the skill and professional judgment of the pilot applying the 15 chemical. Implementation of the buffers requires that pilots accurately judge wind speed, 16 wind direction relative to the stream, and distance from the stream. In addition, direct 17 spraying is allowed on Type Ns streams when no surface water is present, and persistent 18 chemicals could eventually be transported to fish-bearing waters. 19
Alternative 4 20 Alternative 4 requires that no forest chemicals be used within 50 feet of all typed streams, 21 including hand spraying, and that all plants with cultural value be protected from 22 pesticides. Alternative 4 would offer very high protection compared to both scenarios of 23 No Action Alternative 1 because chemical application would not occur within 50 feet of 24 all streams. The requirement under Alternative 4 that plants with cultural value be 25 protected is problematic for implementation of the prescription. It is unclear which plants 26 are considered to have cultural value and how they would be identified and protected in 27 the field. Consequently, in areas where extensive field surveys would be required to 28 protect plants of cultural value, aerial pesticide spraying may be eliminated as a practical 29 application technique. 30
4.8.3.11 Fish Passage 31 Overview of Effects 32 The effects of the alternatives on fish passage at roads and in streams are analyzed in this 33 subsection. Proper fish passage is essential to ensure that both adult and juvenile fish can 34 access suitable habitat. From an historical perspective, blockages to fish passage have 35 been substantially reduced over time because of increased requirements to provide fish 36 passage at culverts, improvements in road construction methods, the frequency of 37 maintenance, and the implementation of BMPs (subsection 3.4.2.3, History of Forest 38 Practices Affecting Erosion and Sedimentation). Therefore, compared to baseline 39 conditions, fish passage is expected to increase under any of the alternatives. The 40 following paragraphs address the effects of the alternatives on fish passage in a 41 comparative manner. 42
Draft EIS Fish and Fish Habitat
4-199
Chapter 4 Fish passage can be adversely affected by: 1) high suspended or bedload sediment; 1 2) high stream temperatures; 3) improper installation of culverts on fish-bearing streams; 2 4) improper identification of fish-bearing streams; and 5) loss of pool structures in high-3 gradient streams, due to the loss of LWD or as a result of channel scour (Bjornn and 4 Reiser 1979; Spence et al. 1996; Palmisano et al. 1993; Murphy 1995). 5
Fish passage requirements for newly installed culverts would be similar among the four 6 alternatives for new roads because all crossings require Hydraulic Project Approvals 7 from WDFW, which would determine the requirement for acceptable fish passage and 8 would approve installation methods. Under No Action Alternative 1-Scenario 1 and 9 Alternatives 2, 3, and 4, changes in stream crossing standards specific to anadromous fish 10 passage (WAC 222-24-040) are deleted from the Washington Forest Practices Rules, and 11 standards are deferred to WDFW as part of a Hydraulic Project Approval as defined in 12 the Hydraulic Code (WAC 220-110). Hydraulic Project Approvals are also required 13 under No Action Alternative 1-Scenario 2. Consequently, the alternatives are essentially 14 equivalent for new road construction. 15
However, the alternatives vary in the level and schedule for repairs of previously installed 16 culverts that were installed improperly, without authorization, or that have subsequently 17 become barriers to fish passage. The differences in water typing among the alternatives 18 also affect which culverts must be fish-passable. 19
Substantial differences are present among the alternatives for identifying and modifying 20 or replacing existing culverts that are passage barriers. As mentioned earlier, criteria for 21 the construction of stream crossing structures under the January 1, 1999 Washington 22 Forest Practices Rules are based, in part, on whether a stream is fish-bearing (WAC 222-23 24-040). For example, culverts must be a minimum diameter of 24 inches for streams 24 with anadromous fish and a minimum diameter of 18 inches for streams with resident 25 game fish. Therefore, the assumptions made in determining a fish-bearing stream are 26 critical for evaluating whether existing stream crossings meet the Washington Forest 27 Practices Rules. 28
The likelihood of correcting barriers to fish passage under No Action Alternative 1-29 Scenario 2 is low. This is because continued management-related inputs of coarse 30 sediment are likely to produce aggraded channel conditions in some locations. Further, it 31 is because the water typing system is less likely to properly identify fish-bearing streams, 32 and the lack of RMAPs would not ensure all road-related barriers to fish passage are 33 corrected. 34
The likelihood of correcting barriers to fish passage under No Action Alternative 1-35 Scenario 1 and Alternatives 2 and 3 is high. This is because these alternatives would 36 reduce management-related inputs of coarse sediment that could aggrade channels, 37 improve the identification of fish-bearing waters through the development and 38 implementation of a new water typing system, and correct all road-related barriers to fish 39 passage by 2016 through the implementation of RMAPs. 40
Fish and Fish Habitat Draft EIS
4-200
Chapter 4 The likelihood of correcting barriers to fish passage under Alternative 4 is slightly higher 1 than under No Action Alternative 1-Scenario 1 and Alternatives 2 and 3, and 2 substantially higher than under No Action Alternative 1-Scenario 2 because it accelerates 3 the schedule for implementing RMAPs and requires a cap on road densities. Like No 4 Action Alternative 1-Scenario 1 and Alternatives 2 and 3, it also reduces management-5 related inputs of coarse sediment that could aggrade channels and implements a new 6 water typing system. 7
Detailed Effects Analysis 8 Concerns for fish passage on commercial forestlands usually refer to passage through 9 culverts at stream crossings. Culverts as barriers to fish passage are also a well-10 documented problem on Federal lands in the Pacific Northwest (U.S. General Accounting 11 Office 2001). Reduced fish passage or complete blockages at culverts are usually the 12 result of undersized culverts or culverts with water velocities too high for their length, 13 sub-optimal placement relative to stream gradient and vertical drop, and lack of 14 downstream holding pools (Hicks et al. 1991). However, other factors such as blockages 15 caused by elevated stream temperatures, aggraded channel conditions, high suspended 16 sediment levels, and loss of step-pool habitat can also restrict fish passage (Furniss et al. 17 1991; Washington Department of Ecology 2002a). 18
Historically, concerns were raised about large log jams and excessive stream loading 19 from logging slash and debris that was left in streams, affecting fish passage that led to 20 stream cleaning programs in some western states (Maser and Sedell 1994). However, the 21 concerns over passage at log jams were minimized, and some stream cleaning programs 22 were found to be detrimental. Consequently, resource agencies are now more careful 23 about permitting or requiring LWD removal from streams. 24
Salmon and trout have a powerful instinctual desire to move upstream during spawning 25 migrations, which leads them to pass seemingly insurmountable obstacles such as 26 waterfalls. However, biological and physical limitations can restrict their movements. 27 These limitations include burst swimming speed and duration, leaping ability, and water 28 velocities and depth (Furniss et al. 1991; Bjornn and Reiser 1991; Dane 1978). Factors 29 that affect burst swimming speeds and duration include fish size and condition. Larger 30 fish can swim faster and fish approaching senescence have reduced capacity or require 31 longer rest periods between bursts (Bjornn and Reiser 1991; Powers and Orsborn 1985). 32 Leaping ability is a combination of swimming speed and the availability of suitably sized 33 pools from which to leap. Optimally sized pools allow fish to reach maximum speed at 34 the proper angle to make the leap (Watts 1974; Baker and Vatapka 1990; Powers and 35 Orsborn 1985). Swimming speeds and water velocities determine the length of pipe 36 through which a fish can successfully maneuver (Washington Department of Fish and 37 Wildlife 1999a; Baker and Vatapka 1990). 38
Culverts become barriers when their physical characteristics exceed the capacity of fish 39 biology. Barriers can occur to both juveniles moving upstream and downstream and 40 adults moving upstream. Common problems include perched outlets with unsuitable 41 leaping pools, culverts that become dry during summer months, culverts that are too long, 42
Draft EIS Fish and Fish Habitat
4-201
Chapter 4 culverts with high gradients resulting in high water velocities, and culverts with 1 inadequate resting places (Furniss et al. 1991; Baker and Vatapka 1990). In addition, 2 undersized or poorly constructed culverts that blowout during peak flows can become 3 obstacles until fixed. 4
Also, debris flows are considered the primary blockage of upstream passage on streams 5 when they trap large amounts of sediment (Bryant 1983). Debris flows caused either 6 from culvert outwash, road failure, or hillslope debris slides could cause this type 7 blockage. High bed sediment load in streams has also been found to cause areas to go 8 dry during some flows restricting migration at least temporarily (Hartmen et al. 1995). 9 High temperatures or high suspended sediment loads also can cause temporary blockages 10 (Newcombe and MacDonald 1991; Whitman et al. 1982; Lloyd 1987; Hicks 2002; 11 Washington Department of Ecology 2002a). 12
As noted earlier, the assumptions used in deciding whether a stream is fish-bearing are 13 critical in evaluating whether existing stream crossings are adequate to supply fish 14 passage. The stream classification system used among the alternatives would affect this 15 determination. 16
No Action Alternative 1-Scenario 2 17 The January 1, 1999 Washington Forest Practices Rules water classification system 18 would be used under this alternative. It had the five follwing categories: 19
• Type 1: All waters inventoried as “Shorelines of the State”; highly productive fish-20 bearing waters 21
• Type 2: Highly productive fish-bearing waters not designated as Type 1 streams 22 • Type 3: Fish-bearing waters with moderate to slight fish use 23 • Type 4: Perennial non-fish-bearing streams 24 • Type 5: Generally seasonal non-fish-bearing streams 25
Numerous additional water typing criteria based upon channel width, gradient, flow, size 26 of impoundment (if present), and level of domestic use are utilized to categorize a stream 27 (WAC 222-16-030). Recent checking of this classification system has shown that many 28 fish-bearing waters were untyped or mistyped as non-fish-bearing waters. However, the 29 interim typing system in the current Washington Forest Practices Rules, which accounts 30 for much of this mistyping, is assumed to continue even under No Action Alternative 1-31 Scenario 2. 32
Under No Action Alternative 1-Scenario 2, the interim water typing criteria would 33 continue to be used, and there would be no systematic upgrade of culverts with fish 34 passage problems. Some culverts would be identified and fixed as part of Watershed 35 Analysis, but Watershed Analysis is voluntary for private landowners. Consequently, 36 problem culverts could remain barriers until a forest practices application was received 37 for a nearby harvest, or the State identified the problem through a State-sponsored 38 Watershed Analysis. Based upon the forest practices application or Watershed Analysis, 39 Washington DNR could then require repair or replacement of problem culverts. WDFW 40
Fish and Fish Habitat Draft EIS
4-202
Chapter 4 could also require correction of blocking culverts under its own Hydraulic Project 1 Approval authority, or work cooperatively with landowners and funding entities to 2 correct problem culverts. 3
No Action Alternative 1-Scenario 1 and Alternatives 2 and 3 4 No Action Alternative 1-Scenario 1 and Alternatives 2 and 3 would require new stream 5 typing systems that would increase the accuracy of fish-bearing stream identification and 6 would expedite correction of fish passage problems. 7
Under No Action Alternative 1-Scenario 1 and Alternatives 2 and 3 a new stream typing 8 system would be implemented for State and private forestlands (DEIS Appendix B). The 9 new system would include: 10
• Type S: All waters inventoried as “Shorelines of the State” 11 • Type F: Waters not classified as Type S, which contain fish habitat 12 • Type N: Waters not classified as Type S or F, which do not contain fish habitat and 13
are either perennial streams (Type Np) or seasonal (Type Ns) 14
Identification of Type F waters would occur using a model, currently under development, 15 that is likely to be based on stream gradient, drainage size, and other factors. Type F 16 waters are likely to include all streams currently categorized as Type 2 and Type 3, plus a 17 portion of Type 4 streams. Errors in stream types from the model can be corrected based 18 upon field observations. Implementation of the new model is expected to substantially 19 increase the total miles of streams classified as fish habitat and would thus, necessitate 20 that fish passage is provided for all life stages of fish on those streams, a substantial 21 improvement over No Action Alternative 1-Scenario 2. 22
Under No Action Alternative 1-Scenario 1 and Alternatives 2 and 3, landowners would 23 be required to upgrade road networks to current standards by 2016, and large forest 24 landowners must prepare an RMAP for their entire property by December 2005. 25 Included in the Washington Forest Practices Board Manual are flow criteria for a given 26 culvert length and fish species, and specific requirements for prioritizing roadwork based 27 upon fish passage (Washington Forest Practices Board 2001b). Passage criteria for fish 28 through culverts appear adequate for most species and life stages when compared to 29 criteria reported by Powers and Orsborn (1984). However, water velocity criteria for 30 trout are 50 to 100 percent higher than criteria reported in Powers and Orsborn (1984). 31 Consequently, passage protection may not be adequate under all circumstances for trout. 32 In combination, the new plan, passage criteria, and stream-typing system should result in 33 substantial improvements in fish passage within the next 15 years under No Action 34 Alternative 1-Scenario 1 compared to No Action Alternative 1-Scenario 2. No Action 35 Alternative 1-Scenario 1 and Alternatives 2 and 3 do not require upgrades to all culverts. 36 Upgrades would be required based upon the effect of a culvert on public resources. If no 37 negative effects are present from a culvert, then the culvert would not require 38 replacement until the end of its life. 39
Draft EIS Fish and Fish Habitat
4-203
Chapter 4 Alternative 4 1 Alternative 4 would also require new stream typing systems that would increase the 2 accuracy of fish-bearing stream identification and would expedite correction of fish 3 passage problems. Alternative 4 would implement a new stream typing system based 4 upon geomorphic characteristics: 5
• Type 1: Less than 20 percent gradient; all fish-bearing streams and other channels 6 are considered important for fish 7
• Type 2: 20 to 30 percent gradients; channels are considered important for coarse 8 sediment storage and as sources of LWD 9
• Type 3: Greater than 30 percent gradient; channels are considered prone to 10 channelized landslides and as sources of LWD 11
Alternative 4 also includes road plans, but upgrades would be required by 2011. In 12 combination, the new plan, passage criteria, and stream-typing system should result in 13 substantial improvements in fish passage within the next 10 years under Alternative 4, 14 with the largest amount of restoration occurring in eastside forests. 15
Alternative 4 does not require upgrades to all culverts. Upgrades would be required 16 based upon the effect of a culvert on public resources. If no negative effects are present 17 from a culvert, then the culvert would not require replacement until the end of its life. 18
In summary, as noted above, while culverts are the major factor potentially affecting fish 19 passage related to forest practices, other factors including suspended and bedload 20 sediment, and high water temperatures may affect fish passage or migration. Generally 21 the relative rank of the alternatives for passage would follow that for coarse sediment, 22 fine sediment, and water temperatures. Those alternatives with the highest likelihood of 23 reducing management-related inputs of these parameters would be expected to have the 24 highest likelihood for correcting fish passage barriers. The result would be that No 25 Action Alternative 1-Scenario 2 would have the lowest likelihood for improvement while 26 Alternative 4 would have the highest likelihood for improving fish passage conditions. 27 No Action Alternative 1-Scenario 1 and Alternative 2 and 3 would be intermediate 28 between these two. 29
4.8.4 Synthesis by Analysis Region 30 This subsection is designed to provide a regional perspective of the alternatives and a 31 discussion of how they might affect the status of covered fish species found in the 32 analysis regions. Numerous factors, including forest practices, affect the abundance and 33 distribution of Pacific salmon and trout (Spence et al. 1996; Palmisano et al. 1993; NMFS 34 2000; Federal Caucus 1999). Other factors such as urbanization, agriculture, fish harvest, 35 hatchery management practices, ocean conditions, and dams for hydroelectricity, flood 36 abatement, irrigation, and drinking water all contribute in varying degrees to the current 37 status of listed fish species. NMFS suggest that human-influenced changes in all of these 38 factors (except perhaps ocean conditions) will be required to progress towards a regional 39 recovery of these species (NMFS 2000; NMFS 1996b; NMFS 1998). Depending upon 40
Fish and Fish Habitat Draft EIS
4-204
Chapter 4 the watershed, each of the factors will have more or less influence on the recovery of any 1 listed species in that watershed. Consequently, in any individual watershed, the 2 Washington Forest Practices Rules may have a range of effects from slight to substantial 3 on the salmonids in that watershed. Covered and other species were considered in the 4 same manner as listed species, since factors affecting listed species would generally have 5 similar effects on other species of concern. Special characteristics of these other species 6 were considered and are noted in this evaluation where appropriate (FPHCP, Chapter 3, 7 Biological Data on and Factors Affecting Covered Species). 8
The analysis in this subsection is based upon the assumption that factors unrelated to 9 forest practices may prevent attainment of robust, harvestable populations of salmonids 10 even if the prescriptions in the DEIS alternatives are fully effective in providing adequate 11 habitat conditions. This assumption is necessary because integration of all the various 12 factors and their range of possible future outcomes is highly speculative and would 13 require a level of detail and site-specificity far beyond the scope of this analysis. 14
The forestlands subject to Washington Forest Practices Rules cover about 51 percent 15 (approximately 8,005,000 acres) of lands on the westside and about 12 percent 16 (approximately 3,365,000 acres) of lands on the eastside of Washington State (Tables 3-2 17 and 3-3). This is a significant amount of land for both portions of the State. Analysis 18 regions containing larger amounts of forestland and forest practices activities should have 19 proportionately larger effects on listed salmon and trout. However, this simple 20 relationship is complicated by mixed ownerships and mixed management objectives in 21 most parts of the State. 22
Relative to existing conditions within all regions, implementation of No Action 23 Alternative 1-Scenario 2 would likely improve habitat conditions due to recovery of 24 riparian function (Table 3-17) from past riparian harvest and other past associated forest 25 practices in some forested regions. However, protection levels under No Action 26 Alternative 1-Scenario 2, relative to other alternatives, would be low. In contrast, No 27 Action Alternative 1-Scenario 1 and Alternatives 2 and 3 are considered to have 28 moderate to high protection, and Alternative 4 is considered to have high to very high 29 protection. One major difference under No Action Alternative 1-Scenario 1 and 30 Alternatives 2, 3, and 4 is that Channel Migration Zones would be recognized and 31 protected, and RMZs would begin at the edge of Channel Migration Zones rather than 32 from the ordinary high water mark as would be the case under No Action Alternative 1-33 Scenario 2. 34
Alternative 4 would implement the widest no-harvest buffers, includes an accelerated 35 schedule for RMAPs, and provides a cap on road densities. Consequently, it would have 36 the highest level of long-term protection among the four alternatives. However, in 37 contrast to No Action Alternative 1-Scenario 1 and Alternatives 2 and 3, Alternative 4 38 does not provide incentives to landowners to accelerate habitat recovery through active 39 LWD placement strategies or thinning of over-stocked riparian stands. These strategies 40 are allowable under Alternative 4 provided the landowner obtains a Class IV−special 41
Draft EIS Fish and Fish Habitat
4-205
Chapter 4 permit and a Hydraulic Project Approval, but there is little to no economic incentive to 1 implement these strategies. 2
All of the alternatives would include some level of Watershed Analysis. No Action 3 Alternative 1-Scenario 1 and Alternatives 2, 3, and 4 would improve upon current 4 Watershed Analysis methods by adding modules for cultural resources and stream 5 restoration, and make improvements in the hydrology and water quality modules. 6 Alternative 4 would also include a module for monitoring watershed conditions and 7 prescription effectiveness. A major difference is that No Action Alternative 1-Scenario 1 8 and Alternatives 2 and 3 would eliminate the prescriptive phase of the riparian function 9 module while the phase would continue under Alternative 4. Under No Action 10 Alternative 1-Scenario 1 and Alternatives 2 and 3, the prescriptive phase would not be 11 needed, based upon the assumption that standard Washington Forest Practices Rules 12 would be effective in preventing cumulative watershed effects. 13
While these alternatives do not include a direct watershed level perspective, the 14 Washington Forest Practices Rules that would be implemented under these alternatives 15 were based on extensive watershed analyses conducted from 1991 to 1996. So the 16 practical benefit of the Watershed Analysis inclusion may only be slight. While 17 Watershed Analysis is included in these alternatives, it is not likely to be implemented 18 since it is dependent on State funding. Since adoption of the current Washington Forest 19 Practices Rules very few new watershed analyses have been completed, and it appears 20 that there is little incentive for Watershed Analysis to be done (Personal Communication, 21 Darin Cramer, Washington DNR, April 9, 2004). 22
Under Alternatives 2 and 3, effectiveness monitoring under the adaptive management 23 program would result in a better understanding of the effects of forest practices on 24 watershed processes and aquatic habitat. The adaptive management program is also 25 assumed to implement any changes in prescriptions that are needed to maintain adequate 26 levels of protection. Failure of these assumptions could be detrimental to the recovery of 27 listed species even if individual prescriptions appear adequate. If standard Washington 28 Forest Practices Rules provide all the necessary certainty to landowners concerning 29 activities on their lands, the benefits of voluntary Watershed Analysis may not outweigh 30 the costs to private landowners. 31
Because prescriptions are generally equivalent or more conservative under Alternative 4, 32 the likelihood of voluntary completion of Watershed Analysis by landowners is probably 33 about the same under this alternative as it is under No Action Alternative 1-Scenario 1 34 and Alternatives 2 and 3. Nevertheless, Watershed Analysis may eventually be 35 completed for all watersheds, but will likely require a longer period of time for 36 completion since the analysis will be voluntary. Watershed analysis, when implemented, 37 would continue to be important for obtaining and organizing baseline information needed 38 for monitoring. 39
Changes in the Washington Forest Practices Rules under No Action Alternative 1-40 Scenario 1 and Alternatives 2, 3, and 4 would have a greater influence on the long-term 41 recovery of species than the short-term recovery. However, the reviewer is reminded to 42
Fish and Fish Habitat Draft EIS
4-206
Chapter 4 consider the differences in effectiveness over time of the adaptive management program 1 among this group of alternatives (No Action Alternative 1-Scenario 1[low], Alternative 2 2 [high], Alternative 3 [moderate], Alternative 4 [low]) in evaluating effects (subsection 3 4.1.5, Adaptive Management). Improvements in road management practices and road 4 upgrades should be apparent first, particularly related to fine sediment that influences the 5 survival of incubating salmon and trout eggs. Increased fish passage through culverts 6 would also be realized relatively quickly as RMAPs would be implemented by 2011 7 (Alternative 4) or 2016 (No Action Alternative 1-Scenario 1 and Alternatives 2 and 3). 8 A reduction in the frequency and magnitude of mass wasting events that deliver coarse 9 sediment to streams should become apparent. However, some streams may require many 10 years to recover from historical management-related inputs of coarse sediment (20 to 100 11 years or more). Similarly, the recovery of LWD recruitment is a long-term process. 12 Moderate levels of recovery may require 80 years or more in riparian areas dominated by 13 early-seral stage stands. Some stands will require longer periods to achieve key piece-14 size trees without some form of management such as thinning or removal of hardwoods. 15 Consequently, in severely degraded forested areas, it is unlikely that fish habitat 16 conditions will improve substantially in the near-term (less than 20 to 40 years) without 17 enhancement. 18
Many factors have contributed to the decline of the listed fish species in the Pacific 19 Northwest. The term for these factors has sometimes been referred to as the “four H’s.” 20 The H’s refer to effects of habitat, harvest, hatcheries, and hydropower on these fish 21 (Federal Caucus 1999, see also the archive for all Federal Caucus documents, 22 http://www.salmonrecovery.gov/Archive_chronological.shtml). For recovery of listed 23 fish species and protection of many other species, actions in all of these areas are needed. 24 The actions being considered in this document would affect only the habitat “H” in each 25 region. But the overall effect on covered species not only depends on the effectiveness of 26 these actions, but also on what is occurring to habitat from other land use practices (i.e., 27 agriculture, urbanization), as well as the harvest, hatcheries, and hydropower factors in 28 each region. The following paragraphs include a region-based synthesis of how the 29 alternatives may potentially affect covered species in light of the four H’s in each of these 30 regions. Hatchery effects will be discussed in more detail in Chapter 5, Cumulative 31 Effects. 32
4.8.4.1 North Puget Sound 33 A high proportion of this Region is designated as forestlands (78 percent or 3,427,000 34 acres). The Washington Forest Practices Rules regulate commercial timber activities for 35 private holdings on a small portion, about 24 percent (1,075,000 acres) of lands, which 36 includes 31 percent of all forestlands in the Region. Washington DNR also manages an 37 additional 11 percent of all lands (14 percent of all forests), primarily under its State 38 Trust Lands HCP (Washington DNR 1997d). Federal- and State-protected forestlands, 39 not managed for timber harvest, account for a large part of the Region, primarily 40 associated with the North Cascades National Park and other designated wilderness areas, 41 including about 37 percent of all lands (48 percent of all forests). Also, Federal and tribal 42
Draft EIS Fish and Fish Habitat
4-207
Chapter 4 forestlands available for timber harvest equal about 5 percent of all lands (7 percent of all 1 forests). 2
The amount and location of streams and forested lands affected by forest practices has the 3 potential to influence production and survival of fish and other aquatic resources to 4 varying degrees. The relative amount of streams is high in this Region (28,653 stream 5 miles), having 11 percent of all State stream miles. This Region also has a relatively low 6 portion of all stream miles (26 percent) subject to the Washington Forest Practices Rules, 7 and ranks as the lowest among western Washington regions. Exempt 20-acre parcels 8 comprise about 0.7 percent of the forestlands and about 1.5 percent of the forestlands 9 subject to the Washington Forest Practices Rules in the North Puget Sound Region 10 (Rogers 2003). 11
Chinook salmon and bull trout are listed as threatened in the Region, and seven other 12 species with State or Federal status are present, including coho salmon, coastal cutthroat 13 trout, Pacific lamprey, river lamprey, Salish sucker, eulachon, and green sturgeon 14 (subsection 3.8.4, The Freshwater Aquatic Ecosystem). 15
Habitat, hydropower, hatcheries, and harvest are the major factors affecting fish 16 populations. Each of the four H’s has been cited as contributing to the listing of the 17 species. While many lowland areas of the Region are highly urbanized, some having 18 dense population centers (e.g., Bellingham, Everett), the urban environment is less than 2 19 percent of the Region. The major rivers have all had extensive floodplain and estuarine 20 modification. Lower mainstem river modifications have included extensive diking along 21 the Skagit, Stillaguamish, and Nooksack Rivers. Better timber management over the past 22 three decades has improved habitat to a greater degree than in urban and agricultural 23 areas (DEIS Appendix). In this Region, mass wasting has been a historical timber 24 management problem (DEIS Appendix A). The Skagit and Snohomish River systems 25 have hydroelectric and/or drinking water dams and reservoirs. 26
Overall, ongoing improvements to the Washington Forest Practices Rules under No 27 Action Alternative 1-Scenario 1 and Alternatives 2, 3, and 4 could have low to moderate 28 benefit to the recovery of the listed species due to the relatively small portion of streams 29 that would be affected. Also, because non-forest related activities have a large effect on 30 these species, changes in Washington Forest Practices Rules, by themselves, are unlikely 31 to lead to the recovery of these species. 32
Changes in the Washington Forest Practices Rules would likely have the largest effect on 33 bull trout and cutthroat trout because they are predominantly found in forested areas and 34 are influenced less by marine factors, harvest, hatcheries, and urbanization (subsection 35 3.8 2, Fish Status in Washington). No Action Alternative 1-Scenario 2 could reduce 36 chances of recovery in this Region because of relatively low protection of fish habitat. 37 However, conversion of forestland to land development would reduce the benefits of any 38 alternative for covered species, but especially under Alternative 4, which would likely 39 have the highest conversion rate while Alternative 2 would have the lowest rate 40 (subsection 4.2.3.2, Forestland Conversion). The abundance of urban areas would 41 contribute to conversions in this Region relative to most other regions. 42
Fish and Fish Habitat Draft EIS
4-208
Chapter 4 Protection for the other seven representative covered species (those with lesser Federal or 1 State status) in this Region would be affected in a similar manner, by the alternatives, as 2 the listed stocks. Generally most would be less directly affected by the considered forest 3 management regulations. Coho salmon and coastal cutthroat trout would be affected in a 4 manner similar to the listed stocks as both species rely on many of the same habitat 5 features. Neither species is likely to be as affected to the degree bull trout would likely 6 be, as they are not as dependent on very cold water conditions found in headwater 7 streams. Sea-run and other migratory life history forms of cutthroat often use high 8 gradient, small tributaries; however they have a broader habitat use encompassing low 9 elevation streams, and sea-runs frequently use estuaries (subsection 3.8.3.1, Pacific 10 Salmon and Trout - General). The other representative covered species are less 11 associated with forested mountainous regions where many of the managed forests occur. 12
Green sturgeon are rarely present in any the streams in of this Region and would only be 13 found in the lowest reaches of major rivers where other land practices (e.g., diking, 14 estuary modification, water quality) have more dominant habitat effects (subsection 15 3.8.3.2, Green Sturgeon). Differences among alternatives are unlikely to significantly 16 affect this species. 17
Eulachon is also primarily found in the lower reaches of major rivers (e.g., Nooksack 18 River) and are likely most affected by lower river land use practices. However, improved 19 overall stream conditions related to flow, sediment, and large wood would be of benefit 20 and would result more from No Action Alternative 1-Scenario 1, Alternatives 2 and 3, 21 and mostly by Alternative 4. 22
Salish suckers mostly utilize lower velocity areas of larger streams and ponds (subsection 23 3.8.2.10, Mountain Sucker and Salish Sucker). These areas are again, less directly 24 affected by the alternatives being considered, but also would benefit from improved 25 habitat conditions that would be provided by all but No Action Alternative 1-Scenario 2. 26
Both Pacific and river lamprey would be more restricted to the larger streams and 27 adjacent low gradient tributaries. Both require clean gravel conditions for spawning, and 28 juveniles rear for several years in fine sediment in tributaries and rivers. Warm 29 temperatures, sediment in gravels, and upstream migrations barriers are believed to be 30 limiting factors for these species (Close et al. 1995). Improved forest practices, as 31 included in all but No Action Alternative 1-Scenario 2, would benefit these fish species, 32 but other in-basin activities (e.g., agriculture, urbanization, floodplain diking) would play 33 a major role in maintaining these stocks. No marked differences among alternatives 34 relative to their marine life cycle are expected, as they are not reported to rely on estuary 35 conditions as adults, which are where alternatives may differ slightly in their effects 36 (subsection 4.8.2, Nearshore Marine Areas, and subsection 3.8.3.3, Pacific and River 37 Lamprey). 38
4.8.4.2 South Puget Sound 39 A high proportion of this Region is designated as forestlands (70 percent or 1,532,000 40 acres). The Washington Forest Practices Rules regulate commercial timber activities for 41
Draft EIS Fish and Fish Habitat
4-209
Chapter 4 private holdings on a moderate portion, about 45 percent (970,000 acres) of lands, which 1 includes 63 percent of all forestlands in the Region. Washington DNR also manages an 2 additional 7 percent of all lands (10 percent of all forests) primarily under its State Trust 3 Lands HCP (Washington DNR 1997d). Federal- and State-protected forestlands, not 4 managed for timber harvest, include about 13 percent of all lands (19 percent of all 5 forests). Also Federal and tribal forestlands, available for timber harvest, equal about 6 6 percent of all lands (8 percent of all forests). Exempt 20-acre parcels comprise about 0.6 7 percent of the forestlands and about 0.8 percent of the forestlands subject to the 8 Washington Forest Practices Rules in the South Puget Sound Region (Rogers 2003). 9
The amount and location of streams and forested lands affected by forestry activities has 10 the potential to influence production and survival of fish and other aquatic resources to 11 varying degrees. The relative amount of stream miles is moderate in this Region (13,832 12 stream miles), having 5 percent of all State stream miles (about half that of North Puget 13 Sound). But this Region has the second highest portion of all stream miles (52 percent) 14 protected under the Washington Forest Practices Rules among the 12 regions. 15
Chinook salmon and bull trout are listed as threatened in the South Puget Sound Region. 16 Six of the same seven species (not eulachon) with lesser State or Federal status, identified 17 for North Puget Sound, are present in South Puget Sound plus the Olympic mudminnow 18 and pygmy whitefish. 19
Effects on fish in this Region differ from North Puget Sound primarily in the very large 20 portion of the Region that is commercial or residential uses. This Region has the largest 21 portion of urbanized area of any region in the State at about 17 percent of the total 22 regional area (Table 3-2); it includes Seattle, Tacoma, and Olympia as major urban 23 centers. Similar to North Puget Sound, most major rivers systems have had major 24 estuarine development and diking, with the only exception being the Nisqually River. 25 Dams constructed for hydropower and water storage have had a major effect on available 26 habitat in the Region. Dams are located on the Cedar, Green, White, Puyallup, and 27 Nisqually Rivers. These developments include some blockages of historical spawning 28 and rearing areas. Landslide potential is of concern in some of the subbasins within this 29 Region (DEIS Appendix A). 30
Lack of agricultural and urban buffers are considered one of the major limiting factors in 31 the Region. The forested riparian corridors are mostly in early-seral stages and will need 32 many years before they contribute to LWD recruitment. Recovery of LWD recruitment 33 is slow, and instream LWD is often removed inappropriately. However, over the last 30 34 years, improved riparian management has resulted in improvements in forest areas 35 relative to the urban areas (DEIS Appendix A). 36
The improvements to the Washington Forest Practices Rules under No Action Alternative 37 1-Scenario 1 and Alternatives 2, 3, and 4 could have moderate benefits to the recovery of 38 listed species due to the relatively high portion of streams that would be affected. 39 However, changes in Washington Forest Practices Rules, by themselves, are unlikely to 40 lead to the recovery of these species. This is especially true for the large habitat 41 alterations that are likely to remain in the lower floodplain area from the 42
Fish and Fish Habitat Draft EIS
4-210
Chapter 4 commercial/industrial development. As noted for North Puget Sound, the largest benefit 1 would likely be for bull trout because they are predominantly found in forested areas and 2 are influenced less by marine factors, harvest, hatcheries, and urbanization. No Action 3 Alternative 1-Scenario 2 could reduce chances of recovery in this region because of 4 relatively low protection of fish habitat. Conversion of forestland to non-forest uses 5 would reduce the benefits of any alternative for covered species. Conversions are likely 6 be the highest in this Region under any alternative, but especially under Alternative 4 7 which would likely have the highest conversion rate while Alternative 2 would have the 8 lowest rate (subsection 4.2.3.2, Forestland Conversion). 9
Protection to the other representative covered species would be similar to the protection 10 noted for similar species in North Puget Sound. Pygmy whitefish are primarily found in 11 cold mountain lakes and, when in streams, require clear, cold water. They are susceptible 12 to sedimentation and increased temperature (subsection 3.8.3.5, Pygmy Whitefish). 13 Benefits from the alternatives for this species may be similar to that of bull trout because 14 its habitat is more affected by forest practices. The Olympic mudminnow would likely 15 experience relatively lower benefits from implementation of any of the alternatives 16 because they are more often found in lowland low-gradient streams that, in this Region, 17 are generally more prone to industrial, agricultural, or urban developments. 18
4.8.4.3 West Puget Sound 19 A very high proportion of this Region is designated as forestlands (88 percent or 20 1,522,000 acres). The Washington Forest Practices Rules regulate commercial timber 21 activities for private holdings on a moderate portion, about 40 percent (700,000 acres) of 22 lands, which includes 46 percent of all forestlands in the Region. Washington DNR also 23 manages an additional 10 percent of all lands (11 percent of all forests) primarily under 24 its State Trust Lands HCP (Washington DNR 1997d). Federal- and State-protected 25 forestlands, not managed for timber harvest, include about 36 percent of all lands (4 26 percent of all forests). Federal and tribal forestlands, available for timber harvest, also 27 equal about 1 percent of all lands (2 percent of all forests). Exempt 20-acre parcels 28 comprise about 2.2 percent of the forestlands and about 3.8 percent of the forestlands 29 subject to the Washington Forest Practices Rules in the West Puget Sound Region 30 (Rogers 2003). 31
The amount and location of streams and forested lands affected by forestry activities has 32 the potential to influence production and survival of fish and other aquatic resources to 33 varying degrees. The relative number of stream miles is low in this Region (9,114 stream 34 miles), which includes about 3 percent of all State stream miles. This Region also has a 35 high portion of all stream miles (43 percent) protected under the Washington Forest 36 Practices Rules. 37
Chinook salmon and bull trout inhabit this Region, which are federally listed as 38 threatened, plus a threatened summer run of chum salmon that occurs in northern Hood 39 Canal and the eastern Strait of Juan de Fuca. Six of the same seven species (not 40 eulachon) with lesser State or Federal status as North Puget Sound are present here, plus 41 the Olympic mudminnow. 42
Draft EIS Fish and Fish Habitat
4-211
Chapter 4 The Region has a mix of land uses that may affect fish habitat. There are moderate 1 amounts of residential/commercial development (4 percent) and agriculture land uses (3 2 percent). The effects of the four H’s have been less severe here than in the remainder of 3 Puget Sound. However, effects have included a major blockage of the Elwha River, 4 including nearly the entire pristine portion of the watershed; substantial portions of the 5 Skokomish River in south Hood Canal are also blocked. Most streams, however, are 6 relatively small, other than the Dungeness and Elwha Rivers, with many drainages 7 extending into the Olympic National Park. 8
Private timber harvest area includes much of the lowland areas of the Kitsap Peninsula, 9 which has a high rate of land conversion (See below for effects). With the presence of 10 the National Park and other protected areas, much of the forestland is not managed for 11 timber production (Table 3-3). An additional portion has protections under the State 12 Trust Lands HCP (Washington DNR 1997d). The Olympic Peninsula has naturally high 13 rates of debris avalanches that contribute large amounts of sediment and organic debris to 14 streams. Due to their small size, almost no streams have naturally large estuaries and 15 thus, other than the Skokomish River, have not undergone large modifications like other 16 major rivers in Puget Sound. With improvements in riparian management over the last 17 30 years and much of the upper portions of riparian areas protected, streams in the 18 Region are recovering and have the advantage of relatively low impacts from activities 19 relative to other Puget Sound regions. 20
The riparian buffers under No Action Alternative 1-Scenario 1 and Alternatives 2, 3, and 21 4 could have moderate benefits to the recovery of listed species. However, the high 22 portion of exempt 20 acre parcels (DEIS Appendix A) may reduce the overall benefits of 23 No Action Alternative 1-Scenario 1 and Alternatives 2 and 3 due to less protective 24 riparian buffers on these parcels. The relatively good environmental conditions, lack of 25 large non-forest related impacts (relative to other Puget Sound regions), and high portion 26 of forests that are under the Washington Forest Practices Rules, contributes to this 27 recovery benefit. As with other areas, bull trout would benefit most from implementation 28 of these alternatives among the listed species due to its preference for low stream 29 temperatures and its lack of influence by hatcheries or commercial effects relative to the 30 two other listed species (subsection 3.8.5.3, West Puget Sound). No Action Alternative 31 1-Scenario 2 could reduce chances of recovery in this region because of relatively low 32 protection of fish habitat. Conversion of forestland to non-forest uses would reduce the 33 benefits of any alternative for covered species, but especially under Alternative 4, which 34 would likely have the highest conversion rate. Alternative 2 is expected to have the 35 lowest rate of conversion (subsection 4.2.3.2, Forestland Conversion). The expansion of 36 urban area would contribute to conversions in this Region relative to most other State 37 regions. 38
Protections to the other seven representative covered species would be similar to those 39 noted for North Puget Sound for the same species. Protections for the Olympic 40 mudminnow would be as described for the South Puget Sound Region. 41
Fish and Fish Habitat Draft EIS
4-212
Chapter 4 4.8.4.4 Islands 1 A high proportion of this Region is designated as forestlands (73 percent or 180,000 2 acres). The Washington Forest Practices Rules regulate commercial timber activities for 3 private holdings on a moderate portion, about 63 percent (154,000 acres) of lands, which 4 includes 86 percent of all forestlands in the Region. Washington DNR also manages an 5 additional 4 percent of all lands (6 percent of all forests) primarily under its State Trust 6 Lands HCP (Washington DNR 1997d). Federal- and State-protected forestlands, not 7 managed for timber harvest, include about 5 percent of all lands (7 percent of all forests). 8 Also, Federal and tribal forestlands available for timber harvest equal about 2 percent of 9 all lands (2 percent of all forests). Exempt 20-acre parcels comprise about 1 percent of 10 the forestlands and about 1.1 percent of the forestlands subject to the Washington Forest 11 Practices Rules in the Islands Region, based on an analysis done only in the San Juan 12 WRIA by Rogers (2003). 13
The proportion of total stream miles in the State contained within the Islands Region is 14 very low (1,009 stream miles or less than 1 percent). However, this Region has a high 15 portion of all stream miles (47 percent) protected under the Washington Forest Practices 16 Rules. 17
No listed or other representative covered species are present in the Island Region, but 18 coho salmon and searun cutthroat are present. The amount and location of streams and 19 forested lands affected by forestry activities has the potential to influence production and 20 survival of these fish to varying degrees. 21
Agricultural areas (17 percent) and growing commercial/residential areas (6 percent) 22 comprise a relatively high proportion of total land area in the Region, especially for 23 western Washington. Habitat modification has been the major impact in this Region, as 24 the other four H’s have had relatively minor effects. Most streams are generally 25 ephemeral and do not provide adequate flow for salmonid use. However, where habitat is 26 present, access may be the greatest limiting factor (e.g., culverts, tidegates) (DEIS 27 Appendix A). The major concern for the Islands Region is conversion of shoreline forest 28 to residential land use and shoreline hardening (DEIS Appendix A). These factors could 29 affect major salmon runs from rivers adjacent to this Region (e.g., Nooksack, Skagit, and 30 Snohomish Rivers) that use marine shoreline areas during early rearing and adult 31 migration. 32
Overall, ongoing improvements to the Washington Forest Practices Rules under No 33 Action Alternative 1-Scenario 1 and Alternatives 2, 3, and 4 could have no effect to slight 34 benefits on the recovery of the listed species due to the fact that there is no freshwater 35 habitat use by currently listed fish species. No Action Alternative 1-Scenario 2 would 36 also have no effect on recovery because of a lack of habitat use by listed species in the 37 region. Also, a relatively small portion of freshwater fish habitat may be affected by 38 these actions. Additionally, non-forestland uses (e.g., conversion of shoreline areas to 39 housing) are likely to have a larger effect on listed species and other covered species that 40 may use marine shoreline areas than implementation of the alternatives. Changes in the 41
Draft EIS Fish and Fish Habitat
4-213
Chapter 4 Washington Forest Practices Rules by themselves are unlikely to lead to the recovery of 1 regional listed species or local representative covered species. 2
4.8.4.5 Olympic Coast 3 This Region has the highest proportion of lands designated as forestlands of any region in 4 the State (95 percent or 1,671,000 acres). The Washington Forest Practices Rules regulate 5 commercial timber activities for private holdings on a low portion, about 26 percent 6 (451,000 acres) of lands, which includes 27 percent of all forestlands in the Region. 7 Washington DNR also manages an additional 18 percent of all lands (18 percent of all 8 forests) primarily under its State Trust Lands HCP (Washington DNR 1997d). Federal- 9 and State-protected forestlands, not managed for timber harvest (mostly National Forest 10 and National Park at higher elevations), include about 39 percent of all lands (41 percent 11 of all forests). Also Federal and tribal forestlands, available for timber harvest, equal 12 about 13 percent of all lands (14 percent of all forests). Exempt 20-acre parcels comprise 13 about 0.3 percent of the forestlands and about 0.7 percent of the forestlands subject to the 14 Washington Forest Practices Rules in the Olympic Coast Region (Rogers 2003). 15
The amount and location of streams and forested lands affected by forestry activities has 16 the potential to influence production and survival of these fish to varying degrees. The 17 relative number of stream miles is moderate in this Region (14,959 stream miles), 18 representing 6 percent of all State stream miles. This Region also has a moderate portion 19 of all stream miles (29 percent) protected under the Washington Forest Practices Rules. 20
The Olympic Coast Region contains Lake Ozette sockeye salmon and Coastal-Puget 21 Sound bull trout, which are both listed as threatened within this Region. Other 22 representative covered species found in this Region include coho salmon, coastal 23 cutthroat trout, Pacific and river lamprey, Olympic mudminnow, and eulachon. 24
Of the four H’s, habitat appears to be the primary factor affecting bull trout. Unlike 25 regions discussed above, hydroelectric facilities are not considered a major issue in 26 general, although one or more dams may be important in specific basins. No hatcheries 27 are stocking bull trout in the Region. This Region has the largest proportion of the total 28 land area in forest and the smallest proportion of commercial/residential (0.1 percent) and 29 agricultural areas (0.3 percent of all lands). Total stream miles in this Region are 30 substantial; however, a relatively small portion of these streams are protected under the 31 Washington Forest Practices Rules. 32
Past timber harvest has been accelerated the rate of shallow rapid landslides, and forest 33 roads have added substantial sediment to streams (DEIS Appendix A). Because timber 34 harvest occurred more recently in this Region relative to other areas of the State, riparian 35 recovery is in the early conifer and hardwood stages of development. Consequently, 36 improvements to the Washington Forest Practices Rules under No Action Alternative 1-37 Scenario 1 and Alternatives 2, 3, and 4 could have a moderate effect on the recovery of 38 listed or potentially listed species, particularly bull trout. No Action Alternative 1-39 Scenario 2 could reduce chances of recovery of listed or potentially listed fish in this 40
Fish and Fish Habitat Draft EIS
4-214
Chapter 4 region because of relatively low protection of fish habitat. Other protection and recovery 1 programs in the Region could also have a substantial influence. 2
The distribution of listed sockeye salmon is restricted, and the NMFS status review 3 (Waples et al. 1991) cited several major non-forestry related factors (e.g., non-native 4 introductions, ocean conditions, and harvest affecting their status) affecting the species. 5 Nevertheless, Nehlsen et al. (1991) also indicated forest practices in the 1940s and 1950s 6 may have contributed to their decline. Consequently, improvements in the Washington 7 Forest Practices Rules, for all alternatives except No Action Alternative 1-Scenario 2, 8 could have a positive effect on the recovery of sockeye salmon in this Region. 9
The effects on most other covered species would similar to the effects described for the 10 Puget Sound regions. However, the Olympic mudminnow would likely experience a 11 higher relative benefit than was noted for the South Puget Sound Region for all 12 alternatives except No Action Alternative 1-Scenario 2, due to the fact that they are more 13 often found in low-elevation, low-gradient streams that are more often subject to forest 14 management practices, relative to the South Puget Sound Region where lowlands are 15 often in industrial, agricultural, or urban areas (DEIS Appendix A). 16
4.8.4.6 Southwest 17 A very high proportion of this Region is designated as forestlands (89 percent or 18 2,058,000 acres). The Washington Forest Practices Rules regulate commercial timber 19 activities for private holdings on a high proportion of lands, (70 percent or 1,619,000 20 acres) which includes 79 percent of all forestlands in the Region. Washington DNR also 21 manages an additional 13 percent of all lands (14 percent of all forests) primarily under 22 its State Trust Lands HCP (Washington DNR 1997d). Federal- and State-protected 23 forestlands, not managed for timber harvest, include about 6 percent of all lands (7 24 percent of all forests). Also, Federal and tribal forestlands available for timber harvest 25 equal less than 1 percent of all lands (less than 1 percent of all forests). Exempt 20-acre 26 parcels comprise about 0.8 percent of the forestlands and about 0.8 percent of the 27 forestlands subject to the Washington Forest Practices Rules in the Southwest Region 28 (Rogers 2003). 29
The amount and location of streams and forested lands affected by forestry activities has 30 the potential to influence production and survival of these fish to varying degrees. The 31 Region contains a large number of stream miles (28,607 stream miles), which comprises 32 11 percent of all stream miles in the State. This Region also has the highest portion of all 33 stream miles (74 percent) protected under the Washington Forest Practices Rules. 34
Bull trout is the only federally listed species in the Region, but coho salmon is a Federal 35 species of concern. Additional representative covered species present in the Region are 36 similar to North Puget Sound including coastal cutthroat trout, green sturgeon, Pacific 37 and river lamprey, Olympic mudminnow, and eulachon. 38
Similar to the Olympic Coast Region, habitat degradation appears to be the leading factor 39 influencing listing of species in the Region (DEIS Appendix A). A few hydroelectric 40 projects are present in the Region, but they are not a major fisheries issue (DEIS 41
Draft EIS Fish and Fish Habitat
4-215
Chapter 4 Appendix A), and no hatcheries stock bull trout. But unlike the Olympic Coast, this 1 Region has substantial agricultural areas (6.2 percent), and residential/commercial areas 2 are increasing (1.3 percent of the land). The agricultural and residential/commercial land 3 base is associated primarily with the towns of Aberdeen and Hoquiam, and located at the 4 mouth of the Chehalis River, and at the upper Chehalis River basin. 5
Delivery of fine sediment to streams is considered a key limiting factor to instream 6 habitat in the Willapa Hills, and the Region has a high proportion of unstable slopes and 7 landforms (DEIS Appendix A). Urbanization and agricultural practices, especially in the 8 Chehalis River valley, have also had adverse habitat and water quality effects (DEIS 9 Appendix A). Two large estuaries, Grays Harbor and Willapa Bay, are present in this 10 Region. While Grays Harbor has had substantial development (about 30 percent of the 11 intertidal area has been lost), Willapa Bay is the least developed large estuary in the State 12 (DEIS Appendix A). 13
Consequently, the relatively high portion of forested land in the Region protected under 14 the Washington Forest Practices Rules suggests that improvements to the rules under No 15 Action Alternative 1-Scenario 1 and Alternatives 2, 3, and 4 are likely to have a large 16 effect on the recovery of listed or potentially listed species. Other land uses are likely to 17 have only a moderate effect on species recovery. No Action Alternative 1-Scenario 2 18 could reduce chances of recovery because of relatively low protection of fish habitat. 19 Effects of the alternatives on the other representative covered species would be as 20 discussed for the Puget Sound Regions and the Olympic Coast Region for Olympic 21 mudminnow. 22
4.8.4.7 Lower Columbia River 23 A very high proportion of this Region is designated as forestlands (85 percent or 24 2,616,000 acres). The Washington Forest Practices Rules regulate commercial timber 25 activities for private holdings on a moderate portion of lands (about 43 percent or 26 1,619,000 acres), which includes 51 percent of all forestlands in the Region. Washington 27 DNR also manages an additional 10 percent of all lands (12 percent of all forests) 28 primarily under its State Trust Lands HCP (Washington DNR 1997d). Federal- and 29 State-protected forestlands, not managed for timber harvest, include about 23 percent of 30 all lands (28 percent of all forests). Also, Federal and tribal forestlands available for 31 timber harvest equal about 9 percent of all lands (10 percent of all forests). But unlike 32 the Southwest Region, where the Washington Forest Practices Rules affect most of the 33 area, only about half of the area in the Lower Columbia Region is regulated under the 34 rules. Forestland comprises a very high proportion of this Region relative to other 35 regions in western Washington. The proportion of area in residential/commercial (2.1 36 percent) and agricultural (6 percent) land uses is moderate. Exempt 20-acre parcels 37 comprise about 1.4 percent of the forestlands and about 2.3 percent of the forestlands 38 subject to the Washington Forest Practices Rules in the Lower Columbia Region (Rogers 39 2003). 40
The amount and location of streams and forested lands affected by forestry activities has 41 the potential to influence production and survival of fish and other aquatic resources to 42
Fish and Fish Habitat Draft EIS
4-216
Chapter 4 varying degrees. The relative number of stream miles is high in this Region (29,645 1 stream miles), accounting for 11 percent of all State stream miles. This Region also has a 2 very high proportion of all stream miles (51 percent) protected under the Washington 3 Forest Practices Rules. 4
The Lower Columbia River Region includes four federally listed fish populations (i.e., 5 Evolutionarily Significant Units [ESU] or Distinct Population Segments [DPS]). 6 Additional listed populations migrate through the Region to the Willamette, upper 7 Columbia, and Snake Rivers in other regions (Table 3-20). Federally listed chinook 8 salmon, chum salmon, and steelhead are present downstream of Mossyrock Dam and 9 Merwin Dam on the Cowlitz and Lewis Rivers, respectively, plus other tributaries and 10 the mainstem Columbia River. Bull trout are listed as threatened throughout the Region 11 where they are present while Coho salmon is a Federal candidate species. The list of 12 other representative covered species differs slightly from that of Puget Sound and Coastal 13 Regions and includes coastal cutthroat trout, green sturgeon, Pacific and river lamprey, 14 leopard dace, eulachon, mountain sucker, and sandroller. 15
Each of the four H’s has been cited as affecting one or more of the listed species and 16 likely to affect other representative covered species. Hydropower development has had 17 the largest impact on the Lower Columbia Region including total blockage of hundreds 18 of stream miles (e.g., Cowlitz and Lewis Rivers) (DEIS Appendix A). The eruption of 19 Mt. St. Helens in 1980 contributed substantial sediment to the Toutle, Cowlitz, and 20 Columbia Rivers (DEIS Appendix A). Sediment input is considered to be a primary 21 limiting factor in the Cascade foothills (DEIS Appendix A). 22
Urbanization and agricultural development have impacted most of the larger valleys, 23 especially the Cowlitz River watershed. LWD is considered in low supply in much of 24 this basin due primarily to past land use practices (DEIS Appendix A). Habitat in the 25 Columbia River estuary has been greatly modified through diking, channelizing, 26 dredging, and losses of nutrient and sediment sources trapped by upstream dams (DEIS 27 Appendix A). These activities have extended up the Columbia River mainstem. 28 However because much of the Region is regulated under the Washington Forest Practices 29 Rules, improvements in those rules under No Action Alternative 1-Scenario 1 and 30 Alternatives 2, 3, and 4 could have a slight to moderate effect on the recovery of listed or 31 potentially listed species. No Action Alternative 1-Scenario 2 could reduce chances of 32 recovery in this Region because of relatively low protection of fish habitat. 33
Protection for the other seven representative covered species (those with lesser Federal or 34 State status) would be affected in a similar manner by the alternatives as the listed stocks. 35 These other species would be affected in a way similar to those discussed for the Puget 36 Sound regions for the same species. Even though green sturgeon are more common in 37 the lower Columbia River than in Puget Sound regions, the Washington Forest Practices 38 Rules are likely to have little influence on this species since many other factors (e.g., 39 hydropower, water storage, dredging, diking, water quality, shoreline development, 40 harvest) have a greater influence on habitat conditions in the lower Columbia River. 41
Draft EIS Fish and Fish Habitat
4-217
Chapter 4 The mountain sucker is sensitive to high temperatures and sediment in spawning habitat, 1 and possibly absence of preferred food. They also mostly utilize lower velocity areas of 2 larger streams (e.g., Cowlitz and Toutle Rivers) and ponds (subsection 3.8.3.10, 3 Mountain Sucker and Salish Sucker). These larger streams are less directly affected by 4 forest practices, but would benefit from improved habitat conditions that would be 5 provided by all but No Action Alternative 1-Scenario 2. No Action Alternative 1-6 Scenario 1 and Alternatives 2, 3, and 4 would have positive effects on maintaining these 7 populations because of potential improved habitat conditions (e.g., temperature, 8 sediment) in streams on forestlands. 9
Leopard dace distribution is spotty but the species is likely to occur in pools and medium 10 velocity waters of streams and rivers (Wydoski and Whitney 2003). The formation of 11 reservoirs, water level fluctuations (likely hydro-induced), and increased sedimentation 12 are more likely limiting conditions. Improved protection from sediment delivery under 13 No Action Alternative 1-Scenario 1 and Alternatives 2, 3, and 4 would likely provide 14 greater benefits than No Action Alternative 1-Scenario 2 because of potential improved 15 steam habitat conditions (e.g., LWD aiding pool formation) on forested lands. 16
The sandroller is often secretive and is found in quiet backwaters with cover, such as 17 rootwads, undercut banks, and deep pools in the Columbia River (Wydoski and Whitney 18 2003). Increased LWD, primarily in tributary streams, would enhance survival of this 19 species. 20
4.8.4.8 Middle Columbia River 21 A moderate proportion of this Region is designated as forestlands (47 percent or 22 2,691,000 acres). The Washington Forest Practices Rules regulate commercial timber 23 activities for private and State lands on a low proportion of lands (15 percent or 944,000 24 acres), which includes 35 percent of all forestlands in the Region. Federal- and State- 25 protected forestlands, not managed for timber harvest, include about 14 percent of all 26 lands (33 percent of all forests). Also, Federal and tribal forestlands available for timber 27 harvest equal about 13 percent of all lands (32 percent of all forests). Exempt 20-acre 28 parcels comprise less than 0.1 percent of the forestlands and about 0.2 percent of the 29 forestlands subject to the Washington Forest Practices Rules in the Middle Columbia 30 Region (Rogers 2003). 31
The amount and location of streams and land affected by forestry activities has the 32 potential to influence production and survival of fish and other aquatic resources to 33 varying degrees. The relative number of stream miles is high in this Region (32,878 34 stream miles), having 12 percent of all State stream miles. However, this Region has a 35 low proportion of all stream miles (20 percent) protected under the Washington Forest 36 Practices Rules. 37
Six federally listed fish populations spawn and rear within this Region, and other 38 populations (e.g., sockeye) migrate through to Snake and Columbia River tributaries. 39 Chinook and chum salmon are listed in the westernmost potions of this Region as part of 40 the lower Columbia River ESU, and steelhead are listed as threatened throughout the 41
Fish and Fish Habitat Draft EIS
4-218
Chapter 4 Region except for the White Salmon River. Bull trout are listed as threatened throughout 1 the Region. Other representative covered species present in the Region include westslope 2 cutthroat, interior redband trout, Pacific and river lamprey, pygmy whitefish, Umatilla 3 and Leopard dace, mountain sucker, and sandroller. 4
Each of the four H’s has been cited as contributing to the listing of one or more of the 5 species. Residential areas comprise a relatively small proportion of all lands in the 6 Region (about 1.2 percent). Agriculture is an important land use within the Region 7 accounting for 18 percent of all lands, particularly within the Yakima Valley, and 8 irrigation diversions have been cited as a major fish concern in the Region relating to fish 9 barriers, water quality, instream flow, and fish predation (DEIS Appendix A). Several 10 major hydroelectric dams are also present in the Region (e.g., Bonneville, The Dalles, 11 John Day) and as well as irrigation dams (e.g., Cle Elum, Kachees, Keechelus, Rosa) and 12 have contributed to habitat loss, reduced survival, and blockage of fish passage. Grazing 13 and, to a lesser degree, urban development impact fish resources and their habitat based 14 on relative amount of the Region affected (DEIS Appendix A). 15
Extensive road networks in some basins have accelerated sediment inputs (DEIS 16 Appendix A). High temperatures in many areas (e.g., Yakima mainstem and Naches, 17 Teanaway Rivers) have contributed to limited spawning and rearing in the system (DEIS 18 Appendix A). Consequently, improvements to the Washington Forest Practices Rules 19 under No Action Alternative 1-Scenario 1 and Alternatives 2, 3, and 4 could have a 20 moderate effect on the recovery of listed or potentially listed species. No Action 21 Alternative 1-Scenario 2 could reduce chances of recovery or decrease the rate of 22 recovery in this Region because of relatively low protection of fish habitat. 23
Improvements in the Washington Forest Practices Rules would likely be a major factor in 24 the recovery of bull trout in the Region because they are predominantly found in forested 25 areas and are influenced less by marine factors, commercial harvest, and urbanization 26 (Fed. Reg. Vol. 63, No.111, June 10, 1998: 31647-31674). Improvements in the 27 Washington Forest Practices Rules would be important for the recovery of chinook 28 salmon and steelhead; however, successful recovery will also likely require 29 improvements in other land use practices. Other covered species would also benefit in a 30 similar manner. Effects would be similar to those noted for the Lower Columbia Region 31 for the same species. 32
The benefits to westslope cutthroat, redband trout, and pygmy whitefish would be similar 33 to those for bull trout because of their more typical reliance on higher elevation forested 34 streams (primarily coldwater lakes for pygmy whitefish) and limited use of larger 35 mainstem rivers that are more heavily affected by non-forestry activities. 36
The Umatilla dace may benefit from the noted alternatives, but little difference would 37 likely exist among them. One of the main limiting factors for Umatilla dace appears to 38 be adequate flow needed for maintenance of interstitial habitat in large substrate in the 39 lower reaches of larger rivers (Wydoski and Whitney 2003). This condition would more 40 often be affected by irrigation and hydroelectric practices than forest practices in this 41 Region (DEIS Appendix A) 42
Draft EIS Fish and Fish Habitat
4-219
Chapter 4 4.8.4.9 Snake River 1 A very low proportion of this Region is designated as forestlands (8 percent or 376,000 2 acres). The Washington Forest Practices Rules regulate commercial timber activities for 3 private, Washington DNR, and other State holdings, on a very low portion, about 3 4 percent (132,000 acres) of all lands, which includes 35 percent of all forestlands in the 5 Region. Federal- and State-protected forestlands, not managed for timber harvest, 6 include about 2 percent of all lands (25 percent of all forests). Also, Federal and tribal 7 forestlands available for timber harvest equal about 3 percent of all lands (40 percent of 8 all forests). Exempt 20-acre parcels comprise less than 0.5 percent of both the total 9 forestlands and the forestlands subject to the Washington Forest Practices Rules in the 10 Snake River (Rogers 2003). 11
The amount and location of streams and forested lands affected by forestry activities has 12 the potential to influence production and survival of fish to varying degrees. The relative 13 amount of stream miles in the Snake River Region is moderate (19,488 stream miles), 14 which includes 7 percent of all State stream miles. This Region also has a very low 15 proportion of total stream miles (5 percent) protected under the Washington Forest 16 Practices Rules. 17
Chinook salmon, sockeye salmon, steelhead, and bull trout are present in the Region. 18 However, sockeye salmon do not spawn or rear in the Region but use the mainstem 19 Snake River as a migration corridor. Chinook, steelhead, and bull trout are listed as 20 threatened within the Region. Other representative covered species present in the Region 21 include westslope cutthroat, interior redband trout, Pacific and river lamprey, margined 22 sculpin, and sandroller. 23
Each of the four H’s has been cited as contributing to the listing of one or more of the 24 species. However, the Region is relatively arid with agricultural land uses (52 percent) 25 and shrublands (29 percent) accounting for most of the land. Forestlands comprise only 8 26 percent of the Region, and only a moderate amount of that area is regulated under the 27 Washington Forest Practices Rules. Irrigation diversions have had a large effect on 28 habitat in many of the river basins (e.g., Walla Walla River Basin), causing reduced flows 29 and higher water temperatures in many reaches, as well as historically delaying or 30 preventing migration of juveniles. High sedimentation is a problem from both agriculture 31 and grazing, but past logging and road development have also contributed substantial 32 sediment inputs in some drainages (e.g., Asotin Creek) (DEIS Appendix A). 33
Large areas of riparian forest have been converted to agriculture, and streams have been 34 channelized and diked. The headwater areas (mostly forested) are the only remnants of 35 undisturbed habitat within much of this Region. A substantial portion of the fish habitat 36 upstream in Idaho is unavailable to listed anadromous species because of impassable 37 dams on the Snake River (e.g., Dworshak, Hells Canyon Complex). Four other major 38 hydroelectric dams (Ice Harbor, Lower Monumental, Little Goose, and Lower Granite) 39 are present along the lower Snake River and are considered by many to be a major 40 influence on the status of chinook salmon, sockeye, and steelhead in the Region (NMFS 41 2000; NMFS 1998; NMFS 1996b; Schaller et al. 1999). 42
Fish and Fish Habitat Draft EIS
4-220
Chapter 4 Consequently, riparian buffers under No Action Alternative 1-Scenario 1 and 1 Alternatives 2, 3, and 4 would represent a minor contribution towards the overall 2 recovery of listed species in the Region. However, within those areas that do have forest 3 practices, riparian buffers should provide benefits to species that utilize those areas from 4 improved stream habitat conditions (e.g., increased stream complexity from increased 5 LWD), which would include bull trout in the Asotin and Tucannon basins. No Action 6 Alternative 1-Scenario 2 could reduce chances of recovery within the limited forested 7 areas covered in this region because of relatively low protection of fish habitat. 8
The other covered species would also benefit in a similar manner. Effects would be 9 similar to those noted for the Lower Columbia Region for the same species occurring 10 there. Known margined sculpin distribution in Washington is limited to tributaries of the 11 Walla Walla and Tucannon Rivers. The species uses moderate-sized streams in pools 12 and glides, and is often associated with salmon, rainbow, and bull trout. Because of 13 improved habitat conditions (e.g., increased LWD to help maintain pools) in the future, it 14 is likely that benefits would be similar to those for the bull trout as a result of the 15 alternatives. 16
4.8.4.10 Columbia Basin 17 The Columbia Basin Region has the lowest proportion of lands designated as forestlands 18 of any region in the State (less than 1 percent or 13,000 acres). The Washington Forest 19 Practices Rules regulate commercial timber activities for private and State land, on a very 20 small portion of all lands (less than 1 percent or 13,000 acres), but essentially all of the 21 forestlands in the Region. Federal- and State-protected forestlands, not managed for 22 timber harvest, include less than 1 percent of all lands (less than 1 percent of all forests). 23 Also, Federal and tribal forestlands available for timber harvest equal less than 1 percent 24 of all lands in the Region (less than 1 percent of all forests). No exempt 20-acre parcels 25 were identified in the Columbia basin (Rogers 2003). 26
The amount and location of streams and forested lands affected by forestry activities has 27 the potential to influence production and survival of fish and other aquatic resources. 28 The relative number of stream miles is moderate in this Region (14,157 stream miles), 29 and encompasses 5 percent of all State stream miles. But the Region also has the lowest 30 proportion of all stream miles protected under the Washington Forest Practices Rules 31 (less than 1 percent). 32
While the Washington Forest Practices Rules influence essentially all forestlands within 33 this Region, the lack of nearly all representative covered species, the general arid nature 34 of this Region, and the presence of forested streams in only scattered areas of the Crab 35 Creek-Wilson Creek basins suggest that implementation of any alternative would have 36 minimal to no effect on covered fish species. 37
4.8.4.11 Upper Columbia River downstream of Grand Coulee Dam 38 A moderate proportion of this Region is designated as forestlands (43 percent or 39 2,774,000 acres). The Washington Forest Practices Rules regulate commercial timber 40 activities for private and State land on a very low proportion of lands (7 percent or 41
Draft EIS Fish and Fish Habitat
4-221
Chapter 4 472,000 acres), which includes 17 percent of all forestlands in the Region. Federal- and 1 State-protected forestlands not managed for timber harvest include about 20 percent of all 2 lands (46 percent of all forests). Also, Federal and tribal forestlands available for timber 3 harvest equal about 16 percent of all lands (37 percent of all forests). Exempt 20-acre 4 parcels about 0.3 percent of the forestlands and about 1.5 percent of the forestlands 5 subject to the Washington Forest Practices Rules in the Upper Columbia-Downstream 6 Region (Rogers 2003). 7
The amount and location of stream miles and lands affected by forestry activities has the 8 potential to influence production and survival of fish and other aquatic resources. The 9 relative amount of stream miles in this Region is the highest in the State (38,869 stream 10 miles), comprising 15 percent of all State stream miles. However, the Region has a low 11 portion of all stream miles protected under the Washington Forest Practices Rules (11 12 percent). 13
Four anadromous salmonid populations are found in this Region including three that are 14 federally listed: chinook salmon (endangered), sockeye salmon, and steelhead and bull 15 trout, both of which are federally endangered. The same nine representative covered 16 species found in the Middle Columbia Region are also present here. 17
Each of the four H’s has been cited as contributing to the listing of one or more of the 18 species. This Region has a high portion of agricultural land use (about 9 percent) plus 19 substantial grasslands (17 percent), much of which is suitable for grazing. However, the 20 primary limiting factor for most anadromous species in the Region is the hydroelectric 21 dams on the mainstem Columbia River (i.e., Rocky Reach, Wanapum, Priest Rapids, 22 Rock Island, Wells, Chief Joseph, and four others mainstem Columbia River dams 23 downstream of this Region), which have reduced mainstem habitat and impeded passage 24 (DEIS Appendix A). 25
In upstream reaches, limiting factors have included harsh winters, high temperatures, and 26 reduced flow. Land conversion to agriculture within riparian areas in the lower part of 27 the basin, as well as road construction, has contributed to habitat degradation (DEIS 28 Appendix A). Water diversion for irrigation also reduces instream habitat in this Region. 29 In several of the drainages sedimentation and elevated temperatures from grazing, 30 agriculture, and forestry limit fish production (DEIS Appendix A). 31
Consequently, the improvements to the Washington Forest Practices Rules under No 32 Action Alternative 1-Scenario 1 and Alternatives 2, 3, and 4 could have a low to 33 moderate effect on the recovery of listed species because of the limited degree to which 34 they can be influenced. However, the effect of improved the Washington Forest 35 Practices Rules on listed species could be moderate within watersheds with substantial 36 private and State forestlands because of future improved stream habitat conditions 37 relative to existing conditions. Changes in the Washington Forest Practices Rules for the 38 listed species would likely have the largest effect on bull trout because they are 39 predominately found in forested areas and are not affected by marine factors and 40 urbanization in this Region (U.S. Federal Register, Vol. 63, No. 111, June 10, 1998, 41 pages 31647-31674). No Action Alternative 1-Scenario 2 could reduce chances of 42
Fish and Fish Habitat Draft EIS
4-222
Chapter 4 recovery or slow the rate of recovery in this Region because of relatively low protection 1 of fish habitat. 2
The other covered species would also benefit in a similar manner as bull trout under these 3 same alternatives. Effects would be similar to those noted for the same species occurring 4 in the Middle Columbia Region because of similar habitat benefits associated with the 5 alternatives. 6
4.8.4.12 Upper Columbia River Upstream of Grand Coulee Dam 7 Because all upstream passage of anadromous fish is blocked at Grand Coulee dam, the 8 only federally listed species present in this Region is bull trout, which is listed as 9 threatened. In addition, six of the nine other representative covered species found in the 10 Middle Columbia Region (no lamprey species or leopard dace), as well as the lake chub 11 are present here. 12
The amount and location of streams and forested lands affected by forestry activities has 13 the potential to influence production and survival of fish and other aquatic resources to 14 varying degrees. The relative amount of stream miles in this Region (33,913 stream 15 miles) is second only to Upper Columbia Downstream of Grand Coulee Dam Region, and 16 encompasses 13 percent of all stream miles in the State. This Region also has a moderate 17 proportion of all stream miles (31 percent) protected under the Washington Forest 18 Practices Rules. Exempt 20-acre parcels comprise less than 0.5 percent of the forestlands 19 and close to 0.5 percent of the forestlands subject to the Washington Forest Practices 20 Rules in the Upper Columbia-Upstream Region (Rogers 2003). 21
A high proportion of this Region is designated as forestlands (71 percent or 4,084,000 22 acres). The Washington Forest Practices Rules regulate commercial timber activities for 23 private and State land on a moderate proportion of lands (31 percent or 1,804,000 acres), 24 which includes 44 percent of all forestlands in the Region. Federal- and State-protected 25 forestlands not managed for timber harvest include about 2 percent of all lands (3 percent 26 of all forests). Also, Federal and tribal forestlands available for timber harvest equal 27 about 38 percent of all lands (53 percent of all forests). 28
Hydroelectric and irrigation dams that have fragmented bull trout distribution and 29 contributed to habitat degradation have been cited as major factors leading to the species’ 30 listing in this Region (Washington Conservation Commission 2003). This Region has a 31 high proportion of agricultural lands (12 percent), but much lower grassland (7 percent) 32 than the Upper Columbia Downstream of Grand Coulee Dam Region. Dams such as 33 Albeni Falls and Box Canyon as well as U.S.-Canada boundary dams have contributed to 34 fragmentation. 35
Forest practices have not been noted as major sources of mass wasting in this Region, 36 although high road densities in some basins have contributed to increases in sediment 37 delivery (DEIS Appendix A). Increased water temperatures in many areas, both from 38 human-induced and natural conditions, limits bull trout distribution (Washington 39 Conservation Commission 2003) (DEIS Appendix A). Past timber practices have 40
Draft EIS Fish and Fish Habitat
4-223
Chapter 4 reduced LWD levels and increased sediment in some watersheds. Agriculture and 1 grazing have also degraded habitat (DEIS Appendix A). 2
Therefore, considering the relatively high proportions of bull trout habitat that can be 3 affected by the Washington Forest Practices Rules, No Action Alternative 1-Scenario 1, 4 and Alternatives 2, 3, and 4 could have a moderate effect on the recovery of bull trout in 5 the Region. No Action Alternative 1-Scenario 2 could reduce chances of recovery or at 6 least slow the rate of recovery in this Region because of relatively low protection of fish 7 habitat. 8
The other covered species would also benefit in a similar manner as bull trout under these 9 same alternatives. Effects would be similar to those noted for the same species inhabiting 10 the Middle Columbia Region. Lake chub are only found in Cedar Lake in this Region 11 (subsection 3.8.5.7, Middle Columbia River). Their preferred habitat includes clear, cool 12 water and clean cobble and gravel (subsection 3.8.3.8, Lake Chub). These habitat types 13 may be influenced by the Washington Forest Practices Rules but their common use of 14 lakes, which would probably be little affected by rules, and their limited distribution, 15 indicates benefits under any of the alternatives would be slight for this species. 16
17
Fish and Fish Habitat Draft EIS
4-224
Chapter 4 This page is intentionally left blank. 1
Draft EIS Amphibians and
Amphibian Habitats
4-225
Chapter 4
4.9 AMPHIBIANS AND AMPHIBIAN HABITATS 1
4.9.1 Evaluation Criteria 2 This subsection describes the two evaluation criteria that were chosen to evaluate how the 3 proposed alternatives would impact amphibians and amphibian habitats. They are: 1) the 4 degree of protection afforded to microhabitat variables that are important to the seven 5 target species (i.e., humidity, air temperature, sedimentation, and downed wood); and 2) 6 the degree of protection afforded to unique habitat types that are important to the seven 7 target amphibian species (i.e., seeps, springs, and headwaters). These evaluation criteria 8 are described in more detail below. 9
4.9.1.1 Microhabitat Variables Important to the Target Amphibian Species 10 Several riparian parameters influence amphibian habitat suitability. They include the 11 character of the microclimate, the level of downed woody debris, and the degree of 12 sedimentation. 13
Some important microclimatic parameters of riparian areas include solar radiation, soil 14 temperature, soil moisture, air temperature, wind velocity, and air moisture or humidity 15 (Dong et al. 1998; Chen 1991; Ledwith 1996). These microclimatic parameters are 16 generally different in riparian versus upland areas. Riparian areas are usually lower in 17 the landscape, nearer to water, and tend to be more complex in vegetation structure. 18 These characteristics contribute to a cooler, moister microenvironment for amphibians. 19 Timber harvest activities can alter the microclimatic gradient between upland and 20 riparian areas (subsection 3.7.1.5, Microclimate) (Dong et al. 1998; Chen 1991; Blaustein 21 et al. 1995; Bury and Corn 1988; Hallock and McAllister 2002). For instance, timber 22 harvest can expose riparian areas to increased solar radiation, thus potentially increasing 23 the ambient air and water temperatures in that area and reducing the relative humidity and 24 soil moisture. Brosofske et al. (1997) found that no-harvest riparian buffers between 148 25 feet and 984 feet in width were needed to maintain unaltered microclimatic gradients near 26 streams. Based on this study and other studies referenced above, many standard buffer 27 widths now in use may not fully protect riparian microclimate. 28
Timber management activities can also change the quantity and size of sediment that is 29 delivered to a stream. This can lead to stream channel instability, pool filling by coarse 30 sediment, or introduction of fine sediment to spawning gravels. Increased sedimentation 31 in headwater streams is thought to negatively impact some amphibian species by filling 32 interstitial spaces in the stream substrate that are important for movement and larval 33 development (Corn and Bury 1989; Diller and Wallace 1996). Riparian buffers in 34 Washington have been shown to be effective in filtering overland sediment, with buffers 35 of at least 30 feet identified as effective in some cases (Rashin et al. 1999). 36
Downed wood (coarse woody debris) is an important microhabitat feature for 37 amphibians. Bury et al. (1991a) found that terrestrial salamander abundance was 38 associated with the presence of coarse woody debris. Ensatina and western redback 39 salamander abundance was positively correlated with coarse woody debris levels in 40
Amphibians and Draft EIS Amphibian Habitats
4-226
Chapter 4 western Washington forests (Aubry et al. 1988; Aubry and Hall 1991). Coarse woody 1 debris provides moist sites where amphibians can avoid predators, forage on the soil 2 surface while still maintaining body moisture, and breed. Nordstrom and Milner (1997) 3 recommended that a minimum of five uncharred hard logs at least 12 inches in diameter 4 and 23 feet long per acre, as well as all soft logs the same size, should be retained to 5 provide suitable coarse woody debris for Dunn’s and Van Dyke’s salamanders. LWD in 6 streams also provides cover for amphibians, as well as erosion control and substrate for 7 egg deposition. Downed logs and woody debris may serve as important refuge and 8 foraging habitat for the Dunn’s salamander (Corkran and Thoms 1996; Leonard et al. 9 1993) and the Van Dyke’s salamander (Nordstrom and Milner 1997; Petranka 1998) 10 (subsection 3.7.1.2, LWD Recruitment). 11
All of these components are evaluated according to how well the alternatives prevent 12 changes in watershed processes that would be detrimental to amphibians and their 13 habitat. As described in subsection 4.7.2 (Evaluation Criteria, Microclimate), the results 14 of Brosofske et al. (1997), Dong et al. (1998), and Chen (1991) indicate that a minimum 15 of 147 feet is considered necessary to maintain most microclimatic gradients, buffer 16 widths greater than 230 feet to maintain air temperature are required, and buffers of up to 17 787 feet are required to maintain humidity. Ledwith (1996) demonstrated that buffer 18 widths of at least 100 feet between clearcuts and streams in northern California 19 significantly reduce air temperature and increase relative humidity. Other studies have 20 reported that 100-foot wide buffers between clearcuts and streams are sufficient to retain 21 adequate shade on streams to maintain suitable stream temperatures (Brown and Krygier 22 1970; Brazier and Brown 1973; Steinblums et al. 1984), which would likely benefit 23 amphibians. Retaining riparian buffers of at least 100 feet can also maintain most woody 24 debris recruitment (Bottom et al. 1983; Harmon et al. 1986; VanSickle and Gregory 25 1990). 26
Because of the variability in recommended buffer widths, the equivalent buffer area 27 index values derived for sediment filtration (subsection 4.4.1.1, Surface Erosion 28 Evaluation Criteria) and LWD recruitment (subsection 4.7.2, Evaluation Criteria, LWD 29 Recruitment) are used as indicators of the relative value of the alternatives for protecting 30 amphibian habitats. Target widths for sediment filtration and microclimatic parameters 31 are chosen from FEMAT (1993), Brosofske et al. (1993), and Chen (1991) (See 32 discussion above). Target guidelines for downed wood are difficult to determine. 33 Amphibian species such as western red-backed salamander and ensatina appear more 34 closely associated with downed woody debris than the target amphibian species. 35 Nonetheless, at least one study recommends coarse woody debris retention in the range of 36 100 to 300 cubic meters per hectare (1,430 to 4,288 cubic feet per acre) to provide 37 adequate cover for terrestrial salamanders (Butts and McComb 2000). 38
4.9.1.2 Unique Habitats Important to the Target Amphibian Species 39 Many unique habitats in the landscape provide refugia for the target amphibians. These 40 include stream junctions, talus slopes, downed woody debris, seeps, and springs. These 41 unique habitats were chosen as evaluation criteria because: 1) some of them are 42
Draft EIS Amphibians and
Amphibian Habitats
4-227
Chapter 4 addressed separately in the proposed alternatives, and 2) some of the target amphibian 1 species appear more closely associated with these unique habitats (subsection 3.9.2, 2 Amphibian Distribution, Status, and Habitat, for discussion of target amphibian habitat 3 requirements). These components are evaluated according to the degree to which they 4 would be protected under the proposed alternatives. 5
In addition to the unique habitats listed above, protection of wetlands was also chosen as 6 an evaluation criterion. None of the seven target amphibian species is directly associated 7 with still water wetland habitats, but wetland buffers and other protection measures can 8 provide some indirect protection for nearby unique habitats that may support populations 9 of these species. 10
4.9.2 Evaluation of Alternatives 11 The effects of the alternatives on amphibian microhabitats and unique habitats are 12 analyzed in the following subsections. In reading this analysis, it should be remembered 13 from Chapter 2 (Alternatives) that under the No Action alternative no ITPs or ESA 14 Section 4(d) take authorization would be issued. This lack of action would likely affect 15 the Forest Practices Regulatory Program in a way that is difficult to predict. Therefore, 16 two scenarios, which represent the endpoints of the reasonable range of possible 17 outcomes for the Forest Practices Regulatory Program, have been defined (subsection 18 2.3.1, Alternative 1 (No Action)) to represent the No-Action Alternative. The effects of 19 No Action are displayed for both of these endpoints in the following subsections, but the 20 actual outcome and the actual effects of No Action on amphibian microhabitat and 21 unique habitats are likely to fall between these two scenarios. 22
4.9.2.1 Microhabitat Variables and Target Amphibians 23 Overview of Effects 24 The first evaluation criterion is the protection afforded to microclimate, sedimentation, 25 and downed wood. The following paragraphs address the degree to which each 26 alternative protects these variables. 27
No Action Alternative 1-Scenario 2 would provide the lowest level of protection for 28 microclimatic variables, sedimentation, and downed wood when compared to the other 29 alternatives. The likelihood for negative habitat effects is high for Type 1-3 waters and 30 very high for Type 4 and 5 waters under this alternative for all three habitat components. 31
No Action Alternative 1-Scenario 1 and Alternatives 2 and 3 would provide a moderate 32 level of protection for microclimate variables, sedimentation, and downed wood when 33 compared to the other alternatives. The likelihood for negative habitat effects is 34 moderate for Type S and F waters adjacent to high site classes and high for Type N 35 waters relative to the maintenance of microclimate. The likelihood for negative effects is 36 low for Type S and F waters and moderate for Type N waters relative to sedimentation 37 and downed wood. This group of alternatives would provide higher levels of protection 38 for all three habitat components when compared to No Action Alternative 1-Scenario 2 39 but lower levels of protection than Alternative 4. 40
Amphibians and Draft EIS Amphibian Habitats
4-228
Chapter 4 Alternative 4 would provide a high level of protection for microclimate variables, 1 sedimentation, and downed wood when compared to the other alternatives. The 2 likelihood for negative habitat effects is low for all three habitat components for low-3 gradient channels and moderate for high-gradient channels. This alternative would 4 provide the highest level of protection for all three habitat components when compared to 5 all other alternatives. A detailed analysis of the alternatives is presented in the following 6 subsections. 7
Detailed Effects Analysis 8 No Action Alternative 1-Scenario 2 9 Under No Action Alternative 1-Scenario 2, the main prescription that applies to the 10 maintenance of the three microhabitat variables mentioned above (microclimate, 11 sedimentation, and downed wood) is the stream-shade requirement, which provides 12 enough shade on Type 1, 2, or 3 streams to meet State water temperature standards 13 (Washington Forest Practices Board 2001b, Section 1). In general, riparian buffers on 14 Type 1 and 2 streams would be between 25 and 100 feet wide, buffers on Type 3 streams 15 would be between 25 and 50 feet wide, and Type 4 and 5 streams generally would have 16 no buffer requirements (subsection 4.7, Riparian and Wetland Processes). 17
Based on recommended riparian widths, the RMZs under No Action Alternative 1-18 Scenario 2 for Type 1-3 waters, which range between 25 and 100 feet, would not 19 maintain complete microclimatic conditions, downed woody debris recruitment, and 20 sediment filtration. Under the January 1, 1999 Washington Forest Practices Rules, RMZs 21 were not required on Type 4 and 5 streams, except under special circumstances; 22 therefore, maintenance of the microhabitat variables important to amphibians would not 23 occur on these headwater streams. These conclusions are supported by the results of the 24 equivalent buffer area index analyses (DEIS Appendix B). 25
No Action Alternative 1-Scenario 2 would produce an equivalent buffer area index for 26 LWD of between 19 and 30 percent of the level needed for complete protection of LWD 27 recruitment potential for all streams in western Washington and 46 to 57 percent for all 28 streams in eastern Washington (subsection 4.7.1, Riparian Processes). The equivalent 29 buffer area index for sediment filtration under No Action Alternative 1-Scenario 2 would 30 range from 65 to 78 percent of the recommended equivalent buffer area index for 31 complete protection for all streams in western Washington and 67 to 86 percent for 32 eastern Washington. These results are explained primarily by the lack of riparian 33 protection, and thus sediment filtration that would occur along Type 4 and 5 streams. 34 Rashin et al. (1999) demonstrated that in most cases, the Washington Forest Practices 35 Rules in effect on January 1, 1999 were ineffective in preventing sediment delivery to 36 Type 4 and 5 streams. In a separate study, Sullivan et al. (1990) demonstrated that 37 January 1, 1999 Washington Forest Practices Rules resulted in substantial increases in air 38 temperature in riparian areas. 39
Some of the prescriptions in the January 1, 1999 Washington Forest Practices Rules 40 partially mitigate the lack of protection for these parameters. These include: 1) clearcuts 41 can be no larger than 240 acres, 2) yarding in RMZs must minimize damage to 42
Draft EIS Amphibians and
Amphibian Habitats
4-229
Chapter 4 vegetation, 3) sidecast along skid trails is limited to above the 50-year floodplain, 4) no 1 more than 30 percent volume removal every 10 years within 200 feet of a designated 2 shoreline (usually Type 1 waters), 5) RMZ requirements are greater when the dominant 3 stream substrate is gravel versus bedrock, and 6) hardwood to conifer ratios must be 4 maintained. 5
In addition to the above protections, some protection would likely occur adjacent to 6 riparian areas where unstable slopes are present; however, the Washington Forest 7 Practices Rules in effect on January 1, 1999 did not explicitly identify specific landforms 8 or features that may be susceptible to mass wasting or include minimum qualifications 9 for persons assessing mass wasting potential. Although the presence of unstable slopes 10 triggered a Class-IV-Special status application, it had to threaten a “public resource” to 11 actually be protected. 12
No Action Alternative 1-Scenario 1 and Alternatives 2 and 3 13 No Action Alternative 1-Scenario 1 and Alternatives 2 and 3 would be more effective in 14 maintaining microclimatic conditions than No Action Alternative 1-Scenario 2 due to 15 more protective RMZs. These include a minimum no-harvest zone of 50 feet (i.e., the 16 core zone), and selective harvest zones (with two options) up to a total of 200 feet beyond 17 the bankfull width or Channel Migration Zone of all Type S and F streams on the 18 westside (depending on site class), and a minimum no-harvest zone of 30 feet and 19 selective harvest zones up to a total of 130 feet beyond the bankfull width or Channel 20 Migration Zone of all Type S and F streams on the eastside. Furthermore, and perhaps 21 more importantly for amphibians, No Action Alternative 1-Scenario 1 and Alternatives 2 22 and 3 provide a variety of protective measures for Type N streams, which are roughly 23 equivalent to Type 4 and 5 streams under No Action Alternative 1-Scenario 2. 24 Additional information on the relative differences between the above alternatives can be 25 found in subsection 2.3 (Alternatives Analyzed in Detail). 26
The Type N protections differ slightly between western Washington and eastern 27 Washington. In western Washington, Type N protections include: 1) a 30-foot 28 Equipment Limitation Zone on all Type N streams, 2) a 50-foot no-harvest buffer applied 29 to both sides of all Type Np streams for the first 500 feet upstream of the intersection with 30 a Type S or F stream, and 3) a 56-foot radius no-harvest patch buffer centered on the 31 intersection of two or more perennial Type N streams. In addition to these prescriptions, 32 landowners must use a variety of protective buffers to protect sensitive sites. These 33 include: 1) no harvest within 50 feet of a soil zone perennially saturated from a headwall 34 or side-slope seep, and 2) no harvest within 50 feet of headwater spring. Overall, at least 35 50 percent of the total length of Type Np waters would receive 50-foot no-harvest buffers, 36 but this percentage is likely substantially higher in areas where there is a high frequency 37 of unstable slopes or landforms. 38
In eastern Washington, Type N protections include: 1) a 30-foot Equipment Limitation 39 Zone on all Type N streams; 2) for partial cuts, the same basal area requirements must be 40 followed as the basal area requirements for RMZ inner zone harvest on a Type 1 through 41 3 stream in the same timber type, and side-slope seeps must be protected with a 50-foot 42
Amphibians and Draft EIS Amphibian Habitats
4-230
Chapter 4 partial cut buffer that meets the basal area and leave tree requirements of the stand; and 3) 1 for clearcuts, a 50 foot no-harvest buffer applied to both sides of the stream must be left 2 at least equal in length to the clearcut buffer length, and the clearcut buffer cannot exceed 3 30 percent of the length of the stream reach in the harvest unit. In addition, harvest may 4 not occur within 50 feet of an outer perimeter of a soil zone perennially saturated from a 5 headwall seep; an outer perimeter of a soil zone perennially saturated from a side-slope 6 seep; or the center of a headwater spring, an alluvial fan, or the center point of 7 intersection of two or more Type Np waters. 8
As described in subsection 4.7 (Riparian and Wetland Processes), both inner zone harvest 9 options under No Action Alternative 1-Scenario 1 and Alternatives 2 and 3 would 10 provide improved LWD recruitment, particularly for fish-bearing streams. Under No 11 Action Alternative 1-Scenario 1 and Alternatives 2 and 3, the equivalent buffer area 12 index for sediment filtration would be approximately 73 to 91 percent of the maximum 13 protection for sediment filtration along western Washington streams and approximately 14 72 to 96 percent along eastern Washington streams. 15
In contrast to No Action Alternative 1-Scenario 2, total buffer widths for Site Classes I 16 and II under these alternatives would approach or exceed the minimum buffer widths 17 recommended for microclimatic parameters, at least on Type S and F streams. However, 18 the no-harvest zones would not be wide enough to allow microclimatic conditions to 19 reach unharvested levels in the inner and outer zones. Protection of microclimate 20 parameters along Type Np streams would likely provide additional suitable amphibian 21 habitat in Type S and F streams. Corn and Bury (1989) found that amphibian diversity 22 was greater in logged stands having uncut timber upstream. However, full maintenance 23 of suitable microclimatic conditions along Type N streams may not be achieved, since at 24 most, these streams are currently protected with a 50-foot no-harvest buffer, which is 25 much smaller than the 147-foot buffer recommended by the literature for complete 26 protection. 27
Microclimatic conditions would be maintained through 100-foot wide, no-harvest buffers 28 that are proposed for Type S and F streams greater than 10 feet wide under Option 2. 29 Option 2 results in the retention of substantially more trees per acre in the inner zone than 30 Option 1. Although the proposed buffers would likely protect instream microclimatic 31 conditions on Site Class I and II Type S and F streams, microclimatic conditions would 32 approach upland levels near the outer edge of the buffers. This means that the buffer 33 itself would not maintain ideal conditions. Semlitsch (1998) recommends a buffer zone 34 of over 500 feet in width as more ecologically realistic to protect important terrestrial 35 habitat. Similarly, Dodd and Cade (1998) state that regulatory buffers should consider 36 the many types of amphibian migratory patterns in upland habitats to preserve habitat 37 critical to all stages of the amphibians’ life cycle. 38
39
Draft EIS Amphibians and
Amphibian Habitats
4-231
Chapter 4 No Action Alternative 1-Scenario 1 and Alternatives 2 and 3 recommend the following 1 downed wood guidelines associated with salvage logging in RMZs in western 2 Washington: 3
Logs with a Solid Core
Less than 1-foot Diameter
1- to 2-foot Diameter
Greater than 2-foot
Diameter Total Number of logs/acre
85 83 26 194
The above guidelines may be translated to a downed wood retention range of between 4 approximately 1,744 and 5,818 cubic feet per acre assuming the following: 1) median 5 diameters for each category above are 0.5, 1.5, and 2.5 feet; and 2) logs are either 6 feet 6 or 20 feet long. These amounts cover the entire range recommended for amphibian 7 habitat in the literature. Therefore, the minimum amount of downed wood required to be 8 left outside the core zone of RMZs in western Washington may be adequate for 9 amphibians if it exists prior to any salvage logging. This parameter would be expected to 10 have relatively minor effects on the highly aquatic torrent salamanders, and more 11 substantial effects on other, more terrestrial, salamanders and frogs. 12
Overall, compared to No Action Alternative 1-Scenario 2, the implementation of No 13 Action Alternative 1-Scenario 1 or Alternative 2 or 3 would be expected to maintain 14 suitable microclimatic, downed wood, and sediment delivery conditions for highly 15 aquatic amphibians along Type S and F waters bordered by Site Classes I or II. These 16 alternatives would substantially improve these same microhabitat conditions along other 17 Type S and F streams, as well as along Type Np streams. This improvement would be 18 due in part to the water typing changes carried forward from the Forests and Fish Report 19 (FFR) in the current Washington Forest Practices Rules. These changes included 20 changing many streams that were classified as Type 4 streams to Type F streams, based 21 on their gradient. 22
Microhabitat conditions in lower site class streams (i.e., III through V) and in the 23 terrestrial habitat of the buffers would not be maintained at optimum levels for the target 24 amphibian species. This would require wider buffers on Type Np streams and buffering 25 greater lengths of these streams than are currently in place under No Action Alternative 26 1-Scenario 1 and Alternatives 2 and 3. Although the design of the current Washington 27 Forest Practices Rules has resulted in substantially better protection for both individual 28 amphibians and amphibian populations compared to No Action Alternative 1-Scenario 2, 29 the proposed buffers would not provide the optimum amount of protection. 30
Although difficult to measure, additional riparian habitat protection occurs in areas of 31 potentially unstable slopes and landforms. Current Washington Forest Practices Rules 32 include reviewing all harvest plans and requiring a qualified person to investigate any 33 areas with potentially unstable slopes. The harvest application becomes a Class IV-34 Special if harvest is planned for unstable slopes. Mitigation measures must be taken in 35 areas where there is risk to a public resource or public safety. Although the current 36 Washington Forest Practices Rules do not prohibit harvest on unstable slopes, many 37
Amphibians and Draft EIS Amphibian Habitats
4-232
Chapter 4 landowners forego harvest in these areas due to SEPA procedural requirements and the 1 risk of operating on unstable slopes. As a result, many unstable slopes and landforms are 2 protected by no-harvest buffers whose width and length are dictated by the extent of the 3 unstable slope or landform. Because the spatial extent of unstable slopes and landforms 4 is highly variable, the width of these buffers (measured from the stream edge) can range 5 from as little as 15 feet to over 200 feet. 6
Alternative 4 7 Alternative 4 proposes similar riparian buffers on all streams on both the eastside and 8 westside. The minimum buffer width is based on stream gradient. Streams with 0 to 20 9 percent gradient would receive a 200-foot no-harvest RMZ, 20 to 30 percent gradient 10 would receive a 100-foot no-harvest RMZ, and greater than 30 percent gradient would 11 receive a 70-foot no-harvest RMZ. Thinning would be allowed within these buffers, but 12 only to improve riparian function and only after a landowner complied with required 13 SEPA procedures. Additional buffers would be provided for Beaver Habitat Zones and 14 Channel Disturbance Zones (areas within 30 feet of the lateral extent of an expected 15 channelized landslide). 16
According to equivalent buffer area index analyses, Alternative 4 would provide from 94 17 to 100 percent of the recommended protection for LWD recruitment and sediment 18 filtration on all streams in both western and eastern Washington. Alternative 4 would 19 also protect approximately two times more riparian acreage on affected lands with 20 riparian buffers compared with No Action Alternative 1-Scenario 1 (i.e., current 21 Washington Forest Practices Rules) (Table 4.9-1). Alternative 4 would also provide wide 22 enough buffers on low-gradient streams to maintain microclimatic conditions suitable for 23 amphibians, unlike either No Action Alternative 1-Scenario 2, or No Action Alternative 24 1-Scenario 1. For example, a 200-foot buffer would be wide enough to provide 25 temperature and moisture conditions approximately 30 feet beyond that which is assumed 26 suitable for the target amphibian species. This aspect of Alternative 4 would be 27 particularly beneficial for the more terrestrial amphibians, such as the tailed frog and Van 28 Dyke’s and Dunn’s salamanders. Furthermore, Alternative 4 would provide additional 29 buffers for beaver habitat. Since this buffer can apply on almost any small, low-gradient 30 stream in the State, many streams could potentially have additional buffers added to them 31 due to this provision. 32
Additional habitat protection relating to the protection of unstable slopes and landforms, 33 beyond those described above, would occur under Alternative 4. For example, 34 Alternative 4 would prohibit harvest on unstable landforms described under the current 35 Washington Forest Practices Rules, require an additional 50-foot buffer around the 36 perimeter of those landforms, and prohibit operations on planar slopes greater than 80 37 percent. These requirements would supplement existing riparian protections, especially 38 for small streams. 39
40
Draft EIS Amphibians and
Amphibian Habitats
4-233
Chapter 4 Table 4.9-1. Estimate of Future Protection in Total Number of RMZ Acres 1
Under All Alternatives for Western and Eastern Washington.1/ 2 Proposed Alternatives
No Action Alternative 1-
Scenario 2
No Action Alternative 1-Scenario 1, Alternative 2,
and Alternative 3 Alternative 4
Total RMZ
Acres
Percent of Covered
Lands (%)Total RMZ
Acres
Percent of Covered
Lands (%) Total RMZ
Acres
Percent of Covered
Lands (%)Westside2/ 630,916 10.0 1,321,992 21.0 2,695,361 42.9Change Relative to No Action Alternative 1-Scenario 2
--
-- 691,076
109.5 2,064,445 327.2
Eastside3/ 196,312 5.8 373,958 11.1 870,622 25.9Change Relative to No Action Alternative 1-Scenario 2
--
-- 177,646
90.5 674,310 343.5
1/ Westside forestlands included all private, city, and county forestlands, but do not include State forested lands because they are covered under the State Trust Lands HCP (Washington DNR 1997d). State forestlands on the eastside are included in the estimated RMZ acres.
2/ Total land area of private/city/county forestland on westside forestland = 6,289,303 acres, with total land area of State forestland equal to 1,715,912 acres.
3/ Eastside land area includes State-owned forested lands along with private/city/county forestlands and totals 2,619,736 acres, with State forestlands totaling 745,035 acres.
Based on the expanded primary and additional buffers, Alternative 4 would be expected 3 to provide the greatest benefits to amphibians through protection of sediment delivery, 4 downed wood, and microclimate. However, some variables, such as air temperature and 5 humidity, would not likely be completely protected under the rules proposed for 6 Alternative 4. 7
4.9.2.2 Unique Habitats and Target Amphibians 8 Studies have identified several unique habitat features that are important in maintaining 9 healthy amphibian populations. These include stream junctions (i.e., confluences), Type 10 N streams (e.g., non-fish-bearing channels), talus, and other refugia (subsection 3.9.2, 11 Amphibian Distribution, Status, and Habitat, for additional habitat requirements). This 12 subsection analyzes the degree to which each alternative protects these features. Some of 13 the features (e.g., Type N streams) are often associated with wetlands or they represent 14 wetland habitat (e.g., seeps, springs). Measures designed to protect wetland habitats may 15 provide indirect protection to unique habitats that support target amphibians. Therefore, 16 this subsection also analyzes the wetland protection measures under each alternative. 17
18
Amphibians and Draft EIS Amphibian Habitats
4-234
Chapter 4 Overview of Effects 1 No Action Alternative 1-Scenario 2 would provide the lowest level of protection for 2 unique habitats compared to all other alternatives. The likelihood of negative habitat 3 effects is high for Type 1-3 waters and very high for Type 4 and 5 waters. This is 4 because the January 1, 1999 Washington Forest Practices Rules did not recognize and 5 protect many of the habitat features important for amphibians (e.g., seeps, springs, talus). 6
No Action Alternative 1-Scenario 1 and Alternatives 2 and 3 would provide a moderate 7 to high level of protection for unique habitats compared to the other alternatives. The 8 likelihood of negative habitat effects is low for Type S and F waters adjacent to high site 9 classes (i.e., I and II), moderate along buffered Type Np waters and sensitive sites, and 10 high along unbuffered Type Np and Ns waters. These alternatives would provide more 11 protection for unique habitats than No Action Alternative 1-Scenario 2 but less protection 12 than Alternative 4. 13
Alternative 4 would provide a high level of protection for unique habitats compared to all 14 other alternatives. The likelihood of negative habitat effects is low for low-gradient 15 channels with 200-foot no-harvest RMZs and moderate for high-gradient channels with 16 70-foot no-harvest RMZs. Alternative 4 would provide substantially more protection for 17 unique habitats than No Action Alternative 1-Scenario 2 and moderately more protection 18 than No Action Alternative 1-Scenario 1 and Alternatives 2 and 3. A detailed analysis of 19 the alternatives is presented in the following subsections. 20
Detailed Effects Analysis 21 No Action Alternative 1-Scenario 2 22 Headwater streams, seeps, springs, and talus received little or no direct protection under 23 the Washington Forest Practices Rules in effect on January 1, 1999. Protection of these 24 unique habitats was largely indirect, occurring only to the extent that these habitats were 25 associated with wetlands. Under the January 1, 1999 Washington Forest Practices Rules, 26 Type A and B wetlands were delineated. Type A wetlands are non-forested wetlands 27 with open water. Type B wetlands are non-forested wetlands other than Type A wetlands 28 greater than 0.25 acre. The third category was forested wetlands. The January 1, 1999 29 Washington Forest Practices Rules did not provide protection for wetlands smaller than 30 0.25 acre. The largest average buffer provided for any wetland was 100 feet. This buffer 31 was provided only on Type A wetlands larger than 5 acres in size. Smaller Type A 32 wetlands and Type B wetlands larger than 5 acres received a 50-foot average buffer. 33 Type B wetlands between 0.5 and 5 acres had an average buffer of 25 feet. Type B 34 wetlands between 0.25 and 0.5 acres received no buffer. The later included areas such as 35 seeps, springs, and headwaters, and were therefore, not protected. 36
The RMZs in the January 1, 1999 Washington Forest Practices Rules were much smaller 37 than those recommended in the literature. Semlitsch (1998) recommended buffers of 38 over 500 feet around wetlands based on studies of pond-breeding salamanders in 39 numerous studies from the midwest and eastern United States. This large buffer was 40 meant to encompass the terrestrial movements of 95 percent of the populations studied. 41 Some of the more terrestrial of the target amphibian species, such as the Dunn’s and Van 42
Draft EIS Amphibians and
Amphibian Habitats
4-235
Chapter 4 Dyke’s salamanders, can spend considerable amounts of time in upland areas adjacent to 1 riparian areas, usually within 150 to 300 feet from the stream (Gomez and Anthony 2 1996). Thus, the January 1, 1999 Washington Forest Practices Rules RMZs did not 3 protect all habitat used by these amphibians in their daily movements. 4
No Action Alternative 1-Scenario 1 and Alternatives 2 and 3 5 Note: The reviewer is reminded to consider the differences in effectiveness over time of 6 the adaptive management program among this group of alternatives (No Action 7 Alternative 1-Scenario 1[low], Alternative 2 [high], Alternative 3 [moderate]) in 8 evaluating the effects discussed below (subsection 4.1.5, Adaptive Management). 9
Measures provided under No Action Alternative 1-Scenario 1 and Alternatives 2 and 3 10 would provide more protection to unique habitats than No Action Alternative 1-Scenario 11 2. Additional information on the relative differences between the above alternatives can 12 be found in subsection 2.3 (Alternatives Analyzed in Detail). The increased RMZs along 13 all Type S and F streams and the establishment of Channel Migration Zones along some 14 Type S and F streams would increase the amount of protection for unique habitats. 15 Furthermore, and perhaps more importantly for amphibians, No Action Alternative 1-16 Scenario 1 and Alternatives 2 and 3 would provide a variety of protective measures for 17 Type N streams. Under the January 1, 1999 Washington Forest Practices Rules, most 18 such streams were classified as Type 4 or 5 and received little or no protection. These 19 protective measures are described above for No Action Alternative 1-Scenario 1 and 20 Alternatives 2 and 3 in subsection 4.9.2.1 (Microhabitat Variables and Target 21 Amphibians). 22
Wetland buffers under No Action Alternative 1-Scenario 1 and Alternatives 2 and 3 23 would not be substantially different from No Action Alternative 1-Scenario 2. However, 24 increased RMZs and Channel Migration Zones would protect additional wetlands on the 25 covered lands (Tables 4.7-4 and 4.7-5). 26
4.9.2.2.1.1 Alternative 4 27 Alternative 4 provides the highest potential benefits for amphibians based on its proposed 28 protection for refugia. It provides the widest riparian buffers, ranging from 70-foot no-29 harvest RMZs on steep gradient streams (greater than 30 percent) to 200-foot no-harvest 30 RMZs on low gradient streams (less than 20 percent). It also proposes the largest buffers 31 on wetlands, including 200-foot buffers on Type A wetlands greater than 5 acres, 100-32 foot buffers on Type B wetlands, and snag and canopy retention standards around non-33 forested wetlands. These buffers are proposed as managed buffers, which mean that they 34 are intended to allow thinning where it is benefits ecological function (Chapter 2, 35 Alternatives). 36
These proposed buffers would provide protection to most of the important refugia 37 thought to be used by torrent salamanders, such as the splash zone of Type N streams. It 38 would also provide adequate buffers on isolated wetlands (200 feet for Type A), which 39 would encompass most of the daily movements of salamanders and tailed frogs living in 40 that environment. Despite these improvements relative to both scenarios of No Action 41
Amphibians and Draft EIS Amphibian Habitats
4-236
Chapter 4 Alternative 1, Alternative 4 may not provide buffers wide enough to maintain all habitat 1 requirements of amphibians using the refugia (Dodd and Cade 1998; Semlitsch 1998). 2
Draft EIS Birds, Mammals, Other Wildlife,
and Their Habitats
4-237
Chapter 4
4.10 BIRDS, MAMMALS, OTHER WILDLIFE, AND THEIR HABITATS 1
4.10.1 Evaluation Criteria 2 The general criterion used to evaluate the effects of the alternatives on birds, mammals, 3 and other wildlife is the degree of habitat protection afforded to the wildlife species 4 discussed in this subsection. A component of this evaluation is the qualitative evaluation 5 of effects on wildlife species that may be associated with riparian habitats for some of 6 their life requisites by comparing the degree of protection afforded to various habitat 7 components (e.g., snag availability, downed woody debris) important to some of the 8 riparian-associated wildlife species identified in Table 3-24. This table is not meant to be 9 inclusive of all wildlife species in Washington that are associated with riparian areas and 10 upland areas. As discussed earlier, over 85 percent of Washington’s native fauna use 11 riparian areas for some portion of their life cycles. Instead, this subsection is limited to 12 species with a listed status. Nonetheless, the discussion provides a general indication of 13 the wide variety of species that could be affected by the proposed alternatives. 14
A general discussion of the effects of the alternatives on wildlife is presented in 15 subsection 4.10.2.1 (General Effects). Following this, subsection 4.10.2.2 (Species-16 specific Discussion) presents a discussion of relevant aspects associated with key 17 individual species. Current Washington Forest Practices Rules provide a variety of 18 protections to wildlife species, particularly for species that are State or Federal listed as 19 threatened or endangered. These critical habitat prescriptions are listed in WAC 222-16-20 080 of the existing Washington Forest Practices Rules. These are described where 21 appropriate in the following subsections. 22
4.10.2 Evaluation of Alternatives 23 The effects of the alternatives on birds, mammals, and other wildlife are analyzed in the 24 following subsections. In reading this analysis, it should be remembered from Chapter 2 25 (Alternatives) that under the No Action alternative no ITPs or ESA Section 4(d) take 26 authorization would be issued. However, this lack of action would likely affect the 27 Forest Practices Regulatory Program in a way that is difficult to predict. Therefore, two 28 scenarios, which represent the endpoints of the reasonable range of possible outcomes for 29 the Forest Practices Regulatory Program, have been defined (subsection 2.3.1, 30 Alternative 1 (No Action)) to represent the No-Action Alternative. The effects of No 31 Action are displayed for both of these endpoints in the following subsections, but the 32 actual outcome and the actual effects of No Action on wildlife are likely to fall 33 somewhere in-between these two scenarios. 34
4.10.2.1 General Effects 35 Overview of Effects 36 The general criterion used to evaluate the effects of the alternatives on other wildlife is 37 the degree of habitat protection afforded to the wildlife species discussed in this 38 subsection. The degree of protection afforded to various habitat components (e.g., snag 39 availability, downed woody debris), and to some degree, the potential to use riparian 40
Birds, Mammals, Other Wildlife, Draft EIS and Their Habitats
4-238
Chapter 4 areas as travel corridors was used. The following paragraphs address the likelihood of 1 impacts to the various habitat components by alternative in a comparative manner. 2
Overall, No Action Alternative 1-Scenario 2 would result in a higher likelihood of 3 impacts to other wildlife species. Although none of the alternatives would provide 4 optimum habitat for most bird and mammal species, No Action Alternative 1-Scenario 2 5 would do little to limit loss of habitat for the species discussed in this subsection and, 6 therefore, the relative impacts to species habitat would be expected to be high. However, 7 specific prescriptions in the Washington Forest Practices Rules (WAC 222-16-080) for 8 species such as the bald eagle, marbled murrelet, and northern spotted owl, would not 9 change. 10
No Action Alternative 1-Scenario 1 and Alternatives 2 and 3 would provide low to 11 moderate likelihood of impacts to birds, mammals, and other wildlife species. No Action 12 Alternative 1-Scenario 1 and Alternatives 2 and 3 would continue to substantially 13 increase the acreage of riparian habitat protected by no-harvest buffers, provide 14 protection for riparian habitat along headwater (Type N) streams, and continue to provide 15 improved wetland protection due to better mapping techniques and protection of seeps 16 and springs connected to Type N streams. 17
Alternative 4 would provide the lowest likelihood of impacts on wildlife species and their 18 habitat. These proposed measures would provide the most protection and potential 19 habitat improvement for other riparian-associated species of any of the alternatives, but 20 the extent of the benefits is unknown. Approximately twice as many acres of riparian 21 habitat would be protected on both westside and eastside forested lands than under No 22 Action Alternative 1-Scenario 1 and Alternatives 2 and 3. Larger buffers should provide 23 increased snag densities and amounts of down woody debris for cavity-nesting birds and 24 mammals, as well as increased substrate for various prey species. In addition, wider 25 riparian buffers under this alternative would provide wider travel corridors for many 26 upland wildlife species; however, it is unlikely that riparian buffer acres alone would 27 contribute substantially to the recovery of some species in Washington State. A detailed 28 analysis of the effects of the alternatives on other riparian habitat-associated wildlife is 29 presented in the following subsections. 30
Detailed Effects Analysis 31 No Action Alternative 1-Scenario 2 32 The January 1, 1999 Washington Forest Practices Rules for riparian buffers were 33 previously noted (subsection 2.3.2.2, Washington Forest Practices Rules and Program-34 Specific Description, No-Action Scenario 2) to be inadequate for the target amphibian 35 species, and would likewise not provide the level of protection needed for other riparian-36 associated wildlife species. Some of the species, such as the Oregon spotted frog, and 37 Columbian white-tailed deer currently have extremely limited distributions. While this 38 makes them very vulnerable to extinction, it is unlikely that private forest practices would 39 impact these species substantially because site-specific management plans are in place for 40 most of the extant populations (McAllister and Leonard 1997; Larsen 1997). Some of the 41 more widely distributed species, including Cascades frog and the red-legged frog, use 42
Draft EIS Birds, Mammals, Other Wildlife,
and Their Habitats
4-239
Chapter 4 aquatic and riparian habitats for breeding, but are usually found in more upland habitats 1 for the rest of their life cycle. 2
Under No Action Alternative 1-Scenario 2, riparian buffers would most likely be 3 inadequate for other amphibian species not already discussed in subsection 4.9 4 (Amphibians and Amphibian Habitats). Many of these species are likely to occur in 5 small, temporary wetlands, many of which are not currently protected if they are less than 6 0.5 acre in size. Cascades frogs can be very abundant in small, isolated high elevation 7 wetlands (Larsen 1997). As recommended by Dodd and Cade (1998), buffers of over 8 600 feet may be necessary to adequately protect all habitat required for the migratory 9 patterns of amphibians in these small wetlands. 10
As for many of the bird species listed in Table 3-23, RMZ prescriptions associated with 11 the Washington Forest Practices Rules in effect on January 1, 1999 do not attempt to 12 protect all of their habitat requirements. The bald eagle receives specific protections for 13 its critical habitat requirements due to its Federal threatened status (WAC 222-16-080). 14 These special provisions protect large buffers around known nest sites. 15
As for other avian species, No Action Alternative 1-Scenario 2 would do little to 16 minimize negative impacts to these species from human activities because of buffer 17 widths that would be less than habitat needs for these species (subsection 2.3.1, 18 Alternative 1 (No Action)). For instance, 100-foot buffers along streams occupied by 19 nesting harlequin ducks are recommended because that is the recommended distance to 20 recruit LWD for loafing, and most nests are usually found in a hollow, rock crevice 21 among boulders, a rock cavity in a cliff face, or in a tree cavity within 100 feet (30 22 meters) of water (Cassirer et al. 1993). Even larger buffers (164 feet [50 meters]) have 23 been recommended to protect suitable nesting habitat (Cassirer and Groves 1990; 24 Thomas et al. 1993). 25
Similar to the birds mentioned above, the mammals listed in Table 3-23 require very 26 large buffers. Some studies have recommended riparian buffers of 100 meters (328 feet) 27 to protect the area of optimum foraging and cover habitat for mink and beaver (Melquist 28 et al. 1981; Allen 1983; Knutson and Naef 1997). Although none of the alternatives 29 would provide optimum habitat for the above bird and mammal species, No Action 30 Alternative 1-Scenario 2 would do little to limit loss of habitat for the above species 31 because of narrow buffer widths, and therefore, the relative impacts to species habitat 32 would be expected to be high (subsection 2.3.1, Alternative 1(No Action)). 33
No Action Alternative 1-Scenario 1 and Alternatives 2 and 3 34 No Action Alternative 1-Scenario 1 and Alternatives 2 and 3 would likely improve 35 habitat over time for other wildlife species in Washington as compared to No Action 36 Alternative 1-Scenario 2 in four main ways: 1) by increasing the acreage of riparian 37 habitat protected by no-harvest buffers (Figures 4.7-5 and 4.7-6); 2) by increasing the 38 amount of riparian habitat protected by selective harvest buffers and Equipment 39 Limitation Zones; 3) by providing protection for riparian habitat along headwater (Type 40 N) streams, which would generally receive no buffers under No Action Alternative 1-41
Birds, Mammals, Other Wildlife, Draft EIS and Their Habitats
4-240
Chapter 4 Scenario 2; and 4) by providing improved wetland protection due to better mapping 1 techniques and protection of seeps and springs connected to Type N streams (subsection 2 4.7, Riparian and Wetland Processes). Additional information on the relative differences 3 between the above alternatives can be found in subsection 2.3 (Alternatives Analyzed in 4 Detail). 5
Alternative 4 6 Compared to existing conditions, Alternative 4 would have the most benefits for other 7 riparian-associated species in Washington. Similar to No Action Alternative 1-Scenario 8 1, other wildlife would benefit in four main ways under Alternative 4 as compared to No 9 Action Alternative 1-Scenario 2: 1) it would substantially increase the acreage of 10 riparian habitat protected by no-harvest buffers (Figures 4.7-5 and 4.7-6); 2) it would 11 provide protection for riparian habitat along streams with gradients greater than 30 12 percent, which would generally received no buffers under No Action Alternative 1-13 Scenario 2; and 3) it would provide improved wetland protection due to improved 14 mapping techniques and protection of seeps and springs connected to Type N streams 15 (subsection 4.7, Riparian and Wetland Processes). These proposed measures would have 16 benefits for riparian-associated species, but the extent of the benefits is unknown. 17 Nevertheless, Alternative 4 would provide the most protection and potential habitat 18 improvement for other riparian-associated species of any of the alternatives. 19
Under Alternative 4, approximately twice as many acres of riparian habitat would be 20 protected in both western Washington and eastern Washington forestlands than under No 21 Action Alternatives 1-Scenario 1 and Alternatives 2 and 3 (Table 4.9-1). Larger buffers 22 under Alternative 4 should increase snag densities and amounts of down woody debris 23 for cavity-nesting birds and mammals, as well as increase habitat for various prey 24 species. An increase in buffer widths may also provide for some additional demographic 25 support for spotted owls on private lands, especially in association with a more 26 contiguous, complex forest with older seral stages (subsection 4.10.2.2, Species-Specific 27 Discussion, Northern Spotted Owl). Wide riparian buffers under this alternative would 28 provide wide travel corridors for many upland wildlife species. However, it is unlikely 29 that riparian buffer acres alone (Figures 4.2-1 and 4.2-2) would contribute substantially to 30 the recovery of some species in Washington State. 31
4.10.2.2 Species-Specific Discussion 32 Marbled Murrelet 33 No Action Alternative 1-Scenario 1 and Alternatives 2 and 3 would provide habitat 34 protection for murrelets specified under WAC 222-10-042, and forest practices would be 35 subject to SEPA where they may cause adverse impacts to marbled murrelets. These 36 rules would not change under any of the alternatives. 37
Murrelets are known to use major river drainages to access nesting stands. Increased 38 buffers may provide some additional murrelet habitat, particularly if it is adjacent to 39 larger blocks of suitable nesting habitat (i.e., older seral stage forest). Nelson and Hamer 40 (1995) found that successful marbled murrelet nests were located significantly farther 41 from edges (greater than 180 feet) than unsuccessful nests. Small patches of habitat have 42
Draft EIS Birds, Mammals, Other Wildlife,
and Their Habitats
4-241
Chapter 4 a greater proportion of edge than do large patches of the same shape, and the linear nature 1 of riparian corridors alone would not add significantly to the recovery of the marbled 2 murrelet. Although none of the alternatives would provide substantial protection of 3 suitable murrelet habitat, No Action Alternative 1-Scenario 2 would provide a higher 4 potential for adverse impacts, followed in descending order by No Action Alternative 1-5 Scenario 1, Alternatives 2 and 3, and lastly, Alternative 4. 6
Northern Spotted Owl 7 Increased buffer widths would likely provide additional habitat for spotted owls 8 especially near individual owl territories or clusters of territories. Riparian buffers would 9 provide for the recruitment of snags and downed woody material for prey species, but 10 perhaps not substantially, for another 50 to 80 years. However, none of the alternatives 11 are likely to contribute substantially to the recovery of the spotted owl in Washington 12 State. 13
No Action Alternative 1-Scenario 1 and Alternative 2 and Alternative 3 would require 14 larger no-harvest buffers than No Action Alternative 1-Scenario 2. The majority of 15 forested riparian areas in western Washington are in an early-seral stage with only 2 16 percent estimated in late-seral stage (subsection 3.7.1, Riparian Areas). Thus, none of 17 these alternatives would likely provide suitable nesting habitat for northern spotted owl 18 for many years. No Action Alternative 1-Scenario 2 would provide the smallest long-19 term benefit, followed in order of increasing habitat by No Action Alternative 1-Scenario 20 1, Alternative 3, Alternative 2, and lastly, Alternative 4. 21
Bald Eagle 22 The breeding population of bald eagles in Washington has increased dramatically in the 23 past 20 years, although two-thirds of nests are on private lands. Land near shores is 24 highly desirable for residential development, and the human population of Washington is 25 expected to increase by 2 million to 7.7 million in the next 20 years, and double to 11 26 million by 2050 (Washington Department of Fish and Wildlife 2001b). Forests near 27 shores are rapidly being cleared, and the needs of eagles and desires of humans are 28 increasingly in conflict. The current Washington Forest Practices Rules (No Action 29 Alternative 1-Scenario 1, Alternative 2, and Alternative 3) would provide more 30 protection and future benefits to nesting eagles than No Action Alternative 1-Scenario 2. 31 Although none of the alternatives would provide full protection of suitable bald eagle 32 habitat, No Action Alternative 1-Scenario 2 would provide the least protection, followed 33 in descending order by No Action Alternative 1-Scenario 1, Alternatives 3 and 2, and 34 lastly, Alternative 4. 35
Oregon Silverspot Butterfly 36 In Washington, the Oregon silverspot butterfly has been documented only on the Long 37 Beach peninsula in the Southwest analysis Region, but is likely extirpated from there. 38 The last confirmed sighting there was during a 1990 survey. Subsequent surveys in 1992, 39 1996, 1997, and 1998 did not document any Oregon silverspot butterflies, and habitat 40 monitoring for early blue violet shows a declining population along the Long Beach 41
Birds, Mammals, Other Wildlife, Draft EIS and Their Habitats
4-242
Chapter 4 peninsula (U.S. Department of the Interior 2001). Due to the habitat requirements of this 1 species, the Oregon Silverspot butterfly would not be expected to be impacted by any of 2 the alternatives. 3
Canada Lynx 4 The lynx population in Washington probably numbers fewer than 100 individuals. 5 Several factors combine to put the population at risk for extirpation. The population 6 includes several small subpopulations (less than 20) that are somewhat isolated. Lynx 7 habitat is limited in extent and fragmented by topography. Riparian areas can provide 8 important habitat linkages in the landscape. Lynx are not limited to riparian corridors for 9 movement to suitable habitat; however, given the naturally fragmented landscape of the 10 more alpine areas of the State where lynx occur, they likely have potential value for lynx. 11 Survival and recruitment of lynx in Washington is probably affected by fluctuations in 12 prey populations. Snowshoe hare, the primary prey species of the lynx, prefer the dense 13 cover of coniferous and mixed forests with abundant understory cover. Thus, protected 14 riparian areas may provide some habitat for snowshoe hares (NatureServe 2003). 15
Under Alternative 4, approximately twice as many acres of riparian habitat would be 16 protected on both westside and eastside forestlands than under No Action Alternative 1-17 Scenario 1 and Alternatives 2 and 3 (Table 4.9-1). The least number of acres would be 18 protected by No Action Alternative 1-Scenario 2. Therefore, the greater the amount of 19 protected riparian areas, the greater the benefit for lynx and their prey - the snowshoe 20 hare. 21
Gray Wolf 22 Riparian buffers may benefit wolves, especially at low elevations (e.g., larger river 23 drainages), and many serve as travel corridors in more fragmented landscapes. Riparian 24 buffers may also concentrate prey species. Under Alternative 4, approximately twice as 25 many acres of riparian habitat would be protected on both westside and eastside 26 forestlands than under No Action Alternatives 1-Scenario 1 and Alternatives 2 and 3 27 (Table 4.9-1). No Action Alternative 1-Scenario 2 would provide the least habitat 28 protection. 29
Columbian White-tailed Deer 30 The primary factors affecting the Lower Columbia population are land conversion, timber 31 harvesting, vehicular traffic, poaching, and flooding (NatureServe 2003). Much of the 32 documented use area is managed as a USFWS National Wildlife Refuge and managed for 33 deer. Harvest within the riparian buffers of the use area is not likely to occur under any 34 of the alternatives; however, if riparian buffers were managed, increased buffer widths 35 may provide for some additional habitat protection, and may reduce potential flooding. 36 Under Alternative 4, approximately twice as many acres of riparian habitat would be 37 protected on both westside and eastside forestlands than under No Action Alternatives 1-38 Scenario 1 and Alternatives 2 and 3 (Table 4.9-1). No Action Alternative 1-Scenario 2 39 would provide the least habitat protection. 40
Draft EIS Birds, Mammals, Other Wildlife,
and Their Habitats
4-243
Chapter 4 Woodland Caribou 1 Habitat fragmentation is cited as a concern under the Selkirk Mountain Woodland 2 Caribou Recovery Plan (USFWS 1994). Timber harvest alters caribou habitat and 3 creates additional human access, which increases potential for mortality from vehicle 4 collisions, or poaching. Logging can potentially affect caribou habitat by eliminating 5 escape (security) cover; migration corridors; and lichen production, a primary food 6 source for this species (USFWS 1994). Riparian buffers may provide more secure travel 7 corridors, as well as additional forage in the form of more complex forest structure. 8 Under Alternative 4, approximately twice as many acres of riparian habitat would be 9 protected on both westside and eastside forested lands than under No Action Alternatives 10 1-Scenario 1 and Alternatives 2 and 3 (Table 4.9-1). No Action Alternative 1-Scenario 2 11 would provide the least habitat protection. 12
Grizzly Bear 13 Riparian buffers provide some connectivity, down woody debris, and forage for grizzly 14 bears, especially in areas of private lands between roadless areas. Under Alternative 4, 15 approximately twice as many acres of riparian habitat would be protected on both 16 westside and eastside forested lands than under No Action Alternatives 1-Scenario 1 and 17 Alternatives 2 and 3 (Table 4.9-1). No Action Alternative 1-Scenario 2 would provide 18 the least habitat protection. 19
20
Birds, Mammals, Other Wildlife, Draft EIS and Their Habitats
4-244
Chapter 4 This page is intentionally left blank. 1
Draft EIS Recreation
4-245
Chapter 4
4.11 RECREATION 1
4.11.1 Introduction 2 The proposed alternatives could affect recreation use on State and private lands in 3 Washington in three main ways. First, differences in the level of harvest within RMZs 4 could affect recreation activities that occur in these areas. These different levels of 5 harvest could also affect recreation activities in adjacent and nearby areas, including 6 recreation activities occurring on adjacent rivers. Second, recreation activities could be 7 affected by potential differences in conversion rates of private forestland under the 8 different alternatives. Third, RMZ management actions could have long-term effects on 9 fish populations that could affect fish-related recreation activities in the future. These 10 potential effects are discussed in the following subsections. 11
In reading this analysis, it should be remembered from Chapter 2 that under the No 12 Action alternative no ITPs or ESA Section 4(d) take authorization would be issued. This 13 lack of action would likely affect the Forest Practices Regulatory Program in a way that 14 is difficult to predict. Therefore, two scenarios, which represent the endpoints of the 15 reasonable range of possible outcomes for the Forest Practices Regulatory Program, have 16 been defined (subsection 2.3.1, Alternative 1 (No Action)) to represent the No-Action 17 Alternative. The effects of No Action are displayed for both of these endpoints in the 18 following subsections, but the actual outcome and the actual effects of No Action on 19 recreation are likely to fall between these two scenarios. 20
4.11.1.1 Overview of Effects 21 From an historical perspective, less restrictive forest practices have resulted in riparian 22 zones that are dominated by high levels of early-seral stage vegetation. The current 23 Washington Forest Practices Rules, as well as those rules in effect on January 1, 1999, 24 provide for reduced levels of harvest within riparian zones compared to harvest levels 25 that occurred in these areas in the past. No Action Alternative 1-Scenario 2 would likely 26 result in future levels of harvest that are similar to current conditions. Reductions in 27 potential future harvest would occur under No Action Alternative 1-Scenario 1, 28 Alternatives 2 and 3, and Alternative 4 relative to current conditions. No Action 29 Alternative 1-Scenario 2 would, however, likely maintain the quality of some recreation 30 experiences, especially those that are enhanced by forested landscapes. These reductions 31 could also maintain the quality of recreation experiences in some adjacent areas, 32 including waterways used for boating, rafting, and other recreation activities. 33
More restrictive alternatives could result in more conversion from forestland to other uses 34 and, therefore, less forested recreation area. While it is not possible to estimate the 35 magnitude of this type of effect, it is likely to be much higher under Alternative 4 than 36 under the other alternatives. The restrictions associated with Alternative 4 are more 37 likely to negatively affect the economic viability of timber production for forest 38 landowners, especially small forest landowners and, therefore, increase the potential for 39 forestland conversion. 40
Recreation Draft EIS
4-246
Chapter 4 The RMZ management actions proposed under the different alternatives could have long-1 term effects on fish populations that could in turn affect fish-related recreation activities 2 in the future. 3
While it is not possible to quantify the potential effects of the alternatives on salmonid 4 populations, it is possible to assess the potential direction of the effects and to provide a 5 general comparison between alternatives. The potential for adverse habitat impacts 6 associated with No Action Alternative 1-Scenario 2 suggest that salmonid populations 7 could decline over the long term under this alternative. Compared to No Action 8 Alternative 1-Scenario 2, habitat impacts under No Action Alternative 1-Scenario 1 (and 9 Alternatives 2 and 3) are much less likely to result in reductions in salmonid populations 10 (i.e., would likely result in long-term improvements in salmonid populations). 11 Alternative 4 could result in the highest likelihood of long-term improvements in habitat 12 and salmonid numbers. Effects on existing salmonid populations would likely have 13 corresponding effects on the availability of salmonids for recreational harvest. 14
4.11.2 Recreation Use in Riparian Management Zones 15 Data on recreation use levels in the potentially affected RMZs are not available. It is, 16 however, reasonable to assume that areas located adjacent to water bodies generally 17 receive more use than similar areas located away from water. Types of recreation use in 18 riparian corridors likely include walking/hiking, fishing, camping, hunting, and 19 picnicking, with activities occurring in particular areas dependent on a number of factors 20 including access and the degree of clearing. Potentially affected lands include lands 21 owned by private forest landowners on both the east and westsides of the State, as well as 22 State-managed lands on the eastside. State-managed lands on the westside are regulated 23 separately under the State Trust Lands HCP (Washington DNR 1997d). State and private 24 lands are estimated to account for 16 percent and 19 percent of total recreation use in 25 Washington State, respectively (Interagency Committee for Outdoor Recreation 2002). 26
The State lands most likely to be affected by the proposed alternatives are Washington 27 DNR-managed forestlands on the eastside that are managed for support of trust 28 beneficiaries with recreation allowed as a secondary use under the Washington State 29 Multiple Use Act (Washington DNR 1992). The private lands currently used for 30 recreation purposes that are most likely to be affected by the proposed alternatives are 31 those owned and managed by large, industrial timberland owners who employ “good 32 neighbor” policies and allow public access for general recreation. Recreation use on 33 these types of private forestlands typically resembles use on forested State trust lands 34 with recreation allowed as long as it does not compromise the owner’s ability to manage 35 the land for business purposes (Interagency Committee for Outdoor Recreation 2002). 36 Private lands that offer developed recreation opportunities, such as campgrounds and golf 37 courses, would not be affected by the proposed alternatives unless they are affected by 38 changes in management on State or private forestlands. 39
The alternatives evaluated in this environmental analysis are programmatic, meaning that 40 they establish direction for broad land areas rather than scheduling activities on specific 41
Draft EIS Recreation
4-247
Chapter 4 parcels of land. As a result, it is not possible to identify specific tracts of land that would 1 be affected by the proposed alternatives. It is, however, possible to estimate the 2 approximate number of acres that would be located in RMZs and unavailable for harvest 3 by alternative. Estimates of the acres in RMZs by alternative are presented in Tables 4 4.11-1 and 4.11-2 for the eastside and westside, respectively, along with the net changes 5 in acres relative to No Action Alternative 1-Scenario 2. Acres in RMZs as a percent of 6 total private and State harvest on the eastside are shown in Figure 4.11-1. Acres in RMZs 7 on the westside are shown as a percent of total private harvest in Figure 4.11-2. These 8 figures provide a general indication of the relative level of protection by alternative, but it 9 is important to note that not all of these acres are necessarily used for recreation purposes. 10
Table 4.11-1. Estimated Eastern Washington Acres in Riparian Management 11 Zones by Alternative. 12
Stream Area 18,740 0.6 19,959 0.6 16,837 0.5Total Acres in RMZs 196,312 5.8 373,958 11.1 870,622 25.9
NET CHANGE RELATIVE TO NO ACTION ALTERNATIVE 1-SCENARIO 22/ No-Harvest Acres 0 0 32,325 1.0 779,378 23.2Light Selective Harvest Acres
0 0 161,743 4.8 (43,236) -1.3
Mod-Heavy Selective Harvest Acres
0 0 (17,641) -0.5 (59,929) -1.8
Stream Area 0 0 1,219 0.0 (1,903) -0.1Total Acres in RMZs 0 0 177,645 5.3 674,310 20.01/ Total acres in RMZs are presented as a percentage of the total land area of private, city, and county forestlands
on the eastside (2,619,736 acres), as well as the total land area of State-managed lands on the eastside (745,035 acres).
2/ Net change percentages are also presented in terms of the total land area of privately owned and State-managed eastside forestland (e.g., (119,335 acres/3,364,771 acres)*100=3.5 percent), not in terms of percent change relative to No Action Alternative 1-Scenario 2.
Source: DEIS Appendix B, Riparian Modeling. 13
14
Recreation Draft EIS
4-248
Chapter 4 Table 4.11-2. Estimated Western Washington Acres in Riparian Management 1
Stream Area 88,275 1.4 87,957 1.4 92,743 1.5Total Acres in RMZs 630,916 10.0 1,321,992 21.0 2,695,361 42.9
NET CHANGE RELATIVE TO NO ACTION ALTERNATIVE 1-SCENARIO 22/ No-Harvest Acres 0 0 238,532 3.8 2,339,584 37.2Light Selective Harvest Acres
0 0 303,265 4.8 (195,879) -3.1
Mod-Heavy Selective Harvest Acres
0 0 149,596 2.4 (83,729) -1.3
Stream Area 0 0 (318) 0.0 4,468 0.1Total Acres in RMZs 0 0 691,075 11.0 2,059,977 32.81/ Total acres in RMZs are presented as a percentage of the total land area of private, city, and county forestlands
on the westside (6,289,303 acres). 2/ Net change percentages are also presented in terms of the total land area of privately owned forestland (e.g.,
(614,403 acres/6,289,303 acres)*100=9.8 percent), not in terms of percent change relative to No Action Alternative 1-Scenario 2.
Source: DEIS Appendix B, Riparian Modeling.
From an historical perspective, less restrictive forest practices have resulted in riparian 3 zones that are dominated by high levels of early-seral stage vegetation (subsection 4 3.7.1.7, Current Condition of Riparian Areas). The current Washington Forest Practices 5 Rules, as well as those rules in effect on January 1, 1999, provide for reduced levels of 6 harvest within riparian zones compared to harvest levels that occurred in these areas in 7 the past. No Action Alternative 1-Scenario 2 would likely result in future levels of 8 harvest that are similar to current conditions. No Action Alternative 1-Scenario 1 and 9 Alternatives 2 and 3 would result in an overall increase in the amount of acres in RMZs, 10 relative to No Action Alternative 1-Scenario 2, with Alternative 4 resulting in a 11 substantial increase in RMZ acres (Figures 4.11-1 and 4.11-2). Reductions in acres 12 available for future harvest relative to current conditions would likely increase the acres 13 that would continue to be available for recreation use in the long-term. Estimating the 14 extent of these potential effects is not possible because the actual areas that would be 15 affected are unknown. 16
Figures 4.11-1 and 4.11-2 illustrate the percent of acres that would be within RMZs under 17 each alternative. These figures provide a relative indication of acres that would be 18 unavailable for harvest and potentially available for recreation use. Harvest may also 19
Draft EIS Recreation
4-249
Chapter 4 Figure 4.11-1. Estimated Percent of Eastern Washington Private and State 1
Lands in Riparian Management Zones by Alternative. 2 3 4 5 6 7 8 9 10 11 12 13 14 15 16 17 18 19 20 21 22 23 24 25 26 27 28 Note: This figure illustrates the percent of total private and State acres in eastern Washington 29
that would be in RMZs by alternative. It is important to note that not all of these acres 30 are presently available for or used for recreation purposes. 31
Alternative 1-Scenario 2 Alternative 2, Alternative 3, Alternative 1-Scenario 1 Alternative 4
Draft EIS Recreation
4-251
Chapter 4 affect the quality of recreation experiences on the affected lands and in adjacent areas. 1 On the eastside, for example, approximately 20 percent more of total private and State 2 acres (about 700,000 acres) would be available for harvest under No Action Alternative 3 1-Scenario 2 than would be available under Alternative 4 (Figure 4.11-1). That does not 4 necessarily mean that harvest would occur on all of these acres, and harvest activities that 5 would occur would likely be spread over an extended period of time into the future. In 6 other words, harvest activities, where they occur, would not all occur at one time. As a 7 result, the overall effects on the forested landscape would be less noticeable to many 8 recreationists over time because there would be variations in the age of the regenerating 9 vegetation in those areas that are harvested. Potential effects on recreation would also 10 likely be reduced by the dispersed nature of much of the recreation use that occurs in 11 these areas. 12
Under Alternatives 2 and 3, No Action Alternative 1-Scenario 1, and Alternative 4, 13 reductions in potential future harvest, that would likely occur relative to current 14 conditions and No Action Alternative 1-Scenario 2, could maintain the quality of 15 recreation experiences in some adjacent areas, including waterways used for boating, 16 rafting, and other recreation activities. However, many of the shorelines in Washington, 17 including those along larger Type 1 streams, are currently largely protected from timber 18 harvest and other management activities under Washington’s Shoreline Management Act. 19
4.11.3 Effects of Forestland Conversion 20 The alternatives could result in conversion from forestland to other uses and, therefore, 21 less forestland available for recreation activities. Forestland conversion trends are 22 discussed in subsection 3.2.4 (Timber Harvest Rates for Western and Eastern 23 Washington). 24
Past trends in conversion of forested lands to other land uses suggest that much of this 25 conversion has occurred in areas located in proximity to major urban areas and 26 transportation corridors. A recent study of land use conversion in King, Pierce, and 27 Kittitas Counties conducted for The Wilderness Society concluded, for example, that 28 between 1985 and 1999 approximately 96,000 acres of forest were converted to urban 29 development (Thomson et al. 2003). Most of this conversion occurred through the 30 removal of young westside forest on the fringe of the Seattle-Tacoma metropolitan area 31 and eastward along Interstate 90 (Thomson et al. 2003). Conversion of forestland to 32 other land uses could reduce the overall availability of private forestlands for recreation 33 use. While it is not possible to estimate the magnitude of this type of effect, it is likely to 34 be much higher under Alternative 4 than under both scenarios of No Action Alternative 35 1. The restrictions associated with Alternative 4 are more likely to negatively affect the 36 economic viability of timber production for forest landowners, especially small forest 37 landowners and, therefore, increase the potential for forestland conversion. This issue is 38 discussed further in subsection 4.2 (Land Ownership and Use). 39
Recreation Draft EIS
4-252
Chapter 4 4.11.4 Effects on Anglers 1 The RMZ management actions proposed under the different alternatives could have long-2 term effects on fish populations that could in turn affect fish-related recreation activities 3 in the future. Fish populations support a major recreational activity in the State. The 4 2001 National Survey of Fishing, Hunting, and Wildlife-Associated Recreation estimated 5 that 808,000 State residents and 130,000 nonresidents 16 years or older fished in 6 Washington in 2001, spending approximately $854 million on fishing-related expenses, 7 including travel, lodging, and equipment (USFWS and Census Bureau 2003). The survey 8 identified approximately 659,000 freshwater anglers, with 211,000 and 156,000 9 freshwater anglers indicating that they fished for salmon and for steelhead, respectively. 10 The survey also identified 386,000 saltwater anglers, with 250,000 saltwater anglers 11 indicating that they fished for salmon in 2001. These categories are not mutually 12 exclusive. Some anglers fish in both fresh and salt water, and the majority fish for more 13 than one species at any one time (U.S. Fish and Wildlife Service and Census Bureau 14 2003). These numbers do, however, provide a good indication of the importance of 15 recreational fishing in Washington State, as well as the importance of salmon and 16 steelhead to this activity. 17
While it is not possible to quantify the potential effects of the alternatives on salmonid 18 populations, it is possible to assess the potential direction of the effects and provide a 19 general comparison between alternatives. The potential for adverse habitat impacts 20 associated with No Action Alternative 1-Scenario 2, suggest that salmonid populations 21 could decline over the long term under this alternative. Habitat impacts under No Action 22 Alternative 1-Scenario 1 are much less likely to result in reductions in salmonid 23 populations. Alternative 3 would result in a slight improvement in salmonid populations 24 over No Action Alternative 1-Scenario 1, and Alternative 2 would likely result in long-25 term improvements in salmonid populations. Alternative 4 would result in the highest 26 likelihood of long-term improvements in habitat and salmonid numbers. Effects on 27 existing salmonid populations would likely have corresponding effects on the availability 28 of salmonids for recreational harvest. 29
The preceding discussion provides a general indication of the likely impacts of the 30 alternatives on recreational fishing. However, future changes in fish populations depend 31 on many factors and programs, of which the proposed action is only one. The actions 32 proposed under Alternatives 2, 3, No Action Alternative 1-Scenario 1, and Alternative 4 33 may not in and of themselves be sufficient to assure an increase in the fishery resource. 34 As discussed above, habitat is just one of the so-called “four H’s” believed to affect fish 35 and especially salmonid populations (Federal Caucus 1999, see also the archive for all 36 Federal Caucus documents, http://www.salmonrecovery.gov/Archive_chronological.shtml) 37 (subsection 4.8.4, Synthesis by Analysis Region). As a result, improvements in fish 38 populations projected under the action alternatives have a high degree of uncertainty 39 associated with them. Impacts to fish are discussed in detail in subsection 4.8 (Fish and 40 Fish Habitat). 41
Draft EIS Visual Resources
4-253
Chapter 4
4.12 VISUAL RESOURCES 1
4.12.1 Introduction 2 The proposed alternatives could affect visual resources in two ways. First, differences in 3 the level of harvest within RMZs could affect visual resources in those areas. Harvest 4 levels could also have visual effects when viewed from adjacent areas. Primary areas 5 where forest-related visual concerns typically exist include major highway corridors, 6 cities and towns, adjacent housing developments, and trails and other recreation areas. 7 Second, visual resources could be affected by potential differences in conversion rates of 8 private forestland under the different alternatives. The following subsections discuss 9 these potential effects. 10
In reading this discussion, it should be remembered from Chapter 2 (Alternatives) that 11 under the No Action alternative no ITPs or ESA Section 4(d) take authorization would be 12 issued. However, this lack of action would likely affect the Forest Practices Regulatory 13 Program in a way that is difficult to predict. Therefore, two scenarios, which represent 14 the endpoints of the reasonable range of possible outcomes for the Forest Practices 15 Regulatory Program, have been defined (subsection 2.3.1, Alternative 1 (No Action)) to 16 represent the No-Action Alternative. The effects of No Action are displayed for both of 17 these endpoints in the following subsections, but the actual outcome and the actual effects 18 of No Action on visual resources are likely to fall somewhere in-between these two 19 scenarios. 20
4.12.1.1 Overview of Effects 21 From an historical perspective, less restrictive forest practices have resulted in riparian 22 zones that are dominated by high levels of early-seral stage vegetation (subsection 23 3.7.1.7, Current Condition of Riparian Areas). The current Washington Forest Practices 24 Rules, as well as those rules in effect on January 1, 1999, provide for reduced levels of 25 harvest within riparian zones compared to harvest levels that occurred in these areas in 26 the past. No Action Alternative 1-Scenario 2 would likely result in future levels of 27 harvest that are similar to current conditions improving visual resources slightly due to 28 required RMZs. No Action Alternative 1-Scenario 1 and Alternatives 2 and 3 would 29 result in an overall increase in the amount of acres in RMZs, relative to No Action 30 Alternative 1-Scenario 2, with Alternative 4 resulting in a substantial increase in RMZ 31 acres and therefore an improvement in visual resources (Figures 4.11-1 and 4.11-2). 32 Reductions in acres available for future harvest relative to current conditions would likely 33 result in the retention of more natural forested landscapes, which would be seen from 34 roads, trails, recreation areas, and viewpoints. 35
More restrictive alternatives could result in more conversion from forestland to other 36 uses, which could have substantial impacts on visual resources with residential and other 37 forms of development replacing natural forested landscapes. While it is not possible to 38 estimate the magnitude of this type of effect, it is likely to be much higher under 39 Alternative 4 than under the other alternatives. The restrictions associated with 40 Alternative 4 are more likely to negatively affect the economic viability of timber 41
Visual Resources Draft EIS
4-254
Chapter 4 production for forest landowners, especially small forest landowners and, therefore, 1 increase the potential for forestland conversion and subsequent impacts to visual 2 resources. 3
4.12.2 Effects of Harvest in Riparian Management Zones 4 The alternatives evaluated in this environmental analysis are programmatic, meaning that 5 they establish direction for broad land areas rather than scheduling activities on specific 6 parcels of land. As a result, identifying specific tracts of land that would be affected by 7 the proposed alternatives is not possible. However, it is possible to estimate the 8 approximate number of acres that would be located in RMZs by alternative, which can 9 then be equated to acres potentially impacting aesthetic values due to harvest scenarios 10 under each alternative. Estimates of the acres in RMZs by alternative are presented in 11 Tables 4.11-1 and 4.11-2 for the eastside and westside, respectively, along with the net 12 changes in acres relative to the No Action Alternative. Acres in RMZs as a percent of 13 total private and State harvest on the eastside are shown in Figure 4.11-1. Acres in RMZs 14 on the westside are shown as a percent of total private harvest in Figure 4.11-2. These 15 figures provide a general indication of the relative level of protection by alternative, but 16 not all of the acres shown in RMZs under the action alternatives would necessarily be 17 harvested under the No-Action Alternative. 18
From an historical perspective, less restrictive forest practices have resulted in riparian 19 zones that are dominated by high levels of early-seral stage vegetation (subsection 20 3.7.1.7, Current Condition of Riparian Areas). The current Washington Forest Practices 21 Rules, as well as those rules in effect on January 1, 1999, provide for reduced levels of 22 harvest within riparian zones compared to harvest levels that occurred in these areas in 23 the past. No Action Alternative 1-Scenario 2 would likely result in future levels of 24 harvest that are similar to current conditions. No Action Alternative 1-Scenario 1 and 25 Alternatives 2 and 3 would result in an overall increase in the amount of acres in RMZs, 26 relative to No Action Alternative 1-Scenario 2, with Alternative 4 resulting in a 27 substantial increase in RMZ acres relative to both No Action Alternative 1 scenarios 28 (Figures 4.11-1 and 4.11-2). Reductions in acres available for future harvest relative to 29 current conditions would likely result in the retention of more natural forested 30 landscapes, which would be viewed from public roads, trails, and vistas. Estimating the 31 extent of these potential effects is not possible because the actual areas that would be 32 affected are unknown. 33
This broad assessment provides some indication of the relative potential of the 34 alternatives to affect visual resources based on the level of timber harvest and associated 35 ground disturbing activities, such as road construction, that could occur under each 36 alternative. It is, however, important to recognize that affected State lands managed for 37 timber production under all alternatives would be managed under the Washington DNR’s 38 visual management procedure, which seeks to minimize potential impacts to visual 39 resources by managing harvest activities with respect to sensitive viewshed areas. In 40 addition, potential impacts to visual resources on both State and private lands would be 41 mitigated by various aspects of the current Washington Forest Practices Rules that would 42
Draft EIS Visual Resources
4-255
Chapter 4 remain in effect under all alternatives (subsection 3.12.2, Visual Resources and the 1 Current Washington Forest Practices Rules). These include the restriction on the size of 2 clearcut harvest areas (240 acres or less) and the retention of four or five uncut trees per 3 acre for wildlife. It may be noted that some private forest landowners voluntarily leave 4 additional buffers specifically for visual resource protection (subsection 3.12.2, Visual 5 Resources and the Current Washington Forest Practices Rules). 6
4.12.3 Effects of Forestland Conversion 7 Past trends in conversion of forested lands to other land uses suggests that much of this 8 conversion has occurred in areas located in proximity to major urban areas and 9 transportation corridors. Land conversion to uses other than forestland could have 10 negative impacts on visual resources with residential and other forms of development 11 replacing natural forested landscapes. While it is not possible to precisely estimate the 12 magnitude of this type of effect, it is expected to be higher under Alternative 4 than under 13 Alternatives 2, 3, No Action Alternative 1-Scenario 1, and especially No Action 14 Alternative 1-Scenario 2. The restrictions associated with Alternative 4 are more likely 15 to negatively affect the economic viability of timber production for forest landowners, 16 especially small forest landowners and, therefore, increase the potential for forestland 17 conversion. This issue is discussed further in subsection 4.2 (Land Ownership and Use). 18
19
Visual Resources Draft EIS
4-256
Chapter 4 This page is intentionally left blank. 1
Draft EIS Archaeological, Historical, and Cultural Resources
4-257
Chapter 4
4.13 ARCHEOLOGICAL, HISTORICAL AND CULTURAL RESOURCES 1
4.13.1 Statutory and Regulatory Context 2 This subsection describes the statutory and regulatory context within which the 3 alternatives are evaluated. 4
36 Code of Federal Regulations 800, Section 106-National Historic Preservation Act 5 - Section 106 of the National Historic Preservation Act (NHPA) of 1966 (16 U.S.C. 470 6 et seq.) requires Federal agencies to take into account the effects of their undertakings on 7 properties eligible for inclusion in the National Register of Historic Places. The NHPA 8 also affords the Advisory Council on Historic Preservation a reasonable opportunity to 9 comment. The historic preservation review process mandated by Section 106 is outlined 10 in regulations issued by the Advisory Council on Historic Preservation (Protection of 11 Historic Properties [36 CFR Part 800]). As defined in the regulations, “undertaking” 12 means a project, activity, or program funded in whole or in part under the direct or 13 indirect jurisdiction of a Federal agency, including those carried out by or on behalf of a 14 Federal agency; those carried out with Federal financial assistance; or those requiring a 15 Federal permit, license, or approval. With regard to making a determination as to 16 whether any action is an undertaking, an agency should examine the nature of its Federal 17 involvement taking into consideration factors such as the degree of Federal agency 18 control or discretion, the type of Federal involvement or link to the action, and whether or 19 not the action could move forward without the Federal action. 20
The issuance of a permit for a Habitat Conservation Plan is generally considered by the 21 Services to be an undertaking subject to compliance with Section 106 of the NHPA, 22 although each HCP is unique, and the degree of agency control or discretion may be low, 23 or if determined to be an undertaking, the HCP may or may not have the potential to 24 cause effects on historic properties. Consultation with the Tribes and the public is 25 emphasized, while consultation with the State Historical Preservation Officer is required. 26 Section 106 review requires that agencies: 1) determine if their action is an undertaking; 27 2) if so, gather information to determine if any cultural or historic properties within the 28 area of potential effect are eligible for the National Register of Historic Places; 3) 29 determine how historic properties might be affected; 4) explore alternatives to avoid or 30 reduce harm to historic properties; and 5) reach agreement with the SHPO and Tribes 31 affected by the action on measures to address any adverse effects. 32
RCW Chapter 27.44-Indian Graves and Records Act - This statute makes it a crime to 33 knowingly disturb, remove, or damage American Indian graves and glyptic records, such 34 as petroglyphs or pictographs. 35
RCW Chapter 27.53-Archaeological Sites and Resources Act - This statute prohibits 36 any individual, corporation, or agency from knowingly removing, altering, or disturbing 37 any archaeological site or object without a written permit from the Director of 38 Community, Trade, and Economic Development, or the Director’s designee (this includes 39 forestland subject to the Forest Practices Act). 40
Archaeological, Historical, Draft EIS and Cultural Resources
4-258
Chapter 4 Washington Administrative Code 222-16-Forest Practices Rules - These regulations 1 provide a venue for Washington Tribes to designate areas of interest, comment on 2 individual forest practices applications and their impact on archaeological and cultural 3 resources, and develop a plan with the forest landowner to protect the archaeological or 4 cultural resource of concern. 5
Forest Practices that may impact cultural, archaeological, or historic sites are Class III or 6 Class IV-Special forest practices. A Class III application is triggered when 7
harvesting, road construction, site preparation, or aerial application of 8 pesticides occurs on lands that contain cultural, historic, or 9 archaeological resources which, at the time the application or 10 notification is filed are: (i) on or are eligible for listing on the National 11 Register of Historic Places (NRHP; or (ii) have been identified to the 12 department as being of interest to an affected Indian Tribe” (tribal 13 cultural resource). 14
A Class IV-Special application is required for timber harvesting, road construction, 15 landings, rock quarries, gravel pits, borrow pits, and spoil disposal areas on 16 archaeological or historic sites registered with the Washington State Office of 17 Archaeology and Historic Preservation, or on sites containing evidence of Native 18 American cairns, graves, or glyptic records, as provided for in RCW Chapters 27.44 and 19 27.53 Under WAC 222-16, Washington DNR is required to consult with affected Indian 20 Tribes in identifying Class IV Special sites of concern. 21
Washington DNR funds a position at the Office of Archaeology and Historic Preservation 22 that maintains a data base with locations of known archaeological sites or resources, 23 historic sites, or tribal cultural resources. Washington DNR accesses this database when 24 a forest practices application/notification) is filed to correctly class the forest practices 25 application/notification. If the forest practices application/notification causes a hit in the 26 Office of Archaeology and Historic Preservation database, Washington DNR consults 27 with the Office of Archaeology and Historic Preservation to determine the appropriate 28 classification of the application/notification. 29
A Class IV-Special application must include a SEPA environmental checklist and public 30 review in compliance with SEPA. Washington DNR may require additional information 31 or a detailed environmental impact statement. Once the Class IV-Special forest practices 32 application is complete (all necessary documents submitted), Washington DNR will do 33 one of the following: approve, disapprove, or approve the application with conditions for 34 mitigation measures to protect cultural resources. 35
Washington Administrative Code 222-20-120-Forest Practices Rules - This regulation 36 designates that DNR will notify affected Indian Tribes of all of forest practices 37 applications/notifications of concern to such Tribes and that landowners, where an forest 38 practices application/notification involves cultural resources, shall meet with the affected 39 Tribe(s) with the objective of agreeing on a plan for protecting the archaeological or 40 cultural value. 41
Draft EIS Archaeological, Historical, and Cultural Resources
4-259
Chapter 4 When a Class III or Class IV-Special forest practices application involves a tribal cultural 1 resource, the landowner must meet with affected Tribes with the objective of agreeing on 2 a plan for protecting archaeological or cultural values. If the parties come to an 3 agreement, then the landowner may voluntarily add the mitigation measures to the forest 4 practices application. If this occurs, Washington DNR will enforce the mitigation 5 measures as terms of the permit. The affected Tribe decides whether a copy of the 6 agreement will be sent to the Office of Archaeology and Historic Preservation. 7 Regardless of whether or not agreement between the landowner and Tribe is reached on a 8 plan for protecting the resource, the provisions of RCW Chapters 27.44 and 27.53 9 (above) still apply to sites and resources under their scope. Enforcement of RCW 10 Chapter 27.53 is assigned to the Director of the Office of Community, Trade, and 11 Economic Development and RCW Chapter 27.44 is under the jurisdiction of the State 12 superior court system. 13
Forest practices under both the TFW Agreement and FFR provide for procedures to 14 increase cooperation between landowners and the Tribes over the protection of cultural 15 resources. The most recent agreements are discussed below as the Cultural Resources 16 Protection and Management Plan and Watershed Analysis Cultural Resources Module. 17
Cultural Resources Protection and Management Plan - In July 2003, the TFW 18 Cultural Resources Committee presented the Washington Forest Practices Board with the 19 Cultural Resources Protection and Management Plan (Plan). The Plan demonstrates 20 Washington DNR’s relationship with Washington Tribes. The Plan is a collaboratively 21 developed multi-caucus proposal for cultural resource planning, protection, and 22 management based on the commitments made in the 1987 Washington State TFW 23 Agreement, an inter-tribal proposal, and the 1999 FFR. 24
The basic functions of the Plan involve largely voluntary actions designed to: foster 25 improved communication and mutual respect between the State, Tribes, and land owners; 26 provide cooperative processes to protect and manage cultural resources; and provide 27 educational opportunities to foster trust, commitment, and understanding. Memoranda of 28 Understanding, signed documents that describe the verbal agreements between 29 landowners and Tribes are cited in the Plan as the preferred pathway to protect cultural 30 resources. 31
The Plan’s educational opportunities include programs and workshops designed for land 32 owners, land managers, Tribes, and State agencies. The goal of this education is a 33 common understanding of cultural resource issues in a forest management context. A 34 small forest landowner educational program, for example, is currently under 35 development. 36
For its part, the Washington DNR’s Forest Practices commitments in the Plan include 37 outreach to Tribes to identify and automatically give notice of permits in their geographic 38 areas of interest, requiring cultural resources information on the forest practices 39 application/notification form, updating Forest Practices program guidance on cultural 40
Archaeological, Historical, Draft EIS and Cultural Resources
4-260
Chapter 4 resources rules, and assisting the Office of Archaeology and Historic Preservation in 1 updating and maintaining its archeological and historic inventories. 2
Watershed Analysis Cultural Resources Module -The Plan also includes a proposed 3 Watershed Analysis Cultural Resources Module. The module is a required part of any 4 new forest practices Watershed Analysis process, and is a stand-alone method for 5 identifying and protecting resources in any landowner context outside the Watershed 6 Analysis process. For example, the module could be used in consultations pursuant to a 7 forest practices application on property that contains known cultural resources, and as a 8 planning tool for producing a landowner’s inventory of cultural resources. The 9 methodology is a five-step process. Step 1, Startup, entails identifying and contacting 10 stakeholders, choosing and training a research team, and developing a research plan. 11 Step 2, Cultural Resources Assessment, produces an inventory of known cultural 12 resources through literature and records review and interviews with tribal elders and other 13 knowledgeable informants. Step 3, Synthesis, is an assessment of the condition, 14 sensitivity, and vulnerability of identified cultural resources and the development of 15 problem statements that identify threats to particular cultural resources. Step 4, 16 Management Strategies Process, establishes a process for voluntarily minimizing or 17 preventing adverse impacts. Step 5 is a summary of the process, including development 18 of a plan for monitoring the effectiveness of the voluntary management strategies. 19
Forest Landowners Voluntary Involvement - In addition to statutory and regulatory 20 efforts, many forest landowners in Washington voluntarily work with Tribes that may 21 have concerns about the landowner’s forest management and potential effects on cultural 22 resources. 23
Summary 24 Under the laws, rules, and the agreements summarized above, cultural resources receive 25 varying levels of protection. Archaeological sites and resources, including Indian graves, 26 cairns, artifacts, and implements of culture or glyptic records are protected by State laws 27 in RCW Chapters 27.44 and 27.53. These laws apply regardless of the forest practices 28 rules. The Washington Forest Practices Rules, Chapter 222 WAC, require notice to the 29 Tribes, SEPA review, landowner tribal meetings, and, once adopted into rule, a cultural 30 resource assessment as part of any new Watershed Analysis process. Surveys to 31 determine the location and identification of previously undocumented cultural resources 32 are not required under Washington Forest Practices Rules unless committed to as a result 33 of the SEPA process. 34
Existing Office of Archaeology and Historic Preservation information is supplemented by 35 tribal and landowner knowledge of undocumented cultural resources. These resources 36 are usually identified upon consultation with affected Tribes. Protections for cultural, 37 historic, or archaeological resources are voluntary under Washington Forest Practices 38 Rules, however, RCW Chapters 27.44 and 27.33 continue to provide protection for these 39 resources. 40
Procedures exist under the Forest Practices application process, the Cultural Resources 41 Protection and Management Plan, and the State Watershed Analysis Cultural Resources 42
Draft EIS Archaeological, Historical, and Cultural Resources
4-261
Chapter 4 Module whereby traditional sites and materials may be identified in consultation with 1 affected Tribes who may choose not to document the resource outside of tribal 2 knowledge because of the history of site disturbance and looting. Through voluntary 3 processes in the TFW Agreement and the Cultural Resources Plan (including the stand-4 alone option for the Watershed Analysis Cultural Resources Module), understanding, 5 respect, and protection of all cultures resources is enhanced. 6
4.13.2 Evaluation Criteria 7 Assessment of the effects of the four alternatives on cultural resources is necessarily 8 qualitative. The actual numbers of archaeological sites and resources, historic sites, and 9 cultural resources and the numbers of culturally important species (e.g., fish) are mostly 10 unknown and in some cases remain un-assessed during the forest practices application 11 process. Consequently, the evaluation of effects from the four alternatives is qualitative 12 and based on acreage taken out of forest production with required RMZs, the anticipated 13 degree of landowner cooperation with voluntary procedures, and the estimated effect on 14 protected species of fish. Rationale for each measure is provided below. Archaeological 15 sites and resources and Indian graves, cairns, and glyptic records, when known, would 16 receive the same level of protection under all alternatives. 17
4.13.2.1 Acreage Taken Out of Forest Production 18 Alternatives differ in the width of the RMZ provided along watercourses and on unstable 19 slopes. Whenever forested land, particularly land along streams, is unharvested, the 20 archaeological sites and resources, historic sites, traditional sites, and traditional 21 resources that may occur within that RMZ are protected from forest practices activities, 22 whether or not they have been documented. The wider the RMZ, and the more stringent 23 the constraints within the RMZ, the greater the number of cultural sites and population of 24 resource species likely to be protected. 25
4.13.2.2 Voluntary Landowner Cooperation 26 Protection of historic sites, traditional sites, and traditional resources is largely voluntary 27 under forest practices and dependent on the development of mutual good will between 28 agencies, landowners, and Tribes. However, landowners are required to follow RCW 29 Chapters 27.44 and 27.33, independent of any additional voluntary cooperation that takes 30 place between landowners and respective tribal governments. It is assumed that forest 31 landowners are more likely to voluntarily participate in protecting cultural resources 32 when take authorization is granted and when regulations do not take much timberland out 33 of production. Small landowners’ ability to harvest timber profitably will be particularly 34 affected by RMZ requirements, so willingness to voluntarily participate in cultural 35 resource protection agreements may wane as RMZs expand. Still, the less regulatory 36 certainty provided under a specific alternative, the less likely owners would agree to 37 additional constraints on the use of their land. As voluntary participation declines, more 38 historic sites, cultural sites, and traditional resources are likely to be adversely affected. 39 The access by tribal members to traditional sites and traditional resources can also be 40 expected to decline with regulatory uncertainty. 41
Archaeological, Historical, Draft EIS and Cultural Resources
4-262
Chapter 4 4.13.2.3 Effects on Salmonid Species 1 Salmon are important traditional resources to all Washington Tribes, and bull trout are 2 particularly important in watersheds outside the historic range for salmon. Assessments 3 of the relative impact of the four alternatives on these traditional resources will be 4 incorporated in the assessment of cultural resources. 5
4.13.3 Evaluation of the Alternatives 6 4.13.3.1 No Action Alternative 1-Scenario 1 7 No take authorization or take limits under ESA Section 4(d) Rules would be granted by 8 the Services under this alternative, yet the width of the no-harvest RMZ and the inner 9 zones would be the same as those required under Alternatives 2 and 3 that do provide 10 take authorization. Under this scenario, there is no requirement for Federal agencies to 11 make a determination with respect to an undertaking because there is no proposed 12 Federal action. With this scenario, it is unlikely that the Forests and Fish Agreement 13 would continue to be supported by parties to the agreement. As a result, voluntary 14 compliance with cultural resources policies established under the Cultural Resources 15 Protection and Management Plan is thus, likely to be lower than expected if take 16 authorization is granted (Alternatives 2 through 4). 17
No-harvest RMZs protect an estimated 700,000 acres in western Washington and 83,000 18 acres in eastern Washington, while inner zones of 135,000 acres in the east and 577,000 19 acres in the west provide partial protection. These zones protect undocumented 20 archaeological sites and any traditional sites or resources that may occur within them. 21 Salmonids are expected to be protected at a moderate level, as under Alternatives 2 and 3. 22 In summary, undocumented archaeological sites are expected to receive moderate 23 protection, while protection for historic sites, traditional resources, and traditional sites 24 would be lower than that under all other alternatives except No Action Alternative 1-25 Scenario 2. 26
4.13.3.2 No Action Alternative 1-Scenario 2 27 This alternative assumes that no take authorization or take limits would be granted by the 28 Services and thus, there is no requirement for Federal agencies to make a determination 29 with respect to an undertaking because there is no proposed Federal action. Under No 30 Action Alternative 1-Scenario 2, through legislative direction, the State would revert 31 back to the Forest Practices Regulatory Program and Washington Forest Practices Rules 32 as they existed before 1999. This would mean reduction or termination of funding for the 33 Forests and Fish programs, elimination of the landowner incentive program, and a 34 reduction in Washington DNR staff for rule implementation and enforcement. 35
Under this scenario, much of the voluntary process established in the Cultural Resources 36 Protection and Management Plan may be abandoned, so voluntary protections for cultural 37 resources, along with access to traditional sites and resources would likely be at their 38 lowest level among all alternatives. Undocumented archaeological sites and traditional 39 sites and resources located close to streams would receive less protection; only about 40 38,000 acres in eastern Washington and 147,000 acres in western Washington would be 41
Draft EIS Archaeological, Historical, and Cultural Resources
4-263
Chapter 4 protected by no-harvest policies. An additional 317,000 acres in the west and 53,000 1 acres in the east would be partially protected by light selective harvest prescriptions. 2 There would be less protection for undocumented archaeological sites. Salmonid species 3 would receive the least protection under this alternative. In summary, under No Action 4 Alternative 1-Scenario 2, adverse impacts to undocumented archaeological sites, 5 traditional sites and resources, and to historic sites would be greatest among the four 6 alternatives. 7
4.13.3.3 Alternative 2 8 This alternative presumes that the Services grant take authorizations to the State. Thus, 9 under this alternative, Federal agencies have a responsibility under NHPA Section 106 to 10 make a determination whether or not the proposed Federal action is an “undertaking,” as 11 previously defined. Regardless of the determination, protections of historic properties 12 under this alternative would likely be increased and/or improved from those provided 13 under No Action Alternative 1-Scenario 2 because there are already protection provisions 14 incorporated into the current Washington Forest Practices Rules, and because of the 15 collaboratively developed Cultural Resources Protection and Management Plan. 16 Compared to No Action Alternative 1-Scenario 1, protection of historic properties under 17 Alternative 2 may or may not change, depending on the determination and any 18 subsequent consultation with the State Historic Preservation Office and the Tribes. 19
Under this alternative, salmonids would receive moderate protection. No-harvest zones 20 and light selective cut acreages would be the same as under No Action Alternative 1-21 Scenario 1 and Alternative 3, providing moderate protection for undocumented 22 archaeological sites and traditional resources found in riparian zones. Landowners would 23 receive maximum assurances that they are considered to be in compliance with the ESA. 24 They are, therefore, expected to be more likely to comply with the Cultural Resources 25 Protection and Management Plan, entering into consultation with Tribes and Washington 26 DNR and voluntarily protecting or allowing access to cultural resources that are not 27 directly protected by statute. As a consequence, undocumented archaeological resources 28 would be moderately protected, while historic sites, traditional sites, and traditional 29 resources, except salmonids, would receive the most protection among the alternatives. 30
4.13.3.4 Alternative 3 31 This alternative provides take limits under the ESA Section 4(d) rule. It has not been 32 determined whether or not a 4(d) rule limit qualifies as an undertaking under NHPA 33 Section 106. Regardless of whether it is determined that take approval under ESA 34 Section 4(d) is an “undertaking,” protection of historic properties under Alternative 3 35 may or may not be changed compared to No Action Alternative 1-Scenario 1, but would 36 likely be improved compared to No Action Alternative 1-Scenario 2 because of the 37 protection provisions in the current Washington Forest Practices Rules. This alternative 38 provides only take limits under the 4(d) rule and is thus, expected to receive a lower level 39 of voluntary compliance with the Cultural Resources Protection and Management Plan 40
Archaeological, Historical, Draft EIS and Cultural Resources
4-264
Chapter 4 than would Alternative 2. This level of compliance is, however, expected to be higher 1 than that attained under Alternatives 4 and No Action Alternative 1 (both scenarios). 2
The width of no-harvest and inner zones is equal to that of Alternative 2, so the protected 3 acreage, and thus, the protection of undocumented archaeological resources and other 4 streamside cultural resources, is again moderate. Salmonids are expected to be protected 5 at a moderate level, as under No Action Alternative 1-Scenario 1 and Alternative 2. 6 Therefore, undocumented archaeological sites and salmonids would receive a moderate 7 level of protection, while historic sites, traditional sites, and non-salmonid traditional 8 resources would receive a lower level of protection than Alternative 2, but higher than No 9 Action Alternative 1-Scenario 1 or Alternative 4. 10
4.13.3.5 Alternative 4 11 This alternative assumes that the Services would grant take authorizations under ESA 12 Section 10(a)(1)(B). Depending on the Federal NHPA Section 106 determination, and 13 any subsequent consultation to seek ways to address adverse effects on historic 14 properties, the protection of historic properties under Alternative 4 may or may not be 15 changed compared to No Action Alternative 1-Scenario 1, but would likely be improved 16 compared to No Action Alternative 1-Scenario 2 because of more restrictions on timber 17 harvest. 18
Alternative 4 designates a much higher proportion of forestland as no-harvest compared 19 to all other alternatives; including 973,000 acres in eastern Washington and 2,963,000 20 acres in western Washington. This would remove approximately 29 percent of the 21 forestland from production in the east and 47 percent from production in the west. This 22 degree of restriction is expected to substantially lower the level of landowner cooperation 23 with voluntary rules and would likely lead to much higher levels of conversion from 24 forestland to residential development. As a result, under Alternative 4, undocumented 25 archaeological sites and some traditional resources would receive much greater protection 26 where wider RMZs are established and other limits to harvest are enforced. However, the 27 lower level of voluntary compliance with the Cultural Resources Protection and 28 Management Plan and the increased conversion rate could result in reduced protection of 29 historic sites, traditional sites, and some traditional resources as well as reduced tribal 30 access to traditional sites and resources on private land compared to all other alternatives. 31
Because of much broader no-harvest prescriptions along streams, salmonid resources 32 would receive the greatest protection under this alternative. This alternative, therefore, 33 would provide the greatest protection to undocumented archaeological sites and salmonid 34 resources, moderate protection to non-salmonid traditional resources, and reduced 35 protection to historic sites and traditional sites. Tribal access to traditional resources and 36 levels of protection for traditional sites and historic sites might be similar to that expected 37 under No Action Alternative 1- Scenario 1, but lower than for Alternatives 2 and 3. 38
Draft EIS Social and Economic Environment
4-265
Chapter 4
4.14 SOCIAL AND ECONOMIC ENVIRONMENT 1
4.14.1 Introduction 2 Potential social and economic effects are addressed in the following subsections. The 3 first subsection addresses the potential effects of the proposed alternatives on 4 employment and the economy, primarily in terms of potential effects on employment and 5 income. It also addresses potential effects to small and large forest businesses by 6 summarizing the findings of the Small Business Economic Impact Statement that was 7 prepared for the current Washington Forest Practices Rules (Perez-Garcia et al. 2001) 8 and other existing studies (Zobrist 2003; Oneill 2003). The second subsection discusses 9 the potential effects of the alternatives in terms of non-use and ecosystem values. These 10 values are difficult to quantify and are typically expressed in monetary terms or discussed 11 qualitatively. The third and final subsection discusses potential environmental justice 12 concerns associated with the project and the proposed alternatives. 13
In reading the following discussion, it should be remembered from Chapter 2 14 (Alternatives) that under the No Action Alternative no ITPs or ESA Section 4(d) take 15 authorization would be issued. However, this lack of action would likely affect the 16 Forest Practices Regulatory Program in a way that is difficult to predict. Therefore, two 17 scenarios, which represent the endpoints of the reasonable range of possible outcomes for 18 the Forest Practices Regulatory Program, have been defined (subsection 2.3.1, 19 Alternative 1 (No Action)) to represent the No-Action Alternative. The effects of No 20 Action are displayed for both of these endpoints in the following subsections, but the 21 actual outcome and the actual effects of No Action on the social and economic 22 environment are likely to fall between these two scenarios. 23
4.14.1.1 Overview 24 The potential effects of the alternatives on the social and economic environment are 25 divided into three broad areas that address employment and the economy, non-use and 26 ecosystem service values, and environmental justice. 27
The current Washington Forest Practices Rules provide for reduced levels of harvest 28 within riparian zones compared to harvest levels that occurred in these areas under the 29 January 1, 1999 Washington Forest Practices Rules, as well as historic harvest levels. 30 Reductions in future timber harvest would likely occur under No Action Alternative 1-31 Scenario 1, Alternatives 2 and 3, and particularly Alternative 4 relative to No Action 32 Alternative 1-Scenario 2. 33
Employment and the Economy 34 Potential reductions in timber harvest would have negative effects on employment and 35 income in the lumber and wood products sector and positive effects on recreational and 36 commercial fishing, as well as natural amenities and quality of life issues. However, the 37 potential for land conversion could change these outcomes (subsection 4.1.2.5, 38 Alternative Groupings; Table S-1). 39
Social and Economic Environment Draft EIS
4-266
Chapter 4 Lumber and Wood Products 1 Perez-Garcia et al. (2001) developed a ratio of jobs per million board feet harvested using 2 statewide data for the different subsectors that comprise the wood products industry. 3 Using this ratio, the potential reductions in average annual harvest would result in 4 approximately 3,000 direct jobs foregone under No Action Alternative1-Scenario 1 and 5 Alternatives 2 and 3 as compared to No Action Alternative 1-Scenario 2. The majority of 6 these foregone jobs, about 94 percent, would be on the westside of the State. Using the 7 same approach, approximately 15,000 jobs would be foregone under Alternative 4, with 8 about 13,500 of these jobs foregone in western Washington counties. 9
Using 1997 average salary data from Perez-Garcia et al. (2001), these potential 10 reductions in employment would result in annual losses of approximately $121 million 11 and $476 million in income under No Action Alternative1-Scenario 1, Alternative 2, 12 Alternative 3, and Alternative 4, respectively. Grays Harbor, Lewis, Cowlitz, Pacific, 13 and Pierce Counties would experience the largest absolute reductions in harvest under No 14 Action Alternative 1-Scenario 1, Alternative 2, Alternative 3, and Alternative 4, 15 accounting for just over half of the projected statewide reduction under each alternative. 16
Recreational and Commercial Fishing 17 RMZ management actions proposed under the different alternatives could have long-term 18 effects on fish populations that could in turn affect recreational and commercial fishing 19 activities in the future. While it is not possible to quantify the potential effects of the 20 alternatives on salmonid populations, it is possible to assess the potential direction of the 21 effects and to provide a general comparison between alternatives. 22
In summary, the potential for adverse habitat impacts associated with No Action 23 Alternative 1-Scenario 2, suggest that salmonid populations could decline over the long 24 term under this alternative. Habitat impacts under No Action Alternative 1-Scenario 1 25 are much less likely to result in reductions in salmonid populations compared to No 26 Action Alternative 1-Scenario 2. Alternative 3 would likely result in improvement over 27 No Action Alternative 1-Scenario 1, and Alternative 2 would likely result in long-term 28 improvements. Without land conversion, Alternative 4 would result in the highest 29 likelihood of long-term improvements in habitat and salmonid numbers. Effects on 30 existing salmonid populations would likely affect the availability of salmonids for 31 recreational and commercial harvest, which would, in turn, affect employment and 32 income in these sectors. 33
Natural Amenities and Quality of Life 34 Natural amenities and local quality of life have increasingly been recognized as important 35 factors determining the economic prospects of many rural communities. Natural 36 amenities and quality of life do not directly generate income in the same sense as other 37 factors such as a sawmill or tourist lodge, but they often act to attract and keep residents. 38 The alternatives evaluated in this environmental analysis are programmatic, meaning that 39 they establish direction for broad land areas rather than scheduling activities on specific 40 parcels of land. As a result, it is very hard to identify the impact of the different 41
Draft EIS Social and Economic Environment
4-267
Chapter 4 alternatives on local amenities and, further, on the economic activity these amenities 1 generate. However, based on the amount of acres that would be protected in RMZs, the 2 relative contribution of the action alternatives considered here is likely to be greatest 3 under Alternative 4, followed by Alternative 2, Alternative 3, and No Action 4 Alternative1-Scenario 1, with the least relative contribution occurring under No Action 5 Alternative 1-Scenario 2. 6
Non-Use and Ecosystem Service Values 7 Non-use values represent the value that individuals assign to a resource independent of 8 their use of that resource. These types of values, which include existence, option, and 9 bequest values, are usually measured via surveys that ask people to state how much they 10 would be willing to pay to preserve a particular area (Arrow et al. 1993). These values 11 represent the value that individuals obtain from knowing that a resource exists, knowing 12 that it would be available to use in the future should they choose to do so, and knowing 13 that it would be left for future generations to inherit. Endangered species preservation is 14 well recognized as a potential source of non-use value. Studies have also identified non-15 use values associated with the preservation of forested landscapes. While these values 16 are generally believed to exist, they are difficult to accurately measure. These values 17 would, however, be expected to be higher under Alternative 2, Alternative 3, and No 18 Action Alternative 1-Scenario 1 compared to No Action Alternative 1-Scenario 2, and 19 higher still under Alternative 4 without land conversion. 20
Ecosystem services are those services and benefits provided by healthy ecosystems. 21 Examples of ecosystem services that pertain to forests include water quantity and quality, 22 soil stabilization and erosion control, improved air quality, climate regulation and carbon 23 sequestration, and biological diversity (Krieger 2001). While the ecosystem service 24 values associated with the proposed protection measures exist, they are very difficult to 25 accurately quantify in monetary terms. As a result monetary values are not assigned to 26 ecosystem services in this document, but it is possible to assess the potential direction of 27 the effects and provide a general comparison between alternatives. In terms of the 28 proposed alternatives, the value per household is likely to be highest for Alternative 4 29 without land conversion, followed by No Action Alternative 1-Scenario 1, Alternative 2, 30 and Alternative 3. 31
Environmental Justice 32 Executive Order 12898, Federal Actions to Address Environmental Justice in Minority 33 Populations and Low-Income Populations, requires that Federal agencies ensure that 34 minority and low-income populations are not disproportionately affected by their actions. 35 The Order further stipulates that the agencies conduct their programs and activities in a 36 manner that does not have the effect of excluding persons from participation in, denying 37 persons the benefits of, or subjecting persons to discrimination because of their race, 38 color, or national origin. 39
The alternatives have the potential to affect Washington’s Native American Tribes by 40 affecting the availability of salmonid species and potentially altering access to traditional 41 places and usual and accustomed use areas. No Action Alternative 1-Scenario 1 is much 42
Social and Economic Environment Draft EIS
4-268
Chapter 4 less likely to result in reductions in salmonid populations compared to No Action 1 Alternative 1-Scenario 2. Alternative 3 would result in a slight improvement over No 2 Action Alternative 1-Scenario 1, and Alternative 2 would likely result in long-term 3 improvements. Without land conversion, Alternative 4 would result in the highest 4 likelihood of long-term improvements in habitat and salmonid numbers. Access to usual 5 and accustomed places would be similarly affected by the alternatives with No Action 6 Alternative 1-Scenario 2 having the largest potential impact and Alternative 4 the least. 7
Concerns have been expressed that potential reductions in lumber and wood products 8 employment could have disproportionately high effects on small, timber-dependent 9 communities. The proposed action is programmatic in nature and it is not possible to 10 quantify the potential impacts of the alternatives on specific geographic locations or 11 communities. It is possible that the overall effect of reductions in employment in the 12 relatively well-paid lumber and wood products sector could have disproportionately 13 negative effects on timber-dependent communities that may already have relatively high 14 unemployment and poverty rates. For this element, it is likely that Alternative 4 would 15 have the highest negative effect on timber-dependent communities due to greater 16 reductions in timber harvest and the increased likelihood of land conversions. 17
4.14.2 Employment and the Economy 18 The following discussion is divided into three main parts that address potential economic 19 impacts associated with lumber and wood products, recreational and commercial fishing, 20 and natural amenities and quality of life issues. 21
From an historical perspective, less restrictive forest practices have resulted in riparian 22 zones that are dominated by high levels of early-seral stage vegetation. The current 23 Washington Forest Practices Rules, as well as those rules in effect on January 1, 1999, 24 provide for reduced levels of harvest within riparian zones compared to harvest levels 25 that occurred in these areas in the past. No Action Alternative 1-Scenario 2 would likely 26 result in future levels of harvest that are similar to current conditions. Reductions in 27 potential future harvest would likely occur under No Action Alternative 1-Scenario 1, 28 Alternatives 2 and 3, and Alternative 4, relative to current conditions and No Action 29 Alternative 1-Scenario 2. These reductions would have negative effects on employment 30 and income in the lumber and wood products sector and positive effects on recreation and 31 commercial fishing, as well as natural amenities and quality of life issues. 32
4.14.2.1 Lumber and Wood Products 33 The following discussion is divided into two main parts that address employment and 34 income and potential impacts upon forest businesses, respectively. 35
Employment and Income 36 All of the alternatives except No Action Alternative 1-Scenario 2 would result in an 37 overall reduction in acres available for harvest in riparian zones on lands owned by 38 private forest landowners on both the east and westsides of the State, as well as State-39
Draft EIS Social and Economic Environment
4-269
Chapter 4 managed lands on the eastside. State-managed lands on the westside are regulated 1 separately under the State Trust Lands HCP (Washington DNR 1997d). 2
The following subsections addresses potential employment and income effects at two 3 geographic scales. The first subsection addresses potential impacts from a statewide 4 perspective. The second subsection uses the available data to provide some insight into 5 the distribution of potential impacts by county. 6
Statewide Employment and Income Effects 7 The following subsection addresses the potential effects of the alternatives on timber 8 harvest and the timber industry and employment income in two ways. The first approach 9 is based on data used elsewhere in this DEIS and considers the potential impacts in terms 10 of acres that would no longer be available for harvest as a percentage of total acres and 11 existing harvest levels. The second approach summarizes results of the analysis of 12 Alternative 2 conducted as part of the Small Business Economic Impact Statement 13 prepared for the current Washington Forest Practices Rules (Perez-Garcia et al. 2001). 14
Under RCW Chapter 19.85.030, an agency adopting a rule is required to prepare a Small 15 Business Economic Impact Statement if the proposed rule will impose more than minor 16 costs on the businesses within an industry. The current Washington Forest Practices 17 Rules were expected to impose more than minor costs on forest products businesses and, 18 therefore, a Small Business Economic Impact Statement (Perez-Garcia et al. 2001) was 19 prepared to assess the effects of the new proposed rule compliance costs on small and 20 large businesses. 21
Riparian Management Zone Acres 22 Less restrictive forest practices have resulted in riparian zones that are dominated by high 23 levels of early-seral stage vegetation. The current Washington Forest Practices Rules, as 24 well as those rules in effect on January 1, 1999, provide for reduced levels of harvest 25 within riparian zones compared to harvest levels that occurred in these areas in the past. 26
Estimates of the number of riparian zone acres that would have harvest restrictions under 27 each alternative are presented in Tables 4.11-1 and 4.11-2. Affected acres are estimated 28 for three types of restriction, which correspond with the alternative descriptions presented 29 in Chapter 2 (Alternatives). The following paragraphs summarize the potential 30 reductions in harvest by alternative based on the number of acres that would be in RMZs. 31 These estimates do not include potential reductions in harvest that could result from land 32 conversions. The potential for increased land conversion from forestland to other uses 33 would be highest under Alternative 4. 34
No Action Alternative 1-Scenario 1 and Alternatives 2 and 3 would result in an overall 35 net increase of 177,645 acres in eastside riparian zones compared to No Action 36 Alternative 1-Scenario 2 (Table 4.11-1). This increase represents approximately 5.3 37 percent of all private, city, county, and State-managed forestlands on the eastside. 38 Alternative 4 would result in an overall net increase of 674,310 eastside acres, 39 approximately 20.0 percent of all private, city, county, and State-managed forestlands on 40 the eastside (Table 4.11-1). 41
Social and Economic Environment Draft EIS
4-270
Chapter 4 No Action Alternative 1-Scenario 1 and Alternatives 2 and 3 would result in an overall 1 net increase of 691,075 acres in westside riparian zones compared to No Action 2 Alternative 1-Scenario 2, approximately 11.0 percent of all private, city, and county 3 forestlands on the westside. Alternative 4 would result in an overall net increase of 4 2,051,068 acres, approximately 32.6 percent of all private, city, and county forestlands on 5 the westside (Table 4.11-2). 6
Assuming that the reduction in available acres would lead to a corresponding annual 7 reduction in harvest levels, Alternatives 2 and 3 and No Action Alternative 1-Scenario 1 8 would result in total harvest reductions of approximately 4 percent on the eastside and 6 9 percent on the westside compared to No Action Alternative 1-Scenario 2 (Table 4.14-1). 10 Total harvest in this context refers to harvest from all land ownerships, not just State and 11 private on the eastside or private on the westside. Alternative 4 would result in total 12 harvest reductions of approximately 14 percent and 25 percent on the east and westsides, 13 respectively. Statewide, No Action Alternative 1-Scenario 1, and Alternatives 2, and 3 14 would result in a total harvest reduction of approximately 5 percent. Alternative 4 would 15 result in a total harvest reduction of approximately 23 percent (Table 4.14-1). 16
Table 4.14-1. Estimated Reductions in Average Annual Harvest by Alternative 17 (million board feet [MBF]). 18
Net Reduction in Acres (%)1/
Affected Harvest (MBF)2/
Net Annual Reduction
(MBF)3/
Total Harvest (MBF)4/
Projected Net Reduction as a
Percent of Total Harvest (%)
Alternative Alternative 1-Scenario 1 Eastside 0 636,745 0 993,937 0 Westside 0 3,220,002 0 3,416,909 0 Total 0 3,856,746 0 4,410,846 0
Alternative 2, Alternative 3, No Action Alternative 1-Scenario 1 Eastside 4 636,745 25,470 993,937 3 Westside 6 3,220,002 193,200 3,416,909 6 Total 3,856,746 218,670 4,410,846 5
Alternative 4 Eastside 22 636,745 140,084 993,937 14 Westside 27 3,220,002 869,401 3,416,909 25 Total 3,856,746 1,009,484 4,410,846 23 1/ This represents the estimated net reduction in private/city/county and State forestland that would
be unavailable for harvest under the action alternatives. This analysis assumes that there would be no harvest on no-harvest acres, and 30 percent and 70 percent of selective harvest and moderate-heavy selective harvest acres harvested, respectively.
2/ Affected harvest is annual average harvest from private and State lands for 1990 through 2002. Sources for harvest data include Washington DNR 2004b and Washington DNR 2004d.
3/ This represents the harvest that would be foregone assuming that the estimated net reduction in acres available for harvest would lead to a corresponding decrease in harvest.
4/ The total harvest figures are average annual harvest figures for all ownerships in Washington Statefor 1990 through 2002.
Draft EIS Social and Economic Environment
4-271
Chapter 4 Perez-Garcia et al. (2001) developed a ratio of jobs per million board feet harvested using 1 statewide data for the different subsectors that comprise the wood products industry. 2 Using this ratio, the potential reductions in average annual harvest as compared to No 3 Action Alternative 1-Scenario 2 would result in approximately 3,000 direct jobs foregone 4 under No Action Alternative1-Scenario 1 and Alternatives 2 and 3. The majority of these 5 lost jobs, about 94 percent, would be on the westside of the State. 6
Using the same approach, approximately 15,000 jobs would be lost under Alternative 4, 7 with about 13,500 of these jobs foregone in western Washington counties as compared to 8 No Action Alternative 1-Scenario 2. Using 1997 average salary data from the Small 9 Business Economic Impact Statement, these potential reductions in employment would 10 result in annual losses of approximately $121 million and $476 million in income under 11 No Action Alternative 1-Scenario 1 and Alternatives 2, 3, and 4, respectively. 12
These general employment and wage estimates assume a linear relationship between 13 potential harvest reductions and employment that is unlikely to occur in reality as 14 adjustments to reduced harvests may take place over an extended period of time. In 15 addition, a reduction in available acres due to RMZ restrictions may affect the 16 profitability of harvesting in adjacent areas in cases where the amount of timber available 17 to cover fixed harvest costs is reduced. This is particularly likely to be the case with small 18 non-industrial private forest landowners (Zobrist 2003). Further, these estimates assume 19 that harvest would occur in the inner zone under No Action Alternative 1-Scenario 1 and 20 Alternatives 2 and 3. Although some large landowners, mostly industrial landowners, are 21 harvesting in the inner zone, anecdotal field evidence suggests that many landowners are 22 not harvesting within the inner zones. Many landowners are not harvesting in the inner 23 zone because the value of the trees that “may” be available for harvest in this zone are not 24 expected to justify the inventory/layout cost. This situation may change in the future if 25 stumpage values increase. 26
Small Business Economic Impact Statement Analysis of Statewide Effects 27 The Small Business Economic Impact Statement assessed the potential employment and 28 income effects of Alternative 2 in 2001 using a different approach (Perez-Garcia et al. 29 2001). This analysis found that potential reductions in the timber base under Alternative 30 2 would result in total harvest reductions of 10 percent and 20 percent in eastern and 31 western Washington, respectively. Using annual harvest data for 1997, the Small 32 Business Economic Impact Statement analysis identified potential harvest reductions of 33 approximately 97 million board feet on the eastside and 650 million board feet on the 34 westside. The analysis then applied job/million board feet ratios developed using the 35 1997 County Business Pattern (Perez-Garcia et al. 2001) and annual harvest data to 36 estimate foregone employment and wages. This resulted in an estimated reduction in 37 direct eastside employment of approximately 865 jobs, with an associated loss of 38 approximately $27 million in wages. The Small Business Economic Impact Statement 39 analysis estimated a loss of approximately 10,317 westside jobs and $351 million in 40 wages. 41
Social and Economic Environment Draft EIS
4-272
Chapter 4 The impacts projected for the current Washington Forest Practices Rules, Alternative 2 in 1 the Small Business Economic Impact Statement (2001) analysis, are substantially higher 2 than those identified for No Action Alternative 1-Scenario 1 and Alternatives 2 and 3 in 3 the RMZ acres analysis presented above. This partially reflects the different 4 methodologies employed and is also a result of the underlying database used to generate 5 estimates of acres that would no longer be available for harvest. 6
Employment Effects by County 7 This subsection uses estimated net changes in RMZ acres at the county level to assess 8 potential effects on county employment and income. As with the statewide RMZ-based 9 analysis summarized above, this analysis assumes that a reduction in available acres 10 would lead to a corresponding annual reduction in harvest levels. Potential reductions in 11 harvest levels are, in turn, assumed to result in corresponding reductions in annual 12 employment and income. The county-level analysis is complicated because harvest 13 activities in a particular county do not necessarily employ residents of that county. 14 Timber harvested could be processed elsewhere in the State, and the mill employment 15 potentially forgone due to a reduction in acres available for harvest that could be located 16 in other counties. Alternatively, timber harvested could be exported as unprocessed logs, 17 with port workers and longshoremen affected by potential harvest reductions rather than 18 local mill workers. In addition, loggers and logging contractors employed to harvest 19 timber that would otherwise be harvested may not reside in the county where the harvest 20 would have occurred. The logging activities themselves and at least some of the 21 associated expenditures would, however, have occurred in the county where the timber is 22 located. With these points in mind, the following analysis is intended to give a general 23 overview of the potential distribution of employment and income impacts by county. 24
Viewed at a county level the projected net change (as compared to No Action Alternative 25 1-Scenario 2) in RMZ acres on State and private lands associated with Alternatives 2 and 26 3 and No Action Alternative 1-Scenario 1, would range from 4 percent to 7 percent. 27 Assuming that a reduction in available acres would result in similar decreases in harvest 28 levels, counties that would experience relatively large reductions in harvest from State 29 and private lands include San Juan, Island, Kitsap, Pierce, Grays Harbor, Lewis, and 30 Cowlitz Counties (Table 4.14-2). 31
Projected net changes in RMZ acres under Alternative 4 would range from 18 percent in 32 Jefferson County to approximately 32 percent in San Juan and Island Counties. 33 Assuming that a reduction in available acres would result in similar decreases in harvest 34 levels, counties that could experience relatively large reductions in harvest from State and 35 private lands include San Juan, Island, Kitsap, Pierce, Grays Harbor, Lewis, and Cowlitz 36 Counties (Table 4.14-2). 37
Counties with the largest absolute reductions in harvest under Alternatives 2 and 3, No 38 Action Alternative 1-Scenario 1, and Alternative 4 would be Grays Harbor, Lewis, 39 Cowlitz, Pacific, and Pierce Counties. Using the statewide jobs to million board feet-40 ratios developed by Perez-Garcia et al. (2001), Alternatives 2 and 3 and No Action 41 Alternative 1-Scenario 1 would result in statewide annual reductions of approximately 42
Draft EIS Social and Economic Environment
4-273
Chapter 4 Table 4.14-2. Estimated Percent of Harvest from State and Private Lands 1
Affected in Each County by Alternative (Compared to No Action 2 Alternative 1-Scenario 2). 3
State and Private Annual
Harvest Reduction (%) Counties
No Action Alternative 1-Scenario 1, Alternative 2, and Alternative 3 4 Adams, Asotin, Benton, Chelan, Columbia, Douglas, Ferry, Franklin, Garfield,
28 to 32 Cowlitz, Grays Harbor, Island, King, Kitsap, Lewis, Mason, Pacific, Pierce, and San Juan
3,000 direct jobs and $121 million in foregone income. The five counties with the largest 4 absolute reductions, noted above, would account for just over one-half of this potential 5 loss. This would also be the case under Alternative 4 where statewide annual reductions 6 would be approximately 15,000 direct jobs and $476 million in income. 7
Effects on Forest Businesses 8 The Small Business Economic Impact Statement prepared for the current Washington 9 Forest Practices Rules, included in this DEIS as Alternative 2, assessed the effects of 10 proposed rule compliance costs on small and large forest businesses (Perez-Garcia et al. 11 2001). Forest businesses were defined as businesses that own or control cutting rights on 12 forestlands and included, but were not limited to, landowners, loggers, and mill owners. 13 Small businesses were identified as those with 50 or fewer employees. 14
Riparian habitat management and lost sales associated with RMZs and road maintenance 15 and stream crossings were the major compliance cost elements assessed in the Small 16 Business Economic Impact Statement. The Small Business Economic Impact Statement 17 found that the cost of implementing the proposed rules fell more heavily on small 18 businesses. In eastern Washington the cost of compliance was 31 percent of total 19 business value for small businesses and 22.1 percent for large businesses. 20
In western Washington compliance costs comprised 25.6 percent and 18.5 percent of total 21 business value for small and large businesses, respectively. Total business value was 22 defined in terms of timber asset value. Road maintenance and stream crossing 23 requirements accounted for the majority of compliance costs in eastern Washington. 24
Social and Economic Environment Draft EIS
4-274
Chapter 4 Foregone sales associated with RMZs comprised the major cost in western Washington 1 (Perez-Garcia et al. 2001). 2
Two subsequent studies attempted to assess the effects that site-specific differences 3 would likely have on potential effects to small, non-industrial private forest landowners 4 (Zobrist 2003; Oneil 2003). These studies were based on 10 case studies in western 5 Washington (six in Lewis County; four in Grays Harbor County) and nine case studies in 6 eastern Washington (three in Pend Oreille County, four in Stevens County, one in 7 Okanogan County, and two in Whitman County). 8
The results of the westside case studies indicated that some small landowners could 9 potentially incur substantial economic losses under the current Washington Forest 10 Practices Rules, Alternative 2 in this analysis, with the severity of potential impacts 11 varying by landowner (Zobrist 2003). Potential impacts were most severe under a 12 modeling scenario that assumed there would be no harvest in the riparian zone at all, with 13 some of the case studies losing most or all of their land value. These losses were reduced 14 when the modeling scenario was adjusted to assume that landowners would harvest in the 15 outer zone, with only small incremental or no benefits associated with harvesting in the 16 inner zone. 17
RMZs are divided into three zones under No Action Alternative 1-Scenario 1 and 18 Alternatives 2 and 3. The core zone is nearest to the water and adjacent to the bankfull 19 width. The inner zone is adjacent to the core zone. The outer zone is adjacent to the 20 inner zone and furthest from the water (Figure 2-2). Harvest requirements vary by zone 21 and alternative. Although potential losses were reduced when harvesting occurs in the 22 outer zone, the overall losses were still substantial in some cases. The analysis found that 23 maximizing selective inner zone riparian harvest did not do more to minimize impacts 24 because calculating the allowable riparian harvest would involve additional cruising and 25 layout costs that offset any value recovery (Zobrist 2003). 26
Under Alternatives 2 and 3 and No Action Alternative 1-Scenario 1, the land value for 27 timber management would be completely lost in no-harvest areas, such as the core zone 28 and parts of the inner zone, as these acres could no longer be used for commercial 29 management (Zobrist 2003). Further, if buffer restrictions result in a large portion of a 30 given property being taken out of timber production, it could make the entire property 31 unprofitable because the production base available to cover fixed production costs would 32 be much smaller. Also, buffer restrictions may fragment properties, separating 33 unrestricted areas from one another and making management unfeasible in these areas, as 34 well as those areas within the RMZ. Substantial decreases in land value imply that it 35 would not be economically viable for some landowners to continue to use their property 36 for forest management beyond the current rotation, which could motivate land use 37 conversion, particularly to residential development (Zobrist 2003). This is discussed 38 further in subsection 4.2 (Land Ownership and Use). 39
The results of the nine eastern Washington case studies also found that the severity of 40 potential impacts under the current Washington Forest Practices Rules (Alternative 2) 41 varied substantially by landowner (Oneil 2003). The analysis evaluated potential impacts 42
Draft EIS Social and Economic Environment
4-275
Chapter 4 to small businesses in terms of reductions in annual cash flows projected into the future. 1 Impacts to small eastside businesses ranged from a 0 to 49 percent reduction in 2 discounted cash flows when compared to the prior baseline (No Action Alternative 1-3 Scenario 2). Losses varied with the amount of riparian holdings and the nature of the 4 currently standing inventory (Oneil 2003). 5
The preceding analyses of potential effects on businesses specifically addressed the 6 potential effects of the current Washington Forest Practices Rules (i.e., No Action 7 Alternative 1-Scenario 1, Alternative 2, and Alternative 3 in this analysis). They did not 8 address the potential effects of Alternative 4. It is, however, reasonable to assume that 9 RMZ restrictions associated with Alternative 4 would have greater impacts on small 10 businesses located on both sides of the State. The restrictions associated with Alternative 11 4 are more likely to negatively affect the economic viability of timber production for 12 forest landowners, especially small forest landowners and, therefore, increase the 13 potential for forestland conversion. This issue is discussed further in subsection 4.2 14 (Land Ownership and Use). 15
4.14.2.2 Recreational and Commercial Fishing 16 This subsection addresses the potential effects of the alternatives on employment in the 17 recreation and commercial fishing sectors, both of which could be affected positively by 18 the action alternatives in the long-run. 19
Recreational Fishing 20 RMZ management actions proposed under the different alternatives could have long-term 21 effects on fish populations that could in turn affect fish-related recreation activities in the 22 future. While it is not possible to quantify the potential effects of the alternatives on 23 salmonid populations and recreation-related employment and income, it is possible to 24 assess the potential direction of the effects and provide a general comparison between 25 alternatives. 26
In summary, the potential for adverse habitat impacts associated with No Action 27 Alternative 1-Scenario 2 suggests that salmonid populations could decline over the long 28 term under this alternative. Habitat impacts under No Action Alternative 1-Scenario 1 29 are much less likely to result in reductions in salmonid populations compared to No 30 Action Alternative 1-Scenario 2. Alternative 3 would likely result in improvement over 31 No Action Alternative 1-Scenario 1, and Alternative 2 would likely result in long-term 32 improvements. Without land conversion, Alternative 4 would likely result in the highest 33 likelihood of long-term improvements in habitat and salmonid numbers. Effects on 34 existing salmonid populations would likely affect the availability of salmonids for 35 recreational harvest, which would, in turn, affect recreation-related employment and 36 income. 37
The preceding discussion provides a general indication of the likely impacts of the 38 alternatives on recreational fishing. It should, however, be noted that future changes in 39 fish populations depend on multiple factors and programs, of which the proposed action 40 is only one. The actions proposed under Alternatives 2 and 3, No Action Alternative 1-41
Social and Economic Environment Draft EIS
4-276
Chapter 4 Scenario 1, and Alternative 4 may not in and of themselves be sufficient to assure an 1 increase in the fishery resource. Many factors have contributed to the decline of the 2 listed fish species in the Pacific Northwest. As discussed above, habitat is one of the four 3 factors believed to affect these fish. The other three factors are hydropower, harvest, and 4 hatcheries (Federal Caucus 1999) (subsection 4.8.4, Synthesis by Analysis Area). The 5 actions being considered in this document would affect habitat, but the overall future 6 effects on covered species will also depend on the effects of other activities on habitat, as 7 well as the effects of the other Hs. As a result, improvements in fish populations 8 projected under the action alternatives have a substantial degree of uncertainty associated 9 with them. Impacts to fish are discussed in detail in subsection 4.8 (Fish and Fish 10 Habitat). 11
Other recreation activities could also potentially benefit from the proposed action 12 alternatives, with the maintenance of RMZs improving the overall quality of some 13 recreation experiences, such as hiking and camping, as well as river-based activities, such 14 as kayaking and rafting. The quality of inland recreational fishing may also improve. 15 These potential benefits depend largely on the perceptions of recreationists and an 16 assumed preference for forested landscapes. It is, however, possible that maintaining 17 RMZs may in some cases reduce river access and result in a potential reduction in the 18 quality of the recreation experience or the potential for lost recreation opportunities. 19 These potential effects are discussed further in subsection 4.11 (Recreation). It is 20 reasonable to assume that these types of effects would occur under the action alternatives, 21 with the magnitude of the effects likely to be greatest under Alternative 4. Given the 22 programmatic nature of this assessment and the potential for land conversion, it is not, 23 however, possible to quantify their magnitude or assess these effects in terms of potential 24 employment and income gains or losses. 25
Commercial Fishing 26 The commercial fishing industry accounted for 9,418 jobs in Washington in 2000, with 27 the majority of these jobs associated with saltwater harvest, and salmon accounting for 28 about one-third of the catch by value (U.S. Bureau of Economic Analysis 2004a; 29 Washington DNR 2004c). As discussed above with respect to recreation-related 30 employment and income, it is not possible to quantify the potential effects of the 31 alternatives on salmonid populations. It is, however, possible to assess the potential 32 direction of the effects and provide a general comparison between alternatives. In 33 summary, the potential for adverse habitat impacts associated with No Action Alternative 34 1-Scenario 2 suggests that salmonid populations would likely decline over the long term 35 under this alternative. Habitat impacts under No Action Alternative 1-Scenario 1 are 36 much less likely to result in reductions in salmonid populations compared to No Action 37 Alternative 1-Scenario 2. Alternative 3 would result in a slight improvement over No 38 Action Alternative 1-Scenario 1, and Alternative 2 would likely result in long-term 39 improvements. Without land conversion, Alternative 4 would result in the highest 40 likelihood of long-term improvements in habitat and salmonid numbers. 41
Draft EIS Social and Economic Environment
4-277
Chapter 4 Effects on existing salmonid populations would likely affect the availability of salmonids 1 for commercial harvest, which would, in turn, affect commercial fishing-related 2 employment and income. Again, as noted with respect to recreational fishing, the 3 proposed action is only one of a number of factors that could potentially affect future fish 4 populations. As discussed above, habitat is one of the four factors believed to affect 5 these fish. The other three factors are hydropower, harvest, and hatcheries (Federal 6 Caucus 1999) (subsection 4.8.4, Synthesis by Analysis Area). The actions being 7 considered in this document would affect habitat, but the overall future effects on covered 8 species will also depend on the effects of other activities on habitat, as well as the effects 9 of the other Hs. As a result, improvements in fish populations projected under the action 10 alternatives have a substantial degree of uncertainty associated with them. Impacts to 11 fish are discussed in detail in subsection 4.8 (Fish and Fish Habitat). 12
4.14.2.3 Natural Amenities and Quality of Life 13 Natural amenities and local quality of life have increasingly been recognized as important 14 factors determining the economic prospects of many rural communities in the American 15 West and elsewhere (Power 1996; Rasker 1993; Rudzitus and Johnson 2000). While 16 local amenities and quality of life do not directly generate income in the same sense as 17 other factors such as a sawmill or tourist lodge, they do act to attract and keep residents. 18 This, in turn, supports communities and their economies in several ways. Many of these 19 residents may earn a substantial proportion of their income from non-job related sources 20 that are independent of local economic activity. Non-job related sources of income 21 include dividends, interest, and rent, as well as transfer payments from the government, 22 which include retirement and unemployment benefits. Much of this income will then be 23 spent locally, resulting in additional employment and income in the community. 24 Similarly, residents attracted to a region for its local amenities and quality of life may 25 have occupations that are not dependent on local economic activity or constrained to one 26 particular location. These residents may also bring with them important skills and energy 27 that constitute valuable assets for the community. These types of residents may also 28 serve to attract and retain businesses that are dependent on a skilled labor force, but are 29 otherwise relatively footloose from a location standpoint. 30
Although it is difficult to directly measure the importance of natural amenities in 31 attracting and keeping residents, proximity to natural environments and the recreational 32 activities they support are undeniably a benefit enjoyed by Washington residents. It 33 should be noted, however, that the atmosphere of a community also constitutes an 34 important amenity, and this may often be linked to more traditional forms of economic 35 activity, such as fishing or timber. The size of a community may also significantly affect 36 the local amenities available. If a community is too small, it cannot provide many of the 37 basic social and economic amenities many residents require, local natural amenities 38 notwithstanding. 39
The alternatives evaluated in this environmental analysis are programmatic, meaning that 40 they establish direction for broad land areas rather than scheduling activities on specific 41 parcels of land. As a result, it is very hard to identify the impact of the different 42 alternatives on local amenities and, further, on the economic activity these amenities 43
Social and Economic Environment Draft EIS
4-278
Chapter 4 generate. While the amount of protected acres would increase under the action 1 alternatives, and under Alternative 4 in particular, relative to the No Action Alternative 2 (Tables 4.11-1 and 4.11-2), it is difficult to predict whether these effects would be 3 significant enough in themselves to result in measurable changes in economic activity. 4 Although it is not possible to measure the incremental benefits associated with the action 5 alternatives, the cumulative impact of the action alternatives combined with other 6 planning initiatives over the coming decades, may have profound effects on local 7 amenities, both natural and social (Chapter 5, Cumulative Effects). Based on the amount 8 of acres that would be protected in RMZs, the relative contribution of the action 9 alternatives considered here is likely to be greatest under Alternative 4 (excluding land 10 conversion), followed by Alternative 2, Alternative 3, and No Action Alternative 1-11 Scenario 1, with the least relative contribution occurring under No Action Alternative 1-12 Scenario 2. 13
4.14.3 Non-Use and Ecosystem Service Values 14 The preceding subsections address the potential effects of the alternatives on the 15 economy and employment and primarily focus on activities that involve direct 16 consumptive or non-consumptive use of forests or fish. Consumptive uses are activities, 17 such as timber management and fishing that involve resource harvest. Non-consumptive 18 uses are those that do not reduce the available stock of resources and include activities 19 such as river rafting, bird watching, or amenity values. The unique characteristics of 20 some resources have, however, caused some economists to question whether this type of 21 analysis incorporates all of a resource’s value. The following subsections address two 22 broad categories of value that are not dependent on direct use by humans: non-use or 23 passive use values and ecosystem services. 24
4.14.3.1 Non-Use Values 25 Non-use values represent the value that individuals assign to a resource independent of 26 their use of that resource. These types of values, which include existence, option, and 27 bequest values, are usually measured via surveys that ask people to state how much they 28 would be willing to pay to preserve a particular area (Arrow et al. 1993). These values 29 represent the value that individuals obtain from knowing that a resource exists, knowing 30 that it would be available to use in the future should they choose to do so, and knowing 31 that it would be left for future generations to inherit. 32
Endangered species preservation is well recognized as a potential source of non-use 33 value. Studies have also identified non-use values associated with the preservation of 34 forested landscapes. While these values are generally believed to exist, they are difficult 35 to accurately measure. One indication of the potential value of the fishery resource is 36 provided by the cost benefit analysis prepared for the current Washington Forest 37 Practices Rules (Perez-Garcia 2001). In this analysis, Perez-Garcia (2001) applied the 38 results of an earlier stated preference survey of Washington residents that was designed 39 to estimate the non-use value of changes in fish populations for a full range of fish under 40 a variety of conditions (Layton et al. 1999). 41
Draft EIS Social and Economic Environment
4-279
Chapter 4 The Layton et al. (1999) survey was designed to value incremental changes in the various 1 types of fish populations over time relative to baseline conditions. This survey addressed 2 both use and non-use values. Uncertainty over future baseline conditions led the authors 3 to use two different baselines in their survey. The low baseline condition showed 4 populations declining over the next 20 years at the same rate as the previous 20 years. In 5 the stable baseline condition, populations stabilized at current levels over the next 20 6 years. In the absence of projected fish returns, Perez-Garcia (2001) assumed, in line with 7 the Layton et al. (1999) study, that the forests and fish rule would result in a 5 percent 8 increase of fish populations over a 20-year study period. Using a discount rate of 5.8 9 percent and data from the Layton et al. (1999) study, Perez-Garcia (2001) estimated that 10 the net present value of this increase to Washington households would range from $7 11 billion to $10.3 billion. It is reasonable to assume that this estimate would increase under 12 Alternative 4. Layton et al. (1999) estimated that a further 5 percent increase in fish 13 populations (i.e., from 6 to 10 percent above the baseline) would be valued at $3 billion, 14 with the value of each successive 5 percent increment decreasing. 15
Forested landscapes have also been the subject of numerous non-use studies usually 16 conducted for specific natural areas. Often viewed in a wilderness context, willingness-17 to-pay estimates for forest protection have identified a wide range of values (See Krieger 18 2001 for a summary of studies). At a general level, for example, Loomis and Richardson 19 (2000) estimated annual willingness-to-pay values of $6.72 per acre for roadless area 20 protection in the western United States based on two earlier studies of wilderness 21 preservation. In Washington State, a study measuring willingness-to-pay for different 22 types of forest management found that urban residents were willing to pay $450 per 23 household per year to restore biodiversity to a specified level. Rural residents were 24 willing to pay $225 to achieve the same level of biodiversity (Center for International 25 Trade in Forest Products 1999). 26
Examining the results of two case studies that addressed wilderness designation, Loomis 27 (2000) noted two important trends. First, willingness-to-pay per household increases 28 with an increase in the number of acres proposed for wilderness protection, but at a 29 decreasing rate. Second, existence, option, and bequest values in both cases represented 30 about half the total value of wilderness. It seems likely that willingness-to-pay would be 31 higher for forested wilderness areas than it would be for riparian buffers. Areas are 32 designated wilderness based on rigorous evaluation criteria and tend to be areas that 33 represent unique and valuable resource areas. Nevertheless, the values from other studies 34 do provide some indication of the potential non-use value of forested landscapes. These 35 values would likely increase with the number of acres, but at a decreasing rate. In terms 36 of the proposed alternatives, and without land conversion, the value per household is 37 likely to be highest for Alternative 4 followed by Alternative 2, Alternative 3, and No 38 Action Alternative 1-Scenario 1, with the least value per household occurring under No 39 Action Alternative 1-Scenario 2. 40
4.14.3.2 Ecosystem Services 41 Ecosystem services are those services and benefits provided by healthy ecosystems. 42 Definitions of ecosystem services can be broad, including both use and non-use values 43
Social and Economic Environment Draft EIS
4-280
Chapter 4 (Costanza et al. 1997; Krieger 2001; Morton 1999). Some definitions include 1 consumptive uses, such as logging, fishing, and hunting that can be considered market 2 goods. Other types of ecosystem services provide what might be considered long-term 3 life support benefits to society as a whole. Examples of so-called “life-support benefits” 4 that pertain to forests include water quantity and quality, soil stabilization and erosion 5 control, improved air quality, climate regulation and carbon sequestration, and biological 6 diversity (Krieger 2001). 7
Economists have expressed concerns that ecosystem service values are not adequately 8 considered in decision-making processes because they are not valued on a par with goods 9 and services that are traded in commercial markets. A number of methods have been 10 used to assign monetary values to these types of services and include travel cost, hedonic 11 pricing, and defensive expenditure approaches that use observed behavior to estimate 12 values, as well as contingent valuation approaches that ask people what they would be 13 willing to pay for an ecosystem service. 14
Costanza et al. (1997) estimated that the total value of the services currently provided by 15 the world’s ecosystems ranges from $16 trillion to $54 trillion per year, with an average 16 value of $33 trillion. Costanza et al.’s (1997) estimate involved the review and synthesis 17 of a wide variety of existing studies and included estimates of recreation and cultural 18 values, as well as more life-support-related services. Many of the studies used in their 19 synthesis were based directly or indirectly on estimates of willingness-to-pay. 20
While the ecosystem service values associated with the proposed protection measures 21 exist, they are very difficult to accurately quantify in monetary terms. The values 22 identified by Costanza et al. (1997), for example, which are based on a wide variety of 23 data sources and aggregated on a global scale, allow useful rough estimates of magnitude 24 at large scales, but they are not suitable for a detailed comparison of alternatives. It is 25 also difficult to quantify the effects of the alternatives on physical and biological 26 resources in terms of unit values. The fact that no monetary value is assigned to 27 ecosystem services in this DEIS does not lessen their importance in the decision making 28 process. In terms of the proposed alternatives, and without land conversion, the value per 29 household is likely to be highest for Alternative 4 followed by Alternative 2, Alternative 30 3, and No Action Alternative 1-Scenario 1, with the least value per household likely 31 occurring under No Action Alternative 1-Scenario 2. 32
4.14.4 Environmental Justice 33 Executive Order 12898, Federal Actions to Address Environmental Justice in Minority 34 Populations and Low-Income Populations, requires that Federal agencies identify and 35 address disproportionately high and adverse environmental effects of its programs, 36 policies, and activities on minority and low income populations. The Order further 37 stipulates that the agencies conduct their programs and activities in a manner that does 38 not have the effect of excluding persons from participation in, denying persons the 39 benefits of, or subjecting persons to discrimination because of their race, color, or 40 national origin. 41
Draft EIS Social and Economic Environment
4-281
Chapter 4 Assessing these potential issues initially involves identifying those minority and low 1 income populations that have the potential to be disproportionately affected by the 2 proposed action and alternatives. This typically involves identifying low income and 3 minority populations in the vicinity of the proposed action based on the percentage of the 4 population below the poverty level or the percentage of the total population made up of 5 minority groups. 6
The alternatives evaluated in this environmental analysis are programmatic meaning that 7 they establish direction for broad land areas rather than scheduling activities on specific 8 parcels of land. As a result, this assessment focuses on those groups that could be 9 disproportionately affected at a programmatic level, primarily groups that would be 10 affected by potential changes in salmonid populations, as well as loggers, mill workers, 11 and others involved in timber harvest. 12
4.14.4.1 Salmon 13 Information compiled as part of the Puget Sound Chinook Harvest Resource 14 Management Plan indicated that the majority of resident sport anglers in Washington 15 State are White (NMFS 2004) Data collected for 2001 found that 94 percent of 16 Washington resident sport anglers were White (U.S. Fish and Wildlife and Census 17 Bureau 2003). NMFS (2004) also found, based on contacts with Federal and State 18 agencies responsible for non-tribal commercial fisheries management, that there are no 19 substantial aggregations of minority commercial fishermen in Washington, with the 20 exception of American Indians. Data from the 2000 census suggests that American 21 Indians in Washington State are twice as likely to be employed in the agriculture, 22 forestry, fishing, and hunting sector than the State population as a whole, with 4.8 percent 23 of employed American Indians working in this sector compared to 2.4 percent of the 24 statewide population (U.S. Census Bureau 2004). This percentage varies by reservation 25 with employment in the agriculture, forestry, fishing, and hunting sector accounting for 26 more than 10 percent of employment on the Makah, Kalispel, Quileute, Quinault, and 27 Skokomish Reservations, as well as the Squaxin Island, Yakama, and Nooksack 28 Reservations and off-reservation trust lands (Table 4.14-3). 29
In addition to being important for commercial harvest, salmon are also important 30 traditional resources to all Washington Tribes. Bull trout are also important, particularly 31 in watersheds outside the salmon’s historic range. Salmon and bull trout are also 32 important tribal subsistence resources (subsection 3.13, Archeological, Historical, 33 Cultural and Indian Trust Resources). The Tribes that entered into treaties with the 34 United States during the nineteenth century, which includes 27 of the 31 federally-35 recognized Tribes with cultural interests in Washington forests (Table 3-27), all retained 36 the right to certain resources on ceded territories. All treaties include the right to fish in 37 usual and accustomed grounds and places in common with other citizens and to hunt and 38 gather roots and berries on open and unclaimed land. 39
The alternatives have the potential to affect Washington’s Tribes by affecting the 40 availability of salmonid species. While there are no provisions in Washington Forest 41 Practices Rules and the proposed alternatives that affect future tribal harvest any 42
Social and Economic Environment Draft EIS
4-282
Chapter 4 Table 4.14-3. Tribal Employment by Industry, 2000.1/ 1
Agriculture, Forestry, Fishing, and Hunting Wood Products
State/Reservation
Total Employ-
ment Number of
Jobs Percent of Total (%)
Number of Jobs
Percent of Total (%)
Washington 2,793,722 66,471 2.4 21,760 0.8Tribal Employment
Tribal Total 26,800 1,273 4.8 472 1.8Chehalis Reservation 116 2 1.7 0 0.0Colville Reservation and O-R TL 1,297 110 8.5 67 5.2Kalispel Reservation 43 7 16.3 0 0.0Lower Elwha Reservation and O-R TL 63 6 9.5 1 1.6Lummi Reservation 553 34 6.1 3 0.5Makah Reservation 323 74 22.9 0 0.0Muckleshoot Reservation and O-R TL 287 10 3.5 0 0.0Nisqually Reservation 125 7 5.6 0 0.0Nooksack Reservation and O-R TL 119 12 10.1 8 6.7Port Gamble Reservation 166 12 7.2 0 0.0Port Madison Reservation 174 11 6.3 3 1.7Puyallup Reservation and O-R TL 397 11 2.8 0 0.0Quileute Reservation 93 13 14.0 2 2.2Quinault Reservation 326 37 11.3 3 0.9Skokomish Reservation 123 15 12.2 2 1.6Spokane Reservation 413 33 8.0 2 0.5Squaxin Island Reservation and O-R TL 80 9 11.3 0 0.0Swinomish Reservation 159 6 3.8 2 1.3Tulalip Reservation 553 45 8.1 2 0.4Upper Skagit Reservation 37 5 13.5 4 10.8Yakama Reservation and O-R TL 1,735 195 11.2 81 4.7O-R TL = Off-Reservation Trust Land 1/ These data were compiled from the Census 2000 American Indian and Alaska Native Summary File
(AIANSF) - Sample Data. They were collected as part of the 2000 census and are not directly comparable with the other types of employment data summarized in Chapter 3 (Affected Environment).
Source: U.S. Census Bureau 2000.
differently than they affect other types of harvest, the potential exists for American 2 Indians to be disproportionately impacted. This potential is due to the relatively 3 important role that commercial fishing plays in tribal economies, as well as the 4 significance of salmon and bull trout for ceremonial and subsistence purposes. 5
In summary, without land conversion, habitat impacts under No Action Alternative 1-6 Scenario 1 are much less likely to result in reductions in salmonid populations compared 7 to No Action Alternative 1-Scenario 2. Alternative 3 would result in a slight 8 improvement over No Action Alternative 1-Scenario 1, and Alternative 2 would likely 9 result in long-term improvements. Without land conversion, Alternative 4 would result 10 in the highest likelihood of long-term improvements in habitat and salmonid numbers. 11 Impacts to fish are discussed in detail in subsection 4.8 (Fish and Fish Habitat). 12
Effects on existing salmonid populations would likely affect the availability of salmonids 13 for tribal harvest, including traditional, subsistence, and commercial uses. The proposed 14
Draft EIS Social and Economic Environment
4-283
Chapter 4 action is only one of a number of factors that could potentially affect future fish 1 populations. Habitat is one of the four factors believed to affect fish and especially 2 salmonid populations. The other three factors are hydropower, harvest, and hatcheries 3 (Federal Caucus 1999). The actions being considered in this document would affect 4 habitat, but the overall future effects on covered species will also depend on the effects of 5 other activities on habitat, as well as the effects of the other three factors. As a result, 6 improvements in fish populations projected under the action alternatives have a 7 substantial degree of uncertainty associated with them. Access to traditional places and 8 usual and accustomed use areas would be similarly affected by the alternatives with No 9 Action Alternative 1-Scenario 2 having the largest potential impact and Alternative 4 the 10 least. 11
4.14.4.2 Wood Products 12 Logging employment data are included in the agriculture, forestry, fishing, and hunting 13 sector discussed above. These data suggest, as noted above, that American Indians are 14 twice as likely to be employed in this sector as the State population as a whole. Data 15 from the 2000 census also indicate that American Indians are slightly more than twice as 16 likely to be employed in the wood products sector than the State population as a whole 17 (1.8 percent versus 0.8 percent) (U.S. Census Bureau 2000). This percentage also varied 18 by reservation, ranging from 0 percent of total employment on eight American Indian 19 Reservations in Washington to around 5 percent and above on the Yakama (4.7 percent), 20 Nooksack (6.7 percent), and Colville (5.2 percent) Reservations and off-reservation trust 21 lands, and 10.8 percent on the Upper Skagit Reservation (Table 4.14-3). 22
While these data suggest that American Indians could be disproportionately affected by 23 reductions in State and private timber harvest, it should be noted that much of this 24 employment is likely related to tribal timber harvest activities that would not be affected 25 by the proposed alternatives. Harvest on tribal lands comprised approximately 9 percent 26 of total harvest in Washington State in 2002 (Table 3-3). 27
The potential effects of the proposed action on economic and social structures in rural 28 areas were identified as a potential environmental justice issue during public scoping for 29 this project. The rationale expressed for this concern was that many low income and 30 minority populations reside in and around forested lands and depend on these lands for 31 their livelihood. As noted above, the proposed action is programmatic in nature and it is 32 not possible to quantify the potential impacts of the alternatives on specific geographic 33 locations or communities. 34
Viewed in terms of economic impacts, potential reductions in harvest associated with 35 increased buffers or, alternatively, a failure to obtain take authorization would tend to 36 disproportionately affect those individuals directly employed in the wood products 37 industry. Potential reductions would also have indirect and induced employment and 38 income impacts. Indirect impacts would occur in industries that support the wood 39 products sector. Induced impacts would occur in those industries that benefit from local 40 expenditures of wood products-related income. Direct and indirect impacts would tend to 41 affect workers who are relatively well paid, but the overall effect of reduced employment 42
Social and Economic Environment Draft EIS
4-284
Chapter 4 and income could have negative effects on communities that are considered timber-1 dependent and may already have relatively high unemployment and poverty rates. 2 Subsection 4.14.2.1 (Lumber and Wood Products) provides a general overview of 3 potential employment effects by county. 4
4.14.4.3 Participation 5 The Services published a Notice of Intent to prepare a Draft EIS in the Federal Register 6 on March 17, 2003 (U.S. Federal Register, Vol. 68, No. 51, March 17, 2003, pages 7 12676-12678). Public scoping meetings were held in Tacoma, Port Angeles, Spokane, 8 and Ellensburg. The scoping meetings were intended to gain input from the affected 9 public and to identify local concerns with the proposed action, as well as to provide 10 members of the public with information about the project. In accordance with the 11 requirements of Executive Order 12898 and the required operating practices of the 12 Services, the scoping process was open to all public members who wished to participate 13 regardless of their race, color, and national origin. 14