37
Chapter 4 Consumer and Firm Behavior: The Work- Leisure Decision and Profit Maximization Copyright © 2014 Pearson Education, Inc.
| Date post: | 25-Dec-2015 |
| Category: |
Documents |
| Upload: | bryan-mcdonald |
| View: | 231 times |
| Download: | 2 times |

Chapter 4Consumer and Firm Behavior:
The Work-Leisure
Decision and Profit
MaximizationCopyright © 2014 Pearson Education, Inc.

1-2© 2014 Pearson Education, Inc.
Chapter 4 Topics
• Behavior of the representative consumer
• Behavior of the representative firm
1-3© 2014 Pearson Education, Inc.
Representative Consumer
• Consumer’s preferences over consumption and leisure as represented by indifference curves.
• Consumer’s budget constraint.• Consumer’s optimization problem: making his or herself
as well off as possible given his or her budget constraint.
• How does the consumer respond to: (i) an increase in non-wage income; (ii) an increase in the market real wage rate?
1-4© 2014 Pearson Education, Inc.
Representative Consumer’s Indifference Curves
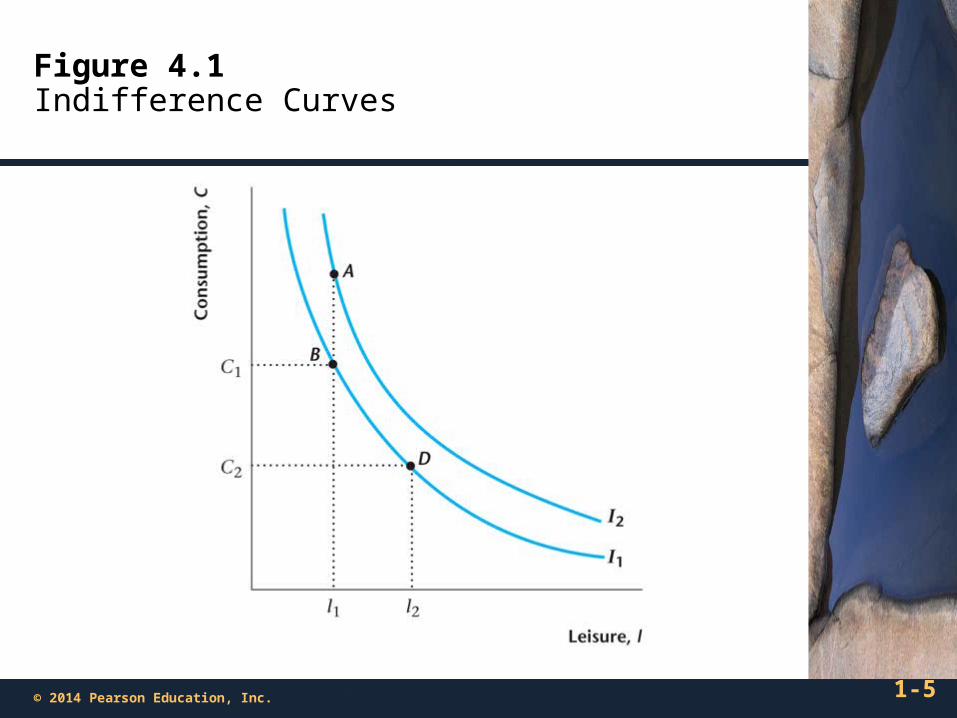
• An indifference curve slopes downward (more is preferred to less).
• An indifference curve is convex (the consumer has a preference for diversity in his or her consumption bundle).
1-5© 2014 Pearson Education, Inc.
Figure 4.1Indifference Curves

1-6© 2014 Pearson Education, Inc.
Figure 4.2Properties of Indifference Curves
1-7© 2014 Pearson Education, Inc.
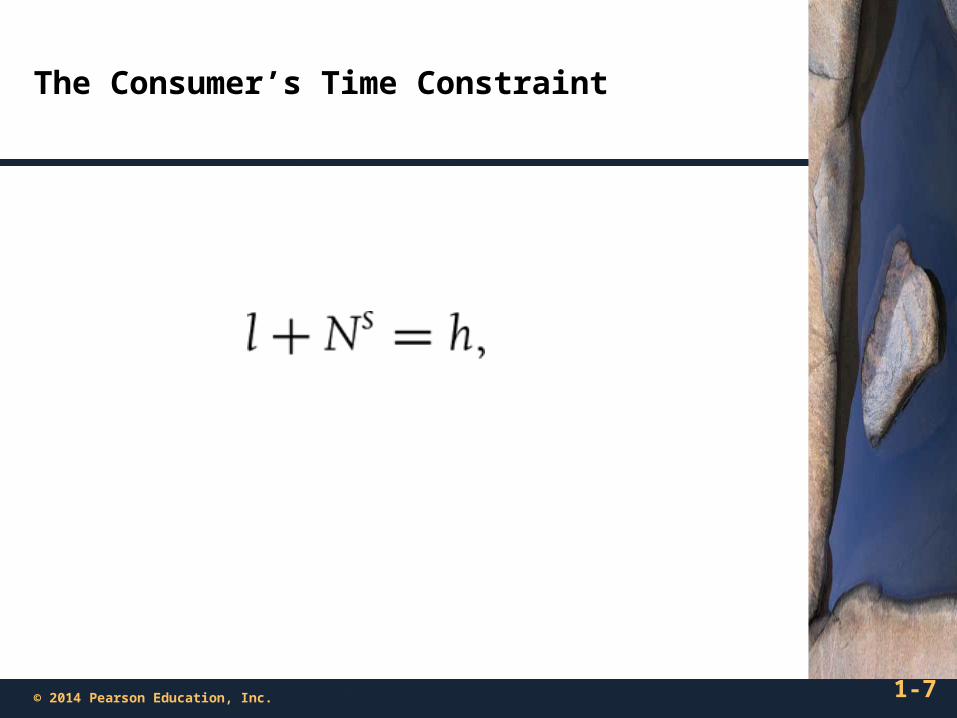
The Consumer’s Time Constraint
1-8© 2014 Pearson Education, Inc.
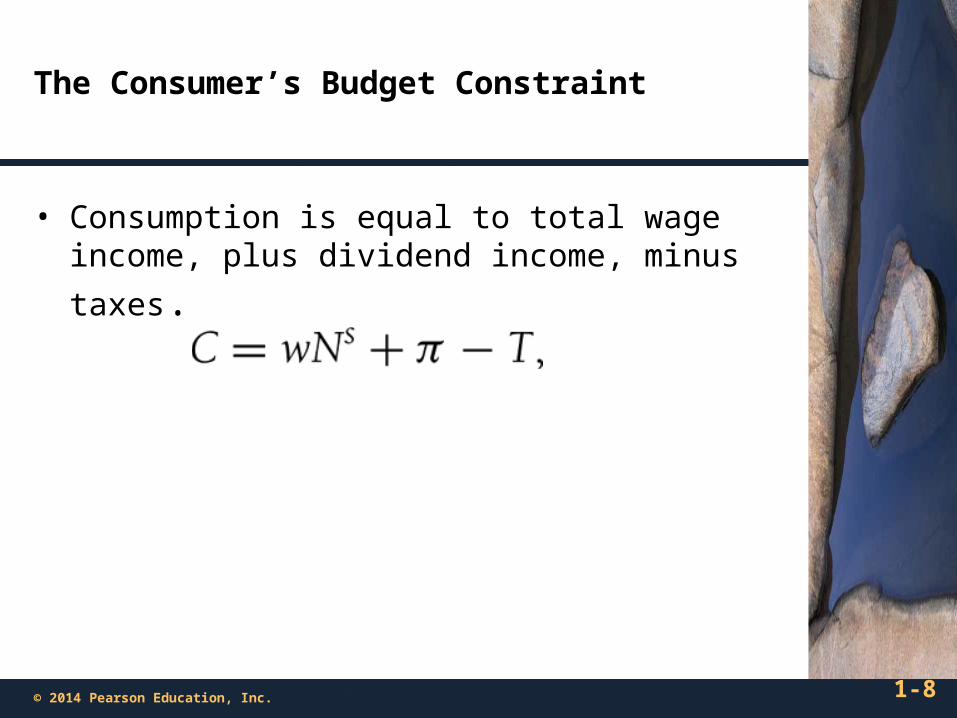
The Consumer’s Budget Constraint
• Consumption is equal to total wage income, plus
dividend income, minus taxes.
1-9© 2014 Pearson Education, Inc.
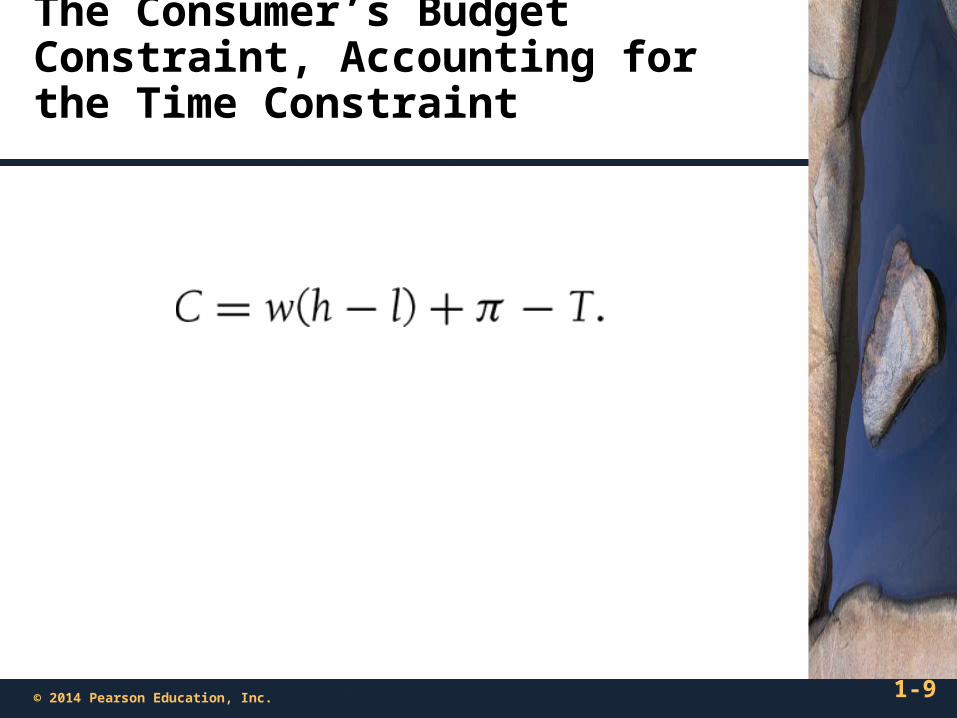
The Consumer’s Budget Constraint, Accounting for the Time Constraint

1-10© 2014 Pearson Education, Inc.
Rewriting the Budget Constraint

1-11© 2014 Pearson Education, Inc.
Rewriting the Budget Constraint Again
1-12© 2014 Pearson Education, Inc.
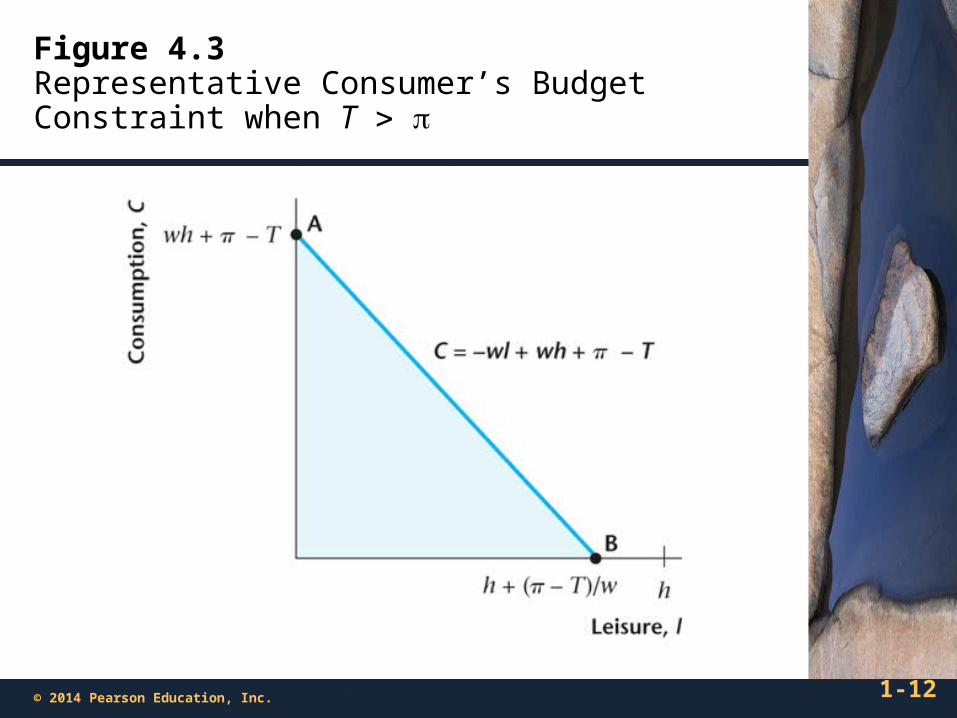
Figure 4.3Representative Consumer’s Budget Constraint when T
1-13© 2014 Pearson Education, Inc.
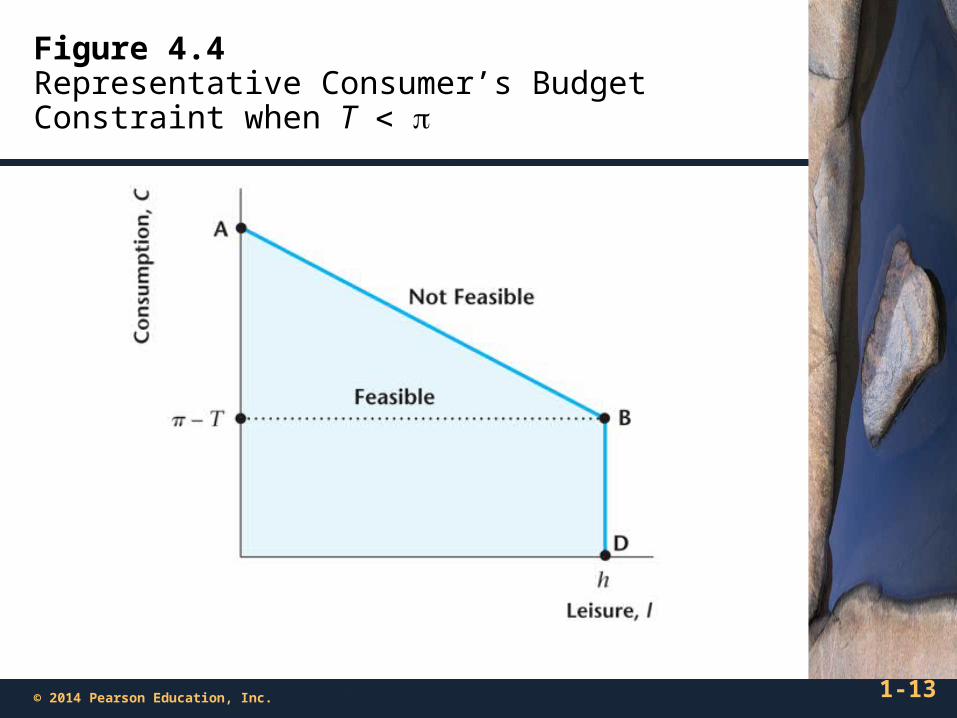
Figure 4.4Representative Consumer’s Budget Constraint when T
1-14© 2014 Pearson Education, Inc.
Consumer Optimization
• The consumer chooses the consumption bundle that is on his or her highest indifference curve, while
satisfying his or her budget constraint.
1-15© 2014 Pearson Education, Inc.
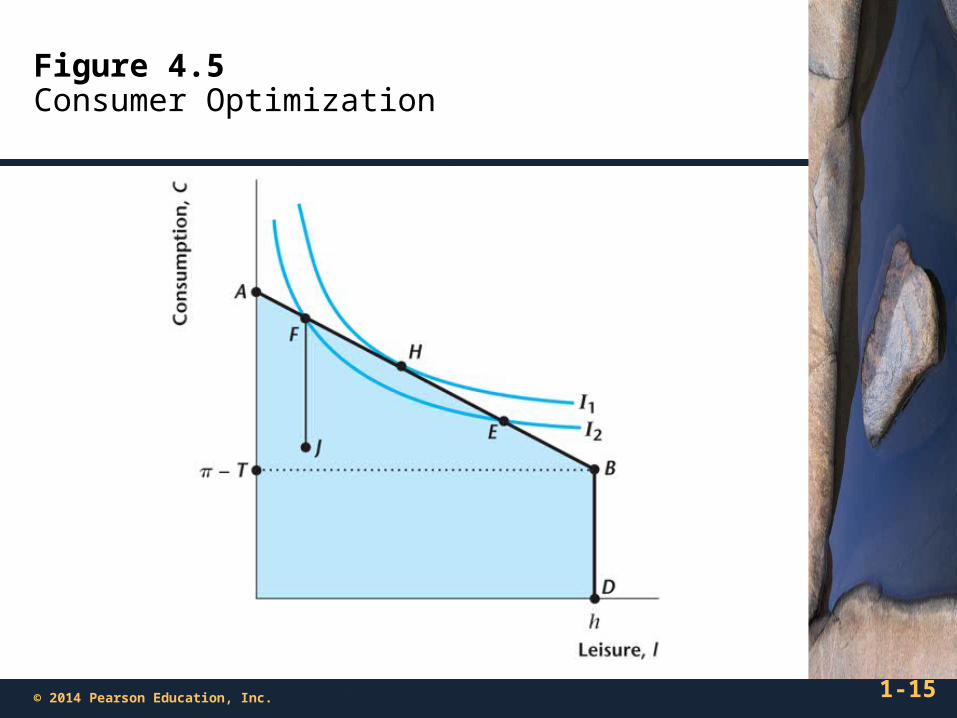
Figure 4.5Consumer Optimization
1-16© 2014 Pearson Education, Inc.
Optimization Implies:
• The marginal rate of substitution of leisure for consumption equals the real wage.
1-17© 2014 Pearson Education, Inc.
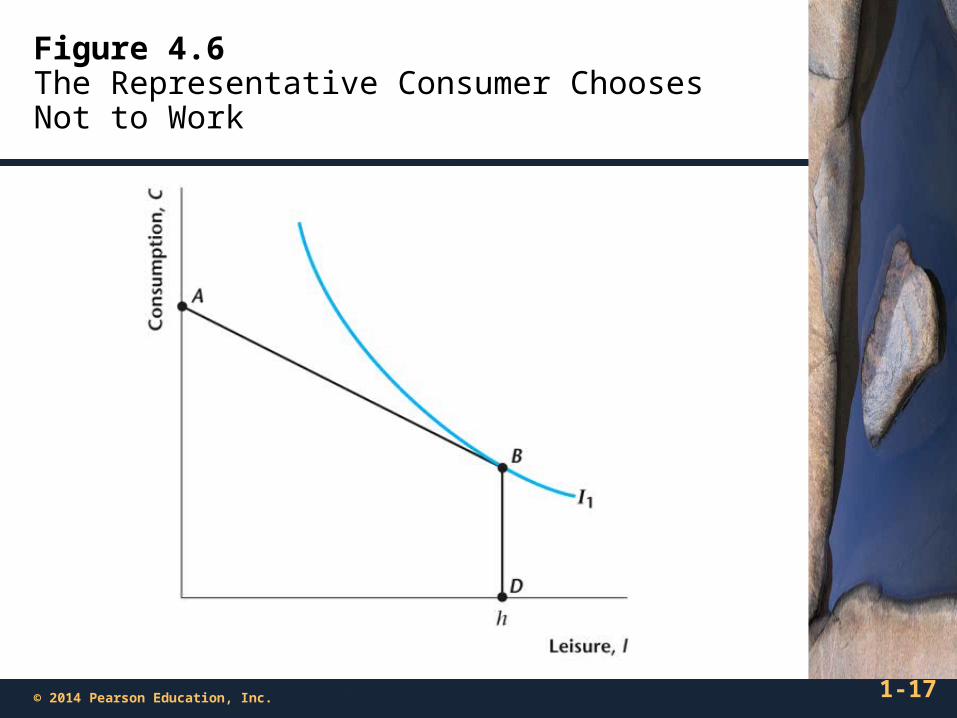
Figure 4.6The Representative Consumer Chooses Not to Work
1-18© 2014 Pearson Education, Inc.
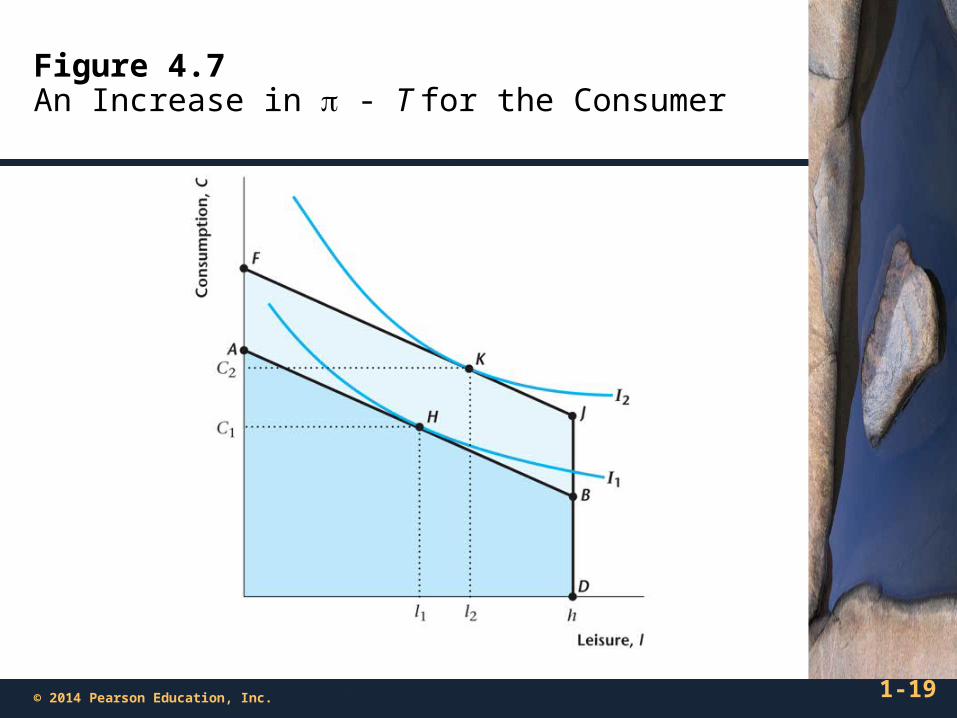
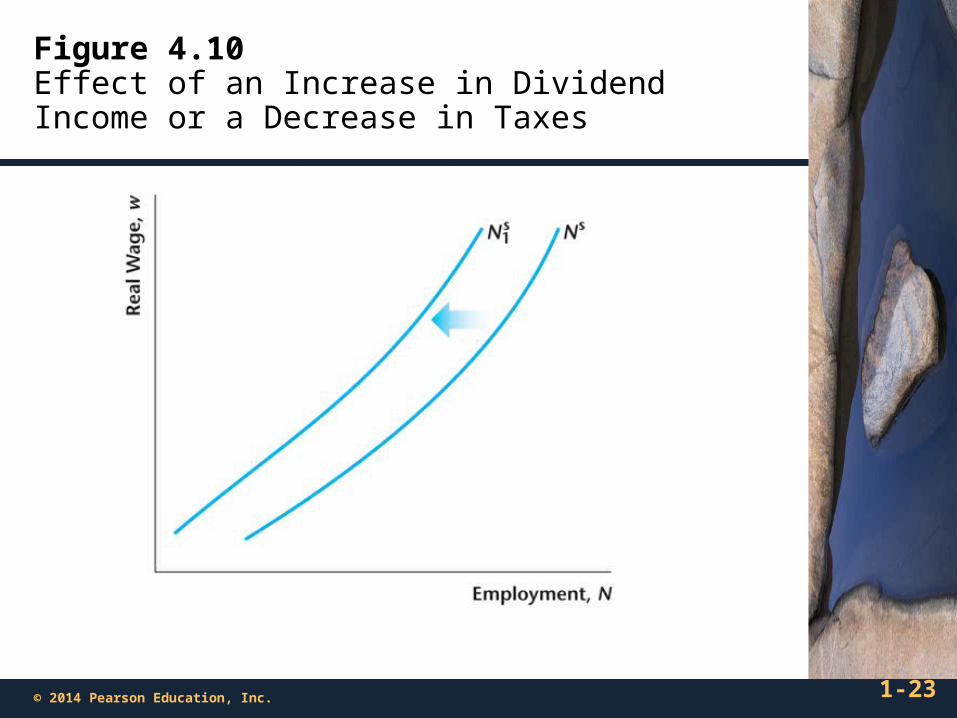
Real Dividends or Taxes Change for the Consumer
• Assume that consumption and leisure are both normal goods.
• An increase in dividends or a decrease in taxes will then cause the consumer to increase consumption and reduce the quantity of labor supplied (increase leisure).
1-19© 2014 Pearson Education, Inc.
Figure 4.7An Increase in - T for the Consumer
1-20© 2014 Pearson Education, Inc.
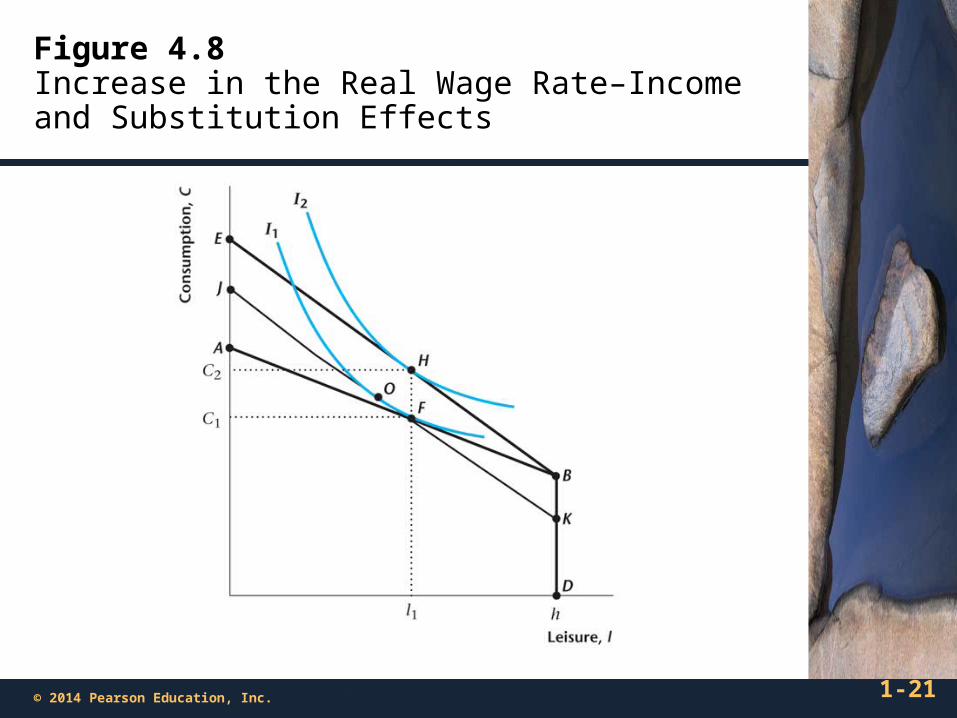
An Increase in the Market Real Wage Rate
• This has income and substitution effects.
• Substitution effect: the price of leisure rises, so the consumer substitutes from leisure to consumption.
• Income effect: the consumer is effectively more wealthy and, since both goods are normal, consumption increases and leisure increases.
• Conclusion: Consumption must rise, but leisure may rise or fall.
1-21© 2014 Pearson Education, Inc.
Figure 4.8Increase in the Real Wage Rate–Income and Substitution Effects
1-22© 2014 Pearson Education, Inc.
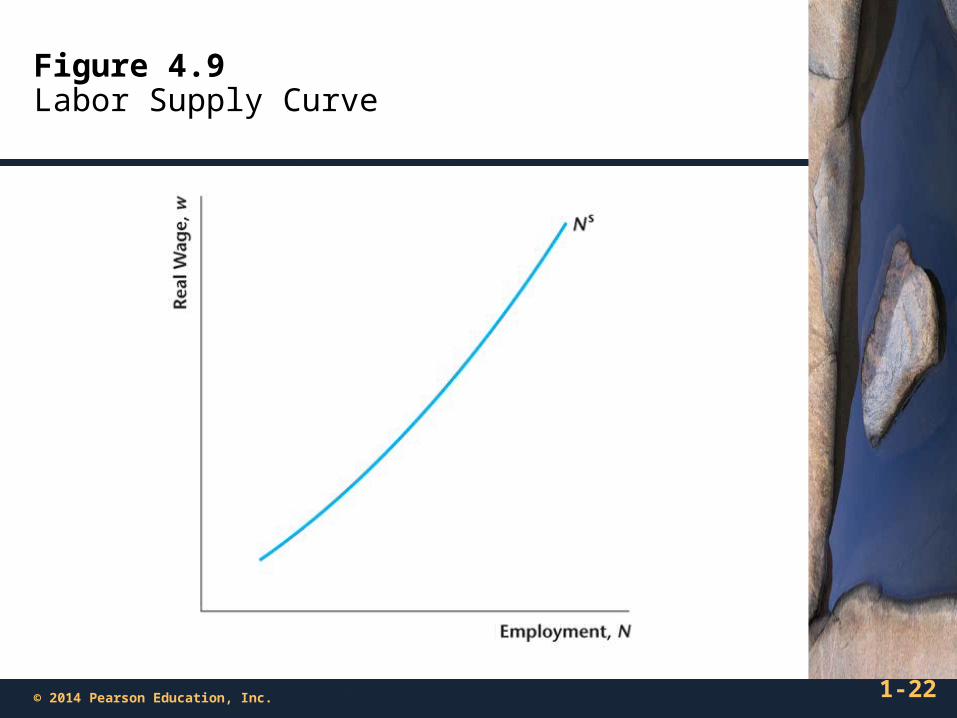
Figure 4.9Labor Supply Curve
1-23© 2014 Pearson Education, Inc.
Figure 4.10Effect of an Increase in Dividend Income or a Decrease in Taxes

1-24© 2014 Pearson Education, Inc.
Figure 4.11Perfect Complements
1-25© 2014 Pearson Education, Inc.
The Representative Firm
• The production function.
• Profit maximization and labor demand.
1-26© 2014 Pearson Education, Inc.
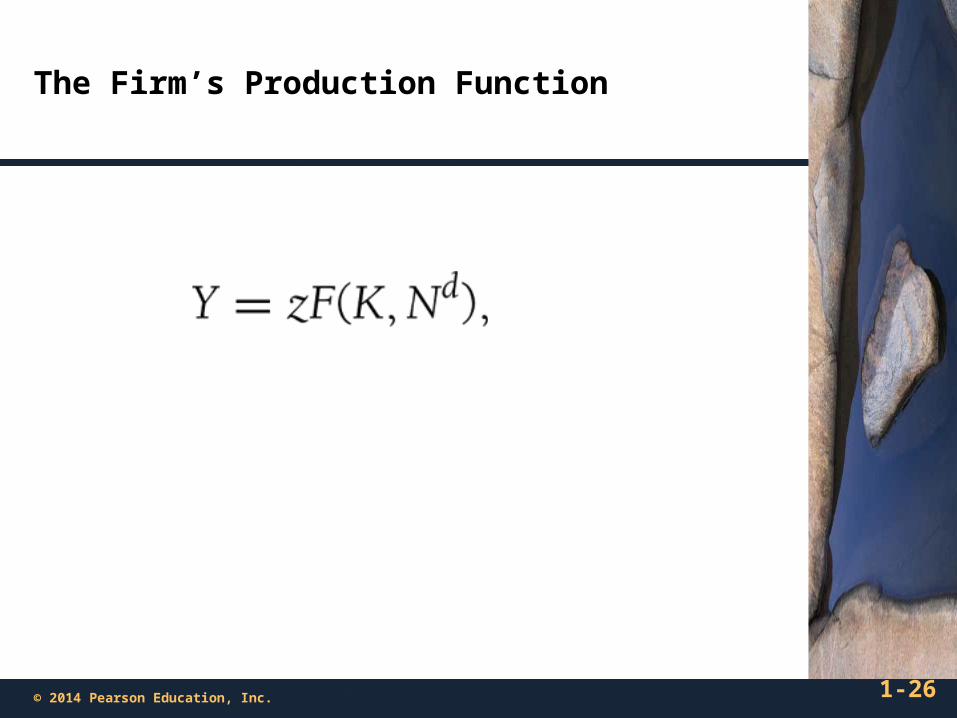
The Firm’s Production Function
1-27© 2014 Pearson Education, Inc.
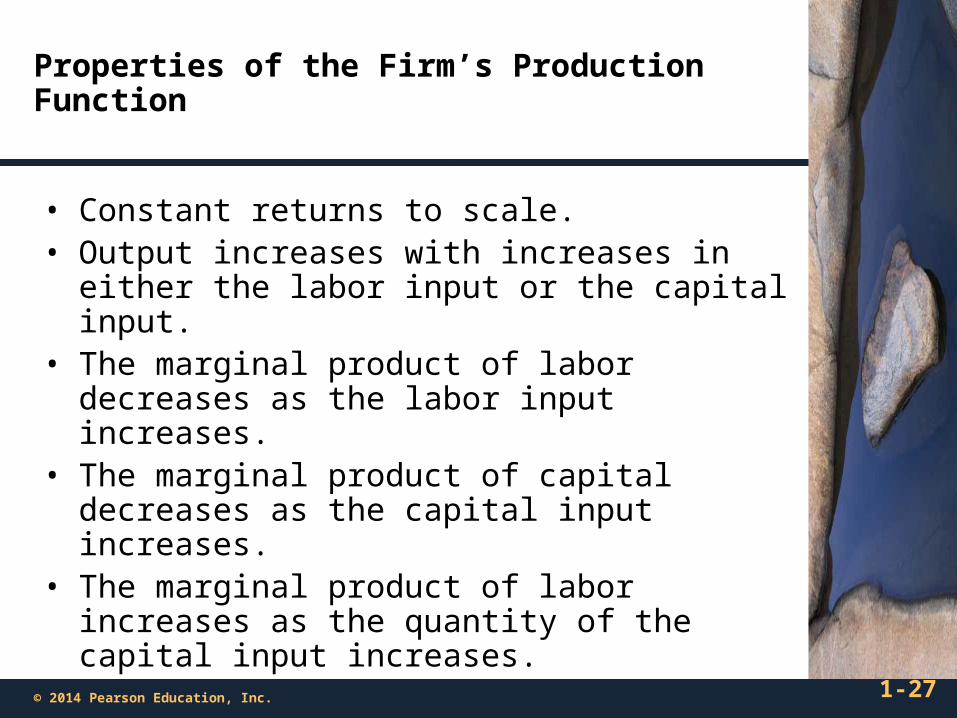
Properties of the Firm’s Production Function
• Constant returns to scale.• Output increases with increases in either the labor
input or the capital input.• The marginal product of labor decreases as the labor
input increases.• The marginal product of capital decreases as the
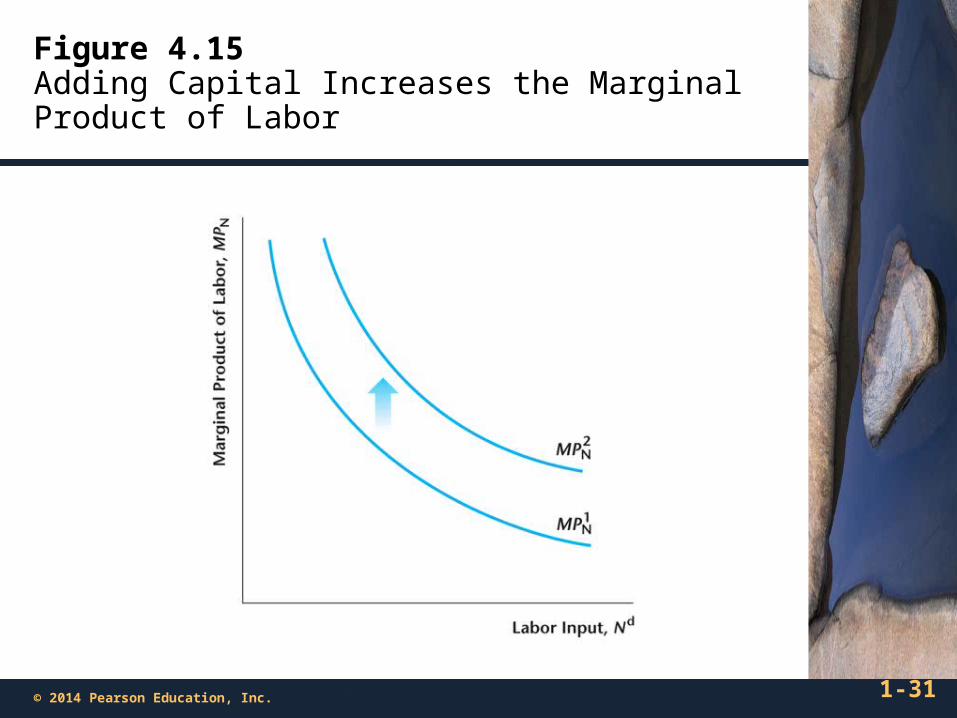
capital input increases.• The marginal product of labor increases as the quantity
of the capital input increases.
1-28© 2014 Pearson Education, Inc.
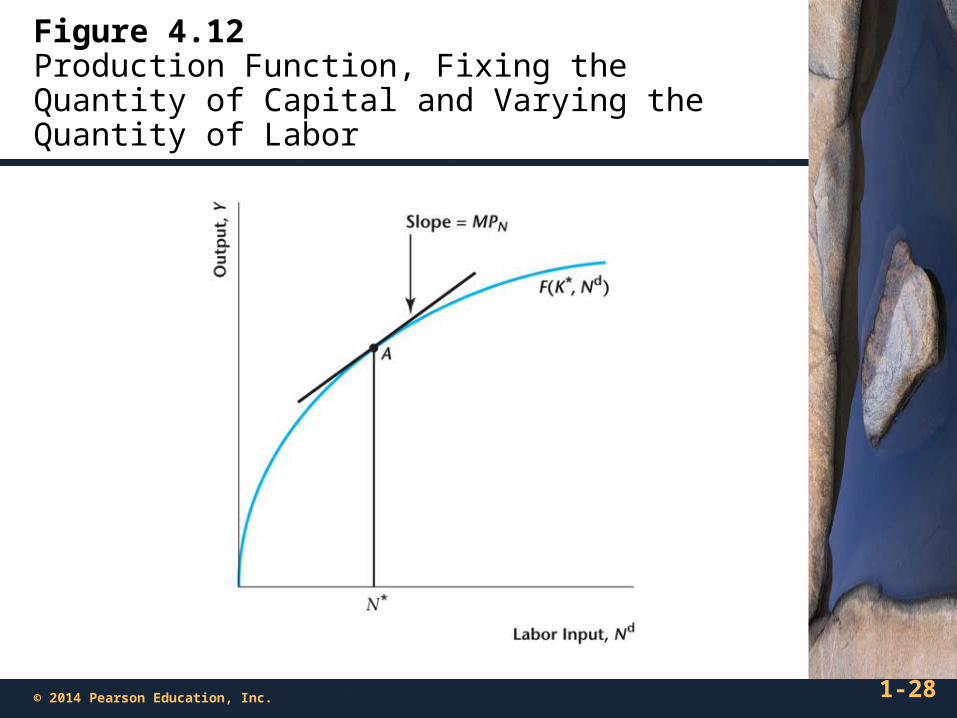
Figure 4.12Production Function, Fixing the Quantity of Capital and Varying the Quantity of Labor
1-29© 2014 Pearson Education, Inc.
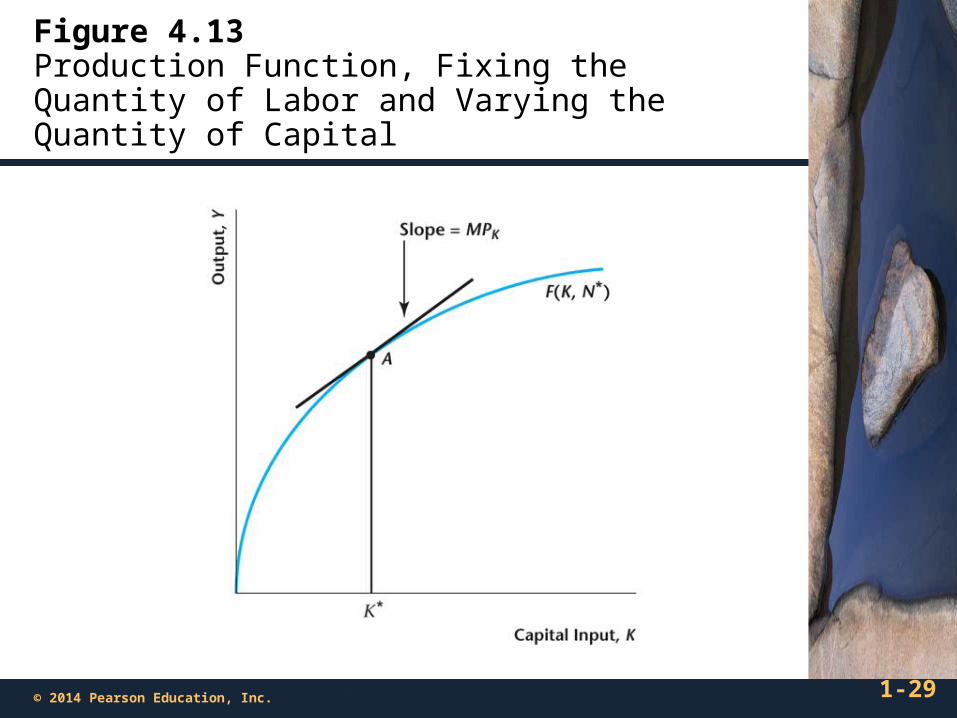
Figure 4.13Production Function, Fixing the Quantity of Labor and Varying the Quantity of Capital
1-30© 2014 Pearson Education, Inc.
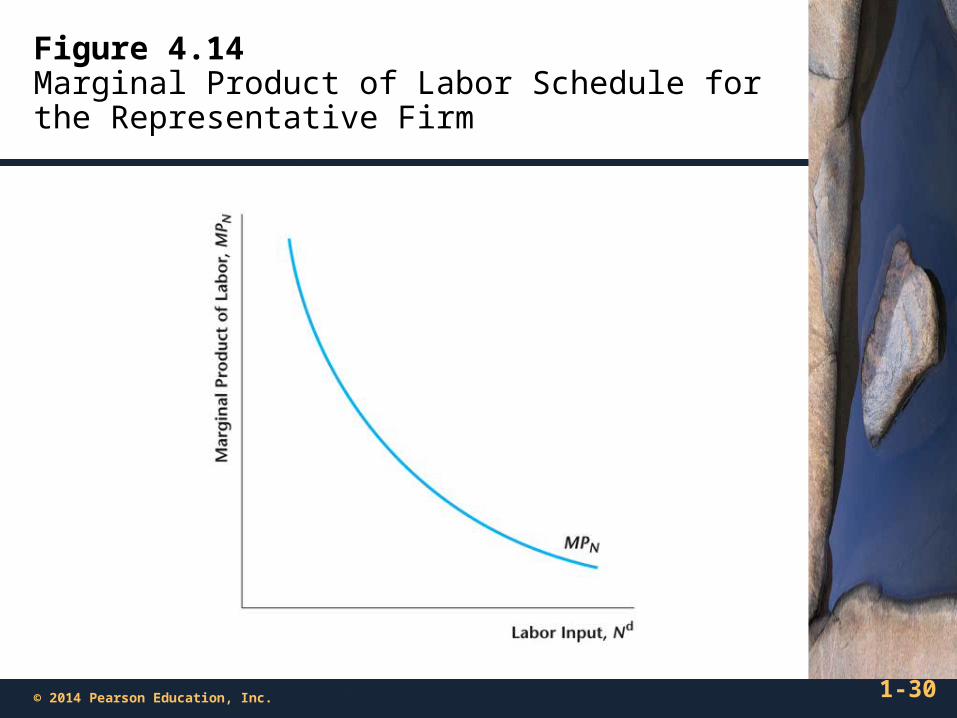
Figure 4.14Marginal Product of Labor Schedule for the Representative Firm
1-31© 2014 Pearson Education, Inc.
Figure 4.15Adding Capital Increases the Marginal Product of Labor
1-32© 2014 Pearson Education, Inc.
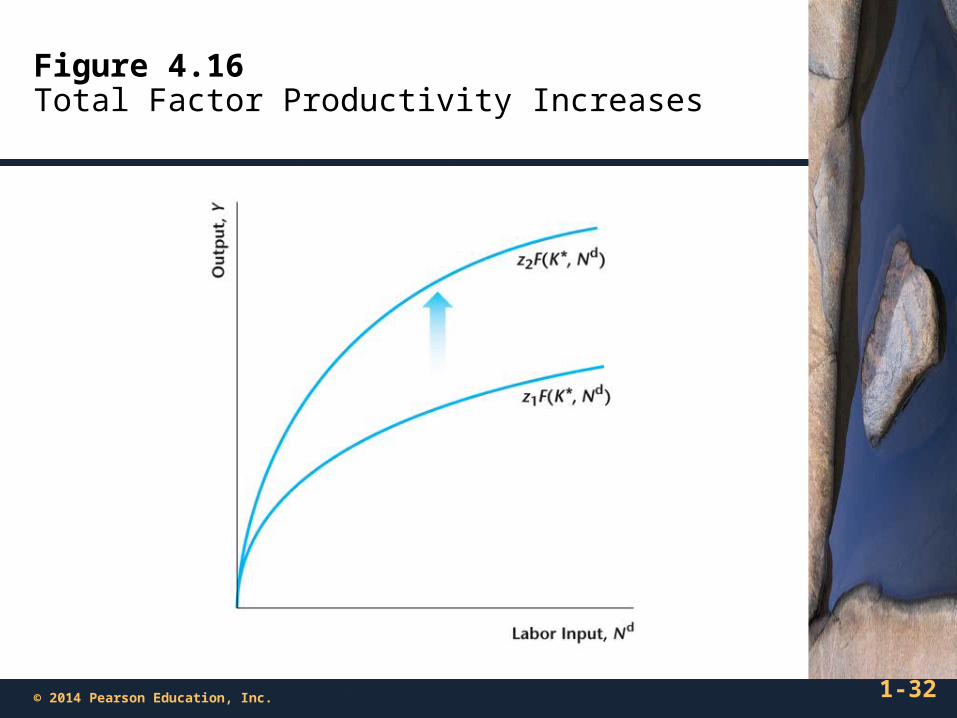
Figure 4.16Total Factor Productivity Increases
1-33© 2014 Pearson Education, Inc.
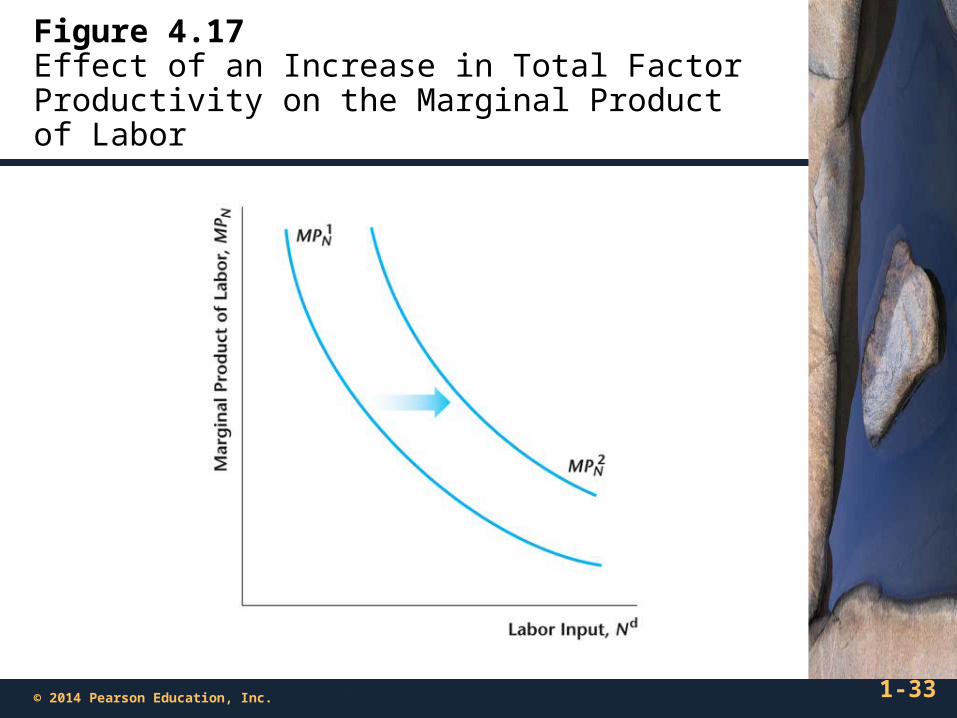
Figure 4.17Effect of an Increase in Total Factor Productivity on the Marginal Product of Labor
1-34© 2014 Pearson Education, Inc.
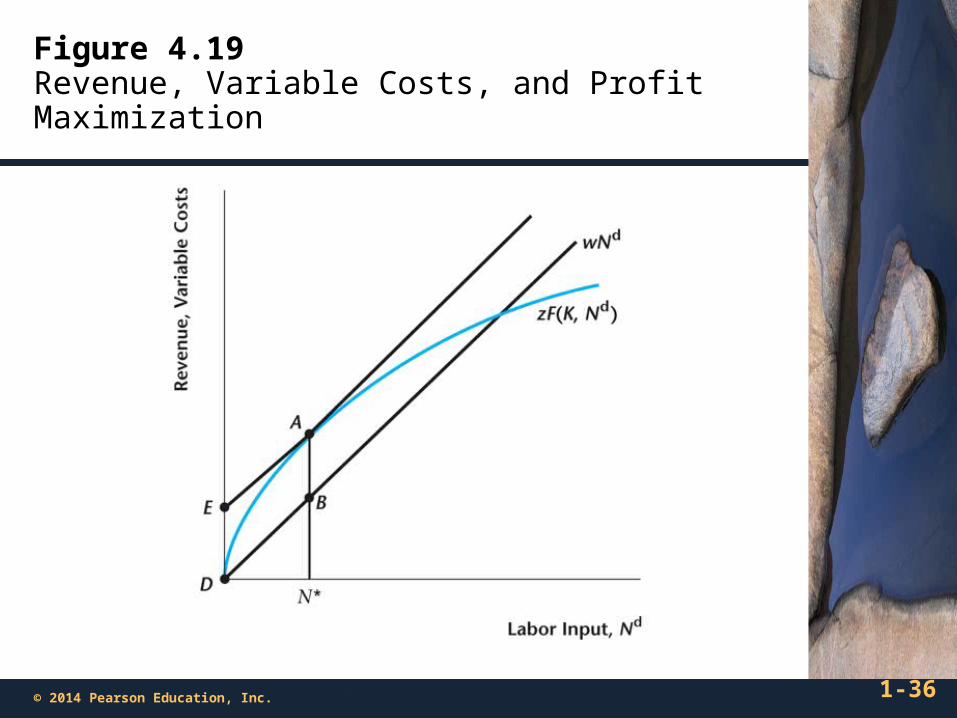
Profit Maximization
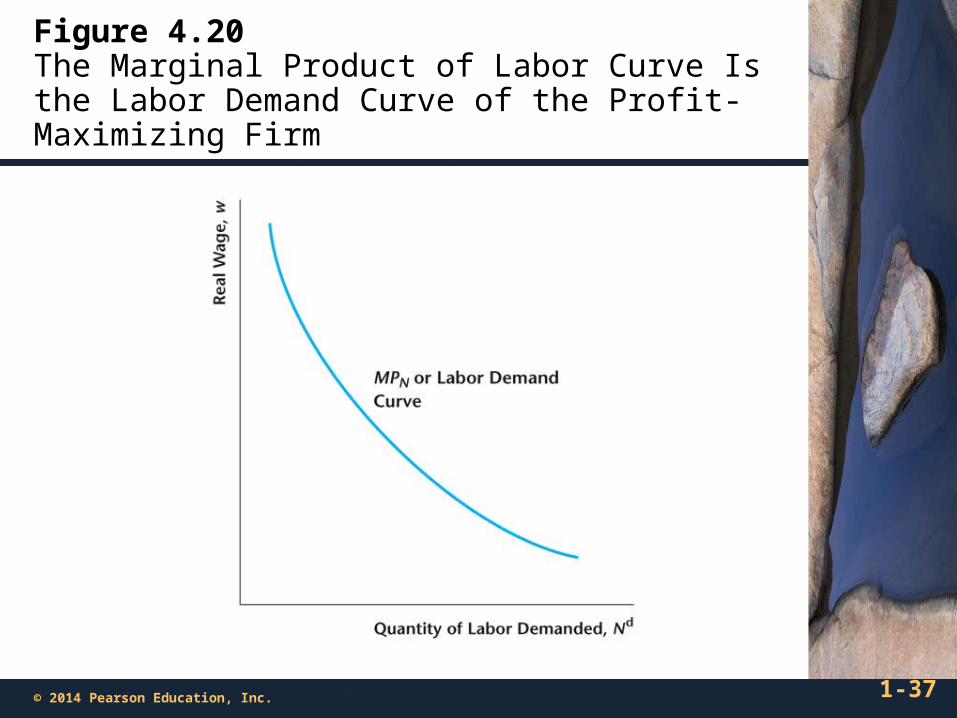
When the firm maximizes profits, the marginal product of labor equals the real wage.
wMPN
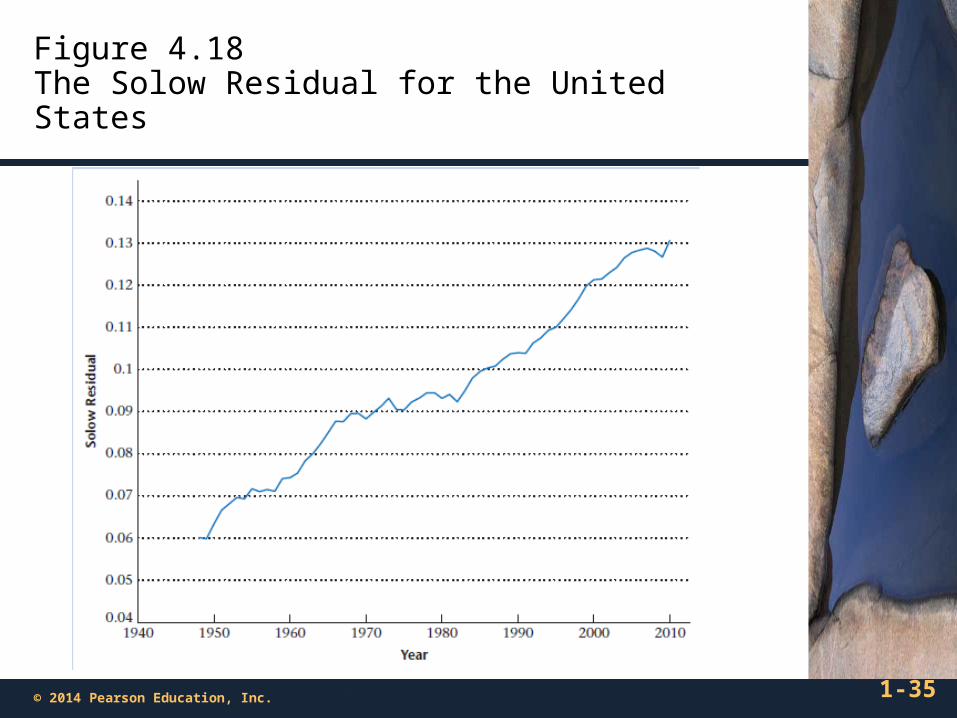
Figure 4.18The Solow Residual for the United States
1-35© 2014 Pearson Education, Inc.
1-36© 2014 Pearson Education, Inc.
Figure 4.19Revenue, Variable Costs, and Profit Maximization
1-37© 2014 Pearson Education, Inc.
Figure 4.20The Marginal Product of Labor Curve Is the Labor Demand Curve of the Profit-Maximizing Firm


