103 Chapter-4: Data Analysis In the previous chapter, details were provided regarding the research design, instruments used, rationale behind pilot questionnaire, details of pilot study, main study, population, sample size, sampling method, profile of institutions, data collection procedure, description of variables, various tests employed etc. 4.1 Data Analysis and Interpretation This section peeps deep into the statistical analysis of the data. After completion of full-fledged survey with finalized questionnaire, data was arranged in an orderly fashion in a summary of spread sheet, by counting the frequency of responses of each question. The hypotheses have been formulated and tested using SPSS software and the results have been arrived at. The total analysis was carried out by using SPSS 18.1 software package. 4.2 Statistical Tests Employed The hypotheses have been formulated and tested using SPSS software and the results have been arrived at. The total analysis was carried out by using SPSS 18.1 software package. Various other statistical tools and tests used for analysis included reliability analysis, reliability testing, Cronbach's Alpha, Kaiser-Meyer-Olkin measure of sampling adequacy, tabulation of data, descriptive statistics, means, averages, factor analysis, total variance analysis, principal component analysis using EIGEN values, rotated component matrix, correlation
Transcript
103
Chapter-4: Data Analysis
In the previous chapter, details were provided regarding the research
design, instruments used, rationale behind pilot questionnaire, details of
pilot study, main study, population, sample size, sampling method, profile
of institutions, data collection procedure, description of variables, various
tests employed etc.
4.1 Data Analysis and Interpretation
This section peeps deep into the statistical analysis of the data. After
completion of full-fledged survey with finalized questionnaire, data was
arranged in an orderly fashion in a summary of spread sheet, by counting
the frequency of responses of each question. The hypotheses have been
formulated and tested using SPSS software and the results have been
arrived at. The total analysis was carried out by using SPSS 18.1 software
package.
4.2 Statistical Tests Employed
The hypotheses have been formulated and tested using SPSS
software and the results have been arrived at. The total analysis was
carried out by using SPSS 18.1 software package. Various other
statistical tools and tests used for analysis included reliability analysis,
reliability testing, Cronbach's Alpha, Kaiser-Meyer-Olkin measure of
sampling adequacy, tabulation of data, descriptive statistics, means,
averages, factor analysis, total variance analysis, principal component
analysis using EIGEN values, rotated component matrix, correlation
104
analysis, regression analysis, crosstab, chi-square tests, probability
techniques, etc.
4.3 Cronbach's Alpha
Reliability Testing: Cronbach's Alpha is designed as a measure of
internal consistency of items in the questionnaire. It varies between zero
and one. The closer alpha is to one, the greater the internal consistency of
the items in the questionnaire. Total number of questions or items in the
questionnaire is 64 including 48 testing variables or LIKERT scale
variables and 16 items related to demographic variables. Hence “N” of
items in the below Cronbach’s Alpha test is 48.
Table 4.0.1: Cronbach's Alpha-Reliability Test
Cronbach's Alpha N of Items
0.697 48
Table 4.0.2: Scale Statistics
Mean Variance Std. Deviation N of Items
192.24 90.294 9.502 48
Inference: Cronbach’s alpha test was performed to check the
reliability of questions or items. The above tables display several results
obtained. The Cronbach’s alpha test was performed and it resulted in an
overall score of 0.697 indicating internal consistency of the items.
4.4 KMO (Kaiser-Meyer-Olkin) and Bartlett's test
KMO (Kaiser-Meyer-Olkin) and Bartlett's test: This test is used to
measure the sampling adequacy, which also decides the need to conduct
105
factor analysis. After a positive KMO Bartlett's test, factor analysis was
performed. Subsequently several tests of hypotheses were performed
using correlation analysis, regression analysis, crosstab and chi-square
test.
Table 4.0.3: KMO and Bartlett's Test
Kaiser-Meyer-Olkin (KMO) and Bartlett's Test
Kaiser-Meyer-Olkin Measure of Sampling Adequacy 0.735
Bartlett's Test of Sphericity
Approx. Chi-Square 12674.184
Degrees of freedom 1128
Significance 0.000
Reliability Analysis184: Cronbach’s coefficient of reliability was
computed for all dimensions to verify the internal consistency of the items
that constitute dimensions. Scale reliability is the ratio of true score
variance to observed score variance. If there is less error inherent within
the scale, then the scale will yield consistent results across observations
and research settings. In other words reliability of an instrument is the
degree to which it yields a true score of the variable under consideration.
Reliability is also defined as the extent to which any measuring
instrument yields the same results on repeated trials.
Several methods of reliability are used to establish the reliability of
a measuring instrument. These include test-retest method, equivalent
forms, split-halves method and internal consistency method. The internal
consistency measure is the most preferred one because it requires a single
administration and consequently is supposed to be most effective in field
184 Reliability analysis, http://www.ats.ucla.edu/stat/spss/faq/alpha.html, Accessed on Feb2010
106
studies. Internal consistency is concerned with the homogeneity of the
items comprising a scale.
A scale is internally consistent to the extent that its items are highly
inter-correlated. This method is also considered as the most general form
of reliability estimation185. In this method, reliability is operationalized as
internal consistency, which is the degree of inter-correlation among the
items that constitute a scale (Nunnally, 1978). It also presents the level of
homogeneity of items in a scale. Internal consistency is measured using a
reliability coefficient of Cronbach’s alpha (Cronbach, 1951)
Reliability Measures: Below points highlight the reliabilities of the
scales used in this study. The standardized Cronbach’s alpha has been
calculated for each measure. Cronbach’s alpha measures the internal
consistency of a scale. It represents the degree to which instrument items
are homogeneous and reflect the same underlying constructs (Stevens,
1995). Bohrnstedt and Knoke (1994) suggest that researchers should
strive for alphas of 0.70 or higher. As the data below highlights that all
the scales are reliable and coherent. The data collected from all 280 valid
or completely filled in questionnaires have been analyzed through SPSS
18.0 and results of data analysis are presented.
Reliability Testing: Each hypotheses is tested and validated. To
prepare the contextual questionnaire, it requires operationalizing the
list of items to measure the concepts involved in the study.
185MCK Yang, Reliability estimation, www.stat.ufl.edu/~yang/publications/reliability.pdf, Accessed on 3rd July2010
107
Prior to hypotheses testing, it is required to do testing for data
consistency and data validation. Initially, the content validity186 of the items
is established by referring to four relevant but contextually different
validated questionnaires, for ensuring a comprehensive coverage on the
culture dimensions. By referring to four standardized questionnaires
namely Organizational Culture Profile (OCP), (O'Reilly et al, 1991);
Academia-Industry Cultural Profile (AICP), (Tepeci, 2001); Engineering
College Culture Inventory, (Maslowski, 2001) and Organizational Trust
Questionnaire, (Ribiere, Defuria, 2001), a list of 64 items representing the
college change management and work culture is identified. The learning’s
are incorporated as part of demographic variables such as urban, rural,
government, and private, age of the college and LIKERT scale variables or
testing variables in the final questionnaire as shown in this Thesis
document.
Also, the relevancy of the AP state context is ensured by adding the
items which are specific to the working nature of AP state educational
institutions. Further, the face validity is established by giving the list of items
to seven subject matter experts or senior faculty members (judges). They
short-listed the items based on relevancy, ability to discriminate, non-
redundancy and readability (O'Reilly et al, 1991) to a list of 64 relevant
items.
186 Pedro Delicado, Testing and validating hypotheses,
http://www.recercat.net/bitstream/2072/358/1/210.pdf, Accessed on 4th May2010
108
The 64 items are subjected to a pilot study with a sample size of 205
(As per Guadognoli et al. (1988), a minimum of 150-200 cases are required
to run factor analysis on the data). The response rate is 79% with 280
usable questionnaires returned for analysis. The main objectives of the
pilot study are to identify the relevant or appropriate culture variables187,
which are highly correlated to each other, and to remove the distant items,
which are not closely correlated to other items. Also, it will help to figure
out the initial factor structure of the variables so that, the identified
parameters or factors will show convergent and discriminate validity
through their factor loadings.
Cronbach's Alpha measures as 0.697, which shows higher
reliability of the items. The convergence of items on eleven different
factors shows that there is an evidence for validity of the items. For
measuring the intrinsic motivation188 of the employees the Hackman and
Oldham's (1980), Job Diagnostic Survey is used. The external validity of
the study is enhanced by adopting a random sampling procedure in a
multi-phased manner. Initially the total sample size required for this
study is measured based on the measurement model in a normal
distribution.
187 Sekhar and Supriya, 2011, Variables Analysis, Communication Skills and Feedback Channels, A Viable Framework for Sustainable Six Sigma Implementation, Technology Spectrum, Journal of JNTUH, Vol. 5, No. 1, PP 36-45 188
V.K.Narayanan, Managing Technology and Innovation for Competitive Advantage, Pearson Education, 2003,
PP 96-99
109
Assuming a population of infinity (above 20,000), the minimum
recommended sample size for a 98% confidence level turned out to be
527 (Raosoft sample, 2006). To randomly attain this sample size, a total of
227 engineering colleges in AP are considered as the initial sampling
frame. The colleges are selected in random in the first phase of sampling.
The Director or Principal of each randomly selected college was
approached officially for permission to meet and collect data from their
faculty. In the second phase of sampling, a minimum of 25-50% (based on
the permission given by the respective heads of the 106 colleges thus
randomly selected) of the faculty members from each college. Factor
analysis was conducted for both perceived and preferred culture items to
test the model fit.
The perceived culture factor structure has shown moderate to good fit
measures in the Unweighted Least Squares (ULS) procedure, after deleting
one factor and two items from the initial model. The preferred culture
factor structure turned out with goodness of fit measures ranging from partly
good to partly lower in fit in the Maximum Likelihood (ML)model, after
deleting three factors are selected in random and the process is continued
until the requisite samples are attained.
All the data are initially assessed for the fulfillment of the assumptions
involved in multivariate analysis namely normality, linearity and
homoscedasticity (condition found in a type of scatter graph; also known as
constant variance. It is one of the assumptions required in a regression
analysis in order to make valid statistical inferences about population
110
relationships) Most of the variables fulfilled the required conditions. Nine
samples with incomplete data are removed. As the sample size of the final
study is changed, factor analysis is conducted again to know the change
in the factor structure. When the Cronbach's Alpha (a) is examined for all
the sub scale dimensions, they yielded satisfactory measures.
Respondents’ opinions on overall factors: Based on respondents
opinions on overall factors, factor analysis was done and subsequently all
the key factors were tested with correlation analysis, regression analysis,
crosstab analysis and chi-square analysis for testing or validation of all
hypotheses. It is important to examine the relationship between
dependent and independent variables apart from crosstab analysis and
chi-square analysis. An attempt is made to relate the factors to some of
the empirical data points for empirical evidences such as objective
performance measures such as students’ placement percentages, faculty
member’s attrition percentages, college rankings, number of
accreditations, reputational measures, college self reports, partnering with
industries etc. Statistical analysis is done with dependent variables and
factors identified (independent variables). This helps to verify the
relationships with performance measures (outcome variables) with
possible outcomes. For this reason regression analysis and correlation
analysis were used apart from factor analysis, crosstab analysis and chi-
square analysis. An attempt is made by the researcher as part of the
exploratory research work; hypotheses were tested or validated with
111
regression analysis, correlation analysis apart from crosstab analysis and
chi-square analysis.
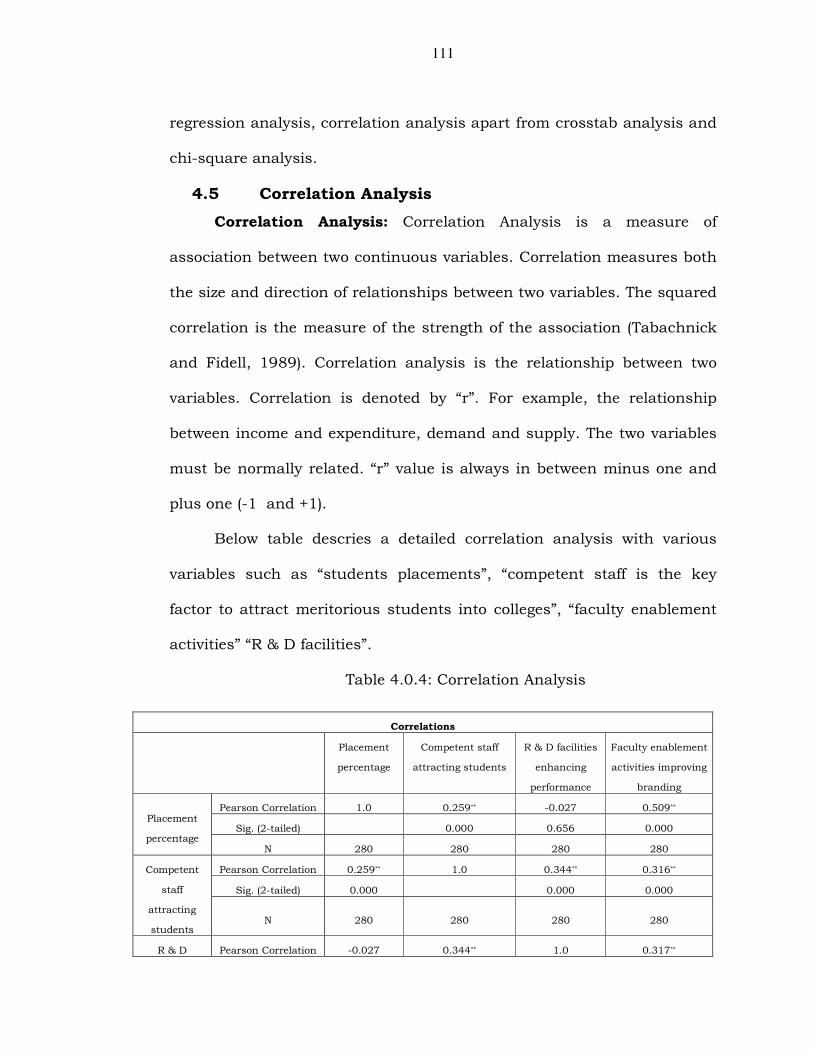
4.5 Correlation Analysis
Correlation Analysis: Correlation Analysis is a measure of
association between two continuous variables. Correlation measures both
the size and direction of relationships between two variables. The squared
correlation is the measure of the strength of the association (Tabachnick
and Fidell, 1989). Correlation analysis is the relationship between two
variables. Correlation is denoted by “r”. For example, the relationship
between income and expenditure, demand and supply. The two variables
must be normally related. “r” value is always in between minus one and
plus one (-1 and +1).
Below table descries a detailed correlation analysis with various
variables such as “students placements”, “competent staff is the key
factor to attract meritorious students into colleges”, “faculty enablement
activities” “R & D facilities”.
Table 4.0.4: Correlation Analysis
Correlations
Placement
percentage
Competent staff
attracting students
R & D facilities
enhancing
performance
Faculty enablement
activities improving
branding
Placement
percentage
Pearson Correlation 1.0 0.259** -0.027 0.509**
Sig. (2-tailed)
0.000 0.656 0.000
N 280 280 280 280
Competent
staff
attracting
students
Pearson Correlation 0.259** 1.0 0.344** 0.316**
Sig. (2-tailed) 0.000
0.000 0.000
N 280 280 280 280
R & D Pearson Correlation -0.027 0.344** 1.0 0.317**
112
From the above correlation matrix, placement percentage is having
a significant correlation with “competent staff is the key factor to attract
meritorious students into colleges” and faculty enablement activities.
Further it is strongly correlated with faculty enablement activities and
negatively correlated with R & D facilities. “Having competent staff is the
key factor to attract students” is having a significant correlation with
placement percentage, R & D facilities, and faculty enablement activities.
Further it is moderately correlated with R & D facilities. Faculty
enablement activities are having a significant correlation with placement
percentage; competent staff is the key factor to attract students and R &
D facilities. Further it is moderately correlated with competent staff is the
key factor to attract students and R & D facilities.
4.6 Regression Analysis
Regression Analysis: Regression analysis is a mathematical
measure of the average relationship between two or more variables in
terms of the original units of the data. Regression clearly indicates the
cause and effect relationship between the variables. In regression, the
variable corresponding to cause is taken as independent variable and the
variable corresponding to effect is taken as dependent variable. The
facilities
enhancing
performance
Sig. (2-tailed) 0.656 0.000
0.000
N 280 280 280 280
Faculty
enablement
activities
improving
branding
Pearson Correlation 0.509** 0.316** 0.317** 1.0
Sig. (2-tailed) 0.000 0.000 0.000
N 280 280 280 280
**Correlation is significant at the 0.01 level (2-tailed)
113
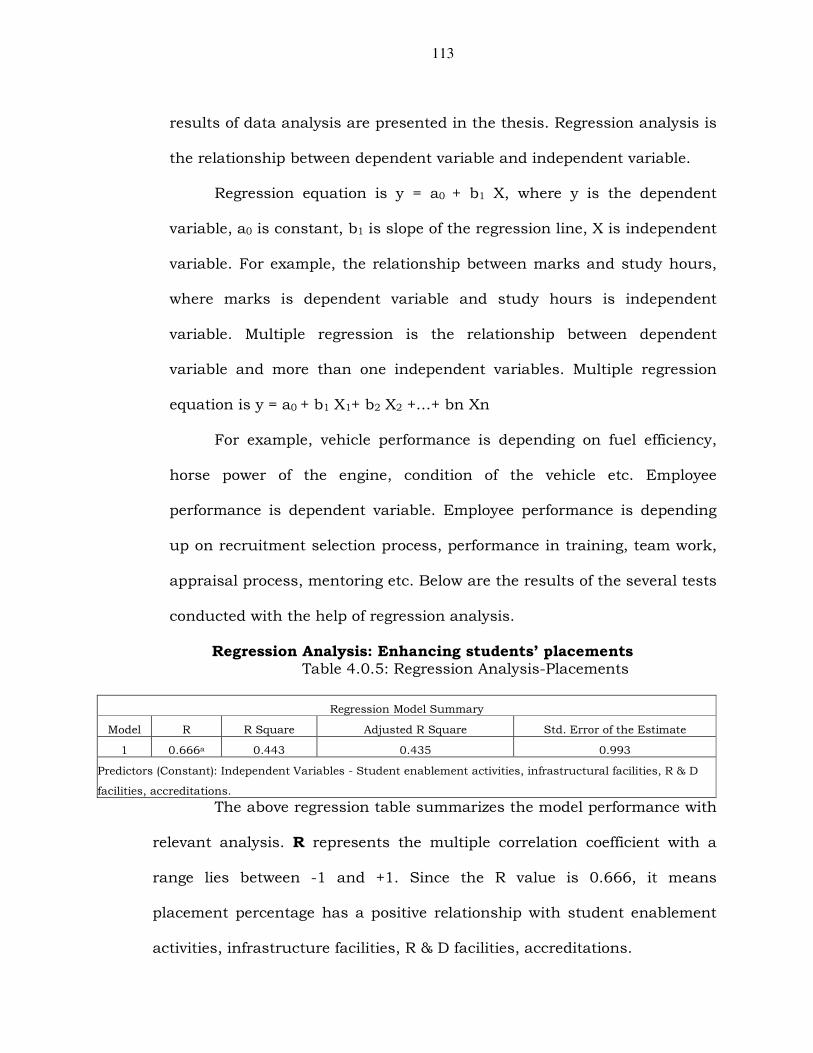
results of data analysis are presented in the thesis. Regression analysis is
the relationship between dependent variable and independent variable.
Regression equation is y = a0 + b1 X, where y is the dependent
variable, a0 is constant, b1 is slope of the regression line, X is independent
variable. For example, the relationship between marks and study hours,
where marks is dependent variable and study hours is independent
variable. Multiple regression is the relationship between dependent
variable and more than one independent variables. Multiple regression
equation is y = a0 + b1 X1+ b2 X2 +…+ bn Xn
For example, vehicle performance is depending on fuel efficiency,
horse power of the engine, condition of the vehicle etc. Employee
performance is dependent variable. Employee performance is depending
up on recruitment selection process, performance in training, team work,
appraisal process, mentoring etc. Below are the results of the several tests
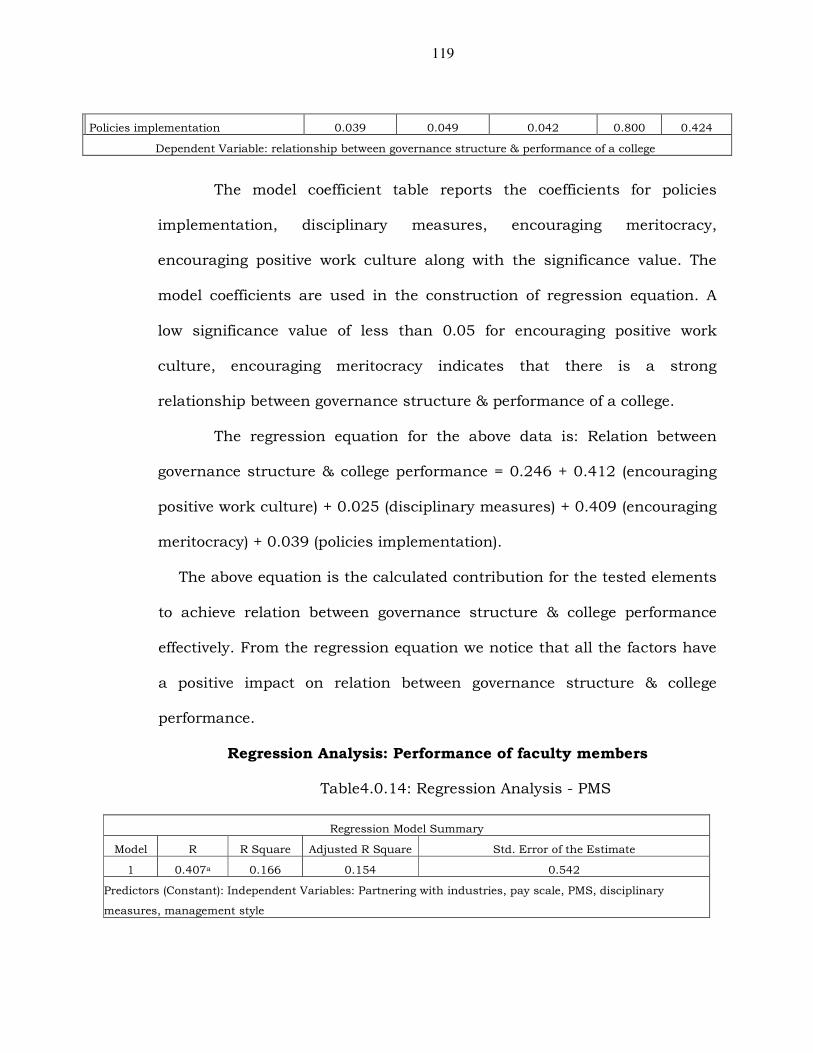
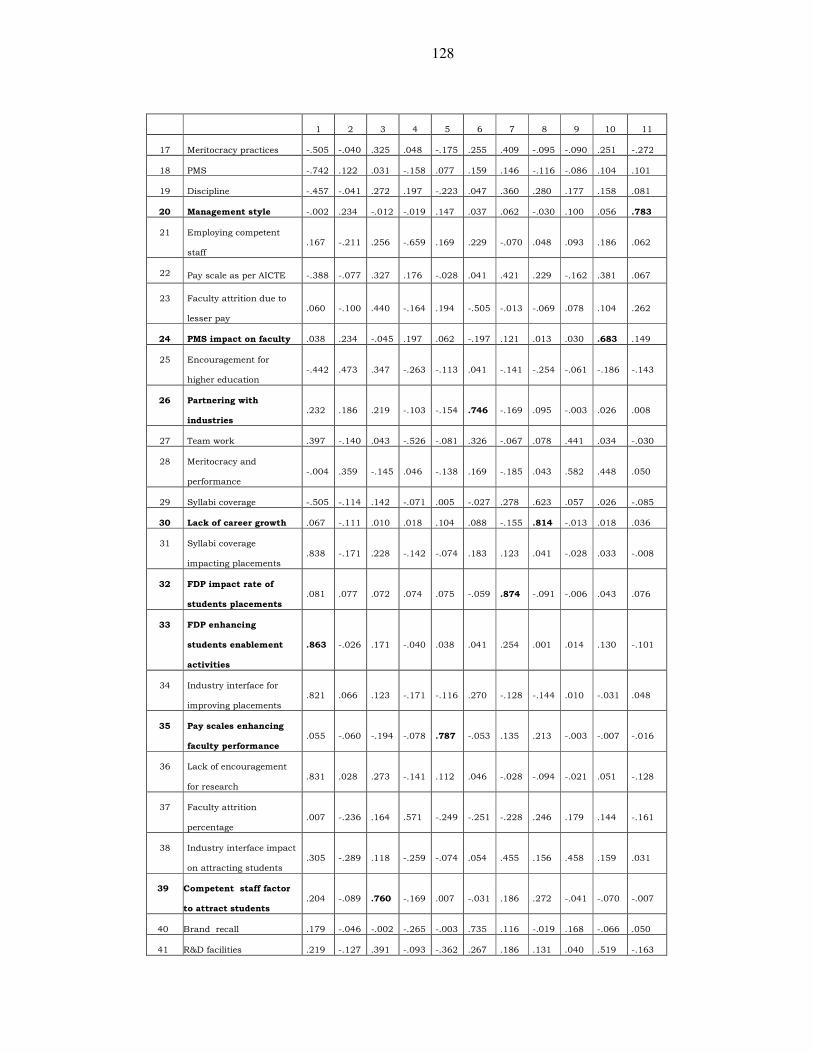
Rotation Method: Varimax with Kaiser Normalization: Rotation converged in 17 iterations
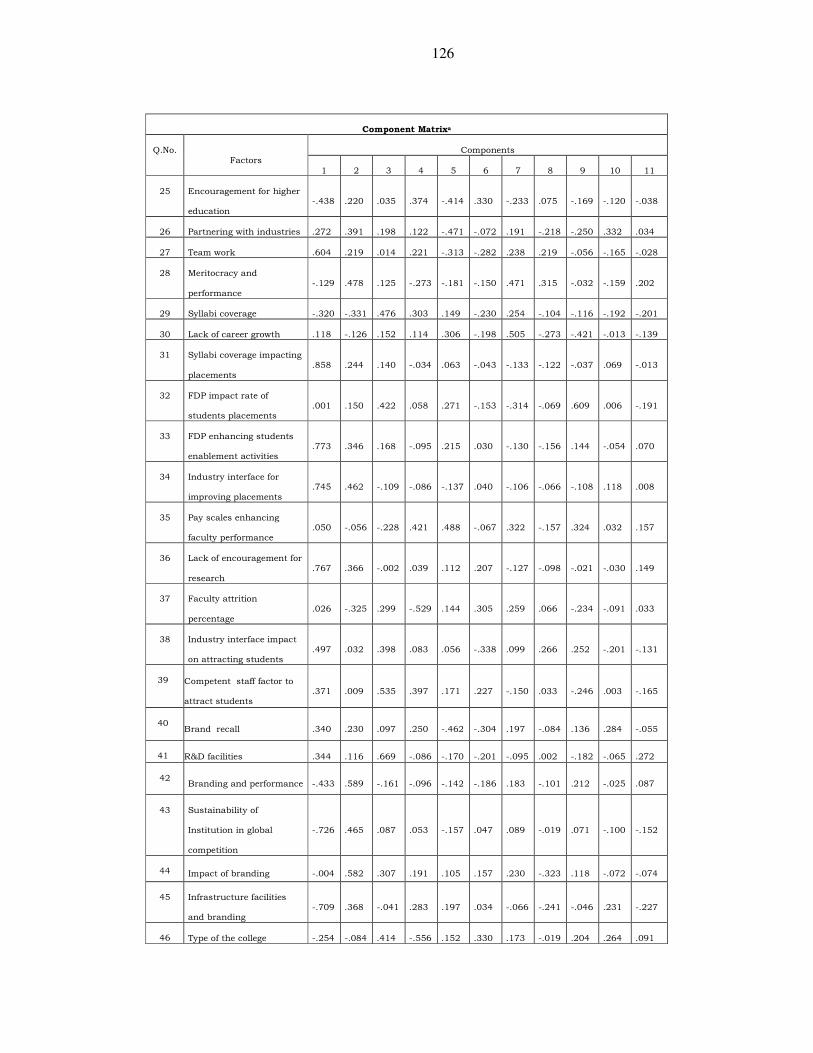
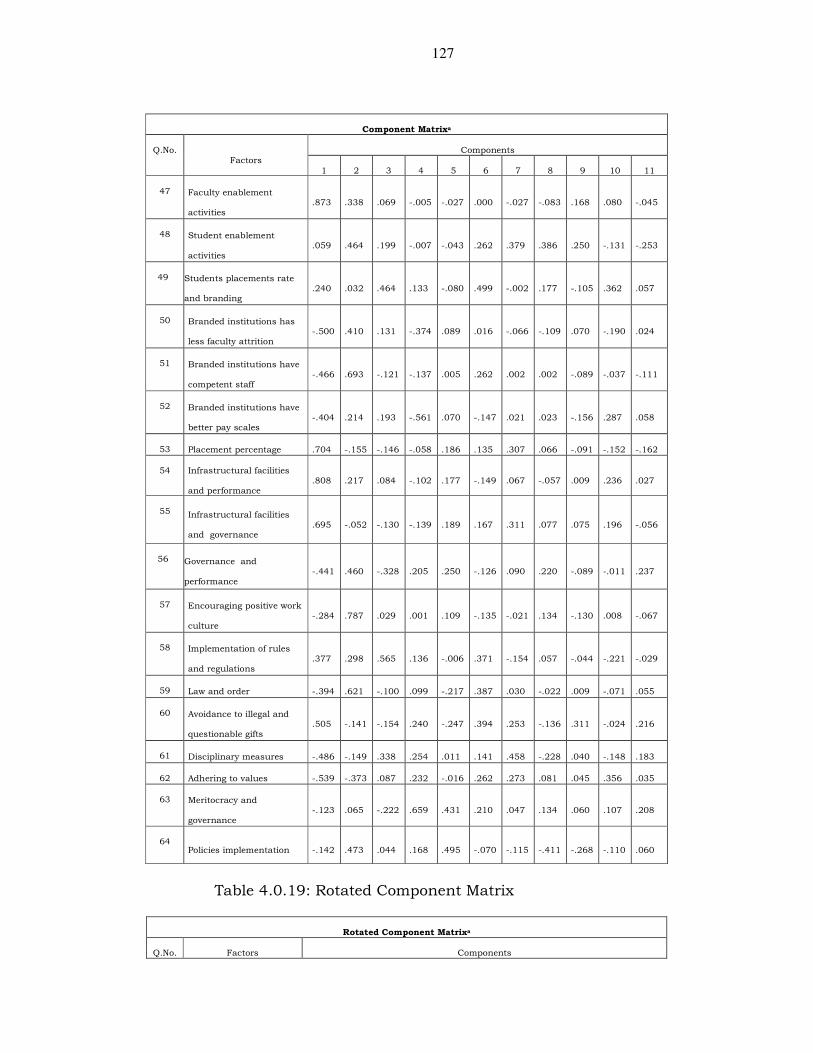
In the above table the factors were mapped to various components
based on factor loadings as part of rotated component matrix.
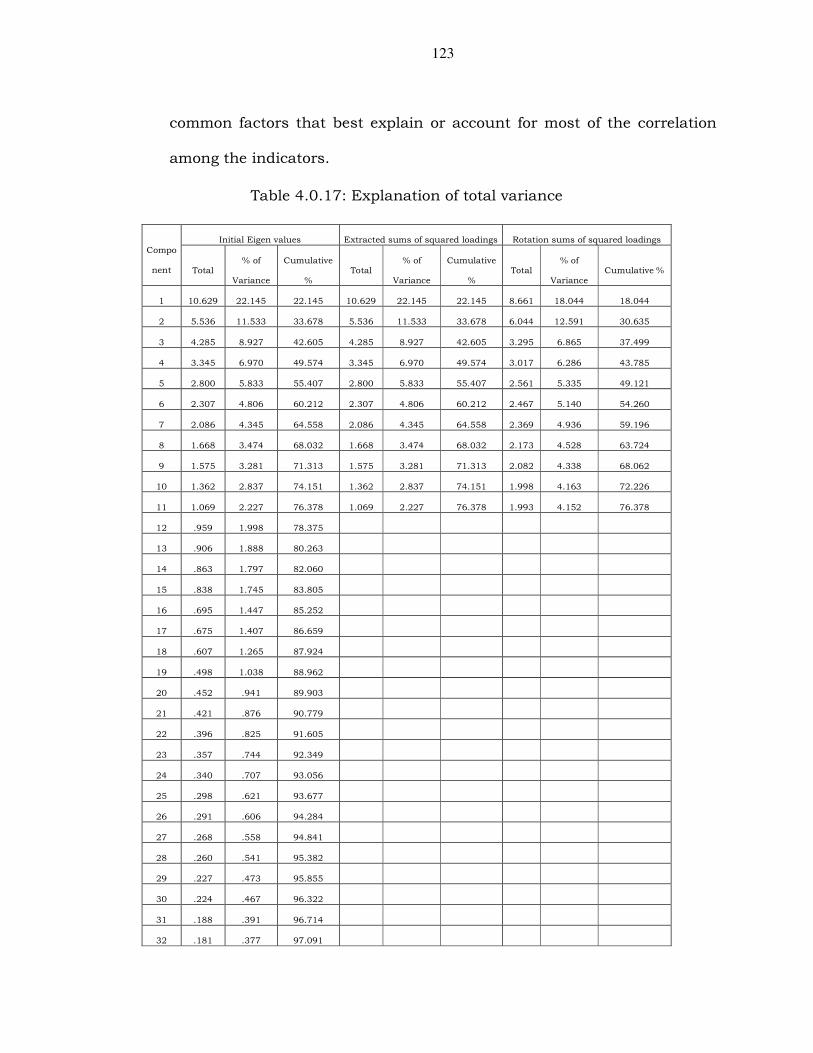
The principal component analysis is a method of factor extraction
used by SPSS software. The principal component matrix indicates the
component matrix which is rotated using the Varimax rotation technique
which further provides the rotated component matrix. Rotation of factors
helps in the better interpretation of factors. The first factor in the rotated
component matrix is observed to be heavily loaded with FDP enhancing
student’s enablement activities. With a factor loading value of 0.863
which is observed to be the highest, the first factor represents FDP
enhancing student’s enablement activities.
Since the second factor is observed to be heavily loaded with
“branded institutions having competent staff (0.852)”, the factor two
represents branded institutions having competent staff. Subsequently
other factors could be interpreted based on their respective Eigen values.
Below table enlists the final list of 11 factors which collectively accounts
for 76.37% of the variance.
131
In the below table, mapping is done for all 11 factors with factor
loadings which are mapped to question numbers in the survey
questionnaire.
Table 4.0.20: Factor loadings based on factor analysis
S.No Q.No Factor Factor loading
1 33 FDP enhancing student’s enablement activities 0.863
2 51 Branded institutions having competent staff 0.852
3 39 Competent staff is the key factor to attract students into colleges 0.760
4 46 Type of the college and branding 0.854
5 35 Pay scales is the key factor to enhance the performance of faculty 0.787
6 26 Partnering with industries and performance of faculty 0.746
7 32 Impact of faculty development programs on students placements 0.874
8 30 Impact of lack of career growth on faculty attrition 0.814
9 48 Branding and students enablement activities 0.730
10 24 Impact of PMS on performance of faculty members 0.683
11 20 Impact of management style on meritocracy practices 0.783
4.9 Chi-Square Analysis
Chi-Square Analysis: Researcher observed that the chi-square is
most relevant and appropriate in analyzing categorical variables in this
specific case. The chi-square test is a statistical test used to examine
differences with categorical variables. It is relevant here for estimating
how closely an observed distribution matches an expected distribution. It
is also useful here for estimating whether two random variables are
independent or not. Assessments of significance levels were done correctly
with the help of chi-square tests in this specific case. In order to avoid
assumptions, non-parametric tests like chi square tests are implemented
here.
Chi square test is important here to test significant levels among
categorical variables. As a non parametric test to determine among
categorical data to show dependency or the two classifications are
132
independent, the chi square test is very useful here. To test the
significance of association between two attributes among demographic
variables and LIKERT scale variable or testing variable, chi square test is
most appropriate.
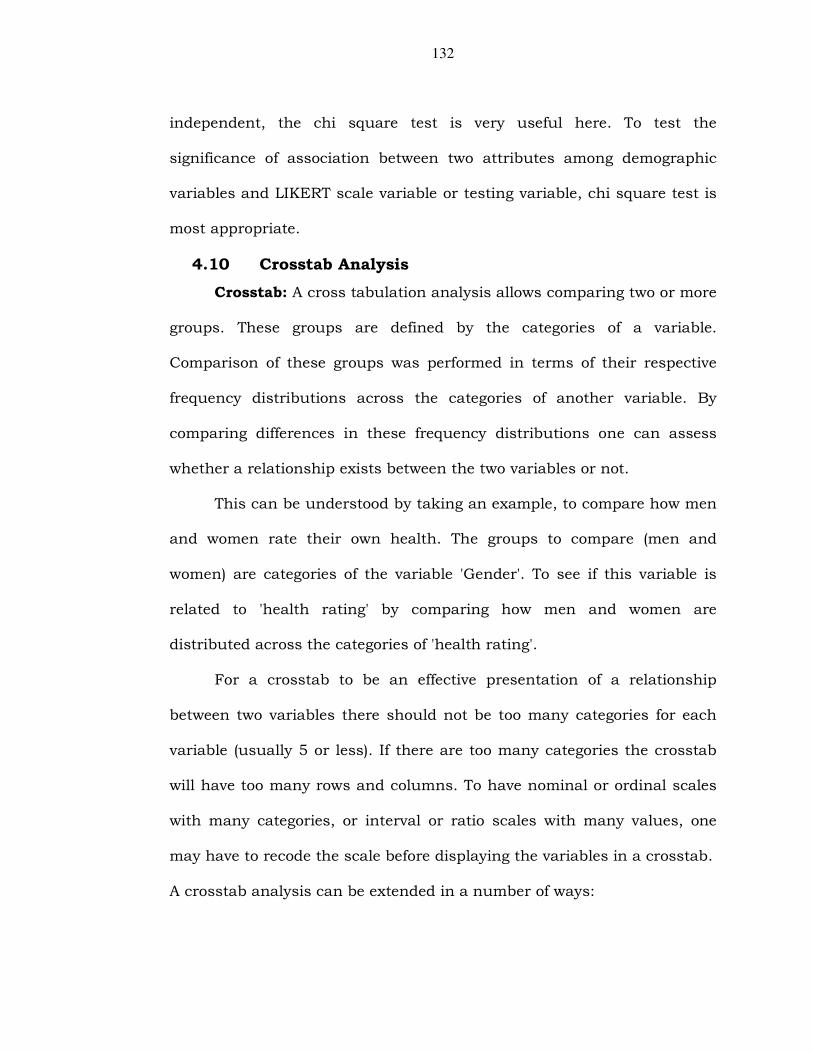
4.10 Crosstab Analysis
Crosstab: A cross tabulation analysis allows comparing two or more
groups. These groups are defined by the categories of a variable.
Comparison of these groups was performed in terms of their respective
frequency distributions across the categories of another variable. By
comparing differences in these frequency distributions one can assess
whether a relationship exists between the two variables or not.
This can be understood by taking an example, to compare how men
and women rate their own health. The groups to compare (men and
women) are categories of the variable 'Gender'. To see if this variable is
related to 'health rating' by comparing how men and women are
distributed across the categories of 'health rating'.
For a crosstab to be an effective presentation of a relationship
between two variables there should not be too many categories for each
variable (usually 5 or less). If there are too many categories the crosstab
will have too many rows and columns. To have nominal or ordinal scales
with many categories, or interval or ratio scales with many values, one
may have to recode the scale before displaying the variables in a crosstab.
A crosstab analysis can be extended in a number of ways:
133
1. A relationship between two variables displayed in a crosstab can be
expressed quantitatively through the calculation of measures of
association.
2. One can conduct a chi-square test of significance to assess whether a
relationship displayed by sample data in a crosstab came about by chance
when sampling from populations where the two variables are actually
independent (i.e. not related).
Based on the collected data from all filled in questionnaires, overall
factors were tabulated and factor analysis was done and subsequently all
the key factors were tested with crosstab analysis followed by chi-square
analysis for testing or validation of all hypotheses as described below.
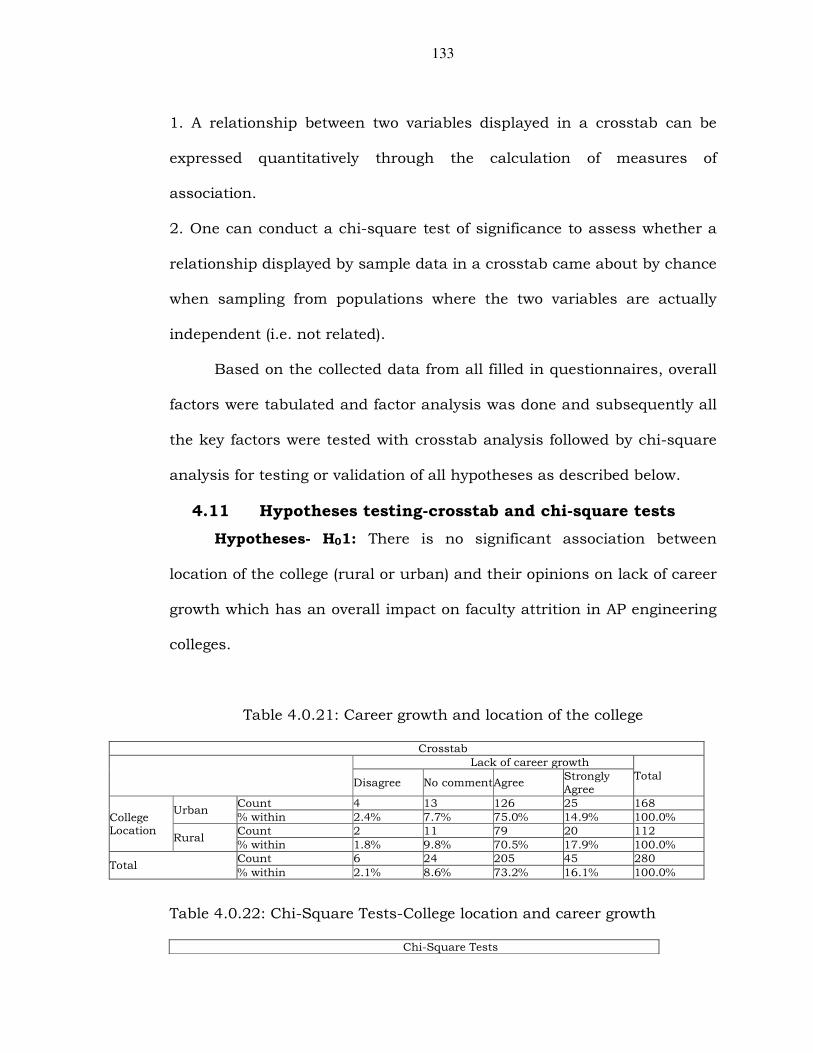
4.11 Hypotheses testing-crosstab and chi-square tests
Hypotheses- H01: There is no significant association between
location of the college (rural or urban) and their opinions on lack of career
growth which has an overall impact on faculty attrition in AP engineering
colleges.
Table 4.0.21: Career growth and location of the college
Crosstab
Lack of career growth
Total Disagree No comment Agree
Strongly Agree
College Location
Urban Count 4 13 126 25 168
% within 2.4% 7.7% 75.0% 14.9% 100.0%
Rural Count 2 11 79 20 112
% within 1.8% 9.8% 70.5% 17.9% 100.0%
Total Count 6 24 205 45 280
% within 2.1% 8.6% 73.2% 16.1% 100.0%
Table 4.0.22: Chi-Square Tests-College location and career growth
Chi-Square Tests
134
Value Df Asymp. Sig. (2-sided)
Pearson Chi-Square 1.005a 3 0.800
Likelihood Ratio 0.999 3 0.801
Linear-by-Linear Association 0.088 1 0.767
N of Valid Cases 280
2 cells (25.0%) have expected count less than 5. The minimum expected count is 2.40
From the above table, since the chi-square value is not significant
as the significant value is greater than 0.05, there is no evidence to reject
null hypotheses. Also it means there is no significant association between
location of the college (rural or urban) and their opinion on lack of career
growth which has an overall impact on faculty attrition in AP engineering
colleges.
The inference from the above chi square test reveals that career
growth opportunities is independent of the location of the college situated
in urban or rural areas. However, a career growth plan has a significant
impact on attrition of faculty members in AP engineering colleges. The
implementation of career growth plan is purely at the discretion of
leadership team or management team in the areas of rural or urban in AP
engineering colleges.
Hypotheses- H02: There is no significant correlation between
location of the college (rural or urban) and their opinions on performance
management system which has significant impact on performance of
faculty members in AP engineering colleges.
Table 4.0.23: College location and PMS
Crosstab
Impact of PMS on faculty
Total Disagree No comment Agree Strongly Agree
College Location
Urban Count 3 19 122 24 168
% within 1.8% 11.3% 72.6% 14.3% 100.0%
Rural Count 2 18 76 16 112
% within 1.8% 16.1% 67.9% 14.3% 100.0%
Total Count 5 37 198 40 280
135
% within 1.8% 13.2% 70.7% 14.3% 100.0%
Table 4.0.24: Chi-Square Tests-Impact of PMS on faculty
Chi-Square Tests
Value df Asymp. Sig. (2-sided)
Pearson Chi-Square 1.369a 3 0.713
Likelihood Ratio 1.348 3 0.718
Linear-by-Linear Association 0.439 1 0.508
N of Valid Cases 280
2 cells (25.0%) have expected count less than 5. The minimum expected count is 2.00
From the above table, since the chi-square value is not significant as
the significant value is greater than 0.05, there is no evidence to reject
null hypotheses. It means that there is no significant correlation between
location of college (rural or urban) and their opinions on performance
management system which has significant impact on performance of
faculty members in AP engineering colleges.
The inference from the above chi square test reveals that the
performance management system (PMS) is independent of the location of
the college situated in urban or rural areas. However, the PMS has a
significant impact on performance of faculty members in AP engineering
colleges. The implementation of PMS is the discretion of leadership team
or management team in the areas of rural or urban.
Hypotheses- H03: There is no significant association between
location of the college (rural or urban) and their opinions on partnering
with industries which is one of the key factors to influence the
performance of faculty members in AP engineering colleges.
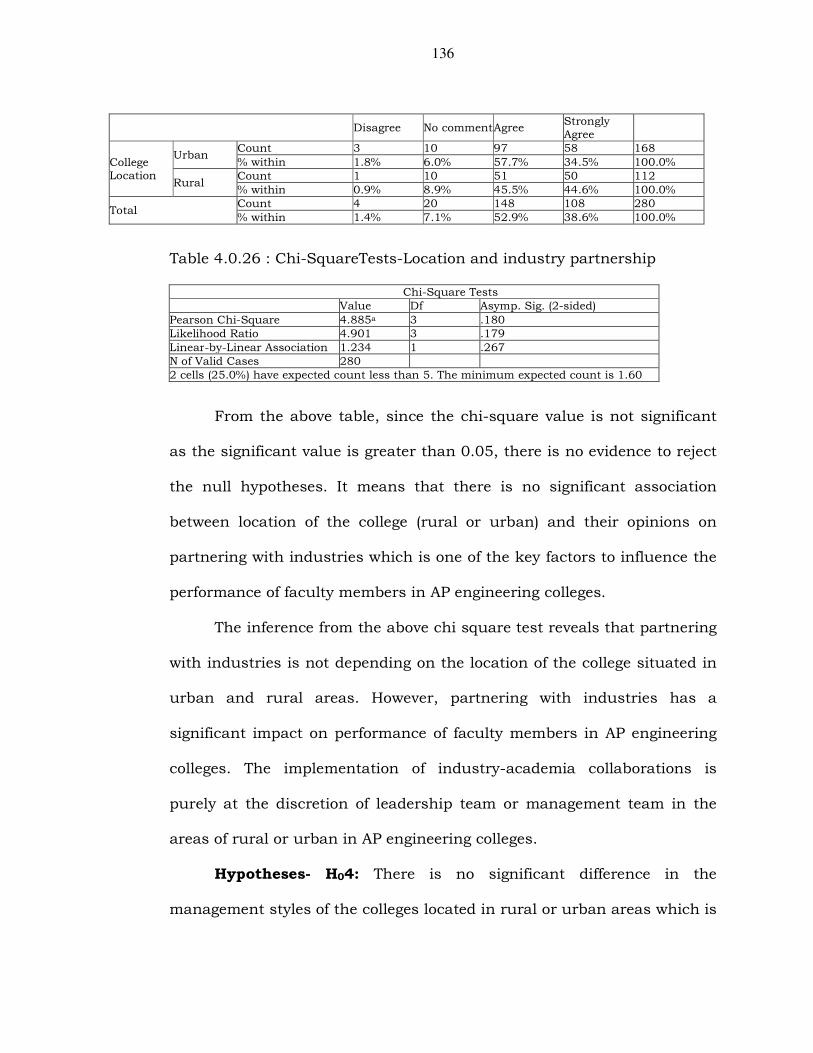
Table 4.0.25: College location and industry partnership
Crosstab
Partnering with industries Total
136
Disagree No comment Agree Strongly Agree
College Location
Urban Count 3 10 97 58 168
% within 1.8% 6.0% 57.7% 34.5% 100.0%
Rural Count 1 10 51 50 112
% within 0.9% 8.9% 45.5% 44.6% 100.0%
Total Count 4 20 148 108 280
% within 1.4% 7.1% 52.9% 38.6% 100.0%
Table 4.0.26 : Chi-SquareTests-Location and industry partnership
Chi-Square Tests
Value Df Asymp. Sig. (2-sided)
Pearson Chi-Square 4.885a 3 .180
Likelihood Ratio 4.901 3 .179
Linear-by-Linear Association 1.234 1 .267
N of Valid Cases 280
2 cells (25.0%) have expected count less than 5. The minimum expected count is 1.60
From the above table, since the chi-square value is not significant
as the significant value is greater than 0.05, there is no evidence to reject
the null hypotheses. It means that there is no significant association
between location of the college (rural or urban) and their opinions on
partnering with industries which is one of the key factors to influence the
performance of faculty members in AP engineering colleges.
The inference from the above chi square test reveals that partnering
with industries is not depending on the location of the college situated in
urban and rural areas. However, partnering with industries has a
significant impact on performance of faculty members in AP engineering
colleges. The implementation of industry-academia collaborations is
purely at the discretion of leadership team or management team in the
areas of rural or urban in AP engineering colleges.
Hypotheses- H04: There is no significant difference in the
management styles of the colleges located in rural or urban areas which is
137
one of the key factors that influences the meritocracy practices in AP
engineering colleges.
Table 4.0.27: College location and management style
Crosstab
Management style
Total Strongly Disagree Disagree No comment Agree Strongly Agree
College Location
Urban Count 0 2 32 118 16 168
% within 0.0% 1.2% 19.0% 70.2% 9.5% 100.0%
Rural Count 1 0 6 84 21 112
% within 0.9% 0.0% 5.4% 75.0% 18.8% 100.0%
Total Count 1 2 38 202 37 280
% within 0.4% 0.7% 13.6% 72.1% 13.2% 100.0%
Table 4.0.28: Chi-Square Tests- College location and management style
Chi-Square Tests
Value Df Asymp. Sig. (2-sided)
Pearson Chi-Square 16.654a 4 0.002
Likelihood Ratio 18.842 4 0.001
Linear-by-Linear Association 10.452 1 0.001
N of Valid Cases 280
4 cells (40.0%) have expected count less than 5. The minimum expected count is 0.40
From the above table chi square is significant (significant value is
less than 0.05), hence rejecting null hypotheses. It means that there is a
significant difference in the management styles of the colleges located in
different areas (rural or urban) which is one of the key factors that
influences the meritocracy practices in AP engineering colleges.
The inference from the above chi square test reveals that the
meritocracy practices that are followed in urban and rural areas are
different. This is one of the outcomes of the management styles that are
observed in AP engineering colleges. However, the factor analysis is
indicating that management styles are significantly impacting meritocracy
practices.
138
Hypotheses-H05: There is no significant association between
location of the college (rural or urban) and their opinions on pay scale
which is the key factor responsible for faculty performance in AP
engineering colleges.
Table 4.0.29: College location and pay scales
Table 4.0.30: Chi-Square Tests-College location and pay scales
Chi-Square Tests
Value Df Asymp. Sig. (2-sided)
Pearson Chi-Square 23.055a 4 .000
Likelihood Ratio 30.112 4 .000
Linear-by-Linear Association 17.596 1 .000
N of Valid Cases 280
3 cells (30.0%) have expected count less than 5. The minimum expected count is .40
From the above table chi-square is significant (significance value is
less than 0.05), hence rejecting null hypotheses. It means that there is a
significant association between location of the college (rural or urban) and
their opinions on pay scale which is the key factor responsible for faculty
performance in AP engineering colleges.
The inference from the above chi square test reveals that the
implementation of relevant or appropriate pay scales in urban and rural
areas is different. This is one of the key factors responsible for
performance of faculty members in AP engineering colleges.
Crosstab
Pay scales
Total Strongly Disagree
Disagree No Comment
Agree Strongly Agree
College Location
Urban Count 0 19 8 111 30 168
% within 0.0% 11.3% 4.8% 66.1% 17.9% 100.0%
Rural Count 1 0 2 71 38 112
% within 0.9% 0.0% 1.8% 63.4% 33.9% 100.0%
Total Count 1 19 10 182 68 280
% within 0.4% 6.8% 3.6% 65.0% 24.3% 100.0%
139
Hypotheses- H06: There is no significant correlation between
location of the college (rural or urban) and their opinions on having
competent staff which is the key factor to attract meritorious students in
AP engineering colleges.
Table 4.0.31: College location and presence of competent staff
Table 4.0.32: Chi-Square- Presence of competent staff
Chi-Square Tests
Value df Asymp. Sig. (2-sided)
Pearson Chi-Square 14.681a 3 0.002
Likelihood Ratio 17.000 3 0.001
Linear-by-Linear Association 1.227 1 0.268
N of Valid Cases 280
a. 2 cells (25.0%) have expected count less than 5. The minimum expected count is .80
From the above table, since the chi-square value is significant as
the significant value is lesser than 0.05 there is a need to reject null
hypotheses. It means that there is a significant correlation between
location of the college (rural or urban) and their opinions on having
competent staff which is the key factor to attract meritorious students in
AP engineering colleges.
The inference from the above chi square test reveals that competent
staff would attract meritorious students into AP engineering colleges
irrespective of the location of the colleges situated in urban or rural areas.
Crosstab
Competent staff is the key factor to attract students
Total Disagree
No Comment
Agree Strongly Agree
College Location
Urban Count 0 13 96 59 168
% within 0.0% 7.7% 57.1% 35.1% 100.0%
Rural Count 2 1 82 27 112
% within 1.8% 0.9% 73.2% 24.1% 100.0%
Total Count 2 14 178 86 280
% within 0.7% 5.0% 63.6% 30.7% 100.0%
140
Hypotheses-H07: There is no significant difference between type of
the college (private or government) and their opinions on partnering with
industries, which is one of the key factors to influence the performance of
faculty members in AP engineering colleges.
Table 4.0.33: College type and industry partnerships
Crosstab
Partnering with industries
Total Disagree
No comment
Agree Strongly Agree
College type
Private Count 3 9 113 81 206
% within 1.5% 4.4% 54.9% 39.3% 100.0%
Govt. Count 1 11 35 27 74
% within 1.4% 14.9% 47.3% 36.5% 100.0%
Total Count 4 20 148 108 280
% within 1.4% 7.1% 52.9% 38.6% 100.0%
Table 4.0.34: Chi-Square-College type and industry partnerships
Chi-Square Tests
Value Df Asymp. Sig. (2-sided)
Pearson Chi-Square 9.103a 3 0.028
Likelihood Ratio 7.996 3 0.046
Linear-by-Linear Association 2.158 1 0.142
N of Valid Cases 280
2 cells (25.0%) have expected count less than 5. The minimum expected count is 1.06
From the above table chi-square is significant (significant value is
less than 0.05), hence rejecting null hypotheses. It means that there is a
significant difference between type of the college (private or government)
and their opinions on partnering with industries which is one of the key
factors to influence the performance of faculty members in AP engineering
colleges.
The inference from the above chi square test reveals that the ability
to partner with industries is different in private and government
141
engineering colleges in AP. However, partnering with industries is
significantly impacting the performance of the faculty members.
Hypotheses- H08: There is no significant difference between type of
the college (private or government) and their opinions on lack of career
growth which has an overall impact on faculty attrition in AP engineering
colleges.
Table 4.0.35: College type and career growth
Table 4.0.36: Chi-Square-College type and career growth Chi-Square Tests
Value df Asymp. Sig. (2-sided)
Pearson Chi-Square 17.722a 3 0.001
Likelihood Ratio 15.423 3 0.001
Linear-by-Linear Association 4.862 1 0.027
N of Valid Cases 280
2 cells (25.0%) have expected count less than 5. The minimum expected count is 1.59
From the above table chi-square is significant (sig. value is less
than 0.05), hence rejecting null hypotheses. It means that there is a
significant difference between type of the college (private or government)
and their opinions on lack of career growth which has an overall impact
on faculty attrition in AP engineering colleges.
The inference from the above chi square test reveals that the career
growth options are different in private and government engineering
Crosstab
Lack of career growth
Total Disagree
No comment
Agree Strongly Agree
College type
Private Count 5 9 157 35 206
% within 2.4% 4.4% 76.2% 17.0% 100.0%
Govt. Count 1 15 48 10 74
% within 1.4% 20.3% 64.9% 13.5% 100.0%
Total Count 6 24 205 45 280
% within 2.1% 8.6% 73.2% 16.1% 100.0%
142
colleges in AP. However, career growth opportunities are significantly
impacting the attrition of faculty members.
Hypotheses- H09: There is no significant difference between type of
the college (private or government) and their opinions on pay scale which
is the key factor responsible for faculty performance in AP engineering
colleges.
Table4.0.37: College type and pay scales
Table 4.0.38: Chi-Square- College type and pay scales Chi-Square Tests
Value df Asymp. Sig. (2-sided)
Pearson Chi-Square 60.725a 4 .000
Likelihood Ratio 54.899 4 .000
Linear-by-Linear Association 27.521 1 .000
N of Valid Cases 280
3 cells (30.0%) have expected count less than 5. The minimum expected count is .26
From the above table chi-square is significant (significant value is
less than 0.05), hence rejecting null hypotheses. It means that there is a
significant difference between type of the college (private or government)
and their opinions on pay scale which is the key factor responsible for
faculty performance in AP engineering colleges.
The inference from the above chi square test reveals that the pay
scale structure is different in private and government engineering colleges
Crosstab
Pay scales
Total Strongly Disagree
Disagree No Comment
Agree Strongly Agree
College type
Private Count 0 2 3 152 49 206
% within 0.0% 1.0% 1.5% 73.8% 23.8% 100.0%
Govt. Count 1 17 7 30 19 74
% within 1.4% 23.0% 9.5% 40.5% 25.7% 100.0%
Total Count 1 19 10 182 68 280
% within 0.4% 6.8% 3.6% 65.0% 24.3% 100.0%
143
in AP. However, pay scales are significantly impacting the performance of
faculty members.
Hypotheses-H010: There is no significant difference between type of
the college (private or government) and their opinions on having
competent staff which is the key factor to attract meritorious students in
AP engineering colleges.
Table 4.0.39: College type and competent staff
Table 4.0.40: Chi-Square- College type and competent staff Chi-Square Tests
Value Df Asymp. Sig. (2-sided)
Pearson Chi-Square 6.883a 3 0.076
Likelihood Ratio 7.164 3 0.067
Linear-by-Linear Association 1.416 1 0.234
N of Valid Cases 280
3 cells (37.5%) have expected count less than 5. The minimum expected count is .53.
From the above table, since the chi-square value is not significant
as the significant value is greater than 0.05, hence there is no evidence to
reject null hypotheses. Also it means there is no significant difference
between type of the college (private or government) and their opinions on
having competent staff which is the key factor to attract meritorious
students in AP engineering colleges.
Crosstab
Competent staff to attract students
Total Disagree
No comment
Agree Strongly Agree
College type
Private Count 2 8 139 57 206
% within 1.0% 3.9% 67.5% 27.7% 100.0%
Govt. Count 0 6 39 29 74
% within 0.0% 8.1% 52.7% 39.2% 100.0%
Total Count 2 14 178 86 280
% within 0.7% 5.0% 63.6% 30.7% 100.0%
144
The inference from the above chi square test reveals that
“competent staff” would attract meritorious students is not depending on
whether the college belongs to private or government in AP. However,
having competent staff has a significant impact in attracting meritorious
students in AP engineering colleges. Recruiting competent staff is purely
at the discretion of leadership team or management team in private or
government engineering colleges in AP.
Hypotheses- H011: There is no significant association between
type of college (private or government) and their opinions on brand image
of AP engineering colleges.
Table 4.0.41: College type and branding of the college
Crosstab
Age of the college
Total Strongly Disagree
Disagree No Comment
Agree Strongly Agree
College type
Private Count 0 58 5 124 19 206
% within 0.0% 28.2% 2.4% 60.2% 9.2% 100.0%
Govt. Count 1 7 3 43 20 74
% within 1.4% 9.5% 4.1% 58.1% 27.0% 100.0%
Total Count 1 65 8 167 39 280
% within 0.4% 23.2% 2.9% 59.6% 13.9% 100.0%
Table 4.0.42: Chi-Square- College type and branding of the college
Chi-Square Tests
Value df Asymp. Sig. (2-sided)
Pearson Chi-Square 23.915a 4 .000
Likelihood Ratio 23.838 4 .000
Linear-by-Linear Association 13.355 1 .000
N of Valid Cases 280
3 cells (30.0%) have expected count less than 5. The minimum expected count is .26
From the above table, since the chi-square value is significant as the
significant value is lesser than 0.05, hence rejecting null hypotheses. Also
it means there is a significant association between type of the college
145
(private or government) and their opinion on brand image of AP
engineering colleges.
The inference from the above chi square test reveals that the brand
image of the college is viewed differently in private and government
engineering colleges in AP. However, college leadership team is playing a
significant role in terms of creating a brand image.
Based on survey analysis, all the data points were analyzed with
crosstab and chi-square to test the hypotheses. Based on data analysis
and interpretation the research findings were classified in to four sub
sections as given below,
1) Impact of change management on work culture
2) Impact of strategic leadership on faculty attrition
3) Impact of branding on performance
4) Impact of governance on efficiency
The research findings were presented in the next chapter “Conclusions”
4.12 Impact of Change Management on Work Culture
In this section, an attempt has been made to examine some
conceptual aspects of change management processes and work culture
and related subject areas. It is important to look at the factors that are
promoting work culture in AP engineering colleges, the academic change
management processes and the consequences of the same.
The aim is to present the data points as a curtain raiser for the
subsequent sections involving the analysis of the collected data on
leadership in technical institutions and a study on strategy and academic
146
change management. The main objective of this chapter is to study the
prevailing leadership and academic change management processes in
engineering colleges in the state of AP. Also to measure the impact of
academic change management processes on work culture in AP
engineering colleges. The aim is to present the data points as a curtain
raiser for the subsequent chapters involving the analysis of the collected
data on leadership in technical institutions and a study on strategy and
academic change management.
The impact of change management processes on work culture is
found from available data including statistical analysis and data
interpretation. The present status in AP engineering colleges is
summarized at the end of this chapter. Many engineering colleges in AP
are yet to be convinced of the benefits from strategic leadership, change
management, positive work culture within the education industry.
Some of the employees in engineering colleges in AP are of the opinions
that change management processes and systems demands massive
training costs and additional effort. This misconception among the
employees has to be corrected and need to be dealt with the help of
technology and structured tools. New employees are to be given
appropriate training on the conceptual aspects, correct tools and
techniques, which leads to the successful implementation of change
management processes and systems.
Change management in AP engineering colleges involves the
process, tools and techniques used to manage the relevant and required
147
change to achieve the required academic outcome or business benefits to
all stakeholders. It includes technology change management and people
change management.
Change management processes in AP engineering colleges are a
structured approach to transitioning individuals, teams, and colleges from
a current state to a desired future state. It is an organizational process
aimed at empowering faculty and staff to accept and embrace changes189
in their current business environment. In project management, change
management refers to a project management process where changes to a
project are formally introduced and approved.
AP engineering college’s vision needs ‘to be a globally respected
institution’. Colleges need to strive every day by implementing relevant
change management techniques to earn respect from students, faculty,
competitors, society, and industry partners. This is compelling, different,
thought provoking and unique to each college. If a college acts to earn
respect from these stakeholders, they will achieve better results.
Excellence in client service needs to be a hallmark of each AP
engineering college since inception. ‘Stakeholder delight’ will now be
‘stakeholder value’ to reflect two ideas. ‘Stakeholder delight’ is often
misinterpreted as targeted to pleasing faculty and students. The objective
of AP engineering colleges needs to be long standing, trusted advisory
189 Siehl C (1992),” Cultural Leadership and change management in Technical Institutions”, International Journal of Service Industry Management, Vol.3, No.2, PP 17-22.
148
relationships with stakeholders. Faculty and students are people with
whom there is a need to have a long term professional relationship and
responsibility.
There is no doubt that academic leadership is the most important
factor in building excellent work culture but the question is, what kind of
leadership model is effective in building excellent190 work culture that can
be practiced continuously? In this context, the characteristics of leaders
like the ones, Kouzes and Posner (2007)191 have found, i.e. honesty,
visionary, competence and inspirational, should be practiced by anyone
who holds the title of a leader. Remember, anyone can become a leader as
long as he or she has the ability to guide, motivate and give help to
subordinates. These characteristics are important because they will make
leaders who are respected by their subordinates. Academic change
management aims to implement different structures, systems and skills in
an operating college as below:
• It is necessary to ensure the effectiveness192 of the desired changes.
• It ensures no undesired side effects of the changes are introduced into
an engineering college. Provides strategies to manage the resistance to
change.
190 Swathi Duppada, 2011, Recruitment Metrics, Blending Benchmarking and Six Sigma to meet HR Recruitment Business Goals, Technology Spectrum, Journal of JNTUH, Vol. 5, No. 1, PP 13-21 191 Characteristics of leaders, Kouzes and Posner (2007), http://www.suite101.com/content/the-leadership-challenge-a46367, Accessed on 8th Dec2010 192 Aakash, 2010, Student mentoring, encouragement of questioning ability, A Relevant Online Examination System, Technology for Education (T4E'10), IIT Bombay, PP 33-36.
149
The need for change management in AP engineering colleges:
Change management brings in discipline, meritocracy, credibility, relevant
leadership, industry interface, innovation, good governance, required
performance management systems and processes. Change management
processes and systems are significant to become industry leaders and to
beat the global competition. This would surely enhance innovation and
continuous research activities. There is a need to study regarding
meritocracy practices by management team, pay scales, performance of
faculty members, students and teamwork.
Reasons for poor change management in some of the AP engineering
colleges:
• Lack of vision and mission, unable to perceive the long term benefits
and more focus on short term gains
• Lack of dedicated team for implementation and budgetary constraints
• Leadership is unable to motivate stakeholders, resistance from team
members, lack of expertise in the subject areas
• Lack of proper documentation and records, poor governance structure
• Inability to appreciate global trends by leadership teams
• Rigid and hierarchical management style
All the data points were analyzed with the help of statistical tools
and computing techniques. These data points were mapped to research
objectives and used to test, validate hypotheses. The results were
150
analyzed and conclusions are drawn. The findings of the study were
presented in the next chapter.
4.13 Strategic Leadership-Impact on Faculty Attrition
As observed in the previous section, summary of the study and
findings clearly indicate the significant role of change management
processes on enhancing positive work culture and thereby improving
overall performance of college, faculty, students and other stakeholders.
The main objective of this section is to examine the impact of
strategic leadership in AP engineering colleges in enhancing the quality
processes in various operational and managerial areas. This section would
also analyze the leadership actions and its impact on faculty attrition in
these institutions. In this section an attempt is made to provide analysis
of how AP engineering colleges would suffer because of such faculty
attrition. AP engineering colleges would benefit from the derived data
points and research analysis. The status quo of attrition at present in AP
engineering colleges is to be examined critically.
The researcher tried to examine the roles and responsibilities of
strategic leadership team and factors that are impacting faculty attrition,
crunch of faculty in AP engineering colleges. The present study also tried
to find the reasons for faculty attrition and various attempts to leadership
in retaining the faculty for a greater positive role of AP engineering
colleges to serve the society.
One of the main challenges AP engineering colleges face today is the
poor thought leadership and faculty attrition. Institutions having poor
151
academic leadership have experienced lack of team work and are suffering
from high attrition rate. AP engineering colleges need to attract
and retain highly qualified and self motivated champions who
are passionate in teaching-learning. Some of the AP
engineering colleges are unable to retain expert faculty
members due to poor administrative procedures, highly
competitive offers from other institutions, lack of mentoring
and coaching, poor research work related infrastructural lab
facilities, lack of clearly defined career path, etc. Many
engineering colleges in AP are yet to be convinced of the benefits from
strategic leadership, change management within the education industry.
Financial returns help the bottom line of any engineering college to get
engaged in continuous improvement programs which has to be measured
with reference to mentoring, career building, value addition, life skills etc.
To successfully deal with change, improve positive work culture, all
teaching and non teaching staff needs the skills and knowledge for both
strategy formulation and implementation. Managing innovation, change
and ambiguity requires strategic leaders who not only provide mentoring,
support, a sense of direction, but who can also build ownership and
alignment within their sub groups to implement change management
processes and required systems.
There is a large gap between the demand and supply of technical faculty
in AP engineering colleges. Wherever numbers are available quality
152
becomes a debatable issue with the rise of popularity of technical
education resulting in unprecedented growth of technical institutes. AP
engineering colleges are facing a serious challenge in terms of availability
of qualified and talented faculty. Under these circumstances 'retention' of
the existing good faculty assumes strategic significance, while the hunt for
the new faculty goes on.
Separation of an employee from the college for any reasons whatsoever
has its own importance from the organizational viewpoint. Happily
separated person spreads a good message or word of mouth, which would
augur well for the college in the longer run. Similarly, colleges can always
woo back their former employees, who moved out for better prospects. Post
separation, strategic HRM is as important as the normal HRM.
Talent retention is nothing but to create an environment where AP
engineering colleges buzz with energy and people have a sparkle of
anticipation when they enter their work place. Kaye Thorne and Andy
Pellant suggested certain measures for retention of people (talent) in AP
engineering colleges which are relevant to mention here:
• Be committed to respect human capital
• Encourage and develop diversity within work force
• Don't just pay lip service to talent management193 but focus on it.
• Demonstrate commitment from the top management for retention of
193 Make most of your most valuable resources, http://www.ey.com/IN/en/Issues/Talent-management, Accessed on 4th May2010
153
talent
• Demonstrate brand, values, honest and thinking environment
• Identify and recognize talent at all levels and reward accordingly
• Grant freedom to innovate, develop coaching and feedback systems
• Create an encouraging environment for the new people to join
• Create internal forums that allow for healthy debate and discussion
• Encourage flexible and imaginative patterns of employment
• Ensure a developing and learning culture, be socially responsive194
Effective tool of retention is the mentoring program for junior faculty
as part of effective campus retention program in AP engineering colleges.
Formal mentoring programs conducting exclusive workshops and other
development programs for the junior faculty would put to rest their
misgivings and apprehensions about the college and contribute to their
continued stay in the institute. Many campuses have faculty development
programs195 (FDP) to update the KSA (Knowledge, Skills and Attitudes)
base of the faculty which is also another effective faculty retention
mechanism.
One may come across an excellent faculty who could be considered
as an asset or strength to the college but who has some special needs in
terms of flexi time to teach. A highly considerate view of such needs would
go a long way in bringing about the sense of belongingness in the
194 H. Nandan, Fundamentals of Entrepreneurship, PHI, First Edition, New Delhi, 2007.
195 Faculty Development Programs, http://www.developfaculty.com/online/index.html, Accessed on 5th May2010
154
faculty concerned. Equal pay practices and non-discriminatory policies
on account of caste, creed and gender etc are equally important to retain
faculty.
Need for strategic leadership in AP engineering colleges:
• To define vision, mission and values of the college
• To study the impact on syllabi coverage due to faculty members’
attrition
• To implement change management processes
• To provide positive work culture and to mentor stake holders
• To provide relevant infrastructure and to provide internal and
external branding
• To study the impact of faculty development programs have on rate
of student’s placements
• Build trust and credibility with all stakeholders and to bring in
realistic innovations
• To guide research and development, to have a closer industry
alliances , to reduce faculty attrition
• To have a good governance and to improve students’ placements
• To promote higher education and have a well defined career
development path, to provide transformational ideas to stakeholders
through mentoring process
• To provide timely rewards and recognition to all stakeholders
155
Reasons for poor strategic leadership and high attrition of faculty in
some of the AP engineering colleges:
• Inability to understand what the strategic leadership is all about
• Focusing on “money making” and “treating educational transactions as
business transactions”
• Lack of vision, mission and basic understanding on the subject area
• Inability to spend quality time on this important aspect. Fully
engrossed in day to day transactions
• Reactive management style, lack of ownership from leadership teams
• Lack of commitment from management teams, lack of feedback
analysis, poor recruitment policies
4.14 Impact of Branding on Performance
Having done the research review of impact of branding on
performance196 of engineering colleges, an attempt is made to find some
data interpretation based on statistical analysis.
Branding is a symbol of stakeholders trust in AP engineering colleges.
In this context, various stakeholders are students, faculty members, staff,
parents, investors, industry partners and society at large. This section
starts with a glimpse into perspectives on AP engineering colleges
branding strategy197, impact of branding on performance, industry-
academia interface, etc. The main objective of this sub chapter is to
196 Government of India Ministry of HRD Report, (Department of Higher Education), Planning, Monitoring and
Statistics Bureau New Delhi -2008 197 Paul Hemp, 2005, Strategy and change management, When your strategy stalls, what will you do? HBS press, PP 101-152
156
identify the factors influencing branding and the impact on performance
of AP engineering colleges.
This research study deals with AP engineering colleges internal and
external branding and its impact on stake holder’s intrinsic motivation
and performance of the colleges. It is relevant to find the relation between
branding and performance of colleges. College brand management198 is
the application of popular marketing techniques to a specific subject area,
college, services, product line, and brand. The branding of AP engineering
colleges is found to be significantly affecting the students’ placements,
attracting talent, and intrinsic motivation of the teachers. Some of the
factors influencing branding and performance of AP engineering colleges
are:
• Effective internal and external communication
• Industry academia interface
• Success rate in terms of placements for students
• Attracting qualified staff
• Close collaboration with policy making bodies
• Academic ranking of colleges
• Visibility in terms of popularity and global acceptance
• Faculty attrition
198University staff, 50 Best Branding Ideas, How colleges and universities are successfully creating and
communicating their brands http://www.universitybusiness.com/viewarticle.aspx?articleid=1179, Accessed on 6th May2010
157
• Attracting bright and talented students199
• Funding opportunities by external agencies
Branding is all about discipline in AP engineering colleges. The
TATAs have anchored brand building in values. The root meaning of the
word discipline is “learning”. So there is a need to focus on unlearn,
relearn and learning to learn any time and all the time. “Just say what
you want to do, just do what you said, prove it and improve it”. This should
be the mantra of engineering colleges in AP to enhance their national and
international ranking or branding. Many engineering colleges in AP are yet
to be convinced of the benefits from strategic leadership, branding within
the education industry.
Project based learning, outcome based assessment, branding are
the key issues in AP engineering colleges today. Students and parents are
expecting in-house real time projects and excellent infrastructural
facilities. AP engineering college managements today are keen on external
branding and industry collaborations in terms of research based learning,
sharing best practices and implementing new teaching, learning process
and technologies. Competent and self motivated faculty members would
always expect intellectually challenging assignments, hands on creative
work and innovative outcomes, cutting edge technical work, publishing
research papers, writing books, respect, pursue higher education,
199 Usha Mahalingam, 2010, Technology based evaluation, delivery, assessment, A frame work for technology based evaluation, Technology for Education (T4E'10), IIT Bombay, PP 252-253.
158
participate in international seminars, high salaries, intellectual debates
and brainstorming with peers and students.
Popularity, ranking or branding of engineering colleges in AP is
growing exponentially, especially in the radar of students, parents,
faculty, industries, research organizations and other stakeholders. The
decisions made by the strategic leadership teams in driving the processes
and systems are more authentic, sensible and easy to measure when
compared to the results viewed by one and all.
True spirit of enhancing quality of engineering education in AP lies
in learning from each other’s strengths. Leadership teams, faculty
members, in fact all students need to be involved in the pursuit of
academic change management processes and creating positive work
culture, which in turn would go a long way in improving the branding and
rankings and overall performance of faculty and students. Internal and
external branding would enhance academic responsibilities,
accountability, and competency development in AP engineering colleges.
Outcomes based approach indirectly improves the institutions capability
and performance of AP engineering colleges.
Branding is playing a significant role in the engineering
colleges of AP. Branded institutions with lot of research activities and
good industry interface are performing better in terms of attracting
excellent faculty members and bright students. Branded institutions have
better job placements record and low faculty attrition. It is very important
159
to have sufficient budget and dedicated teams to take care of internal and
external branding all the time.
AP engineering colleges were assessed for the following parameters:
• Reputation, visibility
• Academic input, qualified staff
• Student and faculty care
• Infrastructure, R&D facilities
• Placement results, perceptual rank and factual rank
Institutional rankings and branding plays a crucial role in deciding
premier engineering colleges in AP today. Students and faculty today
expect to contribute to the industry and enhance their knowledge
delivering real time projects. This is a marked change from the past. The
expectations from senior faculty members include encouragement for
higher education, periodic rewards and recognition, and objective based
performance management system. When it comes to branding, one always
thinks of NITs, IIMs, IITs, ISB, HBS, MIT, Oxford etc, as they all are strong
in architecting the education experience, fundamentals, vision, mission,
values, long term plans. Students and faculty are always being influenced
and attracted by the institution’s brand recall.
It is right time to identify the factors influencing branding and
their impact on performance in AP engineering colleges. Based on the
observations, branded institutions with good industry interface are
performing consistently and efficiently.
160
Need for branding in AP engineering colleges: Branding attracts
best talent. It enhances support from policy making bodies and research
organizations. It helps the college to sustain for a very long time in the
field of education. It helps to raise the rate of placements. There is a need
to study the impact of industry interface on attracting the students of
rural engineering colleges of AP.
Reasons for poor branding and poor performance in some of the AP
engineering colleges:
• Leadership and management teams are assuming that investment on
branding is not a valuable proposition
• Inability to appreciate branding, unable to attract high quality team
members for proper guidance
• Lack of vision, mission and basic understanding on the subject area
• Unable to perceive the long term benefits and focusing only on short
term gains
• Lack of dedicated teams for implementation, budgetary constraints
• Inability to motivate stakeholders, resistance from team members, lack
of expertise on branding, unable to learn from other peers as part of
best practices are some of the reasons
Respondents agree to the fact that realistic and effective industry
and academic interface would result in good brand name in the
educational sector and plays a significant role in attracting students in
rural engineering colleges of AP.
161
• Respondents confirmed that the interface between industry and
academia is useful as there is a clear trend due to high rate of
conversions as part of students’ placements in rural engineering
colleges of AP. Industries visit institutions regularly to upgrade the
faculty and students about the latest trends and technologies in the
market thereby enhancing faculty awareness and making the
students ready to be placed in their respective organizations.
• Besides placements, corporate teams need to visit institutions to
train faculty on upcoming technologies which can make both the
staff qualified but also update the curriculum thereby increasing
student’s confidence levels. There are various technologies which
faculty might be interested to get their doctoral degrees or research
work done only with the help of effective industry interface.
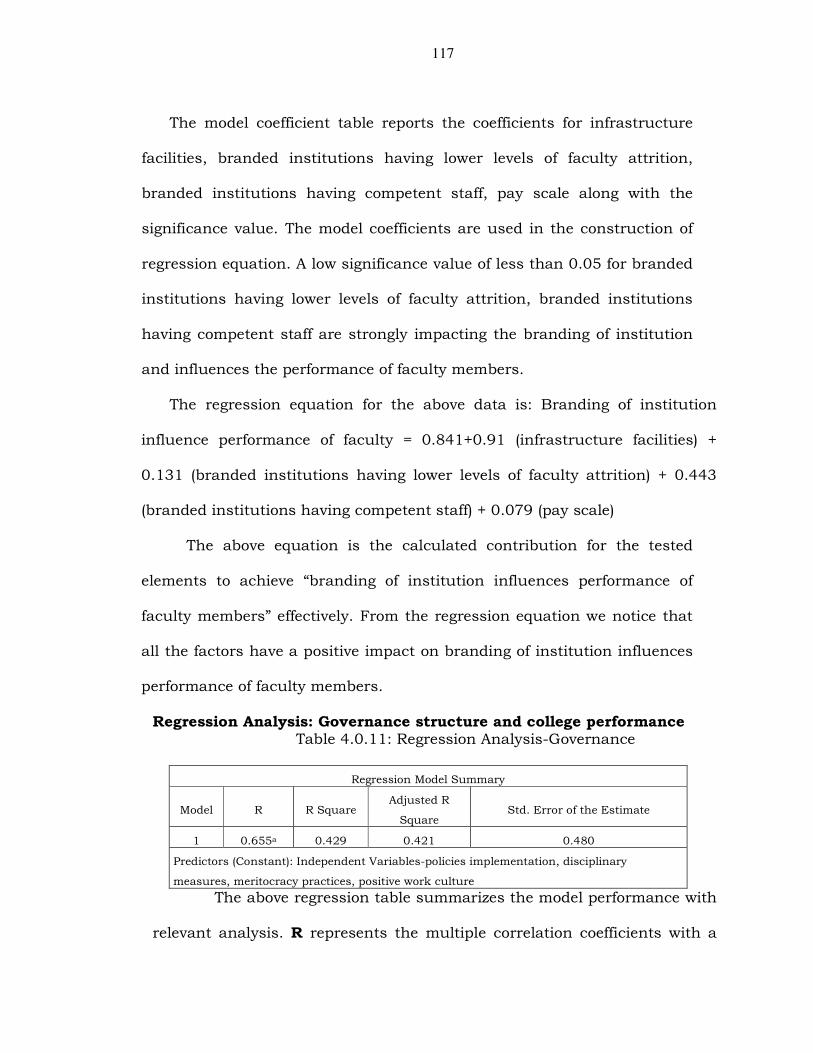
4.15 Governance and its Impact on Efficiency
An attempt has been made in this section to discuss about research
survey of governance and its impact on efficiency based on statistical
analysis and data interpretation. The main objective of this section is to
critically examine the governance patterns200 and its impact on efficiency
of AP engineering colleges. This research study deals with the engineering
college governance, efficiency and its impact on performance and survival
in global competition of technical education. Good governance in some
colleges is driven by protocols, legislation and diversity, law of the land,
200 Sukhadeo Thorat (Chairman, UGC) Higher Education In India, Emerging Issues, Related To Access,
Inclusiveness And Quality
162
rules and regulations. Some of the governing body members of AP
engineering colleges are unaware of good governance and efficiency
related to global competitive education system. Hence the proposed
research assignment was undertaken by the researcher and it is
significant to stakeholders.
A unique context-specific questionnaire on college governance and
efficiency profile is validated to diagnose the governance processes and
efficiency dimensions in higher educational institutions. The general
definition provided by Webster's Third New International Dictionary
(2006:282) is of some assistance, indicating only that governance is a
synonym for government, or "the act or process of governing, specifically
authoritative direction and control". This interpretation specifically
focuses on the effectiveness of the executive branch of governing council.
The concept of "good governance" is not new in AP engineering
colleges. However, it means different things to different stakeholders. The
actual meaning of the concept depends on the level of governance people
are talking about, the goals to be achieved and the approach being
followed and implemented
Governance is the act of governing based on set rules and well
defined regulations in AP engineering colleges. It relates to decisions that
define expectations, grant power, or verify performance. It consists of
either a separate process or part of management or leadership action
items. These processes and systems are typically administered by a
163
dedicated governance team. In the case of AP engineering colleges,
governance relates to consistent management, cohesive policies, guidance,
processes and decision-rights for a given area of responsibility. For
example, managing at a head office or corporate level might involve
evolving policies on privacy, on internal investment, and on the use of
sharable data.
Governance in AP engineering colleges refers to the means by which
institutions are formally organized and managed with transparency in all
day to day activities, though often there is a distinction between
definitions of management and governance. The concept of good
governance in a college predominantly refers to the internal structure,
organization and management of all transactions involving all related
stake holders.
Elements of governance in AP engineering colleges: Various
research teams clarify the concept of governance by identifying various
elements. These are accountability, participation, predictability, and
transparency.
Accountability and integrity in AP engineering colleges: The efforts
towards promoting accountability in college governance processes is to
build the capacity to undertake economic reforms, implement them
successfully, and provide stakeholders with an acceptable level of
services. Criteria are established to measure the performance of
authorities, and oversight mechanisms set up to make sure the standards
are met.
164
Accountability is imperative to make authorities answerable for
governance team behavior and responsive to the entity from which they
derive their authority. Accountability in AP engineering colleges also
means establishing criteria to measure the effectiveness of authorities, as
well as any deviations to ensure that the standards are met. Lack of
accountability tends in time to reduce the college credibility in society.
Economic accountability relates to the effectiveness of policy formulation
and implementation, and efficiency in resource use. Financial
accountability covers accounting systems for expenditure control, and
internal and external audits. Integrity is all about the way AP engineering
colleges managements dealing with promise management of stakeholders.
Participation by stakeholders in AP engineering colleges:
Participation refers to the involvement of stakeholders in the overall
development process in AP engineering colleges. Beneficiaries and groups
affected by the day to day actions need to participate so that the
governing process can make informed choices with respect to their needs,
and stakeholders can protect their rights. Participation is often related to
accountability and responsibility. Participation of team members
enhances improved performance and sustainability of policies, programs,
and programs, as well as enhanced capacity and skills of stakeholders.
Predictability in terms of actions: AP engineering college’s legal
environment must be conducive to overall development. Governance team
must be able to regulate itself via laws, regulations and policies, which
encompass well-defined rights and duties, mechanisms for their
165
enforcement, and impartial settlement of disputes. Predictability is about
the fair and consistent application of these laws and implementation of
governance policies.
Predictability of AP engineering colleges refers to (i) the existence of
laws, regulations, and policies to regulate college; and (ii) their fair and
consistent application. The rule of law encompasses well defined rights
and duties, as well as mechanisms for enforcing them, and settling
disputes in an impartial manner. It requires the central team and its sub
teams to be as much bound by, and answerable to, the legal system as
are private individuals and institution.
Transparency and fairness in AP engineering colleges:
Transparency refers to the availability of information to the stakeholders
and clarity about governing rules, regulations, and decisions. It can be
strengthened through the stakeholder’s right to information with a degree
of legal enforceability. Transparency in governance team’s decision
making and public policy implementation reduces uncertainty and can
help inhibit corruption among AP engineering college authorities.
Need for governance in AP engineering colleges: To maintain
process manuals, records, to implement rules and regulations, to have
better performance management system. To implement ethical practices,
to uphold value systems in a college. To have relevant infrastructure and
to obey law of the land. There is a need to study the impact of
infrastructural facilities on the performance of the faculty members in
urban engineering colleges of AP.
166
Reasons for poor governance and low efficiency in some of the AP
engineering colleges:
• Inability to implement academic and administrative policies, rules and
regulations
• Not able to adhere to management principles and practices
• Frequent changes in top level management and lack of single point of
contact for a long time
• Lack of vision, mission and poor value system of leadership and
management teams
• Inability to perceive the long term benefits. Focusing on short term
gains, lack of dedicated team for implementation, budgetary
constraints, leadership is unable to motivate stakeholders
• Rigid and hierarchical management style
• Inability to appreciate the team effort on this important aspect
• Closed minds and inability to implement suggestions from