4.1. Introduction The present research work is the study on the ‘Attitudes & Perceptions of the two wheeler owners towards Customer Relationship Management and post sales maintenance with Special Reference to Two Wheeler Industry’. The collected data has been tabulated in both the forms like Simple Tabulation with one variable and Cross Tabulation having two variables. The tabulated data has been analysed by using SPSS 17.0 consisting of the following statistical techniques: Univariate Analysis – It has involved only one variable for analysis and the methods related to this analysis include Simple Percentage Method, Chi-Square test. Bivariate Analysis – It has involved only two variables and the methods related to this analysis include Pearson Correlation and Chi-Square test of two variables. Multivariate Analysis – It has involved more than two variables at a time. It has explained the associations among more than two variables simultaneously. The methods include Factor Analysis. Chapter - 4. Data Analysis & Interpretation
Transcript
4.1. Introduction
The present research work is the study on the ‘Attitudes & Perceptions of the two wheeler
owners towards Customer Relationship Management and post sales maintenance with Special
Reference to Two Wheeler Industry’. The collected data has been tabulated in both the forms
like Simple Tabulation with one variable and Cross Tabulation having two variables.
The tabulated data has been analysed by using SPSS 17.0 consisting of the following statistical
techniques:
� Univariate Analysis – It has involved only one variable for analysis and the methods
related to this analysis include Simple Percentage Method, Chi-Square test.
� Bivariate Analysis – It has involved only two variables and the methods related to this
analysis include Pearson Correlation and Chi-Square test of two variables.
� Multivariate Analysis – It has involved more than two variables at a time. It has
explained the associations among more than two variables simultaneously. The methods
include Factor Analysis.
Chapter - 4.
Data Analysis & Interpretation
4.2: Analysis – Tables & Graphs
The following table is presented to show the list of major Two-wheeler companies in India
Table 4.1: List of major Two-wheeler companies in India.
Sr.No Company Name 1 Honda Motorcycle & Scooter India Pvt Limited 2 Bajaj Auto Limited 3 Harley Davidson India 4 Yamaha 5 Suzuki Motorcycle India Private Ltd 6 Hero Moto Corp Ltd 7 BMW 8 Ducati 9 Royal Enfield 10 Hyosung 11 T V S Motor Company 12 Kawasaki 13 Mahindra Two wheelers Ltd 14 KTM
Source: Compiled from the questionnaire
Inference: Table 4.1 shows that there are 14 two wheeler companies within India whose dealers
have been surveyed.
The following table is presented to understand the distribution of the respondents
according to their age
Table 4.2: List of Two wheeler dealers and number of authorised service centers in Mumbai.
Sr.No Company Name No of Dealers in Mumbai
No of Authorised Service Centers
1 Honda Motorcycle & Scooter India Pvt Limited 7 9
2 Bajaj Auto Ltd 7 6 3 Harley Davidson India 1 1 4 India Yamaha Motor Pvt Ltd 26 26 5 Suzuki Motorcycle India Pvt Ltd 8 3 6 Hero Moto Corp Ltd 5 12 7 BMW India 1 1 8 Ducati 3 2 9 Royal Enfield 4 12 10 Hyosung 1 1 11 T V S Motor Company 7 2 12 Kawasaki 6 6 13 Mahindra Two wheelers Ltd 2 2 14 KTM 3 2
Source: Compiled from the questionnaire
Inference: Table 4.2 shows the list of 14 two wheeler companies along with the number of
dealers and authorised service centers it has in Mumbai.
The following table is presented to understand which Two-wheeler company offers free toll
number service.
Table 4.3: List of Two Wheeler Company offering Toll free number service.
Source: Compiled from the questionnaire
Inference: Table 4.3 shows that out of 14 two wheeler companies surveyed, only 7 company’s
offer free toll number service for its customers and rest 7 companies do not offer free toll number
service for its customers.
Sr.No Company Name Free Toll Number
Service
1 Honda Motorcycle & Scooter India Pvt Limited YES
2 Bajaj Auto Ltd YES 3 Harley Davidson India NO 4 India Yamaha Motor Pvt Ltd NO 5 Suzuki Motorcycle India Pvt Ltd YES 6 Hero Moto Corp Ltd YES 7 BMW India NO 8 Ducati NO 9 Royal Enfield NO 10 Hyosung YES 11 T V S Motor Company YES 12 Kawasaki NO 13 Mahindra Two wheelers Ltd YES 14 KTM NO
The following table is presented to understand how many Two-wheeler companies offer
online booking for after sales.
Table 4.4: Two-Wheeler Company offering online booking for after sales.
Sr.No Company Name
Online Service Booking
1 Honda Motorcycle & Scooter India Pvt Limited NO
2 Bajaj Auto Ltd YES -Only
for Banglore 3 Harley Davidson India NO 4 India Yamaha Motor Pvt Ltd NO 5 Suzuki Motorcycle India Pvt Ltd YES 6 Hero Moto Corp Ltd NO 7 BMW India NO 8 Ducati NO 9 Royal Enfield NO 10 Hyosung NO 11 T V S Motor Company YES 12 Kawasaki NO 13 Mahindra Two wheelers Ltd NO 14 KTM NO
Source: Compiled from the questionnaire
Inference: Table 4.4 shows that out of 14 major two wheeler companies having presence in
Mumbai, only 3 companies i.e. Suzuki Motorcycle India Pvt Ltd and T V S Motor Company
offers online booking for after sales. Bajaj Auto Ltd offers online booking for after sales only for
the city of Bangalore.
The following table is presented to understand how many Two-wheeler companies offer
online dealer locator service.
Table 4.5: Two-Wheeler Company offering online dealer locator service.
Sr.No Company Name Dealer Locator 1 Honda Motorcycle & Scooter India Pvt Limited Y 2 Bajaj Auto Ltd Y 3 Harley Davidson India Y 4 India Yamaha Motor Pvt Ltd Y 5 Suzuki Motorcycle India Pvt Ltd Y 6 Hero Moto Corp Ltd Y 7 BMW India Y 8 Ducati Y 9 Royal Enfield Y 10 Hyosung N 11 T V S Motor Company Y 12 Kawasaki Y 13 Mahindra Two wheelers Ltd Y 14 KTM Y
Source: Compiled from the questionnaire
Inference: Table 4.5 shows that out of 14 two wheeler companies surveyed 13 two-wheeler
companies offer dealer locator service on the company website where in only Hyosung do not
offer the dealer locator.
The following table is presented to understand the distribution of the respondents
according to their age
Table 4.6: Age Category of Two Wheeler Users.
Age Frequency Percentage (%)
18-25 127 42.3
26-30 83 27.6
31-40 36 12.0
40 & Above 54 18.0
Total 300 100.0
Source: Compiled from the questionnaire
GRAPH 4.1: Age Category of Two Wheeler Users
Category of Two Wheeler Users
Inference : Table 4.6 & Graph 4.1 shows that out of 300 two wheeler users surveyed in Mumbai
, 42.3% of the users are in the age group 18-25, 27.6% of the users are in the age group 26-30,
12.0% of the two wheeler users are 31-40 and 18.0% of the two wheeler users are in 40 & above.
It is apparent that majority of the users belong to the age group 18 - 25.
The following table is presented to understand the distribution of the respondents
according to their income category of farmers
Table 4.7: Income Category of Two wheeler Users
Income Frequency Percentage (%)
<100000 78 26.0
100000-150000 32 10.6
150001-200000 30 10.0
200001-250000 33 11.0
250000-300000 24 8.00
>300000 103 34.3
Total 300 100.0
Source: Compiled from the questionnaire
GRAPH 4.2: Income Category of Two wheeler Users
Inference: Table 4.7 & Graph 4.2 shows that out of 300 two wheeler users surveyed, 34.3% of
the two wheeler users are having income
having income below Rs 100000, 11.0% of the two wheeler users are having income between Rs
200001 - 250000, 10.0% of the two wheeler users are having income between
200000, and 8.0% of the two wheeler users are having income between
shows that most of the two wheeler users are belonging to the income level above
annum.
GRAPH 4.2: Income Category of Two wheeler Users
: Table 4.7 & Graph 4.2 shows that out of 300 two wheeler users surveyed, 34.3% of
the two wheeler users are having income above Rs 300000, 26.0% of the two wheeler users are
having income below Rs 100000, 11.0% of the two wheeler users are having income between Rs
250000, 10.0% of the two wheeler users are having income between
wheeler users are having income between Rs 250000
shows that most of the two wheeler users are belonging to the income level above
: Table 4.7 & Graph 4.2 shows that out of 300 two wheeler users surveyed, 34.3% of
300000, 26.0% of the two wheeler users are
having income below Rs 100000, 11.0% of the two wheeler users are having income between Rs
250000, 10.0% of the two wheeler users are having income between Rs 150001 -
250000 – 300000 ,It
shows that most of the two wheeler users are belonging to the income level above Rs 300000 per
The following table is presented to understand the distribution of the respondents
according to their Occupation
Table 4.8: Occupation of Two wheeler Users.
Occupation Frequency Percentage (%)
Student 82 27.4
Service 118 39.3
Business 100 33.3
Total 300 100.0
Source: Compiled from the questionnaire
Graph 4.3: Occupation of Two wheeler Users
Inference : Table 4.8 & Graph 4.3 shows that out of 300 respondents , 39.3% of the two wheeler
users are engaged in the service as their occupation, 33.3% of the two wheeler users are having
business as their occupation, 27.4% of the two wheeler users are students. It clearly indicates that
most of the two wheeler users have service as their occupation.
The following table is presented to understand the distribution of the respondents
according to the company name of Two-wheeler they own.
Table 4.9: Two-wheeler Company.
Two wheeler Company Frequency Percentage (%)
Hero Moto Corp Ltd 48 16.0
Bajaj Auto Ltd 65 21.6
TVS Motor Company 19 6.3
Honda Motorcycle Scooter India 120 40.0
Yamaha India 37 12.3
Mahindra Two Wheelers Ltd 1 0.33
Suzuki Motorcycle India Pvt Ltd 6 2.0
Royal Enfield 4 1.33
Total 300 100.0
Source: Compiled from the questionnaire
Graph 4.4: Two-wheeler Company.
Inference: Table 4.9 & Graph 4.4 shows that out of 300 two wheeler users surveyed in Mumbai,
40.0% of two wheeler users own a two wheeler of Honda Motorcycle Scooter India, 21.6% of
two wheeler users own a two wheeler of Bajaj Auto Ltd, 16.0% of two wheeler users own a two
wheeler of Hero Moto Corp Ltd, 12.3% of two wheeler users own a two wheeler of Yamaha,
6.30 % of two wheeler users own a two wheeler of TVS Motor company , 2.0% of two wheeler
users own a two wheeler of Suzuki Motorcycle India Pvt Ltd , 1.33% of two wheeler users own a
two wheeler of Royal Enfield and the remaining 0.33% of the two wheeler users own a two
wheeler Mahindra Two Wheelers Ltd. It shows that people prefer two wheelers of Honda
Motorcycle Scooter India.
The following table is presented to understand the frequency of the two wheelers being
serviced.
Table 4.10: Frequency of Two-wheelers service.
Time Duration Frequency Percentage (%)
Once a Month 20 6.8
Once in 2 Months 105 35.0
Once a Quarter 102 34.0
Once In 6 Months 62 20.6
Once a Year 11 3.66
Total 300 100.0
Source: Compiled from the questionnaire
Graph 4.5 Frequency of Two wheeler service.
Inference: Table 4.10 & Graph 4.5 shows that out of 300 two wheeler users surveyed in Mumbai
35.0% of the two wheeler users get their two wheelers services once in 2 months, 34.0% of the
two wheeler users get their two wheelers services once in 3 months 20.6% of the two wheeler
users get their two wheelers services once in 6 months, 6.8% of the two wheeler users get their
two wheelers services once a months and the remaining 3.66% two wheeler users get their two
wheelers services once a year. It is evident from the study that two wheeler users understand the
need and importance of two wheeler service and maximum number of two wheeler users, i.e.
35.0% get their two wheelers serviced once in 2 months.
The following table is presented to understand the place of two wheeler service.
Table 4.11: Place of Two Wheeler Service.
Place of Service Frequency Percentage (%)
Company Authorised Service Station 88 29.3
Unauthorized Service Station 141 47.0
Both 71 23.7
Total 300 100.0
Source: Compiled from the questionnaire
Graph 4.6: Place of Two Wheeler Service.
Inference: Table 4.11 & Graph 4.6 shows that out of 300 two wheeler users surveyed, the data
reveals that, 47.0% of two wheeler users get their two wheeler serviced from unauthorized
service station, 29.3% of two wheeler users get their two wheeler serviced from company
authorised service station and 23.7% two wheeler users get their two wheeler serviced from both
i.e. company authorised service station and unauthorized service station.It is evident that people
use more of unauthorized service station for the service needs of their two wheelers.
The following table is presented to understand the response of the two wheeler owners
about the free company maintenance service availed.
Table 4.12: Opinion for Avail of free company maintenance service
Opinion Frequency Percentage (%)
Yes 273 91.0
No 27 9.0
Total 300 100.0
Source: Compiled from the questionnaire
Graph 4.7: Avail free company maintenance service
Inference: Table 4.12 & Graph 4.7 shows that out of 300 respondents surveyed, 273 two
wheeler users surveyed have availed the free company maintenance service and 27 two wheeler
users surveyed have not availed the free company maintenance service. The study reflects the
positive attitude of the two wheeler users towards the free company maintenance service.
The following table is presented to understand the distribution of the respondents
according to their frequency of usage for free company maintenance service.
Table 4.13: Opinion about frequency of free company maintenance service.
Usage Frequency Percentage (%)
None 27 9.0
Few 25 8.3
Difficult To Say 42 14.0
Some 75 25.0
All 131 43.7
Total 300 100.0
Source: Compiled from the questionnaire
Graph 4.8: Free company maintenance service.
Inference : Table 4.13 & Graph 4.8 shows that out of 300 respondents surveyed, 27 two
wheeler users surveyed have not availed the free company maintenance service and 131 two
wheeler users surveyed have availed all the free company maintenance service, 75 two wheeler
users surveyed have availed some of the free company maintenance service. 42 two wheeler
users surveyed have availed the free company maintenance service and 25 two wheeler users
surveyed have availed few free company maintenance service given by company. The study
reflects that maximum of the two wheeler users have a positive attitude towards the free
company maintenance service.
The following table is presented to understand the response of the two wheeler owners
about reminders for free company maintenance service.
Table 4.14: Opinion for SMS / Email Reminders.
Opinion Frequency Percentage (%)
Yes 77 26.0
No 223 74.0
Total 300 100.0
Source: Compiled from the questionnaire
Graph 4.9: SMS / Email Reminders.
Inference : Table 4.14 & Graph 4.9 shows that out of 300 respondents surveyed, 77 two
wheeler users surveyed have received sms / email from the company as reminders for the two-
wheeler service and 223 two wheeler users surveyed did not received sms / email from the
company as reminders for the two-wheeler service. The study reflects that maximum of the two
wheeler users have not received reminders from the company regarding two-wheeler service.
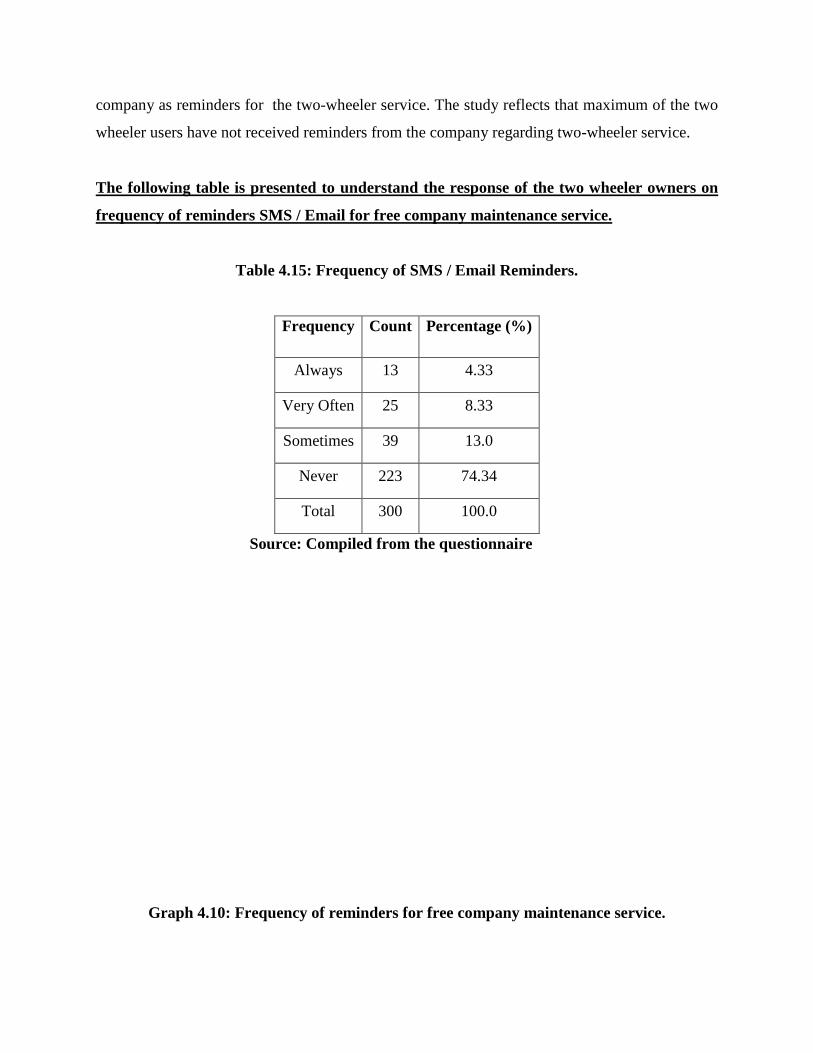
The following table is presented to understand the response of the two wheeler owners on
frequency of reminders SMS / Email for free company maintenance service.
Table 4.15: Frequency of SMS / Email Reminders.
Frequency Count Percentage (%)
Always 13 4.33
Very Often 25 8.33
Sometimes 39 13.0
Never 223 74.34
Total 300 100.0
Source: Compiled from the questionnaire
Graph 4.10: Frequency of reminders for free company maintenance service.
Inference: Table 4.15 & Graph 4.10 shows that out of 300 respondents surveyed, 13 two
wheeler users surveyed always received sms / email from the company as reminders from the
company, 25 two wheeler users surveyed very often, received sms / email from the company as
reminders from the company, 39 two wheeler users surveyed sometimes received sms / email
from the company as reminders from the company and 223 two wheeler users surveyed never
received sms / email from the company as reminders for the two-wheeler service. The study
reflects that maximum of the two wheeler users have not received reminders from the company
regarding two-wheeler service.
The following table is presented to understand the distribution of the respondents
according to their buying pattern of the annual maintenance contract with company
authorised service station.
Table 4.16(a): Annual maintenance contract of company authorised service station.
Response Count Percentage (%)
Yes 93 31.0
No 207 69.0
Total 300 100.0
Source: Compiled from the questionnaire
Graph 4.11(a): Annual maintenance contract of company authorised service station.
Inference: Table 4.16(a) & Graph 4.11(a) shows that 31.0% of the two wheeler users have
bought the annual maintenance contract of company authorised service station, 69% of the two
wheeler users have not bought the annual maintenance contract of company authorised service
station. The study clearly indicates that the two wheeler users do not prefer to buy the annual
maintenance contract of company authorised service station.
Table 4.16(b): Experience Level about the Annual maintenance contract of company
authorised service station.
Satisfaction Count Percentage (%)
Excellent 08 2.7
Good 60 20.0
Can’t Say 218 72.6
Poor 11 3.7
Very Poor 03 1.00
Total 300 100.0
Source: Compiled from the questionnaire
Graph 4.11(b): Experience Level for Annual Maintenance Contract
Inference: Table 4.16(b) & Graph 4.11(b) shows that out of the total 72.6% of the two wheeler
respondents who have responded as can’t say about their experience, 207 have said can’t say
about their experience because they have not purchased the annual maintenance contract and rest
11 respondents are of the opinion that there is no difference between the free service given by the
company and the service given in the annual maintenance contract, 20% of two wheeler users
who bought the annual contract service termed their experience as good, 3.7% as poor ,2.7 as
excellent and 1% as very poor. The study clearly indicates that the majority of two wheeler users
who have bought the annual maintenance contract are satisfied with the service and have good
experience.
The following table is presented to understand the distribution of the respondents
according to their satisfaction level after getting two wheeler serviced at company
authorised service station.
Table 4.17: Satisfaction Level after getting Two-wheeler serviced at company authorised
service station.
Satisfaction Count Percentage (%)
Excellent 19 6.33
Good 191 63.67
Difficult to Say 70 23.0
Bad 14 4.67
Very Poor 04 1.33
Total 300 100.0
Source: Compiled from the questionnaire
Graph 4.12: Satisfaction Level after getting two-wheeler serviced at company authorised
service station.
Inference: Table 4.17 & Graph 4.12 shows that out of total 300 respondents 6.33% of the two
wheeler respondents has rated their satisfaction as excellent , 63.67% as good , 4.67% as bad,
1.33% as poor and for 23% of respondents it is difficult to rate their satisfaction about getting
their two wheeler services at company authorised service station. The study clearly indicates that
the majority of two wheeler users who have got their two wheeler services at company
authorised service station are satisfied with the service and have good experience.
The following table is presented to understand the distribution of the respondents
according to their satisfaction level after getting two-wheeler serviced at non authorised
service station.
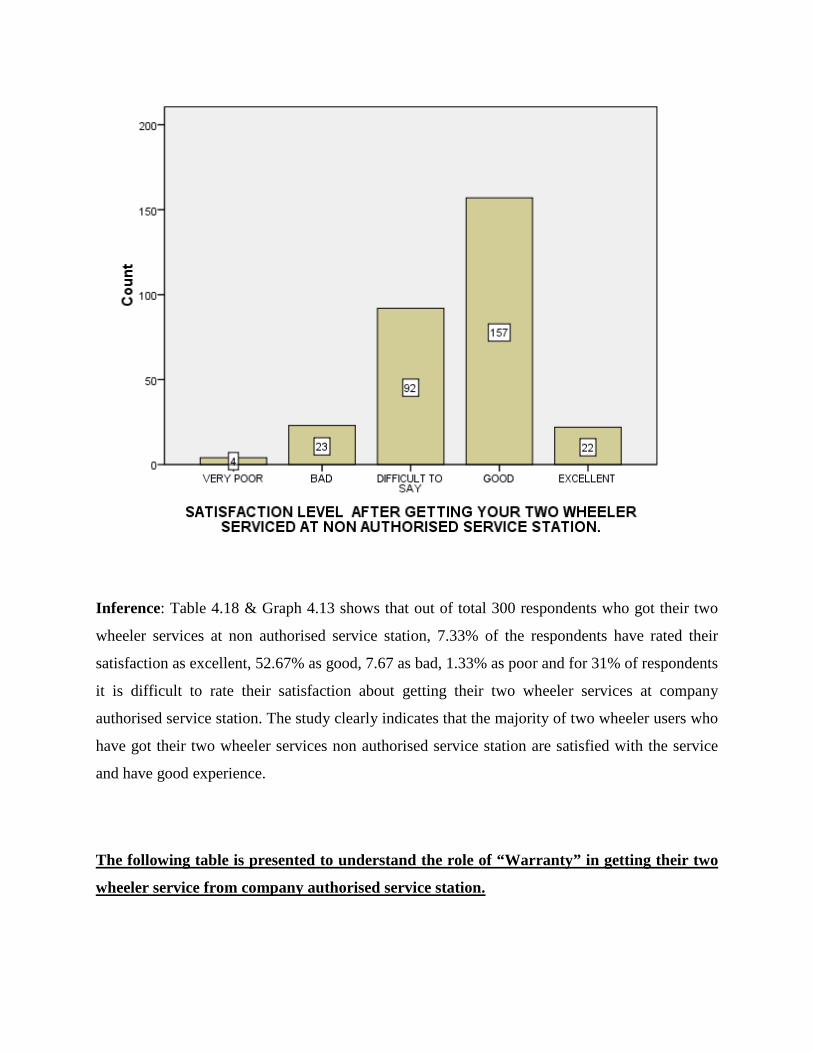
Table 4.18: Satisfaction Level after getting their two-wheeler serviced at non authorised
service station.
Satisfaction Count Percentage (%)
Excellent 22 7.33
Good 157 52.67
Difficult to Say 92 31.00
Bad 23 7.67
Very Poor 04 1.33
Total 300 100.0
Source: Compiled from the questionnaire
Graph 4.13: Satisfaction Level after getting two-wheeler serviced at non authorised service
station.
Inference: Table 4.18 & Graph 4.13 shows that out of total 300 respondents who got their two
wheeler services at non authorised service station, 7.33% of the respondents have rated their
satisfaction as excellent, 52.67% as good, 7.67 as bad, 1.33% as poor and for 31% of respondents
it is difficult to rate their satisfaction about getting their two wheeler services at company
authorised service station. The study clearly indicates that the majority of two wheeler users who
have got their two wheeler services non authorised service station are satisfied with the service
and have good experience.
The following table is presented to understand the role of “Warranty” in getting their two
wheeler service from company authorised service station.
Table 4.19: Role of Warranty in getting two-wheeler serviced from company authorised
service station.
Response for
Warranty
Frequency Percentage (%)
Strongly Disagree 3 1.00
Disagree 6 2.00
Neutral 24 8.00
Agree 122 40.67
Strongly Agree 145 48.33
Total 300 100.0
Source: Compiled from the questionnaire
Graph 4.14: Opinion on Role of Warranty in getting two-wheeler serviced from company
authorised service station.
Inference: Table 4.19 & Graph 4.14 shows that out of 300 respondents surveyed, 40.67% two
wheeler users agree and 48.33% two wheeler users strongly agree on warranty as an important
factor for getting two wheeler serviced from company authorised service station, 2% two
wheeler users disagree and 1% two wheeler users strongly disagree on warranty as an important
factor for getting two wheeler serviced from company authorised service station and 8% of
respondents have a neutral response for warranty as an important factor for getting two wheeler
serviced from company authorised service station. The study shows that majority of the two
wheeler users consider warranty as an important factor for getting two wheeler serviced from
company authorised service station.
The following table is presented to understand the role of “Guarantee” in getting Two-
wheeler service from company authorised service station.
Table 4.20: Opinion on Guarantee in getting two-wheeler serviced from company
authorised service station.
Response for
Guarantee
Frequency Percentage (%)
Strongly Disagree 7 2.33
Disagree 9 3.00
Neutral 56 18.67
Agree 119 39.67
Strongly Agree 109 36.33
Total 300 100.0
Source: Compiled from the questionnaire
Graph 4.15: Opinion on Role of Guarantee in getting two-wheeler serviced from company
authorised service station.
Inference: Table 4.20 & Graph 4.15 reveals that out of 300 respondents surveyed, 36.33% two
wheeler users strongly agree Guarantee is an important factor in getting two-wheeler serviced
from company authorised service station., 39.67% agree, 18.67% are neutral, 3% disagree and
2.33% strongly disagree. Majority of the two wheeler users are of the opinion that Guarantee is
an important factor in getting two-wheeler serviced from company authorised service station.
The following table is presented to understand the role of “Original Spare parts” in getting
their two wheeler service from company authorised service station.
Table 4.21: An original Spare part is important factor in getting two-wheeler serviced from
company authorised service station.
Original Spare
parts
Frequency Percentage (%)
Strongly Disagree 5 1.67
Disagree 1 0.33
Neutral 15 5.0
Agree 105 35.0
Strongly Agree 174 58.0
Total 300 100.0
Source: Compiled from the questionnaire.
Graph 4.16: Opinion on Original Spare parts in getting two-wheeler serviced from
company authorised service station.
Inference: Table 4.21 & Graph 4.16 reveals that out of 300 respondents surveyed, 58% two
wheeler users strongly agree original spare parts is an important factor in getting two-wheeler
serviced from company authorised service station., 39.67% agree, 5%are neutral, 0.33% disagree
and 1.67% strongly disagree. The study reveals that Guarantee is an important factor in getting
two-wheeler serviced from company authorised service station.
The following table is presented to understand the role of “Peace of Mind” in getting their
two wheeler service from company authorised service station.
Table 4.22: Getting two-wheeler serviced from company authorised service station because
of Peace of Mind.
Response Frequency Percentage (%)
Strongly Disagree 11 3.67
Disagree 22 7.33
Neutral 53 17.67
Agree 117 39.0
Strongly Agree 97 32.33
Total 300 100.0
Source: Compiled from the questionnaire.
Graph 4.17: Opinion on Peace of Mind in getting two-wheeler serviced from company
authorised service station.
Inference: Table 4.22 & Graph 4.17 reveals that out of 300 respondents surveyed, 97 (32.33%)
two wheeler users strongly agree that they get peace of mind in getting two-wheeler serviced
from company authorised service station., 117(39.0%) agree, 53 (17.67) are neutral, 22 (7.33%)
disagree and 11 (3.67%) strongly disagree. Majority of the two wheeler users are of the opinion
that they get peace of mind in getting two-wheeler serviced from company authorised service
station.
The following table is presented to understand the role of “Special Offers” in getting their
two wheeler service from company authorised service station.
Table 4.23: Special Offers.
Response Frequency Percentage (%)
Strongly Disagree 31 10.33
Disagree 64 21.33
Neutral 76 25.34
Agree 96 32.0
Strongly Agree 33 11.0
Total 300 100.0
Source: Compiled from the questionnaire.
Graph 4.18: Opinion on Special Offers in getting two-wheeler serviced from company
authorised service station.
Inference: Table 4.23 & Graph 4.18 shows that out of 300 respondents surveyed, 33% two
wheeler users strongly agree that they get their two-wheeler serviced from company authorised
service station because of the special offers, 32.0% agree, 25.34% are neutral, 21.33% disagree
and 10.33% strongly disagree. There is a mixed response of the two wheeler users about the
special offers for getting two-wheeler serviced from company authorised service station.
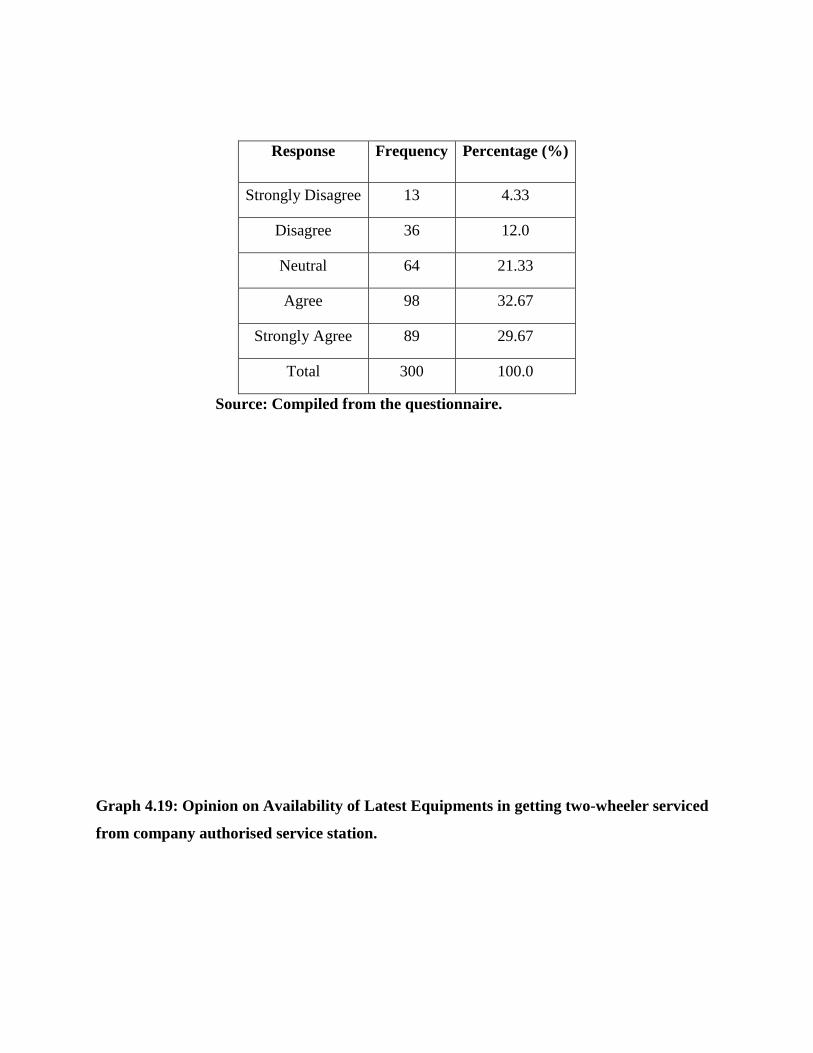
The following table is presented to understand the role of “Availability of Latest
Equipments” in getting their two wheeler service from company authorised service station.
Table 4.24: Availability of Latest Equipments.
Response Frequency Percentage (%)
Strongly Disagree 13 4.33
Disagree 36 12.0
Neutral 64 21.33
Agree 98 32.67
Strongly Agree 89 29.67
Total 300 100.0
Source: Compiled from the questionnaire.
Graph 4.19: Opinion on Availability of Latest Equipments in getting two-wheeler serviced
from company authorised service station.
Inference: Table 4.24 & Graph 4.19 shows that out of 300 respondents surveyed, 29.67% two
wheeler users strongly agree that they get their two-wheeler serviced from company authorised
service station because of the availability of latest equipments, 32.67% agree, 621.33% are
neutral, 12.0% disagree and 4.33% strongly disagree. Majority of the two wheeler users are of
the opinion that they get their two-wheeler serviced from company authorised service station
because of availability of latest equipments.
The following table is presented to understand the role of “Trust” in getting their two
wheeler service from company authorised service station.
Table 4.25: Having Trust on company authorised service station.
Response Frequency Percentage (%)
Strongly Disagree 10 3.33
Disagree 32 10.67
Neutral 65 21.67
Agree 115 38.33
Strongly Agree 78 26.0
Total 300 100.0
Source: Compiled from the questionnaire.
Graph 4.20: Opinion on Trust in getting two-wheeler serviced from company authorised
service station.
Inference: Table 4.25 & Graph 4.20 shows that out of 300 respondents surveyed, 78(26.0%) two
wheeler users strongly agree that they get their two-wheeler serviced from company authorised
service station because they have trust on company authorised service station, 115(38.33%)
agree, 65(21.67%) are neutral, 32(10.67%) disagree and 10(3.33%) strongly disagree. Majority
of the two wheeler users are of the opinion that they get their two-wheeler serviced from
company authorised service station because of they have trust on company authorised service
station.
The following table is presented to understand the importance of availability of company
authorised service station near to residence in getting their two wheeler service from
company authorised service station.
Table 4.26: Response for availability of company authorised service station near to
residence in getting
Response Frequency Percentage (%)
Strongly Disagree 23 7.67
Disagree 41 13.67
Neutral 54 18.0
Agree 129 43.0
Strongly Agree 53 17.66
Total 300 100.0
Source: Compiled from the questionnaire.
Graph 4.21: Response for availability of company authorised service station near to
residence.
Inference: Table 4.26 & Graph 4.21 shows that out of 300 respondents surveyed, 53(17.66%)
two wheeler users strongly agree that they get their two-wheeler serviced from company
authorised service station because it is near to their residence, 129(43%) agree, 54 (18%) are
neutral, 41 (13.67%) disagree and 23 (7.67%) strongly disagree. The study shows that they get
their two-wheeler serviced from company authorised service station because it is near to their
residence.
The following table is presented to understand the distribution of the respondents for not
getting their two-wheeler serviced from unauthorized service station.
Table 4.27: Reason for not getting two-wheeler serviced from unauthorized service station.
Reasons Frequency Percentage (%)
Expensive 10 3.33
Time Consuming 20 6.67
Non Availability of Guarantee 76 25.33
Non Availability of Genuine Spare Parts 38 12.67
Low Satisfaction 26 8.67
Lack of Waiting Room Facility 12 4.0
Non Availability of Latest Equipments 56 18.67
No Trust 62 20.66
Total 300 100.0
Source: Compiled from the questionnaire.
Graph 4.22:
Reason for not getting two-wheeler serviced from unauthorized service station.
Inference: Table 4.27 & Graph 4.22 shows that out of 300 respondents surveyed, 76 (25.33%)
two wheeler users do not get their two-wheeler serviced from the unauthorised service station
because of non availability of guarantee, 62 (20.66%) because of no trust, 56 (18.67%) because
of non availability of latest equipments, 38 (12.67%) because of non availability of genuine spare
parts, 26 (8.67%) because of low satisfaction, 20 (6.67%) because it is time consuming, 12
(4.0%) because lack of waiting room facility, and 10(3.33%) because it is Expensive.The two
wheeler users are of the opinion that they do not get their two-wheeler serviced from the
unauthorised service station because of non availability of guarantee.
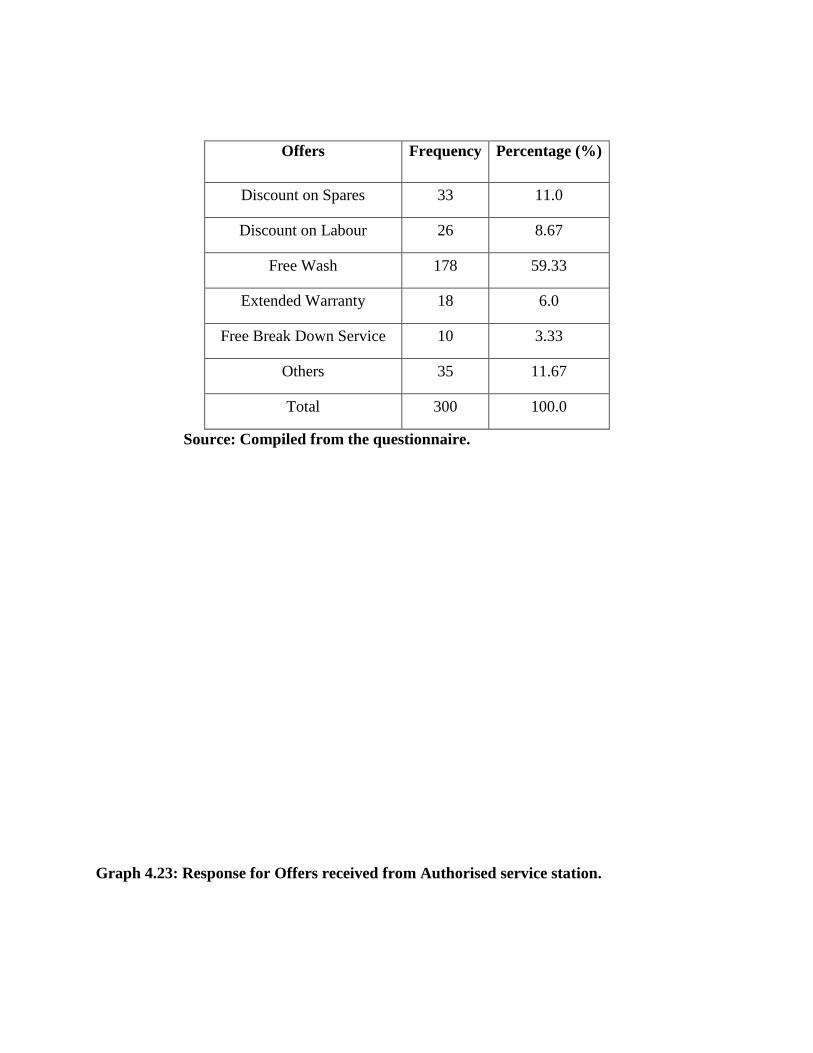
The following table is presented to understand the distribution of the respondents on the
offers received from company authorised service station.
Table 4.28: Offers from Authorised service station.
Offers Frequency Percentage (%)
Discount on Spares 33 11.0
Discount on Labour 26 8.67
Free Wash 178 59.33
Extended Warranty 18 6.0
Free Break Down Service 10 3.33
Others 35 11.67
Total 300 100.0
Source: Compiled from the questionnaire.
Graph 4.23: Response for Offers received from Authorised service station.
Inference: Table 4.28 & Graph 4.23 shows that out of 300 respondents surveyed, 178 (59.33%)
two wheeler users received free wash offer, 33 (11%) received discount of spares, 26 (8.67%)
received discount on labour, 18 (6.0%) received extended warranty, 10(3.33%) received free
break down service and 35 (11.67%) received other offers. Majority of the two wheeler users are
of the opinion that they have received free wash offer from company authorised service station.
4.3. Table(s) determining the Reliability Analysis & Factor Analysis
Scale of Reliability or Reliability Analysis
Before conducting Factor analysis, the scale of reliability is used to find out the internal
consistency of the variables to be used in Factor analysis. Reliability is synonymous with
repeatability. It is a measurement that yields consistent results over time is said to be reliable.
When a measurement is prone to random error, it lacks reliability. The reliability of an
instrument places an upper limit on its validity. A measurement that lacks reliability will also
lack validity. If the scale of reliability is close to 1, then it is concluded that variables are best
suitable for conducting factor analysis. Reliability analysis is a popular and frequently used SPSS
method of measuring the internal consistency of the variables.
Cronbach Alpha (α) is designed as a measure of internal consistency. Alpha is measured on the
same scale as a Pearson (r) correlation coefficient which varies between 0 and 1. The closer the α
to 1, the greater the internal consistency of items in the instrument being assessed.
Table 4.29: Reliability Statistics for Alpha Value
Source: Compiled from the questionnaire
Inference: It is seen from the Table 4.29, the value of Alpha (α) is 0.794. We can conclude that
the variables are having high internal consistency and hence these variables are considered to be
suitable for conducting factor analysis.
4.4 Hypothesis Testing
The following hypothesis is tested by using Bartlett’s test of Sphericity to determine the
internal consistency and reliability among the variables used in the study
Cronbach Alpha ( α ) N of Items .794 9
Hypothesis 1
Null Hypothesis (H0): There is no internal consistency and reliability among the variables
selected in the study for conducting factor analysis.
Alternative Hypothesis (H1): There is an internal consistency and reliability among the
variables selected in the study for conducting factor analysis.
Table 4.30
KMO and Bartlett’s Test of hypothesis (for factor analysis)
Kaiser-Meyer-Olkin Measure of Sampling Adequacy.
.789
Bartlett's Test of Sphericity
Approx. Chi-Square 814.441
Df 36
Sig. .000
Source: Compiled from the questionnaire
Df – degrees of freedom Sig: Significance Level
Inference: It can be seen from the table 4.30 that the significance (0.00) is less than the assumed
value (0.05). So we reject H0. This means that factor analysis is valid.
The value of KMO coefficient should be always more than 0.5. The table value shows that it is
0.789. So this implies that factor analysis for data reduction is very effective.
Table 4.31 : Communalities
Factors Initial Extraction
Warranty 1.000 .792
Guarantee 1.000 .752
Original Parts 1.000 .604
Peace of Mind 1.000 .622
Special Offers 1.000 .379
Availability OF Latest Equipment Trust Annual Maintenance Contract Near To Residence
1.000 1.000 1.000 1.000
.616
.694
.646
.823
Source: Compiled by the questionnaire
Based on the table 4.31, the following graph which is called as Scree Plot is plotted to know
the number of factors which is available in the analysis can be determined
Graph 4.24
From the above graph of Scree plot 4.24, it can be concluded that the factors having the
Eigenvalues more than 1 have to be considered. This study determines 3 factors.
Table 4.32
Rotated Component Matrix (for deciding the number of factors)
Component
Variables 1 2 3
Warranty .110 .861 .196
Guarantee .140 .856 .024
Original Parts .480 .562 -.242
Peace of Mind .771 .161 .045
Special Offers .513 .232 .251
Availability of Latest Equipment Trust Annual Maintenance Contract Near To Residence
.764
.813
.678
.128
.150
.070
.125
.056
-.101 .168 .413 .897
Source: Compiled by the questionnaire
From the Table 4.32 of Rotated Component Matrix, it can be seen that the three factors
can be classified as follows:
Factor 1:
• Trust
• Peace of Mind
• Availability of Latest Equipment
Factor 2
• Annual Maintenance Contract • Special Offers • Near To Residence
Factor 3
• Warranty • Guarantee • Original Parts
The factors are renamed as follows:
Factor 1 – Trust
Factor 2 – Annual Maintenance Contract
Factor 3 – Warranty & Guarantee
From the Factor analysis it states Trust, Annual Maintenance Contract; Warranty & Guarantee
are highly instrumental in the two wheeler industry.
The following hypothesis has been tested to know how the use of Customer relationship management has an impact on getting the new customers for after sales service. The following hypothesis has been tested by using the One Dimensional Chi square test
Hypothesis 2
Null Hypothesis (H0): Use of Customer relationship management has no impact on getting the
new customers for after sales service.
Alternative Hypothesis (H1): Use of Customer relationship management has an impact on
getting the new customers for after sales service.
Table 4.33: Observed & Expected values for Use of Customer relationship management for
getting the new customers for after sales service.
Source: Compiled from the questionnaire
Table 4.33(a)
Chi-Square Analysis for use of customer relationship management for getting the new customers for after sales service.
Dimension Observed Expected Residual
Strongly Disagree 34 60 -26.0
Disagree 44 60 -16.0
Neutral 59 60 -1.0
Agree 100 60 40
Strongly Agree 63 60 3.0
Total 300
Description Appearance
Chi-Square 42.367
Source: Compiled from the questionnaire
Inference: It can be seen from the table 4.33(a) that the significance (0.000) is less than the
assumed value (0.05). So we reject H0. This means that use of Customer relationship
management has an impact on getting the new customers for after sales service.
The following hypothesis has been tested to know how the use of Customer relationship management is highly significant to increase the satisfaction level of customers. The following hypothesis has been tested by using the One Dimensional Chi square test
Hypothesis 3
Df 4
Asymp.Sig .000
Null Hypothesis (H0): Use of Customer relationship management is not significant in enhancing
the satisfaction level of customers
Alternative Hypothesis (H1): Use of Customer relationship management is highly significant to
enhance the satisfaction level of customers
Table 4.34: Observed & Expected values for Use of Customer relationship management to
enhance the satisfaction level of customers.
Source: Compiled from the questionnaire
Table 4.34(a)
Chi-Square Analysis for Customer relationship management * Satisfaction level of
customers.
Dimension Observed Expected Residual
Very Low 4 60 -56.0
Low 14 60 -46.0
Neutral 70 60 10.0
High 196 60 136
Very High 16 60 -44.0
Total 300
Description Appearance
Source: Compiled from the questionnaire
Inference: It can be seen from the table 4.34(a) that the calculated value 429.7 is more than the
table value 9.488, thus we reject the null hypothesis and hence we have concluded that Use of
Customer relationship management has an impact on getting the new customers for after sales
service.
The following hypothesis has been tested to find how Availability of company authorised after sales service is highly significant to increase the company sales. The following hypothesis has been tested by using the Pearson Chi square test
Chi-Square 429.733
Df 4
Asymp.Sig .000
Hypothesis 4
Null Hypothesis (H0): Availability of company authorised after sales service is not significant to
increase the company sales.
Alternative Hypothesis (H1): Availability of company authorised after sales service is highly
significant to increase the company sales.
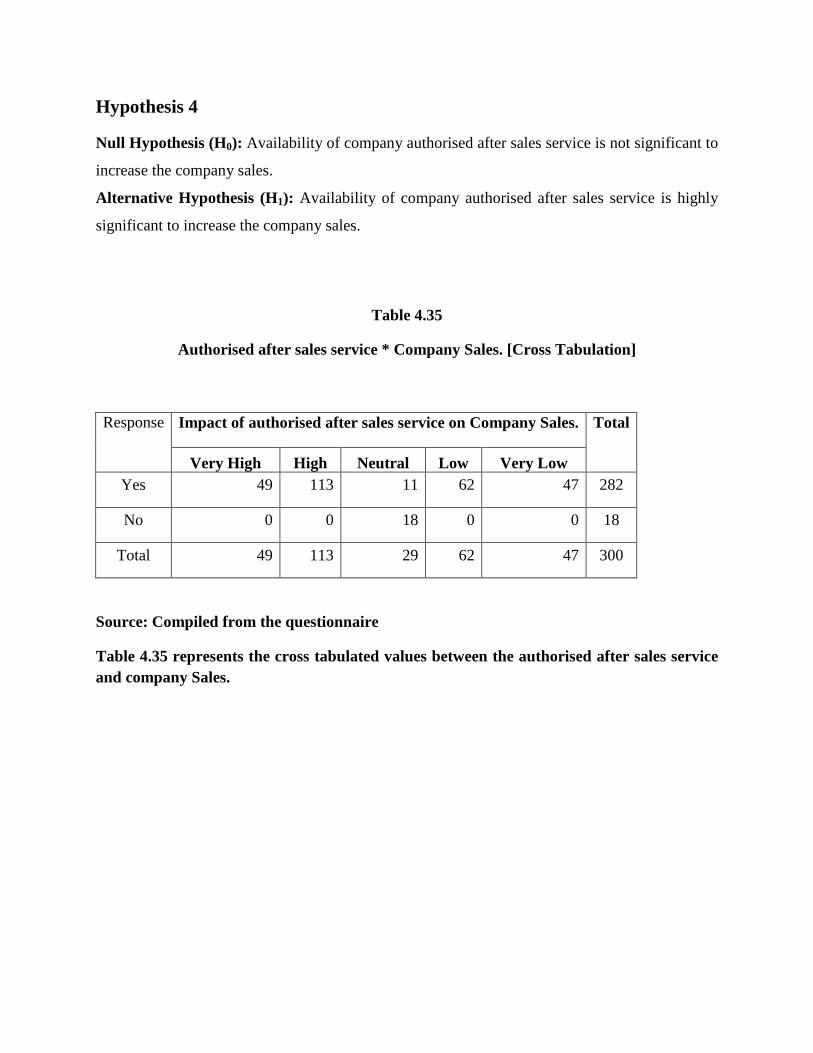
Table 4.35
Authorised after sales service * Company Sales. [Cross Tabulation]
Response Impact of authorised after sales service on Company Sales. Total
Very High High Neutral Low Very Low Yes 49 113 11 62 47 282
No 0 0 18 0 0 18
Total 49 113 29 62 47 300
Source: Compiled from the questionnaire
Table 4.35 represents the cross tabulated values between the authorised after sales service and company Sales.
Table 4.35(a)
Chi-Square Analysis for authorised after sales service * Company Sales.
Source: Compiled from the questionnaire
Inference: It can be seen from the table 4.35(a) that the calculated value 178.94 is more than the
table value 9.488, thus we reject the null hypothesis and hence we have concluded that
availability of company authorised after sales service is highly significant to increase the
company sales.
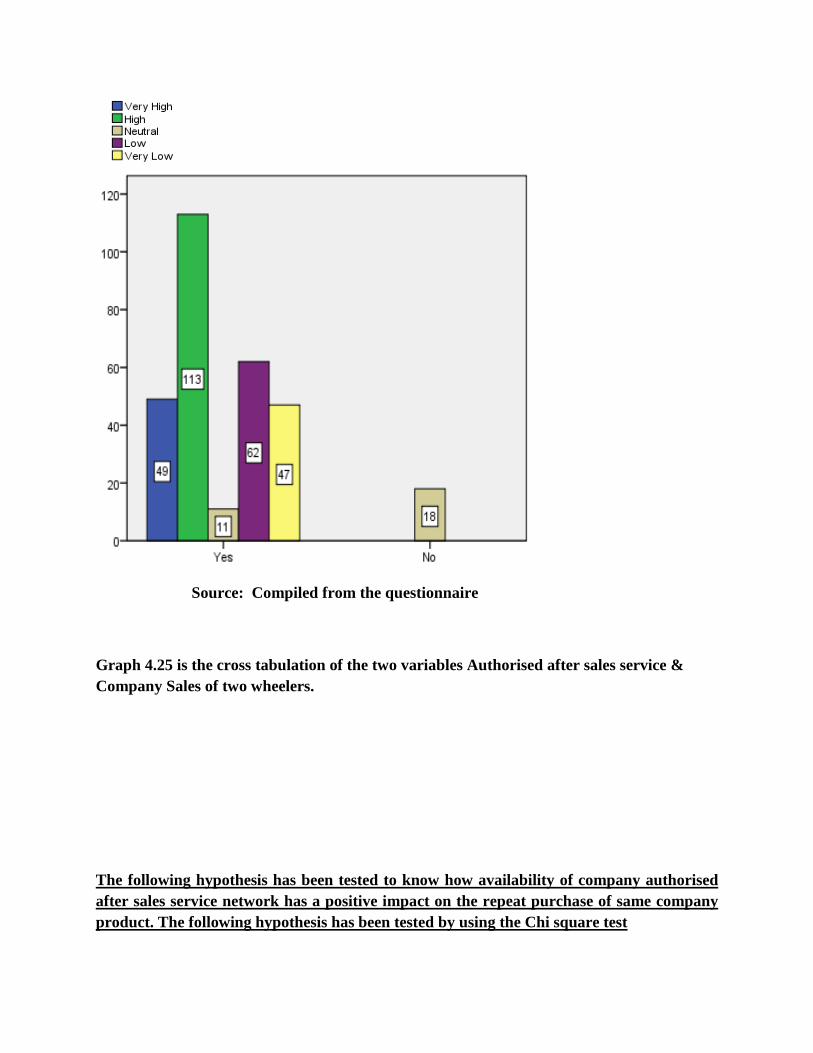
Graph 4.25
Authorised after sales service * Company Sales.
Description Value df Asymp. Sig.
Pearson Chi-Square 178.944 4 .000
Likelihood Ratio 97.684 4 .000
Linear-by-Linear Association .351 1 .554
N of Valid Cases 300
Source: Compiled from the questionnaire
Graph 4.25 is the cross tabulation of the two variables Authorised after sales service & Company Sales of two wheelers.
The following hypothesis has been tested to know how availability of company authorised after sales service network has a positive impact on the repeat purchase of same company product. The following hypothesis has been tested by using the Chi square test
Hypothesis 5
Null Hypothesis (H0): Availability of company authorised after sales service network has no
positive impact on the repeat purchase of same company product.
Alternative Hypothesis (H1): Availability of company authorised after sales service network
has a positive impact on the repeat purchase of same company product.
Table 4.36
Authorised after sales service * Repeat purchase. [Cross Tabulation]
Response Impact of company authorised after sales service on Repeat purchase. Total