CHAPTER 4: Health behaviour and Lifestyle CHAPTER 4: Health behaviour and Lifestyle Physical acvity declines across adolescence. By age 13-15, only 14% of boys and 8% of girls achieve one hour of exercise a day. A total of 37% of 11-16 year olds walk to school. Young women aged 11-18 consume 2.7 porons of fruit and vegetables daily, compared with 3 for young men, and 4.1 for adults. The Health Survey for England 2012 esmated that one fiſth of 11-15 year olds were obese. Similar rates were reported in the Naonal Child Measurement Programme for 10-11 year olds. Rates have levelled out in recent years but the trends are not clear. 8% of 15 year olds say they are regular smokers. 22% of 11-15 year olds say they have tried smoking. Smoking in this age group has halved since the mid 1990s. However one third of those aged 16-24 are sll regular smokers. Esmates of secondary school children who have tried e-cigarees range from one in 12 to one in five. 9% of pupils aged 11-15 say they have drunk alcohol in the last week – the lowest rate since the 1980s. Use of illegal drugs (largely cannabis) in the last year has also fallen, from 41% to 26% for 15 year old males, and from 36% to 22% for 15 year old females. Deaths caused by road traffic (either as driver, passenger or pedestrian) remains the largest cause of injury related deaths in 10-19 year olds. The average 16-24 year old spends 9 hours and 8 minutes every day on media and communicaons acvies. One quarter of secondary school children report they do not get enough sleep.
Transcript
CHAPTER 4: Health behaviour and Lifestyle
CHAPTER 4: Health behaviour and Lifestyle
� Physical activity declines across adolescence. By age 13-15, only 14% of boys and 8% of girls achieve one hour of exercise a day. A total of 37% of 11-16 year olds walk to school.
� Young women aged 11-18 consume 2.7 portions of fruit and vegetables daily, compared with 3 for young men, and 4.1 for adults.
� The Health Survey for England 2012 estimated that one fifth of 11-15 year olds were obese. Similar rates were reported in the National Child Measurement Programme for 10-11 year olds. Rates have levelled out in recent years but the trends are not clear.
� 8% of 15 year olds say they are regular smokers. 22% of 11-15 year olds say they have tried smoking. Smoking in this age group has halved since the mid 1990s. However one third of those aged 16-24 are still regular smokers.
� Estimates of secondary school children who have tried e-cigarettes range from one in 12 to one in five.
� 9% of pupils aged 11-15 say they have drunk alcohol in the last week – the lowest rate since the 1980s.
� Use of illegal drugs (largely cannabis) in the last year has also fallen, from 41% to 26% for 15 year old males, and from 36% to 22% for 15 year old females.
� Deaths caused by road traffic (either as driver, passenger or pedestrian) remains the largest cause of injury related deaths in 10-19 year olds.
� The average 16-24 year old spends 9 hours and 8 minutes every day on media and communications activities.
� One quarter of secondary school children report they do not get enough sleep.
56 AYPH | Key Data on Adolescence 2015
CHAPTER 4: Health behaviour and Lifestyle
Health behaviour and Lifestyle
Chart 4.1 Proportion of young
people aged 8-15 meeting physical activity recommendations by age
and sex, Health Survey for England 2012
Source: Craig and Mindell (2012), Health Survey for England, 2011 » Download data
50
45
35
25
40
30
20
10
15
5
08-10 11-12 13-15
Boys
Girls
Age
Promoting healthy lifestyles is very important in adolescence. This age marks the beginning of risk taking and is a time when life-long health behaviours are set in place. Health behaviours can directly affect health outcomes. In the longterm these may include cancer, heart disease and Type 2 diabetes. Prevention and early intervention are not just relevant for young children; they are equally possible in adolescence (Hagell and Rigby, 2015). Understanding patterns of adolescent health behaviour informs health promotion and healthcare commissioning and can prevent longterm difficulties from arising or escalating. The key topics of adolescent health behaviour include physical activity, nutrition and obesity, substance use, risky behaviour, accidents, media and communication activities, and sleep. Sexual health is also critically important and this is the subject of Chapter 5.
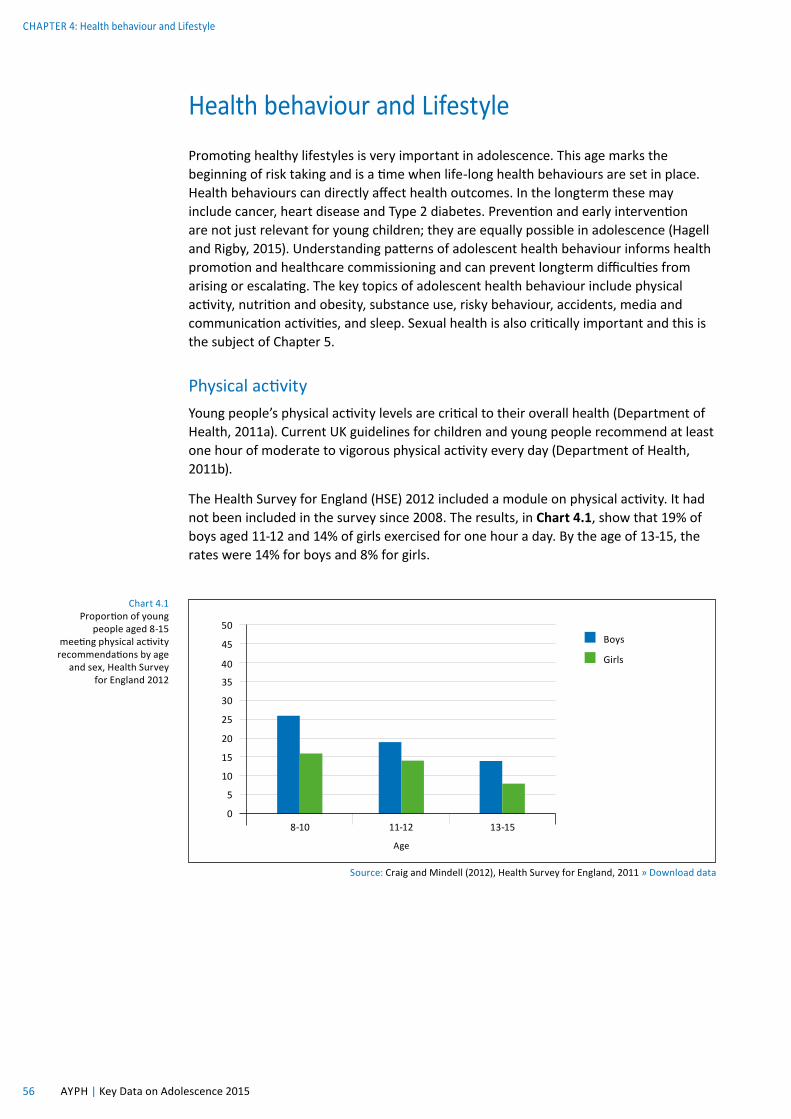
Physical activityYoung people’s physical activity levels are critical to their overall health (Department of Health, 2011a). Current UK guidelines for children and young people recommend at least one hour of moderate to vigorous physical activity every day (Department of Health, 2011b).
The Health Survey for England (HSE) 2012 included a module on physical activity. It had not been included in the survey since 2008. The results, in Chart 4.1, show that 19% of boys aged 11-12 and 14% of girls exercised for one hour a day. By the age of 13-15, the rates were 14% for boys and 8% for girls.
Chart 4.2 Proportion of young people aged 11-15 meeting physical activity recommendations in England, by age and gender, HBSC survey 2014
Source: Brooks et al (2015) HBSC England National Report » Download data
50
40
30
20
10
011 13 15
Males
Females
Age
Chart 4.3 Young people aged 11-15 meeting recommended activity levels in England, by age and gender, 2008-2012
Source: Craig and Mindell (2012), Health Survey for England, 2011 » Download data
50
40
30
20
10
0Boys 2008 Boys 2012 Girls 2008 Girls 2012
8-10 yrs
11-12 yrs
13-15 yrs
A similar question was asked in the 2014 Health Behaviour in School Aged Children Survey (HBSC). Despite using slightly different age groups, Chart 4.2 shows the results were very similar. Both these surveys show how physical activity declines across adolescence and they also tend to show much lower levels of activity for young women.
Both the HSE and the HBSC surveys have repeated information over time allowing us to see whether physical activity is increasing or decreasing. Chart 4.3 suggests there was a fall between 2008 and 2012 as measured in the HSE, for both genders and all age groups except the girls aged 11-12.
Source: Health Survey for England 2012: Physical Activity and Fitness. Health and Social Care Information Centre » Download data
Boys 8-10 Boys 11-12 Boys 13-15 Girls 8-10 Girls 11-12 Girls 13-15
Walking
Informal sports, exercise, active play
Formal sports & activities
Age
Percentage
10
20
30
40
50
60
70
80
90
100
0
Much formal physical activity is centred on school sport. The Department for Education has not repeated its Physical Education and Sport Survey since 2009/10. In 2010, 33% of girls and 25% of boys aged 15-16 reported that they met the targets, for three hours of high quality PE and out of hours school sport in England. Given the trends suggested in the previous charts, we might predict that these proportions may have fallen, but new data are needed.
Chart 4.4 presents data on different kinds of physical activity (walking, informal activity and formal activity). This shows that while rates of walking and informal activity are broadly comparable for boys and girls, girls have lower rates of formal physical activity, particularly among the older age group. However, rates of participation are much higher in this chart than in the previous two; it may be that many young people are participating in these activities to some extent, but not to the level of one hour per day as required by the guidelines.
Source: Department for Transport, National Travel Survey 2013 » Download data
Chart 4.5 Trips to school by main mode for young people aged 11-16, Great Britain, 2012
Rail & other modes
Bicycle
Car
Bus
Walk
5% 2%
23%37%
Chart 4.6 Proportion of young people aged 17-20 holding a full driving licence, Great Britain, 1975/6-2013
Source: Department for Transport, National Travel Survey 2013 » Download data
1975/6 1985/6 1995/7 2005 2011 2012 2013
Percentage
10
20
30
40
50
60
70
80
90
100
0
As shown in Chart 4.4, much of the exercise that young people get is walking to and from school or college. Drawing on data from the Department of Transport’s National Travel Survey, Chart 4.5 shows that 37% of trips to school in the UK by young people aged 11-16 are made on foot, with the rest using buses or cars. Only a very small proportion travel to school by rail (5%) or cycle (2%).
Public transport and walking clearly have a big role to play in daily physical activity for this age group. As they get older, driving themselves plays only a small role, unlike in countries such as the USA. At the time of writing, young people can take a driving test at age 17 years. However, the trend for those aged 20 or under to hold a full driving licence has been falling since the mid 1990s. As Chart 4.6 shows, less than one third of this age group held a licence.
Nutrition and obesityAdolescent nutrition is an area of increasing concern because of the relationship to obesity. Young people have more control over what they consume as they get older. Again, habits of a lifetime can be formed at this stage and poor nutrition has many implications for both current and future health status. Improving diet is a key indicator in the Public Health Outcomes Framework (Department of Health, 2012).
Consumption of five portions of fruit and vegetables a day has become a marker for good diet. As we can see in Chart 4.7, average daily consumption of ‘five a day’ for females aged 11-18 years was reported to be 2.7 and for males the figure was 3. Adults averaged 4.1 portions.
Chart 4.7 Average daily
consumption of ‘five a day’ fruit
and vegetable portions in the UK, by age and gender,
2008/9-2011/12
Source: Public Health England: National Diet and Nutrition Survey Results 2008/09 - 20011/1 » Download data
The Health Behaviour of School Aged Children study also used broader measures that indicated that 38% of young people aged 11-15 reported eating fruit every day, and 43% reported eating at least one vegetable every day. That still leaves a majority of young people who do not eat fruit or vegetables daily. Levels were similar for boys and girls. One in eight (13%) also reported daily consumption of sugary carbonated drinks, and 7% were consuming energy drinks at least five times a week (Brooks et al, 2015).
38% OF YOUNG PEOPLE AGED 11-15 EAT FRUIT EVERY DAY
Source: Public Health England: National Diet and Nutrition Survey Results 2008/09-2011/12 » Download dataNB Estimate of the amount of nutrient needed to maintain good health
LRNI set at a level of intake likely to be sufficient to meet the needs of only 2.5% of the populationBased on limited data, indicative only
PercentageChart 4.8 Proportion of young people 11-18 with average daily intakes of minerals below the Lower Reference Nutrient Intake in the UK, by gender, 2008/9-2011/12
The National Diet and Nutrition Survey used dietary diaries and other methods to estimate the proportion of young people aged 11-18 years with low levels of daily intake of various minerals. As a baseline, the survey uses the Lower Reference Nutrient Intake, which is a level of intake likely to be sufficient to meet the health needs of only 2.5% of the population, so it is a conservative measure of adequate intake. Chart 4.8 shows that worryingly high proportions of young men and young women do not appear to be consuming enough minerals. This is particularly the case for young women, of whom nearly half are estimated to be deficient in their iron, selenium (an essential trace mineral) and magnesium intake. These estimates are indicative only, as these are difficult data to collect, but they do alert us to the need to consider adolescent nutrition as a whole and they raise a particular concern about the nutrition of young women.
among 11-15 year olds in England, by gender, 1995-2013
Source: Health and Social Care Information Centre, Health Survey for England » Download data
0
19951996
19971998
19992000
20012002
20032004
20052006
20072008
20092010
20112012
2013
Percentage
30
25
20
40
15
35
10
5
Males
Females
One of the consequences of poor nutrition is obesity. Reducing excess weight in 10-11 year olds is a ‘health improvement’ indicator in the Public Health Outcomes Framework (Department of Health, 2012). Reducing obesity is one of Public Health England’s seven key priorities for 2015-16. Chart 4.9 provides an overview of trends in obesity prevalence in 11-15 year olds since 1995, drawing on data from the Health Survey for England. According to these data, obesity peaked in 2004 at 24.3% for boys, and 26.7% for girls. By 2013 the respective rates were 20.4% and 19.4%. This measurement of obesity is based on the UK national BMI percentiles classification. BMI measurements that fall into or above the 95th percentile of the 1990 reference population are classified as obese. Overall, obesity levels in England for this age group have levelled out in recent years, but the trends are not very clear.
Separate estimates for obesity at age 10-11 are provided by the National Child Measurement Programme (NCMP). The latest data from the programme showed that one in five children of this age (19.1%) were obese (HSCIC, 2014a), very similar rates to those found in the Health Survey for England. Chart 3.8 in Chapter 3 presented obesity by deprivation (school area), using the NCMP measurements. This showed that obesity rates in the most deprived decile were 25% compared with 13% in the least deprived decile (HSCIC, 2014a).
Estimates of obesity in children for Wales and Scotland are available from their own health surveys, including the Scottish Health Survey 2013 and the Public Health Wales Measurement Programme (latest data 2012/13). However, the data tend to be presented for age 2-15 years and 16 to 24 years (as in the Scottish Health Survey), or for primary school only (such as in the Scottish school BMI survey), and are not available
Chart 4.10 Body mass index (BMI) prevalence of overweight and obesity, 11-18 year olds in the UK, by gender, 2008/9- 2011/12
Source: Public Health England: National Diet and Nutrition Survey Results 2008/09-20011/12 » Download data
Males 11-18
Females 11-18
0 10 20 30 40 50Percentage
Over 85th centile (overweight, inc obese)
Over 95th centile (obese)
beyond 2012 or 2013, limiting comparability. The HSCIC has concluded that obesity prevalence for children in Scotland aged 2-15 was 16% in 2013, and had been stable at that level for around five years. Similarly, the estimate for obesity in 2-15 year olds in Wales in 2012 was 19% (HSCIC, 2015). The latest reports from the 2014 HBSC in Wales and Scotland had not been published at the time of writing.
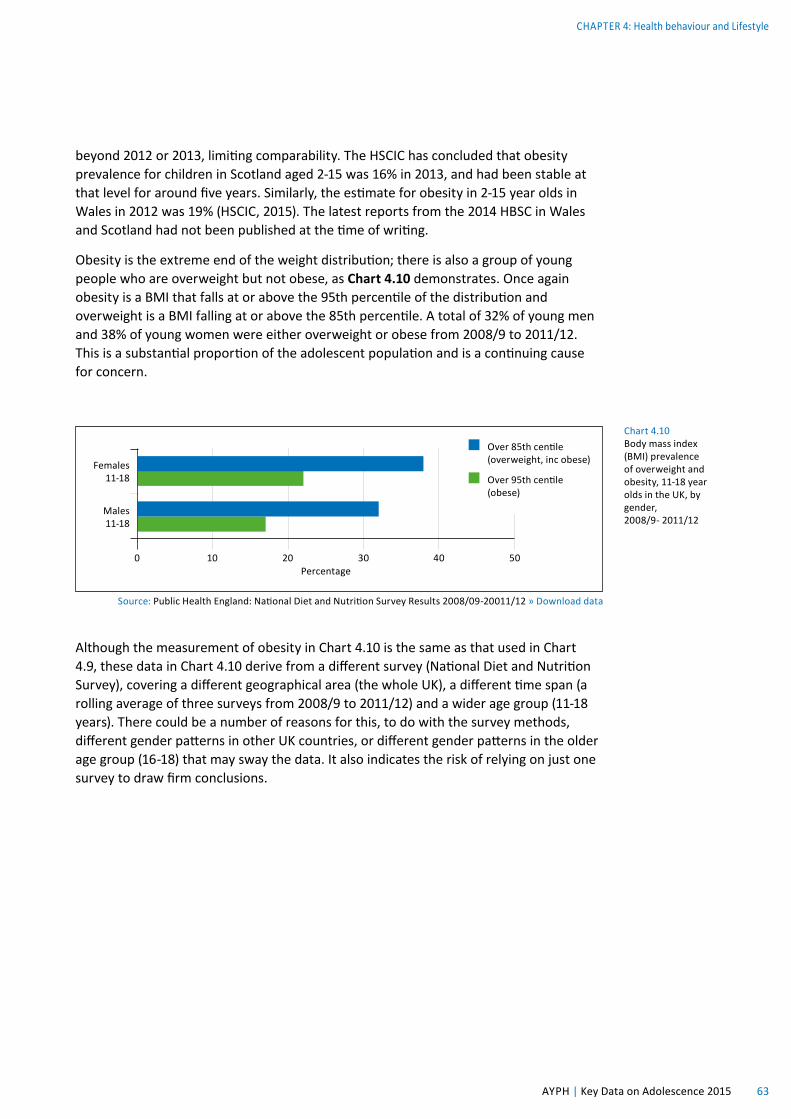
Obesity is the extreme end of the weight distribution; there is also a group of young people who are overweight but not obese, as Chart 4.10 demonstrates. Once again obesity is a BMI that falls at or above the 95th percentile of the distribution and overweight is a BMI falling at or above the 85th percentile. A total of 32% of young men and 38% of young women were either overweight or obese from 2008/9 to 2011/12. This is a substantial proportion of the adolescent population and is a continuing cause for concern.
Although the measurement of obesity in Chart 4.10 is the same as that used in Chart 4.9, these data in Chart 4.10 derive from a different survey (National Diet and Nutrition Survey), covering a different geographical area (the whole UK), a different time span (a rolling average of three surveys from 2008/9 to 2011/12) and a wider age group (11-18 years). There could be a number of reasons for this, to do with the survey methods, different gender patterns in other UK countries, or different gender patterns in the older age group (16-18) that may sway the data. It also indicates the risk of relying on just one survey to draw firm conclusions.
weight, 11-15 year olds in England, by gender, 2012
Source: Health Survey for England 2012 » Download data
60
50
40
80
30
70
20
10
0Trying to lose weight Trying to gain weight Not trying to change
Percentage Males 11-15
Females 11-15
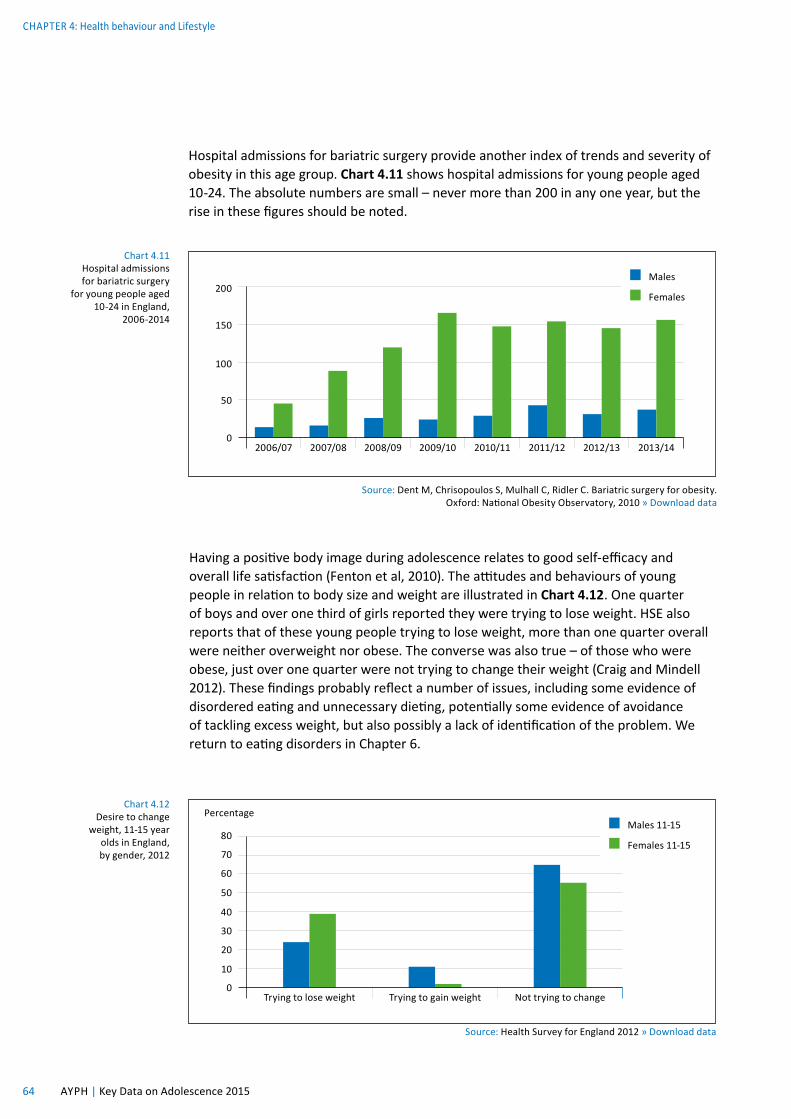
Hospital admissions for bariatric surgery provide another index of trends and severity of obesity in this age group. Chart 4.11 shows hospital admissions for young people aged 10-24. The absolute numbers are small – never more than 200 in any one year, but the rise in these figures should be noted.
Source: Dent M, Chrisopoulos S, Mulhall C, Ridler C. Bariatric surgery for obesity. Oxford: National Obesity Observatory, 2010 » Download data
Chart 4.11 Hospital admissions for bariatric surgery
for young people aged 10-24 in England,
2006-2014
Having a positive body image during adolescence relates to good self-efficacy and overall life satisfaction (Fenton et al, 2010). The attitudes and behaviours of young people in relation to body size and weight are illustrated in Chart 4.12. One quarter of boys and over one third of girls reported they were trying to lose weight. HSE also reports that of these young people trying to lose weight, more than one quarter overall were neither overweight nor obese. The converse was also true – of those who were obese, just over one quarter were not trying to change their weight (Craig and Mindell 2012). These findings probably reflect a number of issues, including some evidence of disordered eating and unnecessary dieting, potentially some evidence of avoidance of tackling excess weight, but also possibly a lack of identification of the problem. We return to eating disorders in Chapter 6.
Chart 4.13 Proportion of 11-15 year olds in England who were regular smokers, by gender, 2014
Source: HSCIC (2015b), Smoking, Drinking and Drug Use Among Young People in England in 2014 » Download data
NB Regular smoking means smoking at least one cigarette a week
15 years
14 years
13 years
11 years
12 years
0 2 4 6 8 10 12 14 16Percentage
Males
Females
Smoking, drinking and drug useSmoking causes one in five deaths in people aged over 35 (HSCIC, 2014b). It is the primary cause of preventable illness and premature death. Concern about levels of smoking among young people arises from awareness about the longer term outcomes such as cancer, but alsothe shorter-term negative effects such
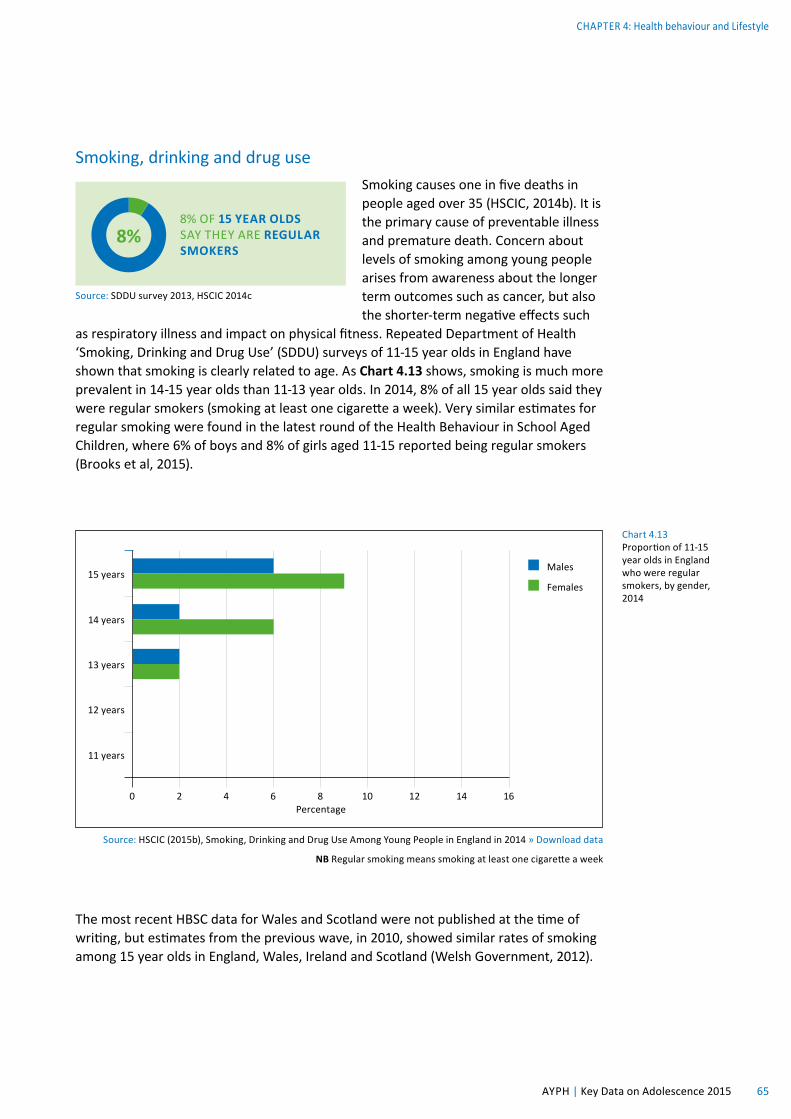
as respiratory illness and impact on physical fitness. Repeated Department of Health ‘Smoking, Drinking and Drug Use’ (SDDU) surveys of 11-15 year olds in England have shown that smoking is clearly related to age. As Chart 4.13 shows, smoking is much more prevalent in 14-15 year olds than 11-13 year olds. In 2014, 8% of all 15 year olds said they were regular smokers (smoking at least one cigarette a week). Very similar estimates for regular smoking were found in the latest round of the Health Behaviour in School Aged Children, where 6% of boys and 8% of girls aged 11-15 reported being regular smokers (Brooks et al, 2015).
8% OF 15 YEAR OLDS SAY THEY ARE REGULAR SMOKERS
Source: SDDU survey 2013, HSCIC 2014c
8%
The most recent HBSC data for Wales and Scotland were not published at the time of writing, but estimates from the previous wave, in 2010, showed similar rates of smoking among 15 year olds in England, Wales, Ireland and Scotland (Welsh Government, 2012).
Drawing on SDDU data, Charts 4.14 and 4.15 portray a positive picture of the longterm trends for smoking behaviour. Chart 4.13 shows 22% of pupils said they had ever smoked, less than half the rate in the mid 1990s. Chart 4.14 shows regular smokers, and the trajectory is very similar, with 2013 rates (3% overall for all pupils 11-15) again being the lowest since the mid 1990s. The introduction of a smoking ban in public places came into force in England in July 2007 and may have had some impact on the figures, although there was no noticeable acceleration in the downward trend at the time.
22% OF PUPILS AGED 11-15 SAY THEY HAVE TRIED SMOKING
Source: SDDU survey 2013, HSCIC 2014c
22%
Source: HSCIC (2015b), Smoking, Drinking and Drug Use Among Young People in England in 2014 » Download data
Chart 4.14 Proportions of 11-15 year olds in England
who have ever smoked, by gender,
1982-2014
19821984
19861988
19901992
19941996
19982000
20022004
20062008
20102012
20132014
Percentage
5
10
15
20
25
30
35
45
40
50
55
60
0
Males
Females
Source: HSCIC (2015b), Smoking, Drinking and Drug Use Among Young People in England in 2014 » Download data
These downward trends are also apparent in the older age groups from 16-19 years and 20-24 years, demonstrated in Charts 4.16 and 4.17. The gender patterns in these older age groups are not consistent; sometimes more young women smoke, sometimes more young men, but the overall trend is positive. However, there is no room for complacency. The fact that nearly one third of those aged 16-24 are regular smokers is still a serious concern.
Source: Statistics on Smoking, England – 2014, Health and Social Care Information Centre » Download data
19821980
19841986
19881990
19921994
19961998
20002002
20042006
20082010
20112012
Percentage
5
10
15
20
25
30
35
45
40
50
0
Males
Females
Chart 4.17 Proportions of 20-24 year olds in England who smoke, by gender, 1980-2012
Source: Statistics on Smoking, England – 2014, Health and Social Care Information Centre » Download data
19821980
19841986
19881990
19921994
19961998
20002002
20042006
20082010
20112012
Percentage
5
10
15
20
25
30
35
45
40
50
0
Males
Females
Chart 4.16 Proportions of 16-19 year olds in England who smoke, by gender, 1980-2012
Finally, robust, nationally representative data on use of e-cigarettes are not available yet. The charity Action on Smoking and Health (ASH) is undertaking regular YouGov surveys of 2,000 young people aged 11-18. The latest survey concluded that the proportion of 11-18 year olds who had ever tried an electronic cigarette increased from 5% in 2013 to 8% in 2014 (ASH, 2014). Other surveys give higher estimates. Moore et al (2015) report from two nationally
representative Welsh datasets that, overall, 12.3% of secondary school students (11-16) reported ever using e-cigarettes. However only 1.5% reported regular e-cigarette use. In a large survey of 14-17 year old secondary school children in the North West of England, Hughes et al (2015) report that 19% had accessed e-cigarettes. Of those using e-cigarettes, 16% had never smoked before. A further 23% of e-cigarette smokers were young people who had tried conventional smoking but had not liked it. The authors concluded that e-cigarettes are being accessed by teenagers more for experimentation than smoking cessation. However, more research is needed before we can say anything with any confidence. The concern about e-cigarettes is that they are being designed and marketed to attract young people, they are unregulated so can be bought by under-18s and contain nicotine which is known to be highly addictive.
Adolescent alcohol consumption patterns have been a concern for many years, but as with conventional smoking the recent data are encouraging. The ‘Smoking, Drinking and Drug Use’ surveys of 11-15 year olds in England regularly show that the proportions of young people who drink alcohol has been falling. The latest data suggest that 61% of those aged 11-15 say they have never drunk alcohol. Around one in eleven (9%) report that they had drunk alcohol in the last week. This is the lowest rate at any time since the SDDU survey began in 1988 (HSCIC, 2014c).
ESTIMATES OF SECONDARY SCHOOL CHILDREN WHO HAVE
TRIED E-CIGARETTES RANGE FROM ONE IN 12
TO ONE IN FIVE
Source: ASH, 2014; Moore et al, 2015; Hughes et al, 2015
9% OF PUPILS AGED 11-15 SAY THEY HAVE DRUNK ALCOHOL IN THE LAST WEEK
Source: SDDU survey 2013, HSCIC 2014c
9%
CHAPTER 4: Health behaviour and Lifestyle
69 AYPH | Key Data on Adolescence 2015
Chart 4.18 Prevalence of drinking alcohol in the last week, by age, 2003-2014
Source: HSCIC (2015b), Smoking, Drinking and Drug Use Among Young People in England in 2014 » Download data
Chart 4.18 shows, the majority of those drinking alcohol are 14 and 15 years old. The rise in drinking at age 13-14 may make school Year 9 a potentially important group to target with alcohol related health promotion interventions. Among the 15 year olds, 22% reported drinking in the previous week – slightly more males than females (25% compared with 19%).
Chart 4.19 shows the average number of units drunk by those pupils aged 11-15 who drank in the last week. This has fluctuated in recent years although the overall trend has been down.
Chart 4.19 Mean alcohol consumption (units) in the last week by pupils who had drunk, in England, by gender, 2007-2014
Source: HSCIC (2015b), Smoking, Drinking and Drug Use Among Young People in England in 2014 » Download data
aged 16-24 years drinking on 5 days per week or more,
Great Britain, 1998-2013
Source: Office for National Statistics, Opinions and Lifestyle Survey, Adult Drinking Habits in Great Britain, 2013 » Download data
19982000
20012002
20032004
20052006
20072008
20092010
20112012
2013
Percentage
2
4
6
8
10
12
14
18
16
20
0
Males
Females
Being drunk is a key indicator of alcohol misuse. HBSC reports that among the 10% of 15 year olds in the study who report being weekly drinkers, 83% of the boys and 57% of the girls had been drunk ten times or more in the last month (Brooks et al, 2015). This suggests there is a small group of young people who are not following the general trend of reducing consumption.
In 2012 the survey for collecting drinking data on people aged 16 and over in the UK changed from the General Lifestyle Survey to the Opinions and Lifestyle Survey (OLS). According to the OLS, in 2012 half of the age group (50% of men and 48% of women) reported drinking in the last week. Chart 4.20 shows that two per cent drank on five or more days in the week. Young adult drinkers are more likely to have drunk heavily than older age groups, measured as more than eight units on one occasion in the previous week for men, and six units over the same period for women. Without a survey covering both the 11-15 and 16+ age groups (and for the same year), it is hard to tell whether there is an increase in drinking in the late teens or not.
However there is evidence of a fall over time in regular drinking in this 16-24 age group.
There is a considerable amount of data relating to substance and illegal drug use among young people. However, not all findings are consistent as this is a challenging area to research and self report studies have obvious potential limitations. Chart 4.21 reports on drug use. Overall, there had been a downward trend, with a fall from 41% to 26% for males, and from 36% to 22% for females. The chart illustrates an increase in use from the younger to older teens, as with alcohol and smoking. Overall, in 2011, 3% of 11 year olds reported that they had taken a drug in the previous year, rising to one quarter of 15 year olds.
Source: HSCIC (2015b), Smoking, Drinking and Drug Use Among Young People in England in 2014 » Download data
NB: Drugs include amphetamines, anabolic steroids, cannabis, cocaine, crack, ecstasy, heroin, ketamine, LSD, magic mushrooms, methadone, poppers (eg, amyl nitrite) tranquillisers, volatile substances such as gas,
glue, aerosols and other solvents, and other non-prescription drugs.
Chart 4.21 Proportion of pupils in England who had used illegal drugs in the last year, by age and gender, 2001-2014
Percentage
5
10
15
20
25
30
35
45
40
50
0
Males age 11
Females age 11
Males age 15
Females age 15
20012002
20032004
20052006
20072008
20092010
20112012
20132014
Concern often centres on young people who take several substances, as an indicator of particularly problematic use. Chart 4.22 gives a summary of drug use, showing cannabis on its own is the most common form of usage. Young people were unlikely to report using a Class A drug on its own without using another drug as well.
Chart 4.22 Summary of drugs taken in the last year, 15 year olds by gender, England 2014
Source: SHSCIC (2015b), Smoking, Drinking and Drug Use Among Young People in England in 2014 » Download data
Source: HSCIC (2015b), Smoking, Drinking and Drug Use Among Young People in England in 2014 » Download data
60
40
80
100
20
0Taken any
drugsSmoked
cigarettesDrunk
alcoholEver done
any of theseNever done any of these
Percentage Age 11
Age 13
Age 15
Pulling together use of all different kinds of substances, including nicotine, alcohol and illegal drugs, Chart 4.23 shows 87% of 11 year olds had never done any of these activities (HSCIC, 2014c). This drops to 22% of 15 year olds. A number of young people will report a range of risky health behaviours at the same time. It has long been known that the clustering of multiple risky behaviours in youth predicts worse outcomes (eg, Elliott et al, 1989).
Finally, a note about legal highs, which are designed to copy the effect of illegal drugs but are chemically different enough to avoid the law and are not regulated. The term covers a range of substances including stimulants and sedatives, long and short acting. Risks to young people come from toxicity and the use of combined, untested ingredients. These substances constitute a moving target, in that drugs that fell into the legal high category become illegal as the law catches up; such as Mephedrone, Gammahydroxybutrate and Benzylpiperazine which are all now classified as illegal. The European Monitoring Centre for Drugs and Drug Addiction identified 73 new psychoactive substances in 2012 alone (EMCDDA 2013), the largest number in any year so far. They also reported that there were 693 internet shops selling legal highs to consumers in the EU in 2012, 100% more than the previous year. Reliable representative data on prevalence of use are limited, but in 2013 the UN Office of Drugs and Crime estimated the number of people in the UK aged between 15 and 24 who had tried illegal highs could be in excess of 500,000 (UNODC, 2013). While this cannot be verified, it is important to note the role and risks posed by legal highs which fall outside existing surveys.
Source: European Child Safety Alliance, RoSPA, Birmingham » Download data
Chart 4.24 Injury related deaths by specific cause in adolescents 10-19 years, 3-year average age standardised death rates, England, 2007-2009
Three year standardised death rates per 1000Males 10-14
Males 15-19
Females 10-14
Females 15-19
Homicide 0.02 0.35 0.07 0.16
Fires, burns, scalds 0.04 0.08 0.02 0.02
Motorcycle drivers 0.08 2.70 0.00 0.04
Poisoning 0.15 1.17 0.07 0.56
Falls 0.17 0.54 0.02 0.10
Suicide/self-inflicted 0.17 3.27 0.13 0.97
Drowning 0.21 0.84 0.02 0.00
Cyclists 0.45 0.39 0.09 0.10
Motor vehicle driver/passengers 0.55 10.55 0.25 3.01
Choking/strangulation 0.62 0.68 0.25 0.27
Pedestrians 0.77 1.81 0.60 0.70
AccidentsThe highest rate of unintentional injury or death occurs in young men aged 15-19 years, more than any other age of childhood (European Child Safety Alliance, 2012). Accidents at this age are therefore an important part of the picture of health, and may be affected in part by behaviour.
Chart 4.24 shows the large relative proportion of deaths among 15-19 year old males caused by being a driver or passenger in a motor vehicle. There is a death rate of 10.55 per 100,000 for this age group from this cause per annum. Driving related events are also the largest cause of death by accidents for females in this age group (at 3.01 per 100,000).
In recent analyses of the 2013 Department for Transport road casualties statistics, Public Health England estimated that there was an average of 463 deaths recorded by the police among road users under 25 years every year, and an average of 13,731 admissions to hospital as a result of road traffic injuries (PHE, 2014). Drawing on both road traffic statistics and mid-year population estimates, they calculated that the rate of fatal and serious injuries for 10-14 year olds was significantly greater for children from the 20% most deprived areas (37 per 100,000) compared with those from the most affluent areas (10 per 100,000).
Source: British Audience Research Board » Download data
2004 2005 2006 2007 2008 2009 2010 2011 2012 2013
Average minutes per day
0
50
100
150
200
250
300 Age 4-15
Age 16-24
Age 45-54
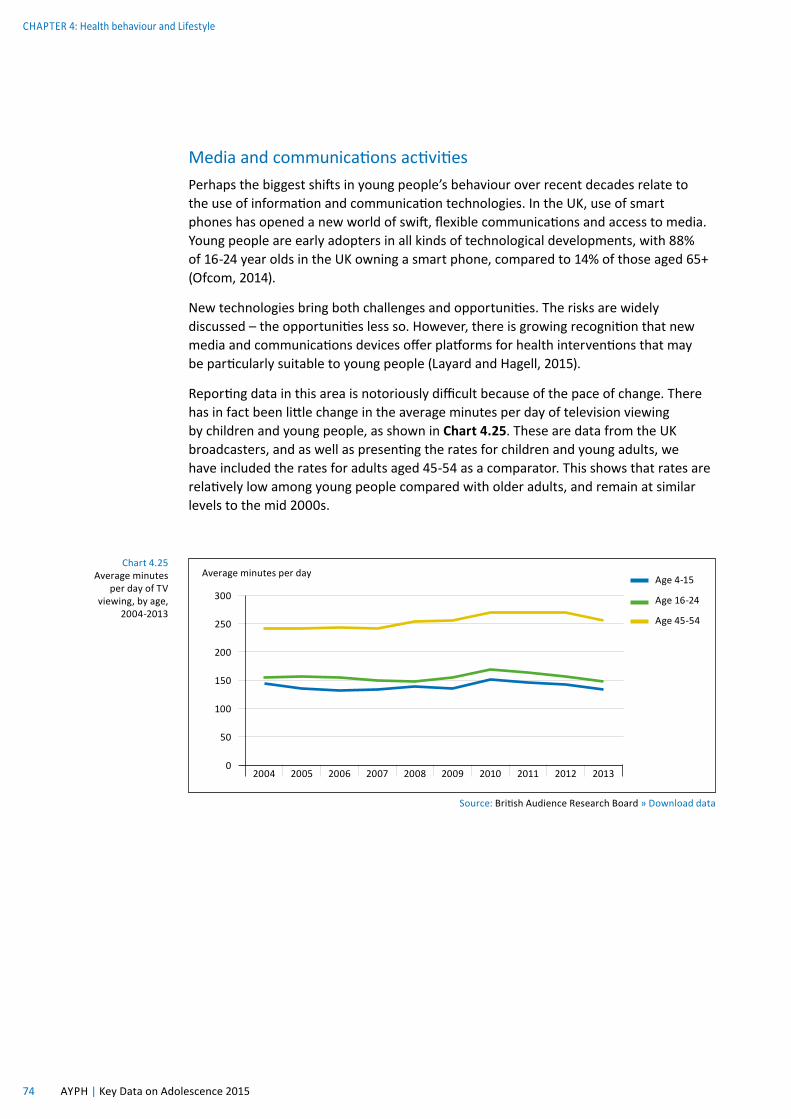
Media and communications activitiesPerhaps the biggest shifts in young people’s behaviour over recent decades relate to the use of information and communication technologies. In the UK, use of smart phones has opened a new world of swift, flexible communications and access to media. Young people are early adopters in all kinds of technological developments, with 88% of 16-24 year olds in the UK owning a smart phone, compared to 14% of those aged 65+ (Ofcom, 2014).
New technologies bring both challenges and opportunities. The risks are widely discussed – the opportunities less so. However, there is growing recognition that new media and communications devices offer platforms for health interventions that may be particularly suitable to young people (Layard and Hagell, 2015).
Reporting data in this area is notoriously difficult because of the pace of change. There has in fact been little change in the average minutes per day of television viewing by children and young people, as shown in Chart 4.25. These are data from the UK broadcasters, and as well as presenting the rates for children and young adults, we have included the rates for adults aged 45-54 as a comparator. This shows that rates are relatively low among young people compared with older adults, and remain at similar levels to the mid 2000s.
What has changed relates more to online (internet based) activity. In Chart 4.26 the most common daily online activities are presented for 11-13 year olds and 14-15 year olds.
Access to social networking sites has risen substantially in recent years as shown in Chart 4.27.
Chart 4.26 Daily online activites by age in the UK, 2013
Source: Livingstone et al (2014) Net children go mobile: The UK report » Download data
Visited a
socia
l
networki
ng pro
file
Watched vi
deo clips
Used in
stant m
essaging
Used th
e intern
et
for sch
oolwork
Downloaded music
or film
s
Read/watch
ed the news
Used file sh
aring s
ites
Put photos, v
ideos
or music
to sh
are
Put a m
essage
on a websit
e
Played games
with other p
eople
Used a
webcam
Visited a
chatro
om
Spent ti
me in
a virt
ual world
Created a ch
aracter,
pet or a
vatar
Percentage
10
20
30
40
50
60
70
80
90
100
0
11-13 years
14-16 years
Chart 4.27 Proportion of 16-24 year olds who access social networking sites on the internet at home
Source: Ofcom (2014) The Communications Market Report » Download data
Source: Balding and Regis (2014), Young People into 2014 » Download data
60
100
50
90
40
80
30
70
20
10
0Year 8 female Year 8 male Year 10 female Year 10 male
Percentage Yes
No
The 16-24 age group spend the most time of all ages on media and communications, cramming over 14 hours of activity into 9 hours and 8 minutes of time every day by multitasking, using different media and devices at the same time (Ofcom, 2014). This age group use their smartphones for 3 hours and 36 minutes per day, compared to the adult average of 1 hour and 22 minutes.
SleepWe conclude with sleep. Adolescent sleep is an important topic that has been receiving more interest in recent years, as it becomes obvious that poor sleep (insufficient sleep and poor quality sleep) may be both the cause and the result of health problems. For example, sleep deficiency has been identified as a contributing factor in road traffic accidents (AYPH, 2012). There are also links with the previous topic, as overuse or particularly late evening use of smart phones, tablets and computers have been linked to sleep disturbances in this age group (Lemola et al, 2015).
However, there are very few representative survey data on adolescent sleep. The Exeter Schools Survey Unit undertakes a series of surveys in schools (Balding and Regis, 2014), including a question on whether young people get adequate sleep to cope at school. Chart 4.28 shows that approximately one quarter of secondary school students say they do not get enough sleep to concentrate and stay alert.
THE AVERAGE 16-24 YEAR OLD SPENDS
9 HOURS AND 8 MINUTES EVERY DAY ON MEDIA
AND COMMUNICATIONS ACTIVITIES
Source: Ofcom, 2014
Similar rates of adequate sleep are also reported in the most recent HBSC study, with 22% of 11-15 year olds reporting that they did not get enough sleep. Rates of adequate sleep decrease as age goes up (Brooks et al 2015).
References Action on Smoking and Health (2014) Use of electronic cigarettes in Great Britain. London: ASH
Atkinson A, Sumnall H and Bellis M (2012) Substance use among 15-16 year olds in the UK: Key findings from the 2011 European School Survey Project on Alcohol and Other Drugs (ESPAD). Liverpool: Liverpool John Moores University Centre for Public Health.
Balding and Regis (2014) Young People into 2014. Exeter: Schools Health Education Unit
Craig R and Mindell J (Eds) (2012) Health Survey for England, 2011. London: The Health and Social Care Information Centre
Department of Health (2011a) Start Active, Stay Active: A report on physical activity for health from the four home countries’ Chief Medical Officers. London: Department of Health
Department of Health (2011b) Physical activity guidelines for children and young people (5-18 years). London: Department of Health
Department of Health (2012) Healthy lives, healthy people: Improving outcomes and supporting transparency. Public Health outcomes Framework. London: Department of Health
Elliott D, Huizinga D and Menard S (1989) Multiple problem use: Delinquency, drugs and mental health problems. New York: Springer
European Child Safety alliance (2012) Child Safety Country Profile: England.
European Monitoring Centre for Drugs and Alcohol Addiction (2013) New drugs in Europe 2012. Portugal: EMCDDA
Fenton C, Brooks F, Spencer N and Morgan A (2010) Sustaining a positive body image in adolescence: an assets-based analysis. Health and Social Care in the Community, 18(2) 189-198
Hagell A and Rigby E (2015) Prevention and early intervention British Journal of School Nursing, 10(1)
Health and Social Care Information Centre (2014a) Statistics on obesity, physical activity and diet: England 2014. Leeds, HSCIC
Health and Social Care Information Centre (2014b) Statistics on Smoking in England, 2014. Leeds: HSCIC
Health and Social Care Information Centre (2014c) Smoking, drinking and drug use among young people in England in 2013. Leeds: HSCIC
Health and Social Care Information Centre (2015) Statistics on obesity, physical activity and diet. Leeds: HSCIC
Hughes K, Bellis M, Hardcastle K, McHale P, Bennett A, Ireland R and Pike K (2015) Associations between e-cigarette access and smoking and drinking behaviours in teenagers. BMC Public Health 15:244
Layard R and Hagell A (2015) Healthy young minds: Transforming the mental health of children. Report of the WISH Mental Health and Wellbeing I Children Forum 2015. Qatar: World Innovation Summit for Health
Lemola S, Perkinson-Gloor N, brand S, Dewald-Kaufmann J and Grob A (2015) Adolescents’ electronic media use at night, sleep disturbance, and depressive symptoms in the smartphone age. Journal of Youth and Adolescence, 2 405-418
Livingstone S, Haddon L, Vincent J, Mascheroni G and Olafsson K (2014) Net Children Go Mobile: The UK report. London: London School of Economics
Moore G, Hewitt G, Evans J, Littlecott H, Holliday J, Ahmed N, Moore L, Murphy S and Fletcher A (2015) Electronic cigarette use among young people in Wales: evidence from two cross-sectional surveys. BMJ Open, 5 e007072
Ofcom (2014) The Communications Market Report 2014
Public Health England (2014) Reducing unintentional injuries on the roads among children and young people under 25 years. London: PHE
Seifert S, Schaechter J, Hershorin E and Lipshultz S (2011) Health effects of energy drinks on children, adolescents and young adults. Pediatrics, 127(3) S11-S28
United Nations Office on Drugs and Crime (UNODC, 2012) World Drugs Report 2012. New York: United Nations
Welsh Government (2012) Tobacco and health in Wales. Cardiff: Welsh Government.
World Health Organisation (2011) Global recommendations on physical activity for health, 5-17 year olds.