Seoul National University Byeng D. Youn System Health & Risk Management Laboratory Department of Mechanical & Aerospace Engineering Seoul National University Chapter 4. Health Reasoning for Diagnosis (Non-Vibration based) Prognostics and Health Management (PHM)
Transcript
Seoul National University
Byeng D. YounSystem Health & Risk Management LaboratoryDepartment of Mechanical & Aerospace EngineeringSeoul National University
Chapter 4. Health Reasoning for Diagnosis (Non-Vibration based)Prognostics and Health Management (PHM)
Chapter 4. Health Reasoning for Diagnosis (Non-Vibration based)
Vibration Based Application
Non-Vibration Based Application
Journal Bearing Rotor
Ball Bearing
Planetary Gear Solenoid Valve
Insulated gate bipolar transistors
Power Transformer
Seoul National University2019/1/4 - 4 -
Non-Vibration Data
Chapter 4. Health Reasoning for Diagnosis (Non-Vibration based)
Non-Vibration Data
Pressure
Current, Voltage
Speed,RPM
Temperature
Gas Concentration
Humidity
Mean
Variance
Explicit Math
PCA
MahalanobisDistance
Correlation Analysis
⋮
<Power Transformer>
C2H4 Oil Temp
<IGBT>
<Solenoid Valve>
Ethy
lene
(ppm
)
Temperature(℃
)
V CE(
V)
V GE
(V)
Seoul National University2019/1/4 - 5 -
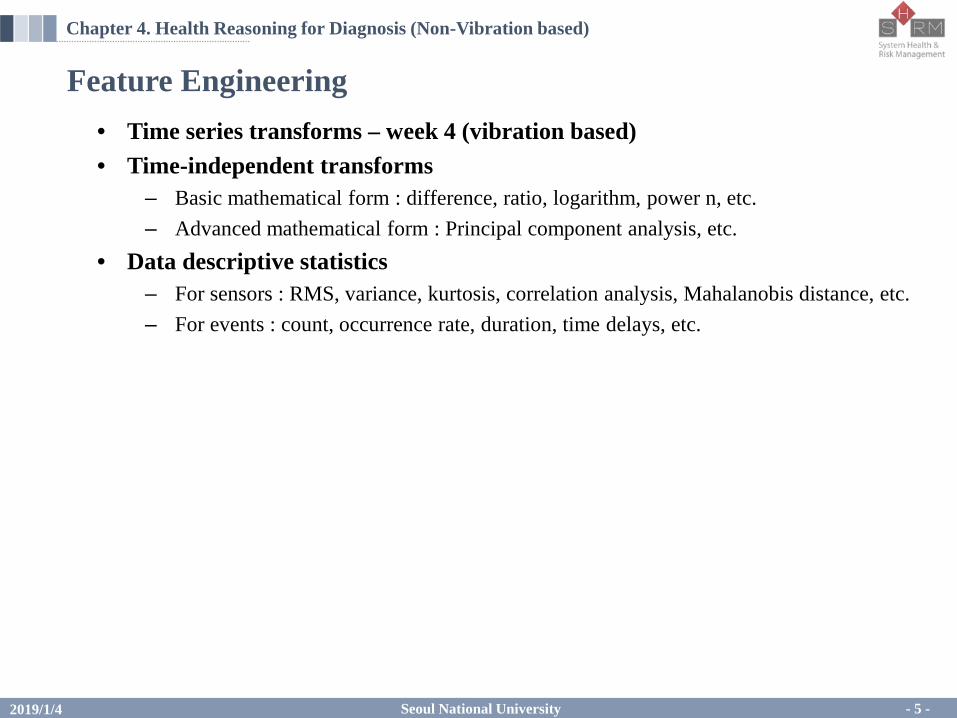
Feature Engineering• Time series transforms – week 4 (vibration based)• Time-independent transforms
– Basic mathematical form : difference, ratio, logarithm, power n, etc.– Advanced mathematical form : Principal component analysis, etc.
• Data descriptive statistics– For sensors : RMS, variance, kurtosis, correlation analysis, Mahalanobis distance, etc.– For events : count, occurrence rate, duration, time delays, etc.
Chapter 4. Health Reasoning for Diagnosis (Non-Vibration based)
Seoul National University2019/1/4 - 6 -
Chapter 4. Health Reasoning for Diagnosis (Non-Vibration based)
• Objective: To quantify the linear relationship between bivariate serial data• Results: Correlation coefficient quantifying the direction and strength of the linear
relationship between the two variables• Expectation: To find the efficient set of signals to analyze in priority• Methods:
• Notice:- Correlation coefficient is dimensionless- Invariant under separate changes in location and scale in the two data (e.g., 𝜌𝜌𝑋𝑋,𝑌𝑌=𝜌𝜌𝑋𝑋′,𝑌𝑌′,where X′ aX+b and Y′ cY+d)- Insufficient to detect non-linear relationship Spearman’s rank, Kendall tau coefficient
Chapter 4. Health Reasoning for Diagnosis (Non-Vibration based)
Seoul National University
• Example: Pressure data in chemical mechanical polishing (CMP)
2019/1/4 - 8 -
Correlation Analysis
Chapter 4. Health Reasoning for Diagnosis (Non-Vibration based)
1. Chamber pressure
2. Main outer air bag pressure
3. Center air bag pressure
4. Retainer ring pressure
5. Ripple air bag pressure
6. Edge air bag pressure
Correlation matrix
High correlation between 2, 3, 5, 6 Focus on 1, 4, 5 for analyzing
Schematic of CMP processRaw pressure data (Normalized)
CMP slurry
Seoul National University2019/1/4 - 9 -
Chapter 4. Health Reasoning for Diagnosis (Non-Vibration based)
Principal Component Analysis (PCA)• Objective: For a given integer 𝑘𝑘, the PCA computes the 𝑘𝑘-principal components of the
real valued data.• Results: To find best low dimensional space that conveys maximum useful information• Expectation: To extract new features with reduced dimension• Methods: To minimize the sum of squares of distance to the line = To maximize the sum
of squares of the projections on that line (variance of the projected data points)max 𝐗𝐗𝑇𝑇𝐁𝐁𝑇𝑇𝐁𝐁𝐗𝐗 , subject to 𝐗𝐗𝑇𝑇𝐗𝐗 = 1
where 𝐗𝐗: 𝑛𝑛 × 𝑘𝑘 matrix for the 𝑘𝑘 direction vectors (so that 𝐗𝐗𝑇𝑇𝐗𝐗 = 1) 𝐁𝐁: 𝑚𝑚 × 𝑛𝑛 matrix of the coordinates of the 𝑚𝑚 data points (after the mean centering)𝐁𝐁𝐗𝐗: the coordinates of the projection of m data points into the 𝑘𝑘 direction vectors X. 𝐗𝐗𝑇𝑇𝐁𝐁𝑇𝑇𝐁𝐁𝐗𝐗: the variance of the projected data points
𝑐𝑐
𝑉𝑉
𝑏𝑏
𝑉𝑉2 + 𝑏𝑏2 = 𝑐𝑐2 (𝑐𝑐𝑐𝑐𝑛𝑛𝑐𝑐𝑡𝑡. )
∴ min �𝑏𝑏2 = max �𝑉𝑉2 0 2 4 6 8 10
2
4
6
8
PC 1
PC 2
Origin
Seoul National University
-0.4 -0.2 0 0.2 0.4New Feature
-1
-0.5
0
0.5
1NormalFaulty
0.6 0.8 1 1.2 1.4 1.6Feature 1
0.6
0.8
1
1.2
1.4
1.6
Feat
ure
2
NormalFaulty
2019/1/4 - 10 -
Chapter 4. Health Reasoning for Diagnosis (Non-Vibration based)
Principal Component Analysis (PCA)• Example : Motor current signals
- Failure mode: Stator winding short - Feature 1: Root mean square (RMS)- Feature 2: Magnitude of fundamental frequency
𝐗𝐗 = (0.96,0.26)
Origin
Two features One features
Projection
Origin
Encoder
RotorShaft
Bearing
Stator WindingsPermanent Magnet
Stator Winding
Rotor
Seoul National University2019/1/4 - 11 -
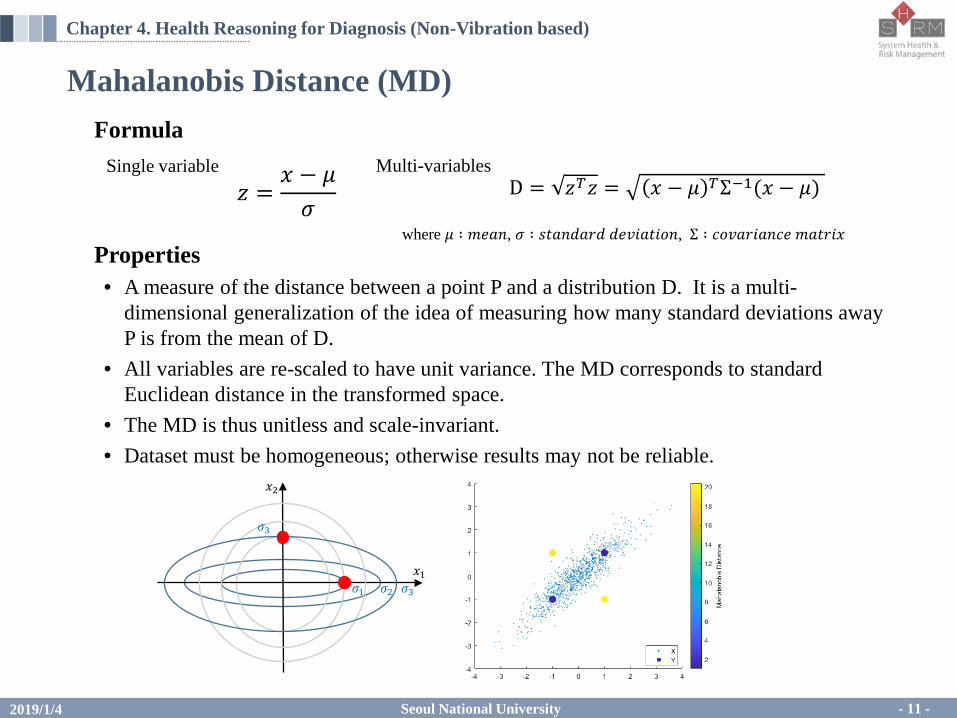
Mahalanobis Distance (MD)
D = 𝑧𝑧𝑇𝑇𝑧𝑧 = 𝑥𝑥 − 𝜇𝜇 𝑇𝑇Σ−1(𝑥𝑥 − 𝜇𝜇)
Properties• A measure of the distance between a point P and a distribution D. It is a multi-
dimensional generalization of the idea of measuring how many standard deviations away P is from the mean of D.
• All variables are re-scaled to have unit variance. The MD corresponds to standard Euclidean distance in the transformed space.
• The MD is thus unitless and scale-invariant.• Dataset must be homogeneous; otherwise results may not be reliable.
Chapter 4. Health Reasoning for Diagnosis (Non-Vibration based)
Seoul National University2019/1/4 - 12 -
Mahalanobis DistanceApplications• Cluster analysis and classification techniques
– Calculated covariance matrix of each class about input dataset, belonging to the class which makes Mahalanobis distance minimum
– Used as a weighted distance among the vectors, purposed to measure similarity of the vectors
• Detecting Outliers– A point that has a greater Mahalanobis distance compared to the rest of the sample
points defined to be outlier
𝑥𝑥1
𝑥𝑥2
𝑥𝑥1
𝑥𝑥2
Chapter 4. Health Reasoning for Diagnosis (Non-Vibration based)
Seoul National University2019/1/4 - 13 -
Case Study : Power Generator in Power Plant SystemObjective Health diagnosis and prognosis for power generator against water absorption
Target Products Stator windings
Failure Modes stator winding crack, water absorption
Used Signal Insulation capacity
• Power Generator in Power Plant System
slip rings
fan
windings
core
Stator & Rotor
Chapter 4. Health Reasoning for Diagnosis (Non-Vibration based)
Seoul National University2019/1/4 - 14 -
Failure Physics• Windings in Generator Stator• Coolant water + Electricity = Burn & Failure• Water penetration of the ground wall insulation• Evaluating the amount of water absorption
windings
coolantchannel
insulation
conductivecooper
cross section of winding
inlet
core
Failure
Side of a winding
crack
Chapter 4. Health Reasoning for Diagnosis (Non-Vibration based)
Case Study : Power Generator in Power Plant System
Seoul National University2019/1/4 - 15 -
Measurement• Measuring the capacitance of the ground wall insulation• Estimating the extent of water penetration indirectly;
WET insulation ⇨ HIGH capacitance• Non-destructive to the stator bar• 43 windings with 10 measurements (turbine/collector
ends and top/bottom) for each winding
Measurement areaTo
p Ba
rBo
ttom
Bar
Output𝜀𝜀𝑟𝑟: Relative static permittivity
𝜺𝜺𝒘𝒘𝒘𝒘𝒘𝒘𝒘𝒘𝒘𝒘 : 80.4𝜺𝜺𝒎𝒎𝒎𝒎𝒎𝒎𝒘𝒘 : 5.6 - 6.0
𝜀𝜀0: Electric constant(~ 8.854x10⁻¹² F/m)
A: Area of testert : Thickness of insulation
Irregular measurement every overhaul
Once every 2 or 3 years
0rACt
ε ε=
Capacitance [pF]
Chapter 4. Health Reasoning for Diagnosis (Non-Vibration based)
Case Study : Power Generator in Power Plant System
Seoul National University2019/1/4 - 16 -
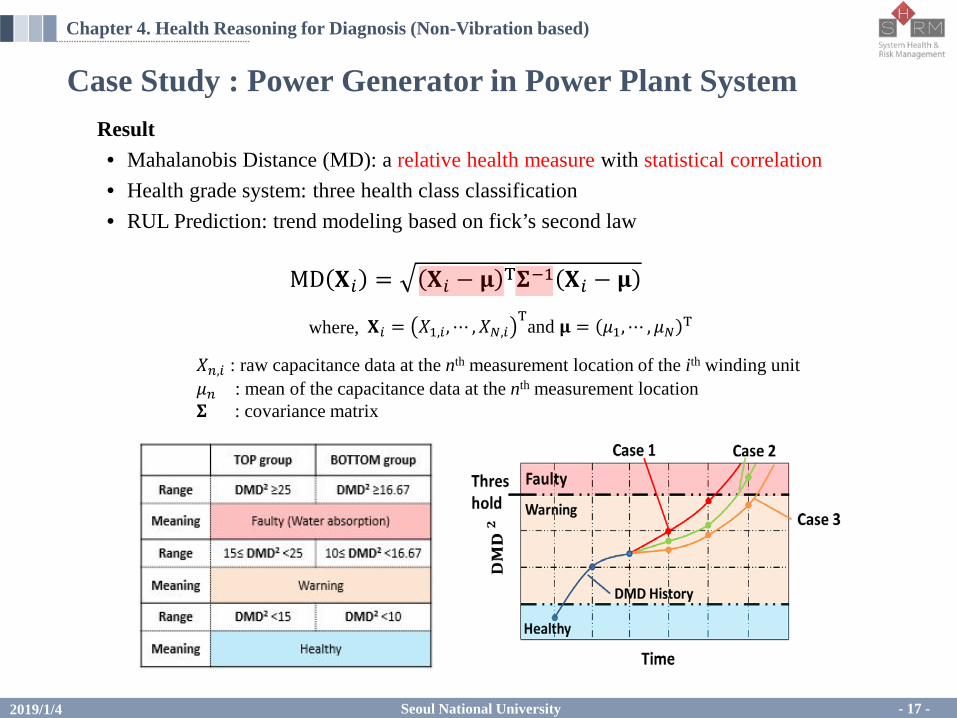
Result• Mahalanobis Distance (MD): a relative health measure with statistical correlation• Health grade system: three health class classification• RUL Prediction: trend modeling based on fick’s second law
MD 𝐗𝐗𝑖𝑖 = 𝐗𝐗𝑖𝑖 − 𝛍𝛍 T𝚺𝚺−1 𝐗𝐗𝑖𝑖 − 𝛍𝛍
𝑋𝑋𝑛𝑛,𝑖𝑖 : raw capacitance data at the nth measurement location of the ith winding unit𝜇𝜇𝑛𝑛 : mean of the capacitance data at the nth measurement location𝚺𝚺 : covariance matrix
Case Study : Power Generator in Power Plant System
Chapter 4. Health Reasoning for Diagnosis (Non-Vibration based)
Seoul National University2019/1/4 - 17 -
Result• Mahalanobis Distance (MD): a relative health measure with statistical correlation• Health grade system: three health class classification• RUL Prediction: trend modeling based on fick’s second law
MD 𝐗𝐗𝑖𝑖 = 𝐗𝐗𝑖𝑖 − 𝛍𝛍 T𝚺𝚺−1 𝐗𝐗𝑖𝑖 − 𝛍𝛍
𝑋𝑋𝑛𝑛,𝑖𝑖 : raw capacitance data at the nth measurement location of the ith winding unit𝜇𝜇𝑛𝑛 : mean of the capacitance data at the nth measurement location𝚺𝚺 : covariance matrix
Used Signal Dissolved gas from oil-filled power transformer
• Power Transformer in Power Plant System
Bushing
Winding
Core
Oil Conservator
OLTC
Chapter 4. Health Reasoning for Diagnosis (Non-Vibration based)
Case Study : Power Transformer in Power Plant System
Seoul National University2019/1/4 - 19 -
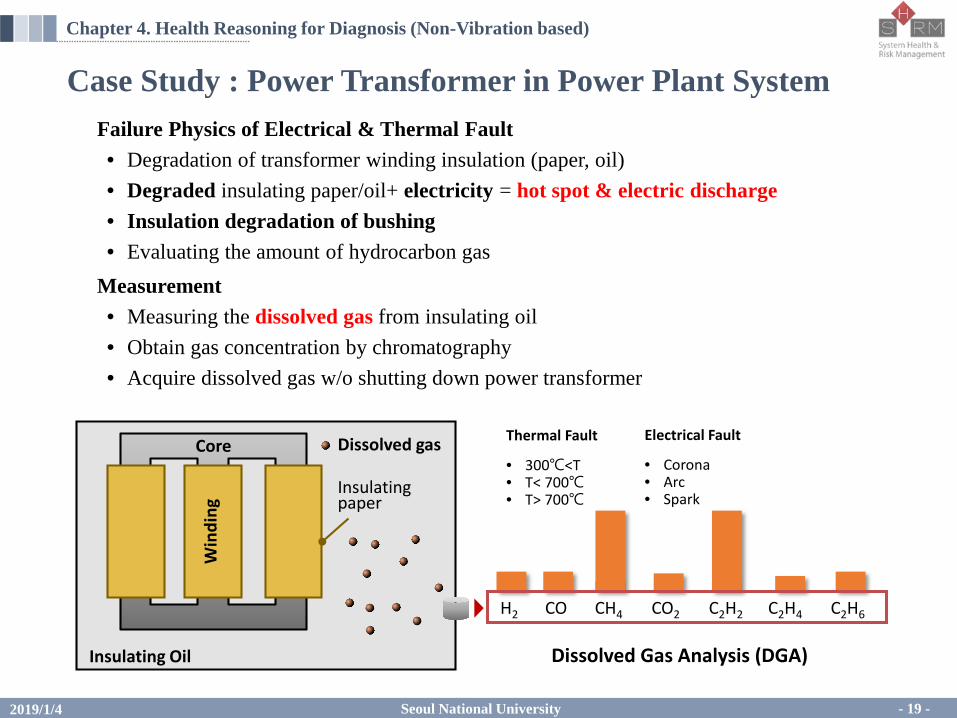
Case Study : Power Transformer in Power Plant SystemFailure Physics of Electrical & Thermal Fault• Degradation of transformer winding insulation (paper, oil)• Degraded insulating paper/oil+ electricity = hot spot & electric discharge• Insulation degradation of bushing • Evaluating the amount of hydrocarbon gas
Measurement• Measuring the dissolved gas from insulating oil• Obtain gas concentration by chromatography• Acquire dissolved gas w/o shutting down power transformer
Win
ding
Insulating Oil
Core
Insulatingpaper
Dissolved gas Electrical Fault
• Corona• Arc• Spark
Thermal Fault
• 300℃<T• T< 700℃• T> 700℃
C2H2 C2H4 C2H6CH4CO CO2H2
Dissolved Gas Analysis (DGA)
Chapter 4. Health Reasoning for Diagnosis (Non-Vibration based)
Seoul National University2019/1/4 - 20 -
Result• Dissolved Gas Analysis (DGA) : the study of dissolved gases to diagnose incipient fault• Health feature : DGA concentration and ratio
R1 = CH4CH4+C2H2+C2H4
R2 =
C 2H4
CH4+
C 2H2+
C 2H4
<Comparison of Duval, PCA, log and ppm features for electrical and thermal fault>
Electric FaultThermal Fault
log C2H2
log
C 2H6
C 2H6
C2H2
Electric FaultThermal Fault
Electric FaultThermal Fault
Electric FaultThermal Fault
PCA 1ppm
PCA
2 ppm
PCA 1log(ppm)
PCA
2 log
(ppm
)
Electric FaultThermal Fault
Chapter 4. Health Reasoning for Diagnosis (Non-Vibration based)
Case Study : Power Transformer in Power Plant System
Seoul National University2019/1/4 - 21 -
Case Study: IGBT (Insulated gate bipolar transistors) in Inverter SystemObjective Development of the failure precursors for IGBTs in inverter system
Target Products Trench gate and filed stop IGBTs
Failure Modes Gate oxide degradation
Used Signal Collector-Emitter voltage(VCES)
Inverter Circuit(DC to AC)
RectifierCircuit
(AC to DC)
IGBTsDC Link
InputPower
ESD simulatorGate Oxide
• Fault Injections : Electrostatic discharge (ESD)– To obtain failure data in short time– ESD: To emulate predominant failures in the field
• Inverter in Product Line
M
Chapter 4. Health Reasoning for Diagnosis (Non-Vibration based)
Seoul National University2019/1/4 - 22 -
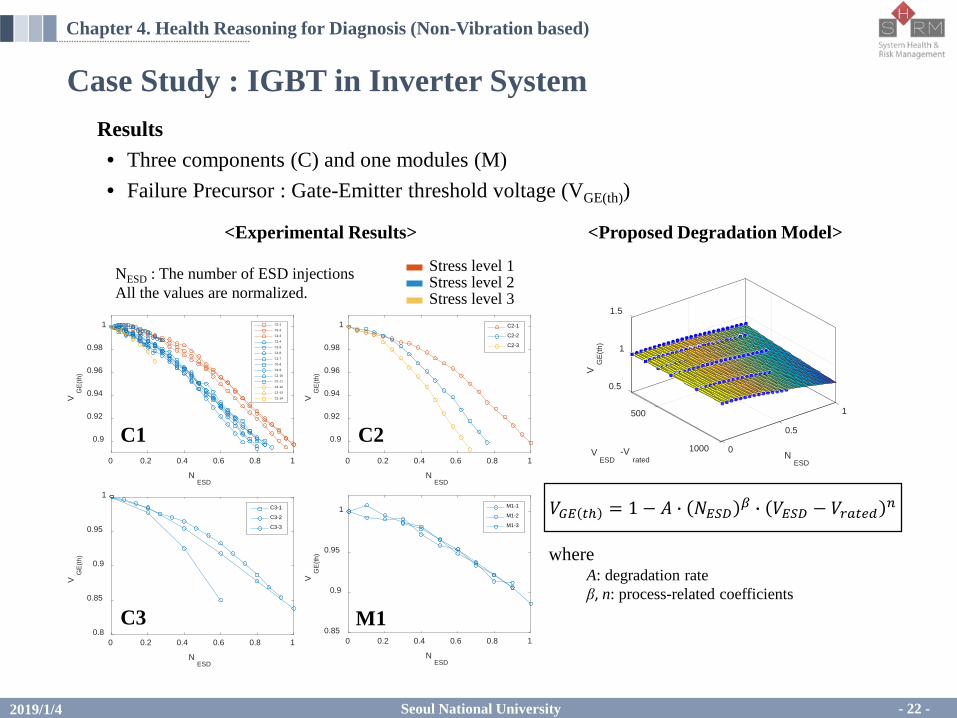
Case Study : IGBT in Inverter SystemResults• Three components (C) and one modules (M)• Failure Precursor : Gate-Emitter threshold voltage (VGE(th))
NESD : The number of ESD injectionsAll the values are normalized.
<Proposed Degradation Model>
Chapter 4. Health Reasoning for Diagnosis (Non-Vibration based)
Seoul National University2019/1/4 - 23 -
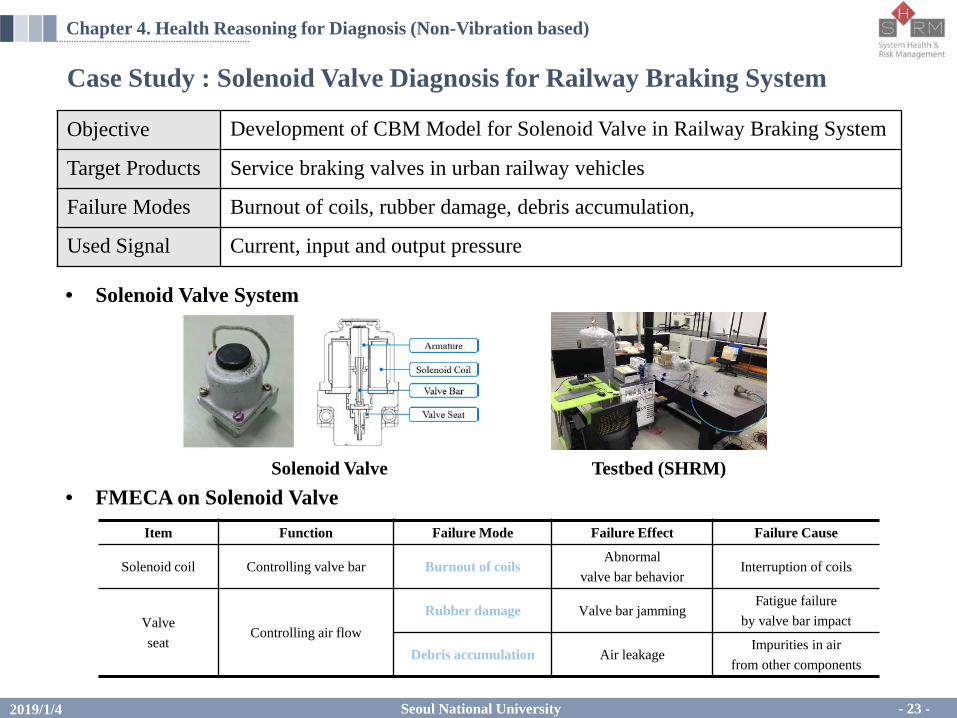
Case Study : Solenoid Valve Diagnosis for Railway Braking System
Objective Development of CBM Model for Solenoid Valve in Railway Braking System
Target Products Service braking valves in urban railway vehicles
Failure Modes Burnout of coils, rubber damage, debris accumulation,
Used Signal Current, input and output pressure
• FMECA on Solenoid Valve
• Solenoid Valve System
Solenoid Valve Testbed (SHRM)
Item Function Failure Mode Failure Effect Failure Cause
Solenoid coil Controlling valve bar Burnout of coilsAbnormal
valve bar behaviorInterruption of coils
Valveseat
Controlling air flowRubber damage Valve bar jamming
Fatigue failure by valve bar impact
Debris accumulation Air leakageImpurities in air
from other components
Chapter 4. Health Reasoning for Diagnosis (Non-Vibration based)
Seoul National University2019/1/4 - 24 -
Health Reasoning of Solenoid Valve
Supply Current
10%
HRB= Max(IS)
Burnout of coils
Output Pressure
HRD= Max(Pout)
Debris accumulation
Input Pressure
HRR= 10log(Pmin/P0.99)
Rubber damage
Supply
Supply-neutral
Exhaust
Exhaust-neutral
Data Acquisition from TestbedCurrent (IS) Input pressure (Pin) Output pressure (Pout)
Pmin
P0.99
Chapter 4. Health Reasoning for Diagnosis (Non-Vibration based)
Case Study : Solenoid Valve Diagnosis for Railway Braking System
Seoul National University
THANK YOUFOR LISTENING
2019/1/4 - 25 -
Seoul National University2019/1/4 - 26 -
Reference
[1] R. B. Randall and J. Antoni, "Rolling element bearing diagnostics—a tutorial," Mechanical Systems and Signal Processing, 25.2, (2011): 485-520.
[2] Y. Lei, et al., "A review on empirical mode decomposition in fault diagnosis of rotating machinery," Mechanical Systems and Signal Processing, 35.1, (2013): 108-126.
[3] J. Santiago-Paz, et al., "Using generalized entropies and OC-SVM with Mahalanobis kernel for detection and classification of anomalies in network traffic," Entropy, 17.9, (2015): 6239-6257.
[4] P. H. DuBois, "Multivariate correlational analysis," (1957).[5] C. E. Shannon, "A mathematical theory of communication,” Bell System Technical
Journal, vol. 27, pp. 379-423 & 623-656, July & October, (1948).[6] R. O. Duda, P. E. Hart, and D. G. Stork, Pattern classification, Vol. 2, New York: Wiley,
1973.[7] B. C. Jeon, et al., "Datum unit optimization for robustness of a journal bearing
Health Reasoning for Vibration Signals from Journal Bearing System
Health Reasoning for Vibration Signals<Keyphasor Signal Based Resampling> <Feature Extraction>
Phase & Time Sync
Res
ampl
edR
awK
eyph
asor
Kinetic energy related
Data statistics related
Time Features
Mean, max, RMS
Skewness, kurtosis
Crest / impulse / shape factor
Waveform related
Data statistics related
Frequency Features
Mean, RMS, Variance (Frequency)
Sub- & Super-harmonics / 1x
Component ratio to 1x
Time & Freq. Features
Separability Evaluation
Seoul National University2019/1/4 - 29 -
Kullback-Leibler divergenceBackground• Originated from Information Theory
– Goal of the Information theory : Quantify how much information is in data– Entropy : lower bound on the number of bits needed to transmit the state of a random
variable– Entropy formula
𝐻𝐻 = −�𝑖𝑖=1
𝑁𝑁
𝑝𝑝 𝑥𝑥𝑖𝑖 � log 𝑝𝑝(𝑥𝑥𝑖𝑖)
𝐷𝐷𝐾𝐾𝐾𝐾(𝑝𝑝 ∥ 𝑞𝑞) = �𝑖𝑖=1
𝑁𝑁
𝑝𝑝 𝑥𝑥𝑖𝑖 � log𝑝𝑝 𝑥𝑥𝑖𝑖𝑞𝑞 𝑥𝑥𝑖𝑖
• If uncertain distribute function p is approximated to designed distribution q, the expectation value of the difference between two probability distribution is KL divergence
Formula• Slight modification of a formula for entropy (KL divergence or relative entropy)
Kullback-Leibler divergence
where,𝑝𝑝(𝑥𝑥): Probability density function
where,𝑝𝑝(𝑥𝑥): True distribution𝑞𝑞(𝑥𝑥): Approximated distribution
Seoul National University2019/1/4 - 30 -
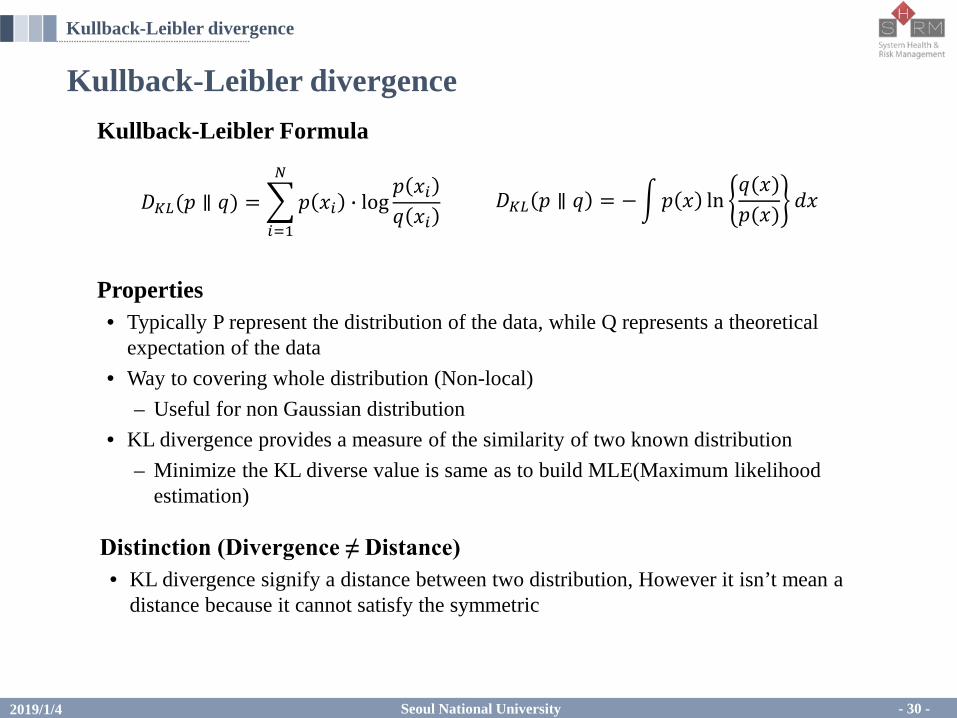
Kullback-Leibler divergenceKullback-Leibler Formula
𝐷𝐷𝐾𝐾𝐾𝐾 𝑝𝑝 ∥ 𝑞𝑞 = −�𝑝𝑝 𝑥𝑥 ln𝑞𝑞(𝑥𝑥)𝑝𝑝(𝑥𝑥)
𝑠𝑠𝑥𝑥
Properties• Typically P represent the distribution of the data, while Q represents a theoretical
expectation of the data• Way to covering whole distribution (Non-local)
– Useful for non Gaussian distribution• KL divergence provides a measure of the similarity of two known distribution
– Minimize the KL diverse value is same as to build MLE(Maximum likelihood estimation)
Distinction (Divergence ≠ Distance)• KL divergence signify a distance between two distribution, However it isn’t mean a
distance because it cannot satisfy the symmetric
𝐷𝐷𝐾𝐾𝐾𝐾(𝑝𝑝 ∥ 𝑞𝑞) = �𝑖𝑖=1
𝑁𝑁
𝑝𝑝 𝑥𝑥𝑖𝑖 � log𝑝𝑝 𝑥𝑥𝑖𝑖𝑞𝑞 𝑥𝑥𝑖𝑖
Kullback-Leibler divergence
Seoul National University2019/1/4 - 31 -
Kullback-Leibler divergenceApplication• Class Separation