Page 1
52
Chapter: 4 Results
4.1. Phytochemical evaluation
4.1.1. Phytoconstituent analysis
4.1.1.1. Analysis of essential oil
Alpinia galanga
The essential oils extracted from the leaves and rhizomes of Alpinia galanga by hydro
distillation gave light yellowish oil with a yield of 0.2 % and 0.13% respectively. The
essential oils were analyzed by gas chromatography and mass spectrometry (GC-MS)
for their possible chemical constituents. GC-MS analysis of leaf and rhizome essential
oil revealed the presence of 22 and 14 identified components accounting for 85.8% and
95.44% of the total peak area respectively (Fig: 4.1.1 and 4.1.2). Eucalyptol was the
major constituent in both the leaf (31.10±0.4%) and rhizome essential oil (36.04±0.5%).
β-pinene (14.41±0.3%), camphor (12.48±0.3%), cinnamic acid (9.58±0.3%) were found
to be the other major constituents of the leaf oil whereas rhizome essential oil contained
fenchyl acetate (19.03±0.4%), α-terpineol (7.94±0.2%), camphor (7.73±0.2%) as the
main constituents (Table: 4.1.1 and 4.1.2).
Table-4.1.1: Chemical composition of leaf essential oil of Alpinia galanga.
No Compound name Area (%) Mean ± SD Retention time
1 β-Pinene 14.41±0.3 4.594
2 Eucalyptol 31.10±0.4 5.990
3 3-Carene 0.53±0.2 8.159
4 Camphor 12.48±0.3 9.639
5 Boneol 2.47±0.3 10.400
6 4-Terpinenol 0.71±0.2 10.823
7 α-Terpinenol 1.33±0.2 11.356
8 Myrtenal 1.04±0.1 11.538
9 Bornyl ester 1.19±0.1 15.048
10 Methyl cinnamate 1.23±0.1 15.902
11 Cinnamic acid 9.58±0.3 19.044
12 β-gurjurene 0.97±0.2 20.058
13 Caryophyllene 1.17±0.2 20.219
14 α-Bergamotene 0.29±0.1 20.976
15 trans-β-Farnesene 0.82±0.1 21.936
Page 2
53
No Compound name Area (%) Mean ± SD Retention time
16 Curcumene 0.85±0.1 22.858
17 γ-Selinene 0.76±0.1 23.289
18 β-Bisabolene 1.73±0.2 23.847
19 β-Sesquiphellandrene 0.43±0.1 24.431
20 α-Farnesene 0.83±0.1 26.076
21 Caryophyllene oxide 1.20±0.1 26.494
22 Alloaromadendrene 0.68±0.1 28.482
Table-4.1.2: Chemical composition of rhizome essential oil of Alpinia galanga.
Compound name Area (%)
Mean±SD
Retention
time
1 β-Pinene 6.29±0.2 4.366
2 Eucalyptol 36.04±0.5 5.770
3 Camphor 7.73±0.2 9.119
4 Borneol 4.20±0.3 9.897
5 α –Terpineol 7.94±0.2 10.967
6 Fenchyl acetate 19.03±0.4 12.092
7 Bornyl acetate 1.22±0.1 14.371
8 (+)- 4-Carene 0.69±0.1 16.900
9 Methyl cinnamate 2.58±0.2 18.312
10 Valencen 0.69±0.1 22.338
11 Caryophyllene oxide 1.23±0.2 25.687
12 Carotol 5.34±0.3 26.317
13 Humulene epoxide 2 0.92±0.1 26.689
14 Daucol 1.54±0.1 27.881
Alpinia malaccensis
The fresh leaves of Alpinia malaccensis yielded 0.2% of essential oil. The analysis of
oil was performed using gas chromatography-mass spectrometry (GC-MS). In total, 10
volatile constituents, representing 92.62% of the peak area, were identified in the leaf
oil (Table: 4.1.3). The most abundant components found in the leaf oil were α-
phellandrene (43.90± 0.5%) followed by β-cymene (31.71±0.4%), β-pinene (4.6±0.2%)
(Fig: 4.1.3). Likewise the rhizomes of A.malaccensis yielded 0.1% of essential oil.
Quantitative analysis of rhizome essential oil by GC-MS analysis resulted in 11
components amounting to 99.99% (Fig: 4.1.4).α-phellandrene (26.59±0.5%), benzene
(26.14±0.3%), geraniol (9.15±0.2%) were the major constituents in the rhizome oil
(Table: 4.1.4).
Page 3
54
Fig. 4.1.1: GC MS Chromatogram of Alpinia galanga leaf oil
Fig. 4.1.2: GC MS Chromatogram of Alpinia galanga rhizome oil
Page 4
55
Table-4.1.3: Chemical composition of leaf essential oil of Alpinia malaccensis.
No Compound name Area (%)
Mean±SD
Retention time
1 β-Pinene 4.6 ± 0.2 4.916
2 α-Phellandrene 43.9 ± 0.5 5.246
3 β-cymene 31.7 ± 0.4 5.880
4 α –pinene 1.5 ±0.1 8.180
5 α –terpineol 2.2 ±0.2 11.377
6 Trans-pinocarveol 2.2 ±0.1 11.804
7 β Caryophyllene 3.3 ±0.2 20.236
8 α –selinene 0.7 ±0.2 22.845
9 Caryophyllene oxide 1.7±0.1 26.516
10 δ-cadinene 0.82 ±0.2 27.019
Table-4.1.4: Chemical composition of rhizome essential oil of Alpinia malaccensis.
No Compound name Area (%) Mean ± SD Retention time
1 α-Phellandrene 26.59±0.5 4.937
2 β-cymene 7.40±0.3 5.351
3 Benzene 26.14±0.3 5.440
4 Linalool 4.71±0.1 7.635
5 α –terpineol 8.25±0.2 10.747
6 Benzyl ether 3.83±0.2 11.136
7 Geraniol 9.15±0.2 13.364
8 Phenol 4.50±0.2 15.162
9 Caryophyllene 3.86±0.4 19.399
10 Caryophyllene oxide 2.39±0.3 25.606
11 Geraniol 3.17±0.1 44.090
Alpinia nigra
Hydrodisitillation of fresh leaves and rhizomes of Alpinia nigra yielded 0.21% and
0.18% of essential oil. The essential oils were analyzed by gas chromatography and
mass spectrometry for their possible chemical constituents. GC-MS analysis of leaf and
rhizome essential oil revealed the presence of 9 and 15 identified components
accounting for 96.5% and 97.63% of the peak area respectively (Fig:4.1.5 and 4.1.6). β-
pinene (56.27±2.5%), α-caryophyllene (13.70±1.55%), α-farnesene (7.92±0.23%),
caryophyllene (6.46± 0.57%) were found to be the major constituents of the leaf oil
whereas rhizome essential oil contained β-pinene (38.03± 0.25%), myrtenol
(9.35±0.3%), β-maaliene (7.82±0.2%), humulene epoxide 2 (6.00±0.13%) as the main
compounds. β-pinene had the highest area % in both leaf and rhizome oil (Table:4.1.5
and 4.1.6).
Page 5
56
Fig. 4.1.3: GCMS Chromatogram of Alpinia malaccensis leaf oil
Fig. 4.1.4: GC MS Chromatogram of Alpinia malaccensis rhizome oil
Page 6
57
Fig. 4.1.5: GC MS Chromatogram of Alpinia nigra leaf oil
Fig. 4.1.6: GC MS Chromatogram of Alpinia nigra rhizome oil
Page 7
58
Table-4.1.5: Chemical composition of leaf essential oil of Alpinia nigra.
No Compound name Area (%)
Mean±SD
Retention
time
1 β-Pinene 56.27 ± 2.5 4.611
2 Borneol 1.9 ± 0.2 10.413
3 Caryophyllene 6.46 ± 0.57 20.253
4 α –caryophyllene 13.70 ±1.55 21.610
5 Caryophyllene oxide 3.29±0.16 26.528
6 Butylphen 1.99 ±0.07 26.955
7 Humulene epoxide 2 3.81 ±0.25 27.518
8 Isolimonene 1.16 ±0.16 27.814
9 α –Farnesene 7.92 ±0.23 28.410
Table-4.1.6: Chemical composition of rhizome essential oil of Alpinia nigra.
No Compound name Area (%)
Mean±SD
Retention
time
1 β-Pinene 38.03±0.25 4.379
2 O-Xylene 0.91±0.11 5.347
3 Benzene 4.76±0.2 5.440
4 Pinocarveol 4.76±0.2 8.865
5 Pinocarvone 2.37±0.1 9.686
6 Isoborneol 2.89±0.12 9.766
7 L-4-terineol 5.05±0.22 10.273
8 Myrtenol 9.35±0.3 11.026
9 Υ-Selinene 4.15±0.14 21.987
10 Valencene 4.12±0.23 22.380
11 β-Cubebene 1.57±0.15 23.213
12 trans- Nerolidol 1.72±0.05 25.340
13 Caryophyllene oxide 4.13±0.17 25.712
14 Humulene epoxide 2 6.00±0.13 26.752
15 β-Maaliene 7.82±0.2 28.537
Alpinia calcarata
The leaves and rhizomes of Alpinia calcarata yielded no essential oil after
hydrodistillation of the samples.
Kaempferia galanga
The steam distillation of rhizomes of Kaempferia galanga yielded yellowish essential
oils, which possessed the characteristic spicy-campherous odour and the leaves yielded
no essential oil. Rhizomes yielded 0.6% essential oil. To determine detailed chemical
composition, the essential oil was assessed by GC-MS analysis. From the
chromatogram of essential oil sample of rhizomes, it was discernible that 6 major
identified components, accounting for 97.9% of the total peak area (Fig: 4.1.7) were
Page 8
59
recorded. The result demonstrated the presence of ethyl p-methoxy cinnamate (EPMC)
with the maximum peak area (82.01±0.25%) followed by 5 chemicals, ethyl cinnamate
(9.69±0.10%), 3-carene (3.41±0.10%), eucalyptol (1.60±0.05%), borneol (0.62±0.02%),
pentadecane (0.57±0.07%) (Table: 4.1.7).
Table-4.1.7: Chemical composition of rhizome essential oil of Kaempferia galanga.
No Compound name Area (%) Mean ± SD Retention
time
1 3-Carene 3.41±0.10 5.100
2 Eucalyptol 1.60±0.05 5.616
3 Ethyl cinnamate 9.69±0.10 21.917
4 Borneol 0.62±0.02 22.972
5 Pentadecane 0.57±0.07 29.618
6 Ethyl p-methoxy
cinnamate
82.01±0.25 34.056
Kaempferia rotunda
The steam distillation of fresh rhizomes of Kaempferia rotunda yielded 0.15% essential
oils and the leaves did not contain essential oil. GC-MS analysis was performed to
determine detailed chemical composition of the rhizome essential oil revealing 9 major
identified components, accounting for 96.81% of the total peak area (Fig: 4.1.8). The
result demonstrated the presence of benzoic acid with the maximum peak area
(58.27±0.45%) followed by bornyl ester (14.66±0.36%), zingiberene (5.74±0.35%), β –
myrcene (3.89±0.15%) etc (Table: 4.1.8).
Table-4.1.8: Chemical composition of rhizome essential oil Kaempferia rotunda.
SL.No Compound name Area %
Mean±SD
Retention
Time
1 β –Myrcene 3.89±0.15 4.658
2 Camphor 3.82±0.2 9.026
3 Bornyl ester 14.66±0.36 14.489
4 Curcumene 1.80±0.29 22.139
5 Zingiberene 5.74±0.35 22.701
6 Pentadecane 2.00±0.26 22.976
7 Amorphene 3.85±0.21 23.234
8 β –Sesquiphellandrene 2.78±0.2 23.716
9 Benzoic acid 58.27±0.45 32.939
Kaempferia parishii
The leaves and rhizomes of Kaempferia parishii yielded no essential oil after
hydrodistillation of the samples.
Page 9
60
Fig. 4.1.7: GC MS Chromatogram of Kaempferia galanga rhizome oil
Fig. 4.1.8: GC MS Chromatogram of Kaempferia rotunda rhizome oil
Page 10
61
4.1.1.2. Analysis of extract
4.1.1.2.1. Phytochemical screening
Alpinia galanga
Preliminary phytochemical screening of the leaf and rhizome extract of Alpinia galanga
revealed the presence of different phytoconstituents which are shown in table (4.1.9). In
leaf extract alkaloids, flavonoids, steroids, triterpenoids, tanins and saponins were found
positive and carbohydrates aminoacids and glycosides were found negative. Similarly in
case of rhizome extract all the above phytoconstituents were present except
carbohydrates, saponins and glycosides.
Table-4.1.9: Preliminary phytochemical screening of leaf and rhizome extract of
Alpinia galanga.
Phytoconstituents Test performed AG
leaf
AG rhizome
Alkaloids Dragendroff‟s test -ve -ve
Mayer‟s test, Wagner‟s test, Hager‟s test +ve +ve
Steroids Libermann Burchard test, Salkowski test +ve +ve
Flavonoids Alkaline reagent test, Shinoda test +ve +ve
Triterpenoids Libermann Burchard test, Salkowski test +ve +ve
Carbohydrates Molisch‟s test, Fehling‟s test -ve -ve
Barfoed‟s test, Benedict‟s test -ve -ve
Tanins FeCl2 test +ve +ve
Saponins Foam test +ve -ve
Aminoacids Millon‟s test, Ninhydrin test -ve +ve
Glycosides Killer-Kiliani test -ve -ve
Brontrager‟s test -ve -ve (+): Indicates the presence of chemical constituents, (-): Indicates the absence of chemical constituents
Alpinia malaccensis
Preliminary phytochemical screening of the leaf and rhizome extract of Alpinia
malaccensis revealed the presence of different phytoconstituents which are described in
table (4.1.10). In leaf extract alkaloids, flavonoids, steroids, tanins, carbohydrates and
saponins were found positive and triterpenoids, aminoacids and glycosides were found
negative. Similarly in case of rhizome extract alkaloids, flavonoids, steroids and
triterpenoids were found positive and carbohydrates, aminoacids, saponins, tanins and
glycosides were found negative.
Page 11
62
Fig. 4.1.9: Gallic acid calibration curve for total phenolic contents.
Fig. 4.1.10: Quercetin calibration curve for total flavonoid contents.
y = 0.004x + 0.036R² = 0.998
0
0.5
1
1.5
2
2.5
3
3.5
0 200 400 600 800
Ab
sorb
an
ce
Concentration (μg/ml)
Gallic acid standard curve
Gallic acid absorbance
Linear (Gallic acid absorbance)
y = 0.013x + 0.487R² = 0.886
0
0.5
1
1.5
2
2.5
3
3.5
0 50 100 150 200 250
Ab
sorb
an
ce
Concentration (µg/ml)
Quercetin standard curve
Quercetin absorbance
Linear (Quercetin absorbance)
Page 12
63
Table-4.1.10: Preliminary phytochemical screening of leaf and rhizome extract of
Alpinia malaccensis.
Phytoconstituents Test performed AM
leaf
AM
rhizome
Alkaloids Dragendroff‟s test -ve +ve
Mayer‟s test, Wagner‟s test, Hager‟s test +ve +ve
Steroids Libermann Burchard test, Salkowski test +ve +ve
Flavonoids Alkaline reagent test, Shinoda test +ve +ve
Triterpenoids Libermann Burchard test, Salkowski test -ve +ve
Carbohydrates Molisch‟s test, Fehling‟s test +ve -ve
Barfoed‟s test, Benedict‟s test +ve -ve
Tanins FeCl2 test +ve -ve
Saponins Foam test +ve -ve
Aminoacids Millon‟s test, Ninhydrin test -ve -ve
Glycosides Killer-Kiliani test -ve -ve
Brontrager‟s test -ve -ve
(+): Indicates the presence of chemical constituents, (-): Indicates the absence of chemical constituents
Alpinia nigra
As revealed from preliminary phytochemical screening, the leaf and rhizome extract of
Alpinia nigra contained different phytoconstituents which are represented in table
(4.1.11). In leaf extract alkaloids, flavonoids, steroids, triterpenoids, aminoacids and
tanins were found positive and carbohydrates, saponins and glycosides were found
negative. Similarly in case of rhizome extract all the above phytoconstituents were
present except triterpenoids, carbohydrates, saponins and glycosides.
Alpinia calcarata
It was seen after preliminary phytochemical screening of the leaf and rhizome extract of
Alpinia calcarata, different phytoconstituents were present which are represented in
table (4.1.12). In leaf extract alkaloids, flavonoids, steroids, triterpenoids, and
aminoacids were found positive and carbohydrates, saponins, tanins and glycosides
were found negative. Similarly in case of rhizome extract all the above
phytoconstituents were present except triterpenoids, carbohydrates, saponins and tanins.
Page 13
64
Table-4.1.11: Preliminary phytochemical screening of leaf and rhizome extract of
Alpinia nigra.
(+): Indicates the presence of chemical constituents, (-): Indicates the absence of chemical constituents
Kaempferia galanga
As revealed from preliminary phytochemical screening, the leaf and rhizome extract of
Kaempferia galanga contained different phytoconstituents which are represented in
table (4.1.13). In leaf extract alkaloids, flavonoids, steroids, saponins and tanins were
found positive and carbohydrates, aminoacids, triterpenoids, saponins and glycosides
were found negative. Similarly rhizome extract was found to contain alkaloids,
flavonoids, steroids, triterpenoids, saponins and tanins.
Kaempferia rotunda
Preliminary phytochemical screening of the leaf and rhizome extract of Kaempferia
rotunda revealed the presence of different phytoconstituents which are described in
table (4.1.14). In leaf extract alkaloids, flavonoids, steroids, triterpenoids and tanins
were found positive and carbohydrates, aminoacids, saponins and glycosides were
found negative. Similarly in case of rhizome extract all the above phytoconstituents
were present except triterpenoids, carbohydrates and aminoacids.
Phytoconstituents Test performed AN
leaf
AN
rhizome
Alkaloids Dragendroff‟s test -ve -ve
Mayer‟s test, Wagner‟s test, Hager‟s test +ve +ve
Steroids Libermann Burchard test, Salkowski test +ve +ve
Flavonoids Alkaline reagent test, Shinoda test +ve +ve
Triterpenoids Libermann Burchard test, Salkowski test +ve -ve
Carbohydrates Molisch‟s test, Fehling‟s test -ve -ve
Barfoed‟s test, Benedict‟s test +ve -ve
Tanins FeCl2 test +ve +ve
Saponins Foam test -ve -ve
Aminoacids Millon‟s test, Ninhydrin test +ve +ve
Glycosides Killer-Kiliani test -ve -ve
Brontrager‟s test -ve -ve
Page 14
65
Table-4.1.12: Preliminary phytochemical screening of leaf and rhizome extract of
Alpinia calcarata.
(+): Indicates the presence of chemical constituents, (-): Indicates the absence of chemical
constituents
Table-4.1.13: Preliminary phytochemical screening of leaf and rhizome extract of
Kaempferia galanga.
Phytoconstituents Test performed K.G
Leaf
K.G
Rhizome
Alkaloids Dragendroff‟s test +ve +ve
Mayer‟s test, Wagner‟s test, Hager‟s test +ve +ve
Steroids Libermann Burchard test, Salkowski test +ve +ve
Flavonoids Alkaline reagent test, Shinoda test +ve +ve
Triterpenoids Libermann Burchard test, Salkowski test -ve +ve
Carbohydrates Molisch‟s test, Fehling‟s test -ve +ve
Barfoed‟s test, Benedict‟s test -ve -ve
Tanins FeCl2 test +ve +ve
Phytoconstituents Test performed
AC leaf
AC
rhizome
Alkaloids Dragendroff‟s test -ve +ve
Mayer‟s test, Wagner‟s test, Hager‟s test +ve +ve
Steroids Libermann Burchard test, Salkowski test +ve +ve
Flavonoids Alkaline reagent test, Shinoda test +ve +ve
Triterpenoids Libermann Burchard test, Salkowski test +ve -ve
Carbohydrates Molisch‟s test, Fehling‟s test -ve -ve
Barfoed‟s test, Benedict‟s test -ve -ve
Tanins FeCl2 test -ve -ve
Saponins Foam test -ve -ve
Aminoacids Millon‟s test, Ninhydrin test +ve +ve
Glycosides Killer-Kiliani test -ve +ve
Brontrager‟s test -ve +ve
Page 15
66
Phytoconstituents Test performed K.P
leaf
K.P
Rhizome
Saponins Foam test +ve +ve
Aminoacids Millon‟s test, Ninhydrin test -ve -ve
Glycosides Killer-Kiliani test -ve +ve
Brontrager‟s test -ve -ve
(+): Indicates the presence of chemical constituents, (-): Indicates the absence of chemical constituents
Table-4.1.14: Preliminary phytochemical screening of leaf and rhizome extract of
Kaempferia rotunda.
Phytoconstituents Test performed K.R
leaf
K.R
Rhizome
Alkaloids Dragendroff‟s test +ve -ve
Mayer‟s test, Wagner‟s test, Hager‟s test +ve +ve
Steroids Libermann Burchard test, Salkowski test +ve +ve
Flavonoids Alkaline reagent test, Shinoda test +ve +ve
Triterpenoids Libermann Burchard test, Salkowski test +ve -ve
Carbohydrates Molisch‟s test, Fehling‟s test -ve -ve
Barfoed‟s test, Benedict‟s test -ve -ve
Tanins FeCl2 test +ve +ve
Saponins Foam test -ve +ve
Aminoacids Millon‟s test, Ninhydrin test -ve -ve
Glycosides Killer-Kiliani test -ve +ve
Brontrager‟s test -ve +ve
(+): Indicates the presence of chemical constituents, (-): Indicates the absence of chemical constituents
Kaempferia parishii
Preliminary phytochemical screening of the leaf and rhizome extract of Kaempferia
parishii revealed the presence of different phytoconstituents which are represented in
table (4.1.15). It was seen that leaf extract contained alkaloids, flavonoids, saponins and
glycosides whereas rhizome extract was found to contain alkaloids, steroids,
triterpenoids.
Page 16
67
Table-4.1.15: Preliminary phytochemical screening of leaf and rhizome extract of
Kaempferia parishii.
(+): Indicates the presence of chemical constituents, (-): Indicates the absence of chemical constituents
4.1.1.2.2. Evaluation of total phenolic and total flavonoid contents
In our study, Total Phenolic Content (TPC) of leaf and rhizome extracts of Alpinia and
Kaempferia species was estimated by using modified Folin-Ciocalteu calorimetric
method and represented in terms of GAE/g of the extract. It was calculated using the
standard curve of Gallic acid as shown in Fig: (4.1.9) (Standard curve equation: Y =
0.004x+0.063, R2 = 0.998). TPC of the leaf and rhizome extract of Alpinia galanga
were found to be 77.25±1.56 and 32.44±1.35 mg GAE/g of the extract respectively
(Table: 4.1.16).
Total Flavonoid Content (TFC) of leaf and rhizome extract of Alpinia and Kaempferia
species was calculated using the standard curve of Quercetin (standard curve equation:
Y= 0.013x+0.487, R2=0.886) (Fig: 4.1.10) and represented in terms of Quercetin
equivalent/g of the extract. Alpinia galanga leaf extract possessed high flavonoid
Phytoconstituents Test performed K.P
leaf
K.P
Rhizome
Alkaloids Dragendroff‟s test +ve -ve
Mayer‟s test, Wagner‟s test, Hager‟s test +ve +ve
Steroids Libermann Burchard test, Salkowski test -ve +ve
Flavonoids Alkaline reagent test, Shinoda test +ve -ve
Triterpenoids Libermann Burchard test, Salkowski test -ve +ve
Carbohydrates Molisch‟s test, Fehling‟s test -ve -ve
Barfoed‟s test, Benedict‟s test -ve -ve
Tanins FeCl2 test -ve -ve
Saponins Foam test +ve -ve
Aminoacids Millon‟s test, Ninhydrin test -ve -ve
Glycosides Killer-Kiliani test +ve -ve
Brontrager‟s test +ve -ve
Page 17
68
contents (64.69±1.12 mg Quercetin equivalent/ g of extract) in compared to rhizome
extract (39.46±1.05 mg Quercetin equivalent/ g of extract) (Table: 4.1.17).
TPC of the leaf and rhizome extracts of Alpinia malaccensis was found to be
76.25±0.83 mg GAE/g and 45.75±0.51 mg GAE/g of the extract (Table: 4.1.16). Total
Flavonoid Content (TFC) of Alpinia malaccensis leaf and rhizome extract was found to
be (72.61±0.48 and 40.92±0.26 mg Quercetin equivalent/ g of extract) (Table: 4.1.17) as
calculated from the standard curve of Quercetin (standard curve equation: Y=
0.013x+0.487, R2=0.886) (Fig: 4.1.10).
In the present study, Alpinia nigra leaf extract possessed high phenolic contents
(68.5±1.05 mg GAE/g of extract) as compared to the rhizome extract (48.75±1.52 mg
GAE/g of extract) (Table: 4.1.16). TFC of Alpinia nigra leaf and rhizome extract was
found to be 78.84±0.81 and 35.30±0.97 mg Quercetin equivalent/ g of extract (Table:
4.1.17).
TPC of the leaf and rhizome extracts of Alpinia calcarata was found to be 59.25±0.92
mg GAE/g and 37.75±0.95 mg GAE/g of the extract (Table: 4.1.16). TFC of Alpinia
calcarata leaf and rhizome extract was found to be 38.38±0.56 and 36.92±0.24 mg
Quercetin equivalent/ g of extract (Table: 4.1.17).
TPC of the leaf and rhizome extracts of Kaempferia galanga was found to be 51.5±0.67
mg GAE/g and 33.5±0.84 mg GAE/g of the extract (Table: 4.1.16). As calculated from
the standard curve of Quercetin (Fig: 4.1.10), Total flavonoid content (TFC) of
Kaempferia galanga leaf and rhizome extract was found to be 47±0.21 and 39.38±0.75
mg Quercetin equivalent/ g of extract (Table: 4.1.17).
As calculated from the standard curve of Gallic acid (Fig: 4.1.9) TPC of Kaempferia
rotunda leaf and rhizome extracts was found to be 48.25±0.55mg GAE/g and 30.5±0.23
mg GAE/g of the extract respectively (Table: 4.1.16). TFC of Kaempferia rotunda leaf
and rhizome extract was found to be 58.69±0.66 and 32.15±0.82 mg Quercetin
equivalent/ g of extract (Table: 4.1.17).
Similarly TPC of Kaempferia parishii extracts was determined and represented in terms
of GAE. TPC of the leaf and rhizome extracts of Kaempferia parishii was found to be
31.75±0.44 mg GAE/g and 27±0.36 mg GAE/g of the extract (Table: 4.1.16). TFC of
Kaempferia parishii leaf and rhizome extract was found to be 39.46±0.1 and 27.30±0.43
mg Quercetin equivalent/g of extract (Table: 4.1.17).
Page 18
69
Table-4.1.16: Total Phenolic Content (TPC) of methanolic extracts of Alpinia and
Kaempferia species
Sl no Sample Name TPC (mg Gallic acid
equivalent)
1 Alpinia galanga leaf 77.25±1.56
2 Alpinia galanga rhizome 32.44±1.35
3 Alpinia malaccensis leaf 76.25±0.83
4 Alpinia malaccensis rhizome 45.75±0.51
5 Alpinia nigra leaf 68.5±1.05
6 Alpinia nigra rhizome 48.75±1.52
7 Alpinia calcarata leaf 59.25±0.92
8 Alpinia calcarata rhizome 37.75±0.95
9 Kaempferia galanga leaf 51.5±0.67
10 Kaempferia galanga rhizome 33.5±0.84
11 Kaempferia rotunda leaf 48.25±0.55
12 Kaempferia rotunda rhizome 30.5±0.23
13 Kaempferia parishii leaf 31.75±0.44
14 Kaempferia parishii rhizome 27±0.36
Table-4.1.17: Total Flavonoid Content (TFC) of methanolic extracts of Alpinia and
Kaempferia species
Sl no Sample Name TFC (mg Quercetin
equivalent)
1 Alpinia galanga leaf 64.69±1.12
2 Alpinia galanga rhizome 39.46±1.05
3 Alpinia malaccensis leaf 72.61±0.48
4 Alpinia malaccensis rhizome 40.92±0.26
5 Alpinia nigra leaf 78.84±0.81
6 Alpinia nigra rhizome 35.30±0.97
7 Alpinia calcarata leaf 38.38±0.56
8 Alpinia calcarata rhizome 36.92±0.24
9 Kaempferia galanga leaf 47±0.21
10 Kaempferia galanga rhizome 39.38±0.75
11 Kaempferia rotunda leaf 58.69±0.66
12 Kaempferia rotunda rhizome 32.15±0.82
13 Kaempferia parishii leaf 39.46±1
14 Kaempferia parishii rhizome 27.30±0.43
4.1.1.2.3. Chemical constituents of extracts
Alpinia galanga
Gas chromatography and mass spectrometry analysis of the leaf and rhizome extracts of
Alpinia galanga revealed the presence of 2 and 8 identified chemical constituents
accounting for 57.84% and 72.96% of the total peak area respectively (Fig:4.1.11 and
Page 19
70
4.1.12). Detailed list of all the detected compounds was given in Table (4.1.18 and
4.1.19). Benzenepropanal (37.35±0.5%) and 3-phenyl-2-butanone (20.49±0.6%) were
found to be the constituents of the leaf extract whereas rhizome extract was found to
contain carotol (17.44±0.3%), eucalyptol (13.89±0.2%), 5-hydroxymethylfurfural
(11.28±0.3%) as major constituents.
Table-4.1.18: Chemical composition of leaf extract of Alpinia galanga.
SL.No Compound name Area %
Mean±SD
Retention
Time
1 Benzenepropanal 37.35±0.5 9.051
2 3-phenyl-2-butanone 20.49±0.6 11.880
Table-4.1.19: Chemical composition of rhizome extract of Alpinia galanga.
SL.No Compound name Area %
Mean±SD
Retention
Time
1 Eucalyptol 13.89±0.2 5.470
2 Pyranone 7.74±0.3 9.174
3 α-Terpineol 9.09±0.3 10.519
4 Fenchyl acetate 5.44±0.1 11.508
5 5-Hydroxymethylfurfural 11.28±0.3 12.840
6 Cinnamic acid 3.82±0.1 17.957
7 Carotol 17.44±0.3 25.894
8 Palmitic acid 4.26±0.1 39.062
Alpinia malaccensis
The leaf and rhizome extracts of Alpinia malaccensis were analyzed by GC-MS for
determining their volatile chemical constituents and it revealed the presence of 14 and 8
identified components accounting for 37.47% and 78.25% of the peak area respectively
(Fig: 4.1.13 and 4.1.14). All the detected compounds with their chemical names, area
percentages and retention times (RT) of each were given in Table (4.1.20 and
4.1.21).The major identified constituents of the leaf extract were acetylcyclopentanone
(9.86±0.3%), glycerin (8.92±0.2%) whereas in case of rhizome extract 5-
hydroxymethylfurfural (36.11±0.4%), pyranone (24.86±0.3%), trioxsalen (6.05±0.3%)
were the major constituents.
Page 20
71
Fig. 4.1.11: GC MS Chromatogram of Alpinia galanga leaf extract
Fig. 4.1.12: GC MS Chromatogram of Alpinia galanga rhizome extract
Page 21
72
Fig. 4.1.13: GC MS Chromatogram of Alpinia malaccensis leaf extract
Fig. 4.1.14: GC MS Chromatogram of Alpinia malaccensis rhizome extract
Page 22
73
Table-4.1.20: Chemical composition of leaf extract of Alpinia malaccensis.
No Compound name Area (%)
Mean±SD
Retention
time
1 Glycerin 8.92±0.2 9.098
2 Acetylcyclopentanone 9.86±0.3 15.542
3 Caryophyllene oxide 0.19±0.1 25.416
4 Ethyl p-methoxycinnamate 0.96±0.2 32.220
5 Hexahydrofarnesyl acetone 0.24±0.2 35.007
6 Methyl isohexadecanoate 0.70±0.1 37.696
7 Phthalic acid 0.26±0.1 38.707
8 Palmitic acid 0.63±0.1 39.087
9 α –Octadecene 0.18±0.1 42.491
10 Phytol 2.02±0.1 43.333
11 Totarol 0.42±0.1 48.813
12 Trioxsalen 6.39±0.4 49.490
13 Cedrediprenone 6.40±0.3 50.809
14 Ethyl linoleate 0.30±0.1 52.027
Table-4.1.21: Chemical composition of rhizome extract of Alpinia malaccensis.
No Compound name Area (%)
Mean±SD
Retention
time
1 5-Methyl-2-furaldehyde 4.44±0.2 4.345
2 O-Cymene 2.55±0.2 5.385
3 4-Pyridinol 1.55±0.1 7.466
4 Pyranone 24.86±0.3 10.455
5 Benzylphenylcarbinol 1.54±0.1 11.051
6 5-Hydroxymethylfurfural 36.11±0.4 15.876
7 Palmitic acid 1.15±0.2 39.079
8 Trioxsalen 6.05±0.3 49.600
Alpinia nigra
The leaf and rhizome extracts of Alpinia nigra were analyzed by GC-MS for
determining their volatile chemical constituents and it revealed the presence of 4 and 7
identified components accounting for 57.06% and 77.61% of the leaf and rhizome
Page 23
74
extract respectively (Fig: 4.1.15 and 4.1.16). Detailed list of all the detected compounds
with their chemical names and area percentages of each was given in Table (4.1.22 and
4.1.23). α-caryophyllene(16.75±0.3%), 2-bromoethanol (17.22±0.4%), 3,5-
dimethylamphetamine (12.83±0.35%) were found to be the major constituents of the
leaf extract whereas rhizome extract was found to contain pyranone (24.35±0.4%),
caryophyllene oxide (14.75±0.3%), hydroxytoluene (12.54±0.2%) as major
constituents.
Table-4.1.22: Chemical composition of leaf extract of Alpinia nigra.
No Compound name Area (%)
Mean±SD
Retention
time
1 α-Caryophyllene 16.75±0.3 20.473
2 3,5-Dimethylamphetamine 12.83±0.35 27.281
3 2,4-Dimethylamphetamine 10.26±0.34 27.420
4 2-Bromoethanol 17.22±0.4 34.918
Table-4.1.23: Chemical composition of rhizome extract of Alpinia nigra.
No Compound name Area (%)
Mean±SD
Retention time
1 Cyclohexanone 7.32±0.5 4.928
2 2-Hexyl-1-ol 4.07±0.2 8.557
3 Pyranone 24.35±0.4 9.905
4 Hydroxytoluene 12.54±0.2 10.675
5 Mayurone 7.01±0.2 28.042
6 Cis-Limonene 7.57±0.2 30.486
7 Caryophyllene oxide 14.75±0.3 30.985
Alpinia calcarata
Gas chromatography and mass spectrometry analysis of Alpinia calcarata leaf and
rhizome extracts revealed the presence of 6 and 3 identified components accounting for
99.97% and 50.7% of the leaf and rhizome extract respectively (Fig: 4.1.17 and 4.1.18).
Detailed list of all the detected compounds with their chemical names, area percentages
and retention time of each was given in Table (4.1.24 and 4.1.25). The major
constituents of the leaf extract were olealdehyde (32.41±0.95%), hexadecanal
(31.84±0.34%), phytol (11±0.52%), 9-hexadecenal (10.06±0.12%) whereas rhizome
extract was found to contain hydroquinone (44.17±0.36%) and pyranone (6.19±0.35%)
as major constituents.
Page 24
75
Fig. 4.1.15: GC MS Chromatogram of Alpinia nigra leaf extract
Fig. 4.1.16: GC MS Chromatogram of Alpinia nigra rhizome extract
Page 25
76
Fig. 4.1.17: GC MS Chromatogram of Alpinia calcarata leaf extract
Fig. 4.1.18: GC MS Chromatogram of Alpinia calcarata rhizome extract
Page 26
77
Table-4.1.24: Chemical composition of leaf extract of Alpinia calcarata.
SL.No Compound name Area %
Mean±SD
Retention
Time
1 9-Hexadecenal 10.06±0.12 31.899
2 Hexadecanal 31.84±0.34 32.694
3 9,12-Octadecadienal 6.67±0.42 38.089
4 Olealdehyde 32.41±0.95 38.487
5 Octadecanal 7.99±0.63 39.155
6 Phytol 11.00±0.52 41.904
Table-4.1.25: Chemical composition of rhizome extract of Alpinia calcarata.
SL.No Compound name Area %
Mean±SD
Retention
Time
1 Pyranone 6.19±0.35 9.876
2 Hydroquinone 44.17±0.36 15.001
3 2-Deoxy-D-ribose 0.34±0.18 31.471
Kaempferia galanga
Gas chromatography and mass spectrometry analysis was conducted for determining
volatile chemical constituents of the leaf and rhizome extract of Kaempferia galanga
and it revealed the presence of 8 and 10 identified components accounting for 61.44%
and 96.97% of the leaf and rhizome extract respectively (Fig: 4.1.19 and 4.1.20). 2-(3,4-
dimethoxyphenyl)-7-hydroxy-3-methoxy-4H-chromen-4-one (18.26±0.35%), 2-(3-
hydroxy-4-methoxyphenyl)-3,7-dimethoxy-4H-chromen-4-one(14.01±0.3%),
octamethylcyclotetrasiloxane (11.79±0.2%) were found to be the major constituents of
the leaf extract. Rhizome extract contained ethyl p-methoxycinnamate (80.39±0.85%),
ethyl cinnamate (9.61±0.45%), pentadecane (3.12±0.2%) as major constituents (Table:
4.1.26 and 4.1.27).
Table-4.1.26: Chemical composition of leaf extract of Kaempferia galanga.
SL.No Compound name Area %
Mean±SD
Retention
Time
1 Octamethyl cyclotetrasiloxane 11.79±0.2 15.703
2 Diethyl Phthalate 6.85±0.2 23.987
3 Hexadecanal 2.47±0.24 32.710
4 Hexahydrofarnesyl acetone 3.95±0.16 33.628
5 Hexadecanoic acid, methyl ester 2.38±0.28 36.364
6 Phytol 1.73±0.12 41.937
7 2-(3,4-Dimethoxyphenyl)-7-hydroxy-3-
methoxy-4H-chromen-4-one
18.26±0.35 49.955
8 2-(3-Hydroxy-4-methoxyphenyl)-3,7-
dimethoxy-4H-chromen-4-one
14.01±0.3 50.682
Page 27
78
Fig. 4.1.19: GC MS Chromatogram of Kaempferia galanga leaf extract
Fig. 4.1.20: GC MS Chromatogram of Kaempferia galanga rhizome extract
Page 28
79
Kaempferia rotunda
GC-MS analysis of leaf and rhizome extracts of Kaempferia rotunda shown the
presence of 2 and 5 identified volatile chemical constituents accounting for 99.99% and
66.13% of the leaf and rhizome extract respectively (Fig: 4.1.21 and 4.1.22). All the
detected compounds with their chemical names, area percentages and retention time of
each were given in Table (4.1.28 and 4.1.29).
Table-4.1.27: Chemical composition of rhizome extract of Kaempferia galanga.
SL.No Compound name Area %
Mean±SD
Retention
Time
1 Borneol 0.40±0.12 9.732
2 Ethyl cinnamate 9.61±0.45 21.631
3 Pentadecane 3.13±0.2 22.891
4 γ-Muurolene 0.43±0.28 23.056
5 8-Heptadecene 0.56±0.25 29.251
6 4-Tetradecyne 1.21±0.23 29.454
7 Heptadecene 0.35±0.11 30.122
8 2-Pentadecanol 0.22±0.12 30.317
9 Ethyl p-methoxycinnamate 80.39±0.85 33.307
10 Hexadecanoic acid 0.67±0.12 39.277
In the leaf extract phytol (93.32±0.75%) and hexadecanoic acid, methyl ester
(6.67±0.2%) were found, whereas rhizome extract was found to contain vinylacetic acid
(52.40±0.56%), ethyl p-methoxycinnamate (4.68±0.21%), erythritol (3.45±0.21%) as
major constituents.
Table-4.1.28: Chemical composition of leaf extract of Kaempferia rotunda.
SL.No Compound name Area %
Mean±SD
Retention
Time
1 Hexadecanoic acid, methyl ester 6.67±0.2 40.280
2 Phytol 93.32±0.75 45.942
Table-4.1.29: Chemical composition of rhizome extract of Kaempferia rotunda.
SL.No Compound name Area %
Mean±SD
Retention
Time
1 Dimethylformamide 2.08±0.22 9.652
2 Erythritol 3.45±0.21 9.770
3 Vinylacetic acid 52.40±0.56 25.746
4 Ethyl p-methoxycinnamate 4.68±0.21 32.833
5 Phenylephrine 3.52±0.2 44.585
Page 29
80
Fig. 4.1.21: GC MS Chromatogram of Kaempferia rotunda leaf extract
Fig. 4.1.22: GC MS Chromatogram of Kaempferia rotunda rhizome extract
Page 30
81
Kaempferia parishii
The leaf and rhizome extracts of Kaempferia parishii were analyzed by GC-MS for
determining their chemical constituents and it revealed the presence of 7 and 8
identified components accounting for 92.1% and 82.86% of the leaf and rhizome extract
respectively (Fig: 4.1.23 and 4.1.24). In leaf extract phytol (72.55±0.5%), hexadecanoic
acid methyl ester (4.94±0.2%), hexahydrofarnesyl acetone (3.78±0.2%), dibutyl
phthalate (3.31±0.2%) were found to be the major constituents and in case of rhizome
extract totarol (74.96±0.86%), cembrene (2.83±0.2%), borneol (1.23±0.15) were the
major constituents (Table: 4.1.30 and 4.1.31).
Table-4.1.30: Chemical composition of leaf extract of Kaempferia parishii.
SL.No Compound name Area %
Mean±SD
Retention
Time
1 β-Farnesene 1.04±0.1 22.748
2 Hexahydrofarnesyl acetone 3.78±0.2 37.362
3 Hexadecanoic acid methyl ester 4.94±0.2 40.280
4 Dibutyl phthalate 3.31±0.2 41.202
5 9,12-Octadecenoic acid, methyl ester 3.48±0.3 45.489
6 Methyl linolenate 3.00±0.4 45.663
7 Phytol 72.55±0.5 45.942
Table-4.1.31: Chemical composition of rhizome extract of Kaempferia parishii
SL.No Compound name Area %
Mean±SD
Retention
Time
1 Borneol 1.23±0.15 9.715
2 L-bornyl acetate 0.60±0.03 14.202
3 Aromadendrene 0.72±0.1 20.862
4 Ledol 0.24±0.08 26.232
5 Dehydrobietan 1.37±0.1 41.197
6 Cembrene 2.83±0.2 41.912
7 Totarol 74.96±0.86 49.498
8 Longipinocarveol, trans- 0.91±0.1 50.407
Page 31
82
Fig. 4.1.23: GC MS Chromatogram of Kaempferia parishii leaf extract
Fig. 4.1.24: GC MS Chromatogram of Kaempferia parishii rhizome extract
Page 32
83
4.1.2. Bioactivity study
4.1.2.1. Evaluation of antioxidant activity
Alpinia galanga
Essential oils and methanolic extracts of A.galanga leaf and rhizome showed good
DPPH radical-scavenging activity (Fig: 4.1.25 A &B). As can be seen from the graph,
activity was increased with the increasing concentration of the samples. The
concentration that led to 50% inhibition (IC50) is given in the table (4.1.32). Lower IC50
value indicates higher antioxidant activity. Here ascorbic acid was used as positive
control. Both leaf and rhizome essential oil possessed high radical scavenging activity
almost equivalent to the standard ascorbic acid. But the methanolic extracts were found
less effective in compared to the oils.
Alpinia malaccensis
The antioxidant activity of the essential oils and extracts obtained from Alpinia
malaccensis leaf and rhizomes were evaluated using DPPH radical assay. In the present
study, the samples (oils & extracts) showed significant DPPH radical inhibiting activity
at a concentration of 100μg/ml. (Fig: 4.1.26 A & B) showed the dose response curve of
DPPH radical scavenging activity of A. malaccensis compared with standard ascorbic
acid.
It was observed that the rhizome oil had highest activity with lowest IC50 value (16
μg/ml) and rhizome extract had lowest DPPH scavenging activity with IC50 value of
32.5 μg/ml while the IC50 value of the standard antioxidant ascorbic acid was 6.58μg/ml
(Table: 4.1.32). Lower IC50 value indicates higher antioxidant activity. As can be seen
from the graph, activity was increased with the increasing concentration of the samples.
The result showed that, the inhibition on DPPH radical scavenging assay of the essential
oils was higher as compared to the methanolic extracts of Alpinia malaccensis.
Alpinia nigra
Essential oils and methanolic extracts of A.nigra leaf and rhizome showed good DPPH
radical-scavenging activity (Fig: 4.1.27 A & B). As can be seen from the graph, activity
was increased with the increasing concentration of the samples. The IC50 values
(concentration that led to 50% inhibition) are given in the Table (4.1.32). Lower IC50
value indicates higher antioxidant activity. Here ascorbic acid was used as positive
control. Leaf essential oil with radical scavenging activity more than that of ascorbic
acid, was particularly effective and proved superior to methanolic extract.
Page 33
84
Fig. 4.1.25: DPPH radical scavenging activity of essential oils (A) and methanolic
extracts (B) of Alpinia galanga.
Fig. 4.1.26: DPPH radical scavenging activity of essential oils (A) and methanolic
extracts (B) of Alpinia malaccensis.
Fig. 4.1.27: DPPH radical scavenging activity of essential oils (A) and methanolic
extracts (B) of Alpinia nigra.
Page 34
85
Alpinia calcarata
The antioxidant activity of the methanolic extracts of Alpinia calcarata leaf and
rhizomes were evaluated using DPPH radical assay. The samples showed moderate
DPPH radical inhibiting activity at a concentration of 100 μg/ml. (Fig: 4.1.28) showed
the dose response curve of DPPH radical scavenging activity of A. calcarata compared
with standard ascorbic acid. It was observed that the leaf extract had higher activity with
IC50 value (83.6μg/ml) than rhizome extract (IC50 value-103.4 μg/ml) while the IC50
value of the standard antioxidant ascorbic acid was 6.58μg/ml (Table: 4.1.32). As can
be seen from the graph, both the extracts of Alpinia calcarata had poor to moderate
DPPH radical scavenging activity.
Kaempferia galanga
It was evident that increased antioxidant activity in DPPH free radical scavenging assay
was seen with increasing concentrations of oil and extract samples of Kaempferia
galanga rhizomes (Fig: 4.1.29). Lower IC50 value indicates higher antioxidant activity.
The DPPH scavenging activity of the samples indicated a concentration dependent
antioxidant activity against the radical, with IC50 values of 6.58, 26.5, 26.7 and 49.9
μg/mL for ascorbic acid, rhizome oil, rhizome extract and leaf extract of Kaempferia
galanga respectively (Table: 4.1.32).
Kaempferia rotunda
DPPH radical scavenging assay of Kaempferia rotunda rhizome essential oils and leaf
and rhizome extracts showed significant DPPH radical inhibiting activity at a
concentration of 100μg/ml. Fig (4.1.30) showed the dose response curve of DPPH
radical scavenging activity of Kaempferia rotunda samples compared with standard
ascorbic acid. It was observed that the rhizome oil and rhizome extract had better
activity in compared to leaf extract. Assessed essential oils and methanolic extracts
were able to reduce the stable violet DPPH radical to the yellow DPPH-H, reaching
50% of reduction with IC50 values (Table: 4.1.32). As can be seen from the graph,
activity was increased with the increasing concentration of the samples.
Kaempferia parishii
The antioxidant activity of the methanolic extracts obtained from Kaempferia parishii
leaves and rhizomes were evaluated using DPPH free radical scavenging assay. In the
present study, the samples (oils & extracts) showed moderate DPPH radical inhibiting
activity at a concentration of 100μg/ml. As can be seen from the graph (Fig: 4.1.31),
Page 35
86
Fig. 4.1.28: DPPH radical scavenging activity of methanolic extracts of Alpinia
calcarata.
Fig. 4.1.29: DPPH radical scavenging activity of essential oil (A) and methanolic
extracts (B) of Kaempferia galanga.
0
20
40
60
80
100
0 20 40 60 80 100 120
%In
hib
itio
n
Concentration (µg/ml)
Alpinia calcarata Extract
Ascorbic acid
Leaf extract
Rhizome extract
Page 36
87
Fig. 4.1.30: DPPH radical scavenging activity of essential oil (A) and methanolic
extracts (B) of Kaempferia rotunda.
Fig. 4.1.31: DPPH radical scavenging activity of methanolic extracts of
Kaempferia parishii
0
20
40
60
80
100
0 20 40 60 80 100 120
%In
hib
itio
n
Concentration (µg/ml)
Kaempferia parishii Extract
ascorbic acid
Leaf extract
Rhizome extract
Page 37
88
activity was increased with the increasing concentration of the samples. But when
compared with standard ascorbic acid, it was seen that the extracts of Kaempferia
parishii exhibited very low DPPH radical inhibiting activity. Higher IC50 values of the
extracts indicate its less inhibition capacity against the radical (Table: 4.1.32).
Table-4.1.32: IC50 values of essential oils and extracts of Alpinia and Kaempferia
species.
Sl.No Samples DPPH IC50 (μg/ml)
1 Control (Ascorbic acid) 6.58
2 Alpinia galanga LO 18
LE 20
RO 16
RE 25
3 Alpinia malaccensis LO 17
LE 22
RO 15
RE 32
4 Alpinia nigra LO 4
LE 15
RO 13
RE 15
5 Alpinia calcarata LE 83
RE 103
6 Kaempferia galanga LE 49.9
RO 26.5
RE 26.7
7 Kaempferia rotunda LE 47
RO 25
RE 29
8 Kaempferia parishii LE 99.9
RE 64
LO: Leaf Oil; LE: Leaf Extract; RO: Rhizome Oil; RE: Rhizome Extract
4.1.2.2. Evaluation of antimicrobial activity
The in vitro antimicrobial activity of the essential oils and extracts were carried out by
the agar disc diffusion method and minimum inhibitory concentration (MIC) and
minimum bactericidal concentration (MBC) values. This resulted in a range of growth
inhibition pattern against pathogenic microorganisms.
Page 38
89
Alpinia galanga
The essential oils and extracts of Alpinia galanga were found to have good to moderate
antimicrobial activities against all microorganisms tested. The MIC of the oil and
extract were ranged between 0.75-4.99 mg/ml and 0.65-5.77 mg/ml respectively. The
zone of inhibition was highest in A.galanga leaf extract (21±0.24 mm). The standard
positive control (Gentamycin 5 μg) showed inhibition diameter ranging from 9-35 mm
and 17-25.67 mm against the tested organisms. The assay results showed that pathogens
like S. aureus, E. faecalis, E.coli were more sensitive towards both the essential oils and
extracts than the remaining microbes as seen in Table (4.1.33 and 4.1.34).
Alpinia malaccensis
Preliminary screening by disc diffusion method revealed that the test pathogens were
susceptible to both oils and extracts. However differences in the zone sizes were
observed with different pathogens. Here the methanolic extracts of A.malaccensis
showed better activity against all organisms than its oils. The MIC of the oils and
extracts were ranged between 3.51-9.63 mg/ml and 0.55-5.07 mg/ml respectively while
the MBC of the oils and extracts were ranged between 4.27-14.67 mg/ml and 3.54-9.63
mg/ml respectively (Table: 4.1.35 & 4.1.36). A variance was observed in the zones of
inhibition and the MIC and MBC values. The zone of inhibition was highest in leaf
extract (21.91±0.24 mm) and it is also higher than the standard gentamycin (17±1 mm).
The results indicated that S. aureus was more sensitive towards the essential oils and
extracts than the remaining microbes as seen in Table (4.1.35 & 4.1.36).
Table-4.1.33: Antimicrobial activity of leaf and rhizome oil of Alpinia galanga.
Micro-
Organism
AGL oil
(mg/ml)
AGR oil
(mg/ml)
IZD of
gentamycin
at 5 mg in
in mm
IZD of
AGL oil at
5 mg in
mm
IZD of
AGR oil at
5 mg in
mm
MIC MBC MIC MBC
E. faecalis 1.91 3.41 1.51 3.16 19.38 ±0.13 16.45±0.2 18.78±0.23
S. aureus 1.65 2.51 0.75 2.53 17±1 17.56±0.14 15.54±0.13
A.
baumannii
4.27 8.73 4.78 9.67 24.67±0.57 14.88±0.22 14.09±0.37
E.coli 3.41 9.63 4.12 9.63 24.8±0.25 15.94±0.35 13.62±0.23
C. albicans 4.36 7.58 4.18 8.35 25.67±0.59 14.99±0.38 12.17±0.25
A. niger 4.99 8.36 4.11 7.98 25±1 12.48±0.32 13.77±0.36 AGL: Alpinia galanga Leaf; AGR: Alpinia galanga Rhizome; IZD: Inhibition Zone Diametre
Page 39
90
Table-4.1.34: Antimicrobial activity of leaf and rhizome extract of Alpinia galanga.
Micro-
Organism
AGL
extract
(mg/ml)
AGR extract
(mg/ml)
IZD of
gentamycin
at 5 mg in
in mm
IZD of
AGL
extract at 5
mg in mm
IZD of
AGR
extract at 5
mg in mm
MIC MBC MIC MBC
E. faecalis 1.51 3.11 1.33 3.43 19.38 ±0.13 19±0.52 17±0.21
S. aureus 0.65 1.54 0.65 1.51 17±1 21±0.24 19±0.12
A.
baumannii
4.07 7.64 4.27 9.63 24.67±0.57 16±0.32 14±0.31
E.coli 3.41 8.65 4.27 9.63 24.8±0.25 19±0.42 18±0.24
C. albicans 4.02 8.98 4.12 7.58 25.67±0.59 19±0.25 18±0.32
A. niger 5.77 8.67 4.01 7.49 25±1 18±0.26 16±0.29 AGL: Alpinia galanga Leaf; AGR: Alpinia galanga Rhizome; IZD: Inhibition Zone Diametre
Table-4.1.35: Antimicrobial activity of leaf and rhizome oil of Alpinia malaccensis.
Micro-
Organism
AML oil
(mg/ml)
AMR oil
(mg/ml)
IZD of
gentamycin
at 5 mg in
mm
IZD of
AML oil at
5 mg in
mm
IZD of
AMR oil at
5 mg in
mm
MIC MBC MIC MBC
E. faecalis 5.63 9.38 4.76 9.63 19.38 ±0.13 13.85±0.2 15.81±0.28
S. aureus 3.51 4.27 4.18 7.39 17±1 18.59±0.16 17.94±0.17
A.
baumannii
9.63 11.72 9.63 14.67 24.67±0.57 12.48±0.22 11.09±0.35
E.coli 4.27 9.63 4.27 9.63 24.8±0.25 14.74±0.35 13.62±0.23
C. albicans 4.36 7.58 5.18 8.35 25.67±0.59 14.69±0.31 12.74±0.45
A. niger 4.99 8.86 5.21 7.98 25±1 13.46±0.34 11.87±0.33 AML: Alpinia malaccensis Leaf; AGR: Alpinia malaccensis Rhizome; IZD: Inhibition Zone Diametre
Table4.1.36: Antimicrobial activity of leaf and rhizome extract of Alpinia
malaccensis.
Micro-
Organism
AML
extract
(mg/ml)
AMR
extract
(mg/ml)
IZD of
gentamycin
at 5 mg in
mm
IZD of
AML
extract at 5
mg in mm
IZD of
AMR
extract at 5
mg in mm
MIC MBC MIC MBC
E. faecalis 2.51 5.71 4.33 5.43 19.38 ±0.13 19.38±0.43 17.33±0.21
S. aureus 0.55 3.54 1.65 6.11 17±1 21.91±0.24 19.49±0.16
A.
baumannii
5.07 7.64 4.27 9.63 24.67±0.57 16.35±0.32 14.89±0.33
E.coli 3.41 6.65 3.27 5.68 24.8±0.25 20.47±0.12 19.95±0.26
C. albicans 4.02 8.98 4.12 7.58 25.67±0.59 18.72±0.35 18.63±0.39
A. niger 4.77 8.67 4.01 7.49 25±1 18.56±0.36 16.25±0.29 AML: Alpinia malaccensis Leaf; AGR: Alpinia malaccensis Rhizome; IZD: Inhibition Zone Diametre
Page 40
91
Alpinia nigra
The essential oils and methanolic extracts of Alpinia nigra were tested for their in vitro
antimicrobial activity using disc diffusion method, MIC and MBC assay. Two Gram (+)
and two Gram (-) pathogenic bacteria, and two fungus were challenged against the
essential oils and extracts with antimicrobial standard agents for comparison. The assay
results showed that pathogen E.coli, C. albicans and S. aureus was more sensitive
towards the essential oil, than the remaining as seen in Table: (4.1.37). The MIC of the
oils and extracts were ranged between 4.26-9.63 mg/ml and 4.07-9 mg/ml respectively
whereas the MBC values of the oils and extracts were ranged between 11.67-21.67
mg/ml and 14.18-19.67 mg/ml respectively. The zone of inhibition was highest in
A.nigra leaf extract (25.63 ±0.72 mm) against C. albicans (Table: 4.1.38). The overall
results suggest that the essential oils and extracts are moderate in antimicrobial
activities.
Table-4.1.37: Antimicrobial activity of leaf and rhizome oil of Alpinia nigra.
Micro-
Organism
ANL oil
(mg/ml)
ANR oil
(mg/ml)
IZD of
gentamycin
at 5 mg in
mm
IZD of
ANL oil at
5 mg in
mm
IZD of
ANR oil at
5 mg in
mm
MIC MBC MIC MBC
E. faecalis 9.63 19.67 5.12 11.67 19.38 ±0.13 14.55±0.2 15.81±0.28
S. aureus 4.27 18.83 4.89 15.45 17±1 18.3 ± 0.13 17.94±0.17
A.
baumannii
9.38 21.67 8.52 18.62 24.67±0.57 20.73 ± 0.5
11.89±0.35
E.coli 4.26 20.72 6.51 19.27 24.8±0.25 22.91±0.36 19.62±0.23
C. albicans 4.5 17.58 8.18 15.35 25.67±0.59 21.59 ± 0.4 16.74±0.45
A. niger 7.0 18.63 9.21 17.98 25±1 18.36 ±0.52 11.87±0.33
ANL: Alpinia nigra Leaf; ANR: Alpinia nigra Rhizome; IZD: Inhibition Zone Diametre
Alpinia calcarata
The methanolic extracts of Alpinia calcarata were investigated for their in vitro
antimicrobial activity using disc diffusion method, MIC and MBC assay against two
Gram (+) and two Gram (-) pathogenic bacteria, and two fungus. As can be seen in
Table: 4.1.39, the methanolic extracts had shown weak antimicrobial activities against
all microorganisms tested. The MIC values of the extracts were ranged between 15.92-
19.82 mg/ml whereas the MBC values of the extracts were ranged between 19.29-27.98
mg/ml. The zone of inhibition was highest in A.calcarata rhizome extract (12.07±0.3
mm) against A. baumannii.
Page 41
92
Table-4.1.38: Antimicrobial activity of leaf and rhizome extract of Alpinia nigra.
Micro-
Organism
ANL extract
(mg/ml)
ANR extract
(mg/ml)
IZD of
gentamycin
at 5 mg in
mm
IZD of
ANL
extract at 5
mg in mm
IZD of
ANR
extract at 5
mg in mm
MIC MBC MIC MBC
E. faecalis 8.83 17.67 5.22 14.67 19.38 ±0.13 16.59±0.31 15.81±0.28
S. aureus 4.07 18.99 4.61 14.18 17±1 21.1 ± 0.3 19.93±0.13
A.
baumannii
8.38 19.67 7.65 19.29 24.67±0.57 19.43 ± 0.5
13.07±0.35
E.coli 6.74 19.12 7.11 19.27 24.8±0.25 18.25±0.68 16.24±0.68
C. albicans 6.9 16.87 7.23 15.35 25.67±0.59 25.63 ±0.72 24.38 ±0.72
A. niger 9.0 19.33 8.25 17.98 25±1 11.31 ±0.57 10.18 ±0.57
ANL: Alpinia nigra Leaf; ANR: Alpinia nigra Rhizome; IZD: Inhibition Zone Diametre
Table-4.1.39: Antimicrobial activity of leaf and rhizome extract of Alpinia
calcarata.
Micro-
Organism
ACL extract
(mg/ml)
ACR extract
(mg/ml)
IZD of
gentamycin
at 5 mg in
mm
IZD of
ACL
extract at 5
mg in mm
IZD of
ACR
extract at 5
mg in mm
MIC MBC MIC MBC
E. faecalis 16.34 23.88 15.92 24.79 19.38 ±0.13 6.59±0.15 9.81±0.25
S. aureus 16.07 21.69 17.86 24.18 17±1 11.51 ± 0.3 11.93±0.23
A.
baumannii
19.82 25.74 17.65 19.29 24.67±0.57 10.35 ± 0.5
12.07±0.3
E.coli 17.4 21.2 16.11 26.74 24.8±0.25 9.55±0.4 11.24±0.5
C. albicans - - 19.72 25.54 25.67±0.59 5.3 ±0.62 10.38 ± 0.2
A. niger - - 18.58 27.98 25±1 4.5 ± 0.44 9.18 ± 0.5 ACL: Alpinia calcarata Leaf; ACR: Alpinia calcarata Rhizome; IZD: Inhibition Zone Diametre
Kaempferia galanga
The antimicrobial activity of the essential oil and methanolic extracts of Kaempferia
galanga was evaluated using disc diffusion method, MIC and MBC assay against two
Gram (+) and two Gram (-) pathogenic bacteria, and two fungus. From the disc
diffusion method, it was observed that the test pathogens were susceptible to both oil
and extracts. However the differences in the zone sizes were observed with different
pathogens. Here the rhizome extract of K.galanga showed better activity against all
organisms than the rhizome oil and leaf extract. The MIC and MBC values of the
rhizome oil were ranged between 4.78-7.34 mg/ml and 10.58-14.72 mg/ml respectively
(Table: 4.1.40).
Page 42
93
The MIC and MBC values of the extracts were ranged between 4.15-20.45 mg/ml and
10.5-28.35 mg/ml respectively. (Table: 4.1.41). The zone of inhibition was highest in
rhizome extract (17.98±0.23 mm) against E.coli. Almost all the test pathogens were
sensitive to the rhizome extracts tested.
Table-4.1.40: Antimicrobial activity of rhizome oil of Kaempferia galanga.
Micro- Organism KGR oil (mg/ml) IZD of gentamycin
at 5 mg in mm
IZD of KGR oil at
5 mg in mm
MIC MBC
E. faecalis 7.34 12.27 19.38 ±0.13 14.51±0.2
S. aureus 4.78 11.83 17±1 16.94±0.2
A. baumannii 6.85 13.79 24.67±0.57 15.29±0.3
E.coli 5.96 14.72 24.8±0.25 17.62±0.23
C. albicans 5 10.58 25.67±0.59 16.76±0.4
A. niger 7.1 12.35 25±1 15.87±0.31 KGR: Kaempferia galanga Rhizome; IZD: Inhibition Zone Diametre
Table-4.1.41: Antimicrobial activity of leaf and rhizome extract of Kaempferia
galanga.
Micro-
Organism
KGL extract
(mg/ml)
KGR extract
(mg/ml)
IZD of
gentamycin
at 5 mg in
mm
IZD of
KGL
extract at 5
mg in mm
IZD of
KGR
extract at 5
mg in mm
MIC MBC MIC MBC
E. faecalis 11.34 21.17 6.48 11.25 19.38 ±0.13 7.55±0.12 15.52±0.2
S. aureus 15.78 22.88 4.47 10.36 17±1 6.3 ± 0.3 17.46±0.2
A.
baumannii
16.85 23.79 5.55 12.65 24.67±0.57
9.7 ± 0.5
16.25±0.3
E.coli 15.96 24.68 4.36 14.28 24.8±0.25 9.95±0.66 17.98±0.23
C. albicans 20.45 27.84 4.15 10.5 25.67±0.59 7.5 ± 0.4 16.96±0.4
A. niger 20.13 28.35 5.11 10.95 25±1 8.6 ± 0.5 15.77±0.31
KGL: Kaempferia galanga Leaf; KGR: Kaempferia galanga Rhizome; IZD: Inhibition Zone Diametre
Kaempferia rotunda
The essential oil and methanolic extracts of Kaempferia rotunda was found to have
good to moderate antimicrobial activities against two Gram (+) and two Gram (-)
pathogenic bacteria and two fungus as determined from disc diffusion method, MIC and
Page 43
94
MBC assay. Here the rhizome extract of K.rotunda showed better activity against some
microorganisms than the rhizome oil and leaf extract. The MIC and MBC values of the
rhizome oil were ranged between 8.34-10.91mg/ml and 19.65-22.58 mg/ml respectively
(Table: 4.1.42). Similarly the MIC and MBC values of the extracts were ranged
between 6.86-15.54 mg/ml and 10.63-27.83 mg/ml respectively. (Table: 4.1.43). The
zone of inhibition was highest in rhizome extract (16.69±0.2 mm) against S. aureus.
The assay results showed that pathogens like E.coli and A. baumannii were more
sensitive towards the essential oil than the remaining microbes as seen in Table (
4.1.42), whereas the extract of K.rotunda showed good activity against S. aureus and
E.coli.
Table-4.1.42: Antimicrobial activity of rhizome oil of Kaempferia rotunda.
Micro- Organism KRR oil (mg/ml) IZD of gentamycin
at 5 mg in mm
IZD of KRR oil at
5 mg in mm
MIC MBC
E. faecalis 9.63 20.23 19.38 ±0.13 11.51±0.4
S. aureus 8.75 21.87 17±1 12.59±0.2
A. baumannii 9.52 19.65 24.67±0.57 14.94±0.3
E.coli 8.34 20.12 24.8±0.25 15.72±0.23
C. albicans 10.5 22.58 25.67±0.59 14.87±0.25
A. niger 10.91 21.35 25±1 13.73±0.34
KRR: Kaempferia rotunda Rhizome; IZD: Inhibition Zone Diametre
Table-4.1.43: Antimicrobial activity leaf and rhizome extract of Kaempferia
rotunda.
Micro-
Organism
KRL extract
(mg/ml)
KRR extract
(mg/ml)
IZD of
gentamycin
at 5 mg in
mm
IZD of
KRL
extract at 5
mg in mm
IZD of
KRR
extract at 5
mg in mm
MIC MBC MIC MBC
E. faecalis 15.54 26.72 9.64 15.56 19.38 ±0.13 6.5±0.12 10.52±0.2
S. aureus 14.66 25.28 7.47 10.63 17±1 5.3 ± 0.3 16.69±0.2
A.
baumannii
- - 8.54 13.75 24.67±0.57 4.7 ± 0.5
15.25±0.3
E.coli 14.62 27.83 6.86 14.86 24.8±0.25 5.95±0.6 14.9±0.23
C. albicans - - 7.71 15.55 25.67±0.59 2.5 ± 0.4 15.9±0.44
A. niger - - 8.18 16.53 25±1 2.6 ± 0.5 14.7±0.31 KRL: Kaempferia rotunda Leaf; KRR: Kaempferia rotunda Rhizome; IZD: Inhibition Zone Diametre
Page 44
95
Kaempferia parishii
The methanolic extracts of Kaempferia parishii were examined for their in vitro
antimicrobial activity using disc diffusion method, MIC and MBC assay against two
Gram (+) and two Gram (-) pathogenic bacteria, and two fungus. As can be seen in
Table: 4.1.44, the methanolic extracts possess very weak antimicrobial activities against
some microorganisms tested while the extracts had no activity against some
microorganisms. The MIC values of the extracts were ranged between 14.44-21.96
mg/ml whereas the MBC values of the extracts were ranged between 25.66-27.83
mg/ml. The zone of inhibition was highest in K.parishii rhizome extract (7.9±0.23 mm)
against A. baumannii.
Table-4.1.44: Antimicrobial activity of leaf and rhizome extract of Kaempferia
parishii.
Micro-
Organism
KPL extract
(mg/ml)
KPR extract
(mg/ml)
IZD of
gentamycin
at 5 mg in
mm
IZD of
KPL
extract at 5
mg in mm
IZD of
KPR
extract at 5
mg in mm
MIC MBC MIC MBC
E. faecalis - - 14.73 25.66 19.38 ±0.13 - 5.52±0.2
S. aureus 19.78 - 15.89 27.83 17±1 3.3 ± 0.3 7.46±0.2
A.
baumannii
- - - - 24.67±0.57 1.7 ± 0.5
6.25±0.3
E.coli 21.96 - 14.44 26.78 24.8±0.25 2.9±0.66 7.9±0.23
C. albicans - - - - 25.67±0.59 - 6.36±0.4
A. niger - - - - 25±1 - 5.7±0.31 KPL: Kaempferia parishii Leaf; KPR: Kaempferia parishii Rhizome; IZD: Inhibition Zone Diametre
4.1.2.3. Evaluation of anticancerous activity
Alpinia galanga
The essential oils of Alpinia galanga were exhibited moderate anticancerous activity
against two cell lines i.e. HeLa and MCF7 as evaluated by MTT assay. The rhizome
essential of Alpinia galanga showed high inhibition percent (62 ± 1.30) than leaf oil (45
± 1.11) at 20µg/ml on HeLa cell line (Table: 4.1.45). In case of MCF7 cell line, the
rhizome oil (27.15 ± 2.2) also showed better activity than the leaf oil (15.15 ± 0.54) at
20µg/ml (Table: 4.1.45). The inhibition percent slightly increases with increasing the
concentration of both leaf and rhizome oil of Alpinia galanga (Fig: 4.1.32).
Page 45
96
Alpinia malaccensis
The anticancerous activity of essential oils of Alpinia malaccensis were evaluated
against two cell lines i.e. HeLa and MCF7 by MTT assay. The result showed that the
oils exhibited poor activity as the oils displayed weak inhibitions. The percentage
cancer cell inhibition profiles were found to be concentration dependent (Fig: 4.1.33).
The inhibition percent slightly increases with increasing the concentration of both leaf
and rhizome oil of Alpinia malaccensis. The rhizome essential of Alpinia malaccensis
showed high inhibition percent (28.60 ± 0.64) than leaf oil (14.55 ± 0.52) at 20µg/ml
against HeLa cell line (Table: 4.1.45). In case of MCF7 cell line, the rhizome oil (24.54
± 0.34) also showed better activity than the leaf oil (15.60 ± 0.64) at 20µg/ml (Table:
4.1.45)
Alpinia nigra
Screening of essential oils of Alpinia nigra resulted in significant anticancer activities
against HeLa and MCF-7 cell lines as evaluated by MTT assay. The percentage of cell
inhibition values at 10 and 20μg/ml concentrations were given in the table (4.1.45). The
inhibition percent increases with increasing the concentration of both leaf and rhizome
oil (Fig: 4.1.34). The rhizome essential of Alpinia nigra showed high inhibition percent
than leaf oil against both HeLa and MCF7 cell line (Table: 4.1.45). The inhibition
percent of leaf and rhizome oil against HeLa cell line at 20µg/ml was found be 60 ±
3.33 and 79 ± 2.6 respectively. Whereas in case of MCF7 cell line, the rhizome oil
resulted in 70.9% ± 5.34 inhibition which was also higher than that of the leaf oil (50 ±
3.5) at 20µg/ml (Table: 4.1.45).
Kaempferia galanga
The anticancerous activity of rhizome essential oils of Kaempferia galanga was
evaluated against two cell lines i.e. HeLa and MCF7 by MTT assay. The result showed
that the rhizome oil exhibited strong activity. The percentage of cell inhibition values at
10 and 20μg/ml concentrations were given in the table (4.1.45). The inhibition percent
increases with increase in the concentration rhizome oil (Fig: 4.1.35). At 20µg/ml
concentration, the rhizome essential of Kaempferia galanga displayed 82.33% ± 3.76
inhibition against HeLa cell line whereas that of MCF7 cell line was found to be 78.4 ±
4.35 (Table: 4.1.45).
Page 46
97
Fig. 4.1.32: Anticancerous activity of essential oils of Alpinia galanga on HeLa (A)
and MCF7 (B) cell line
Fig. 4.1.33: Anticancerous activity of essential oils of Alpinia malaccensis on HeLa
(A) and MCF7 (B) cell line
Page 47
98
Fig. 4.1.34: Anticancerous activity of essential oils of Alpinia nigra on HeLa (A)
and MCF7 (B) cell line
Fig. 4.1.35: Anticancerous activity of essential oils of Kaempferia galanga on
HeLa (A) and MCF7 (B) cell line
Fig. 4.1.36: Anticancerous activity of essential oils of Kaempferia rotunda on
HeLa (A) and MCF7 (B) cell line
Page 48
99
Kaempferia rotunda
The rhizome essential oils of Kaempferia rotunda was evaluated for its anticancerous
activity against two cell lines i.e. HeLa and MCF7 by MTT assay. The result showed
that the inhibition percentage increases with increase in the concentration (Fig:
4.1.36).The percentage of cell inhibition values at 10 and 20μg/ml concentrations were
given in the table (4.1.45). At 20µg/ml concentration, the rhizome essential of
Kaempferia rotunda displayed 75.63%±5.66 inhibition against HeLa cell line whereas
that of MCF7 cell line was found to be 68.44± 2.51 (Table: 4.1.45).
Table-4.1.45: Percentage (%) of cell inhibition of essential oils of Alpinia and
Kaempferia species on HeLa and MCF-7 cell line.
Sample Name HeLa
10 µg/ml 20 µg/ml
MCF7
10 µg/ml 20 µg/ml
AG (L) 30 ± 0.82 45 ± 1.11 13.1 ± 0.54 15.15 ± 0.54
AG (R) 45± 2.33 62 ± 1.30 20.11 ± 0.52 27.15 ± 2.2
AM (L) 6.92 ± 0.33 14.55 ± 0.52 9.55 ± 0.52 15.60 ± 0.64
AM (R) 17.38 ± 0.29 28.60 ± 0.64 19.34 ± 0.74 24.54 ± 0.34
AN (L) 33 ± 1.57 60 ± 3.33 27 ± 5.56 50 ± 3.5
AN (R) 47± 2.10 79 ± 2.6 56± 4.10 70.9 ± 5.34
KG (R) 41.58 ± 1.81 82.33 ± 3.76 37.19 ± 0.42 78.4 ± 4.35
KR (R) 31.83± 2.43 75.63± 5.66 26.95± 1.36 68.44± 2.51 AG (L): Alpinia galanga leaf, AG (R): Alpinia galanga rhizome, AM (L): Alpinia malaccensis leaf, AM
(R): Alpinia malaccensis rhizome, AN (L): Alpinia nigra leaf, AN (R): Alpinia nigra rhizome, KG (R):
Kaempferia galanga rhizome, KR (R): Kaempferia rotunda rhizome
4.2. Molecular characterisation
The present study was carried out for molecular profiling of four species of Alpinia and
three species of Kaemferia collected from different regions of Odisha using molecular
markers with the objective of analyzing the banding pattern and developing DNA
fingerprints of all species. For this purpose, four different types of molecular markers
like random amplified polymorphic DNA (RAPD), inter simple sequence repeat
(ISSR), simple sequence repeat (SSR) and other sequenced based markers were used.
The results obtained with respect to different markers for all species of Alpinia and
Kaemferia are described below.
4.2.1. RAPD Analysis
All twenty one DNA samples of seven species produced reproducible bands with nine
selected RAPD primers out of 30 primers tried. The banding pattern of all species with
respect to different primer was analyzed and selected gel pictures were represented
Page 49
100
below (Fig 4.2.1). A total of 91 numbers of loci were amplified and all were found to be
polymorphic in nature. The highest number of (14) loci were amplified with the primer
D18 and lowest numbers of loci (07) were observed in the primer A18 and no unique
bands were found. The percentage of polymorphic loci (PPL) found here hundred
percent in all nine primers. The total number of fragment amplified also varies from 41
to 105 in A18 and D18 respectively. The range of resolving power (Rp) found over here
is 4.56 to 10.06 in A11 and D18 respectively. The polymorphic information content of
nine primers studied here gives no such big differences. Polymorphic information
content (PIC) values found lowest in A10 that is 0.8 and highest in A11 that is 0.93.
Detail data of other primers also mentioned in Table (4.2.1).
4.2.2. ISSR Analysis
All twenty one DNA samples of seven species produced reproducible bands with 13
selected ISSR primers out of 40 primers tried. The banding pattern of all species with
respect to different primer was analyzed and selected gel pictures were represented
(Fig. 4.2.2). A total of 118 numbers of loci were amplified and all were found to be
polymorphic in nature. The highest number of (14) loci were amplified with the primer
(GA)9T and lowest numbers of loci (05) were observed in the primer (CAA)5 and no
unique bands were found. The percentage of polymorphic loci (PPL) found here
hundred percent in all 13 primers. The total number of fragment amplified also varied
from 24 to 98 in ISSR15 and (GA)9T respectively. The range of resolving power (Rp)
found over here is 2.56 to 9.36 in ISSR 16 and (GA)9T respectively. The polymorphic
information content of 13 primers studied here revealed not much differences.
Polymorphic information content (PIC) values found lowest in (GA)9T that is 0.85 and
highest in ISSR 15 that is 0.97. Detail data of other primers also mentioned in the Table
(4.2.2).
4.2.3. SSR Analysis
All twenty one DNA samples of seven species produced reproducible bands with 11
selected ISSR primers out of 35 primers tried. The banding pattern of all species with
respect to different primer has been analyzed and some selected gel pictures were
represented below (Fig. 4.2.3).
Page 50
101
Fig. 4.2.1: RAPD profiling of Alpinia and Kaempferia species with primers D20
(A), D18 (B), D8 (C). (M- gene ruler100bp ladder plus, Lane 1-3 represents
A. malacencis, lane 4-6 A. nigra, lane7-9 A. galanga, lane 10-12 A.
Calcarata, lane 13-15 K. galanga, lane 16-18 K. rotunda, lane 19-21 K.
parishii.
Page 51
102
A total of 201 numbers of loci were amplified and all were found to be polymorphic in
nature. The highest number of (34) loci were amplified with the primer SSR 14 and
lowest numbers of loci (05) were observed in the primer SSR 13 and no unique bands
were found. The percentage of polymorphic loci (PPL) found here hundred percent in
all 11 primers. The total number of fragment amplified also varied from 33 to 188 in
SSR13 and SSR 14 respectively. The range of resolving power (Rp) found over here is
3.12 to 17.86 in SSR 13 and SSR 14 respectively. The polymorphic information content
of 11 primers studied here showed no such big differences. Polymorphic information
content (PIC) value was found lowest (0.78) in SSR 13 and highest (0.97) in SSR 11.
Detail data of other primers also mentioned in Table (4.2.3).
4.2.4. Sequence based marker analysis
All twenty one DNA samples of seven species produced reproducible bands with 07
selected sequence based primers (rbcL, rpoC1, rpoB, matK, atpF-atpH, psbK-psbl,
trnH-psbA) out of 20 primers tried. The banding pattern of all species with respect to
different primer was analyzed and selected gel pictures were represented (Fig. 4.2.4). A
total of 29 numbers of loci were amplified out of which 20 no. of loci are polymorphic
in nature. The highest number of (6) loci were amplified with the primer rbcL and
lowest numbers of loci (02) were observed in the primer rpoC1. The range of
percentage of polymorphic loci (PPL) was found 83.33% to 25% in matK and trnH-
psbA primers respectivelly. The total number of fragment amplified also varies from 24
to 108 in rpoC1and rbcL respectively. The range of resolving power (Rp) found over
here is 2.28 to 10.28 in rpoC1and rbcL respectively. The polymorphic information
content of 7 primers studied here revealed remarkable differences. Polymorphic
information content (PIC) values found lowest (0.16) in rpoC1and highest (0.74) in
atpF-atpH. Detail data of other primers also mentioned in Table (4.2.4). We also found
unique specific fragment of ~800 bp by rbcL primer and ~400 bp by rpoB primer
amplified only in Alpinia nigra and not in other six species undertaken here.(Fig.
4.2.4a,b). Similarly in each of three Alpinia calcarata sample ~380 bp unique fragment
was amplified while remaining absent in all other six species (Fig. 4.2.4c).
Page 52
103
Fig. 4.2.2: ISSR profiling of Alpinia and Kaempferia species with primers ISSR 17
(A), (GA) 9T (B), (GTGC)4 (C). (M- gene ruler100bp ladder plus, Lane 1-
3 represents A. malacencis, lane 4-6 A. nigra, lane7-9 A. galanga, lane 10-
12 A. Calcarata, lane 13-15 K. galanga, lane 16-18 K. rotunda, lane 19-21
K. parishii.
Page 53
104
Fig. 4.2.3: SSR profiling of Alpinia and Kaempferia species with primers SSR 14
(A), SSR 1 (B). (M- gene ruler100bp ladder plus, Lane 1-3 represents A.
malacencis, lane 4-6 A. nigra, lane7-9 A. galanga, lane 10-12 A. Calcarata,
lane 13-15 K. galanga, lane 16-18 K. rotunda, lane 19-21 K. parishii.
Page 54
105
Fig. 4.2.4: Profiling of Alpinia and Kaempferia species with sequence based marker
with primers rbcL (A) rpoB (B) trnH-psbA (C) (M-gene ruler100bp ladder
plus (A,C) and 50 bp ladder (B), Lane 1-3 represents A. malacencis, lane 4-
6 A. nigra, lane7-9 A. galanga, lane 10-12 A. Calcarata, lane 13-15 K.
galanga, lane 16-18 K. rotunda, lane 19-21 K. parishi.
Page 55
106
Table-4.2.1: List of primers used for RAPD amplification, GC content, total number of loci, the level of polymorphism,
resolving power and PIC value.
Primer Primer sequence % GC content
Annealing
Temperature
(in 0 C)
TNL NPL (%)
PPL
TNF
A Rp PIC
A10 GTGATCGCAG 50 37 11 11 100 93 8.9 0.8
A11 CAATCGCCGT 60 37 10 10 100 48 4.56 0.93
A18 AGGTGACCGT 60 37 7 7 100 41 6.57 0.91
D8 GTGTGCCCCA 70 37 12 12 100 103 9.8 0.8
A20 GTTGCGATCC 60 37 10 10 100 75 7.18 0.83
D18 GAGAGCCAAC 60 37 14 14 100 105 10.06 0.86
D20 ACCCGGTCAC 70 37 8 8 100 63 6.04 0.82
N6 GAGACGCACA 60 37 10 10 100 60 5.7 0.89
N16 AAGCGACCTG 60 37 9 9 100 51 4.88 0.92
TNL: Total no. of loci, NPL: No. of polymorphic loci, PPL: Percentage of polymorphic loci, TNFA: Total no. of fragments amplified, RP:
Resolving power, PIC: Polymorphic information content.
Page 56
107
Table-4.2.2: List of primers used for ISSR amplification, GC content, total number of loci, the level of polymorphism,
resolving power and PIC value.
Primer Primer sequence % GC
content
Annealing
Temperature
(in 0 C)
TNL NPL (%)
PPL TNFA Rp PIC
(CAA)5 CAA CAA CAA CAA CAA 33.3 35 5 5 100 26 2.48 0.93
(GGA)4 GGA GGA GGA GGA 66.6 35 8 8 100 36 3.46 0.95
(GA)9T GAGAGAGAGAGAGAGAGAT 42.8 51 14 14 100 98 9.36 0.85
(GTGC)4 GTGC GTGC GTGC GTGC 75 51 12 12 100 78 7.44 0.88
(GTG)5 GTG GTG GTG GTG GTG 66.6 45 7 7 100 39 3.7 0.9
(GAC)5 GAC GAC GAC GAC GAC 66.6 45 10 10 100 63 6.04 0.9
(AGG)6 AGG AGG AGGAGGAGGAGG 66 55 7 7 100 41 3.94 0.92
(GACA)4 GACA GACA GACA GACA 50 43 9 9 100 51 3.74 0.89
(TA)8G TA TA TA TA TA TA TA TA G 6.25 36 7 7 100 24 2.26 0.97
(AG)8T AG AG AG AG AG AGAGAGT 47.05 50 7 7 100 27 2.56 0.96
(GA)8T GA GA GA GA GA GAGAGAT 47.05 50 14 14 100 85 8.06 0.89
(GT)8T GT GT GT GT GT GT GT GT T 47.05 50 8 8 100 45 3.16 0.87
T(GA)9 TGAGAGAGAGAGAGAGAGA 47.4 51 10 10 100 64 6.1 0.86
TNL: Total no. of loci, NPL: No. of polymorphic loci, PPL: Percentage of polymorphic loci, TNFA: Total no. of fragments amplified, RP:
Resolving power, PIC: Polymorphic information content.
Page 57
108
Table 4.2.3: List of primers used for SSR amplification, GC content, total number of loci, the level of polymorphism, resolving power and PIC value.
Primer Primer sequence % GC
content
Annealing
Temperature
(in 0 C)
TNL NPL (%) PPL TNFA Rp PIC
SSR1 F: ATG AAC CCC TTC GGT CAC C
R: TGT AAC TCC TCT CGC CGT ATG 55 50 15 15 100 90 8.6 0.88
SSR2 F: CCA AGT GCC CTA TCC TAA CA
R: CCT GGA AAC CTG AAT CCA TTA 46.3 50 27 27 100 153 14.6 0.91
SSR5 F: ACA GCA CTC AAC AAC AGG AGA
R:CCT GGA AAC CTG AAT CCA TTA 45.2 50 21 21 100 101 9.66 0.94
SSR7 F: GTA GCT CAC CTC TGC AAT CCT
R:CTG CCT CCT CCA GTG TTC CTA 54.7 51 22 22 100 99 9.44 0.95
SSR9 F: TCT GGT GCG GAA AGT TAG GAT
R: GGA GGC ACA TAA ACC AGT TCT 47.6 50 21 21 100 77 7.28 0.97
SSR10 F: ACT GTC GAA GCG TAC ATC CC
R: CTT GAA CTC GCT GAA GTC CAC 53.6 51 20 20 100 127 12.1 0.88
SSR11 F: TTA ATC AAC CTG TAG CCG CC
R:TAC CAA AAT GGA AGG AGT GGA 46.3 50 12 12 100 42 3.96 0.97
SSR12 F: AGC AAG GAC CAA ACC ACT CTC
R: CGC GCT CTA GGA CGA GTT AAT 52.3 51 14 14 100 58 5.52 0.95
SSR13 F: TGC AGT CAA CTT TTA CAA CAC
R:GAC CCA ACT CAA GAA GGA AAT 40.4 50 5 5 100 33 3.12 0.78
SSR14 F: CTG CGG TCC AAG TAC AAG ATC
R:CTA GCT GGT GGC GGT GGT 61.5 54 34 34 100 188 17.86 0.91
SSR 18 F: CTT TTG GCT GAT AAA TGG AAG G
R: AAG AAA GAA CTG ACA TCC TCC G 44.1 49 10 10 100 59 5.6 0.9
TNL: Total no. of loci, NPL: No. of polymorphic loci, PPL: Percentage of polymorphic loci, TNFA: Total no. of fragments amplified, RP: Resolving power,
PIC: Polymorphic information content.
Page 58
109
Table 4.2.4: List of primers used for sequence based marker amplification, GC content, total number of loci, the level of polymorphism,
resolving power and PIC value.
Primer Primer sequence % GC
content
Annealing
Temperature
(in 0 C)
TNL NPL (%) PPL TNFA Rp PIC
rbcL F: GGCAAAGAGGGAAGATTTCG
R: CCATAAGCATATCTTGAGTTGG 45.23 49 6 5 83.3 108 10.28 0.16
rpoC1 F: ATGCAACGTCAAGCAGTTCC
R: CCGTATGTGAAAAGAAGTATA 41.46 49 2 1 50 24 2.28 0.49
rpoB F: GTTCTAGCACAAGAAAGTCG
R: TAATTTACGATCAATTCATTC 34.14 49 3 2 66.6 30 2.86 0.63
matK F: ACTCGCACACACTCCCTTTCC
R: GCTTTTATGGAAGCTTTAACAAT 43.18 53 6 5 83.33 66 6.28 0.65
atpF-atpH F: TTAGCCTTTGTTTGGCAAG
R: AGAGTTTGAGAGTAAGCAT 39.47 49 4 4 100 42 4 0.74
psbK-pgbl F: GTAAAATCAAGTCCACCRCG
R: ATGTCACCACAAACAGAGACTAAAGC 43.47 53 4 2 50 57 5.42 0.41
trnH-psbA F: GTTATGCATGAACGTAATGCTC
R: CGCGCATGGTGGATTCACAATCC 48.88 53 4 1 25 66 6.28 0.24
TNL: Total no. of loci, NPL: No. of polymorphic loci, PPL: Percentage of polymorphic loci, TNFA: Total no. of fragments amplified, RP: Resolving
power, PIC: Polymorphic information conte
Page 59
110
4.3. In vitro studies of target taxa
4.3.1. Establishment of tissue culture
Tissue culture is a potent method for multiplication and conservation of various
medicinal plant species and is considered as an alternative to conventional method of
conservation. Selected species of Alpinia and Kaempferia with high drug yielding
potential were established in culture for conservation and future improvement. Four
plant species, such as Alpinia galanga, Alpinia malaccensis, Kaempferia galanga and
Kaempferia rotunda have been successfully established in culture. The in vitro
responses of all species towards optimum requirements of growth regulators for shoot
multiplication are given in table (4.3.5).
4.3.1.1. Alpinia galanga
The axillary buds from unsprouted rhizomes were used as explants (Fig:4.3.1a) and
these were surface sterilised and inoculated on MS media containing different
combinations of BA (1-3 mg/L), Kin (2-3 mg/L), IAA (0.5-1.0 mg/L) and NAA (0.5-1.0
mg/L) (Table: 4.3.1). Effect of various plant growth regulators on the initiation of
shoots was observed (Fig: 4.3.1a &b). Of the various media tried, percentage of shoot
initiation was highest i.e., 82.5±1.03 in media containing only BA (3 mg/L) and NAA
(0.5 mg/L) (Table: 4.3.1). Explants sprouted on this medium within 7 days of
inoculation. Proliferations of shoots were observed in different growth regulators as
mentioned in Table: 4.3.1. Among the different media tried, percentage of shoot
multiplication from the explants was highest i.e., 86.2±0.32 in MS media containing BA
(3 mg/L) in combination with Kn (3 mg/L) and NAA (1 mg/L) (Table: 4.3.1).
Maximum number of shoots (12.4±0.50) and maximum number of roots (11.2±0.37)
(Fig: 4.3.1c&d) were also found in the same media (Table: 4.3.1). Percentage of shoot
initiation increased with increased concentration of BA. Addition of IBA and NAA had
not given better response. Multiplication of shoots (Fig: 4.3.1e) was more in media with
BA and kinetin as compared to that with only BA. Development of root was seen in the
same media. After 90 days of culture, micropropagated plantlets with shoots and roots
were potted in sterilized soil, cow dung and sand at 1:1:1 proportion. Then the plants
were kept in a greenhouse for a month for acclimatization. After being transferred to
field conditions, about 85% of plants survived effectively (Fig: 4.3.1f &g).
Page 60
111
Fig. 4.3.1: Establishment of tissue culture in Alpinia galanga: a) & (b) Explants
showing shoot initiation from rhizome bud in A.galanga (c) & (d)
Regenerated plants of A.galanga with shoots and roots (e) In vitro
multiplication of plantlets. (f) Micropropagated plants of A.galanga
growing under field conditions (g) Flowering in micropropagated
plants.
Page 61
112
Table 4.3.1: Effect of different growth regulators on in vitro shoot initiation and
shoot multiplication of Alpinia galanga on MS medium.
Sl
no
MS medium +
growth regulator
(mg/L)
% of shoot
initiation
(Mean ± SE)
% of shoot
multiplication
(Mean ± SE)
No of shoots/
explants
(Mean ± SE)
No of roots/
explants
(Mean±SE)
1 BA(1) 22.2±0.8 - - -
2 BA(2) 23.9±1.0 - - -
3 BA(2),IAA(0.5) 25.8±0.48 25.0±0.31 4.3±0.27 5.5±0.32
4 BA(2),IAA(1) 26.2±0.38 26.0±0.31 4.8±0.36 6.8±0.37
5 BA(3) 32.8±0.9 30.8±0.33 5.2±0.37 6.4±0.6
6 BA(3),NAA(0.5) 82.5±1.03 29.6±1.53 6±0.31 7.4±0.24
7 BA(3),NAA(1) 74.4±1.1 27.0±0.3 5.6±0.4 8.4±0.4
8 Kn(2) 44.4±1.0 10.5±0.64 4±0.31 5.6±0.24
9 Kn(3) 45.9±1.0 24.4±0.2 6.4±0.6 6.2±0.58
10 Kn(3),NAA(0.5) 50.36±0.8 35.2±0.3 7.4±0.24 9.2±0.2
11 Kn(3),NAA(1) 51.5±0.8 41.0±0.3 6.8±0.41 9.4±0.24
12 BA(3),Kn(3),
IAA(0.5) - 44.6±0.2 8±0.31 9.8±0.37
13 BA(3),Kn(3),
IAA(1) - 52.5±0.24 8.8±0.37 10.8±0.37
14 BA(3),Kn(3),
NAA(0.5) - 78.6±0.31 10.8±0.58 10.4±0.50
15 BA(3),Kn(3),
NAA(1)
- 86.2±0.32 12.4±0.50 11.2±0.37
4.3.1.2. Alpinia malaccensis
After surface sterilization, the axillary buds from unsprouted rhizomes of
conventionally grown Alpinia malaccensis were cultured as explants (Fig: 4.3.2a) on
MS media containing varying combinations of BA (1-4 mg/l), Kin (1-3 mg/l), IAA (0.5-
1.0 mg/l), IBA (0.5-1.0 mg/l) NAA (0.5-1.0 mg/l) and Ads (50-100 mg/l). Out of
various media used percentage of shoot initiation (Fig: 4.3.2a&b) was maximum i.e.,
84.8±0.62 in MS media containing BA (2 mg/l) in combination with Kn(1 mg/l) and
IBA (0.5 mg/l) (Table: 4.3.2). Explants sprouted on this medium within 20 days of
inoculation. Higher concentration of BA showed less response towards in vitro shoot
Page 62
113
Fig. 4.3.2: Establishment of tissue culture in Alpinia malaccensis. (a) & (b)
Explants showing shoot initiation from rhizome bud. (c) Regenerated
plants of A.malaccensis with shoots and roots. (d) In vitro multiplication
of plantlets. (e) Potted plants. (f) Micropropagated plants growing
under field conditions (g) Flowering in micropropagated Plants.
Page 63
114
initiation. Propagation of shoots was seen in various growth regulators as mentioned in
Table (4.3.2). Of the various combinations tried percentage of shoot multiplication from
the explants was highest i.e., 79.54±0.34 in MS liquid media containing BA (3 mg/l) in
with Kn (3 mg/l) and NAA (1 mg/l) (Table: 4.3.2). Maximum number of shoots
(9±0.31) was also found in the same media (Table: 4.3.2). Number of roots were highest
i.e. 6.92±0.86 in the media containing BA (3 mg/l) with IAA (1 mg/l) and Ads (50
mg/l). Percent of shoot initiation increased with addition of Kn and IBA. But addition of
more concentration of IBA beyond 0.5 mg/l did not give better response. Multiplication
of shoots (Fig: 4.3.2d) was more in liquid media as compared to solid media. Number of
roots was less as compared to number of shoots. In vitro grown plantlets (Fig: 4.3.2c)
with shoots and roots were potted in sterilized soil, cow dung and sand at 1:1:1
proportion after 90 days of culture (Fig: 4.3.2e). For acclimatization, the plants were
kept in a greenhouse for a month. After transferred to field conditions, about 95% of
plants survived successfully (Fig: 4.3.2f&g).
4.3.1.3. Kaempferia galanga
The rhizome buds of normally grown plants of Kaempferia galanga were used as
explants (Fig: 4.3.3a) and was inoculated on MS media with varying combinations of
BA (1-3 mg/l), IAA (0.5-1.0 mg/l), NAA (0.5 mg/l) and Ads (50-100 mg/l). Effect of
various hormones on the shoot initiation (Fig: 4.3.3b) from the rhizome bud was
observed. % of shoot initiation was highest i.e. 96.33±0.51 in media combination of BA
(1 mg/l) and IAA (0.5 mg/l) (Table: 4.3.3). The multiplication of shoot buds (Fig:
4.3.3d) was seen in almost all media given in the Table (4.3.3), but the rate of
multiplication was found maximum in BA (1 mg/l) and IAA (0.5 mg/l) combination
(Table: 4.3.3). Highest number of shoots i.e., 12.38±0.52 was found in same media with
BA (1 mg/l) and IAA (0.5 mg/l) and the shoots were rooted (Fig: 4.3.3c) on the same
media and the maximum number of roots was 9.98±0.35 (Table: 4.3.3). After
transferred to field conditions, about 95% of plants survived successfully (Fig:
4.3.2f&g). After 90 days of culture, micropropagated Kaempferia galanga plantlets
were potted in sterilized soil, cow dung and sand at 1:1:1 proportion (Fig: 4.3.3e). For
acclimatization, the plants were first kept in a greenhouse for a month and then in field
condition with 96% of survival rate (Fig: 4.3.3f&g).
Page 64
115
Fig. 4.3.3: Establishment of tissue culture in Kaempferia galanga: (a) & (b)
Explants showing shoot initiation from rhizome bud in K.galanga (c)
Regenerated plants of K.galanga with shoots and roots (d) In vitro
multiplication of plantlets (e) Potted plants (f) Micropropagated plants
of K.galanga growing under field conditions (g) Flowering in
micropropagated plants.
Page 65
116
Table 4.3.2: Effect of different growth regulators on in vitro shoot initiation and
shoot multiplication of Alpinia malaccensis on MS medium.
Sl
no
MS medium +
growth regulator
(mg/L)
% of shoot
initiation
(Mean ±SE)
% of shoot
multiplication
(Mean ± SE)
No of shoots/
explants
(Mean ± SE)
No of roots/
explants
(Mean±SE)
1 BA(1) 5.6±0.09 - - -
2 BA(2) 6.4±0.14 - - -
3 BA(3) 14.5±0.23 - - -
4 BA(4) 5.5±0.5 - - -
5 BA(2)IAA(0.5) 12.7±0.35 15.4±0.42 2.4±0.1 0±0.00
6 BA(2)IAA(1) 26.2±0.41 16.2±0.8 4.25±0.13 1±0.11
7 BA(2)IBA(0.5) 53.9±0.7 21.8±0.66 3.22±0.23 4.12±0.2
8 BA(2)IBA(1) 63.6±0.3 24.8±0.43 3.66±0.5 6.4±0.43
9 BA(2)Kn(1)IBA
(0.5) 84.8±0.62 27.0±0.13
5.8±0.33 5.2±0.15
10 BA(2)Kn(1)IBA
(1) 47.2±0.44 30.4±0.21
5.21±0.23 5.63±0.73
11 BA(3)IAA(1)Ads
(50) 54.5±0.37 31.2±0.31
7.87±0.34 6.92±0.86
12 BA(3)IAA(1)Ads
(100) 56.02±0.5 36.2±0.3
8.2±0.13 4.88±0.22
13 BA(3)Kn(3)IBA
(0.5) 64.58±0.52 50.6±0.62
7.4±0.4 5.69±0.35
14 BA(3)Kn(3)IBA (1) 67.2±0.64 56.2±0.73
8.2±0.13 4.88±0.22
15 BA(3)Kn(3)NAA
(0.5)
- 64.6±0.25
7.4±0.4 5.69±0.35
16 BA(3)Kn(3)NAA
(1)
- 79.54±0.34
9±0.31 6.18±0.5
Table 4.3.3: Effect of different growth regulators on in vitro shoot initiation and
shoot multiplication of Kaempferia galanga on MS medium
Sl
no
MS medium +
growth regulator
(mg/L)
% of shoot
initiation
(Mean ± SE)
% of shoot
multiplication
(Mean ± SE)
No of shoots/
explants
(Mean ± SE)
No of roots/
explants
(Mean±SE)
1 BA(1) 53.6±0.35 23.6±0.5 6.5±0.2 5.63±0.22
2 BA(2) 70.97±0.43 16.0±0.3 7.66±0.37 6.66±0.57
3 BA(3) 76.52±0.44 76.8±0.3 5.33±0.52 6.93±0.14
4 BA(1)IAA(0.5) 96.33±0.51 83.0±0.3 12.38±0.52 9.98±0.35
5 BA(3)IAA(0.5) 82.8±0.38 67.0±0.3 9.75±0.23 5.36±0.15
6 BA(3)IAA(1) 76.91±0.66 34.4±0.2 6.94±0.43 5.93±0.19
7 BA(3)IAA(0.5)
Ads(50) 71.57±0.37 35.2±0.3
5.86±0.32 6.66±0.56
8 BA(3)IAA(0.5)
Ads(100) 65.85±0.53 44.0±0.3
7.66±0.21 7.39±0.17
9 BA(3)IAA(1)
Ads(100) 63.46±0.71 40.6±0.2
8.54±0.2 5.44±0.15
10 BA(3)NAA(0.5) 74.97±0.26 46.2±0.3 7.33±1.52 6.83±1
Page 66
117
Fig. 4.3.4: Establishment of tissue culture in Kaempferia rotunda: (a) & (b)
Explants showing shoot initiation from rhizome bud in K.rotunda. (c) &
(d) Regenerated plants of K.rotunda with shoots and roots. (e) In vitro
multiplication of plantlets. (f) Potted plants. (g) Micropropagated plants
of K.rotunda growing under field conditions
Page 67
118
4.3.1.4. Kaempferia rotunda
Sprouted rhizome buds of Kaempferia rotunda were cultured as explants (Fig: 4.3.4a)
on MS media with different combinations of BA(1-3mg/l), IAA(0.5-1mg/l), NAA(0.5-
1mg/l) Kn (3mg/l) and Ads (50-100 mg/l) (Table: 4.3.4). Percentage of explants
forming shoot (Fig: 4.3.4b&c) was maximum in media with BA (3mg/l) and IAA
(0.5mg/l) i.e. 95.82±0.35 (Table: 4.3.4). Media with BA (3mg/l) and IAA (1 mg/l) was
optimum for in vitro shoot multiplication (Fig: 4.3.4e) with 84.4±0.35 percentage
(Table: 4.3.4). This medium was also found optimum for highest number of shoots
(15.3±0.23). Maximum number of roots (11.4±0.32) was found in media containing Kn
(3mg/l) and NAA (1 mg/l) (Table: 4.3.4). Media with Kn and NAA also effective for
shoot initiation and multiplication. Addition of Ads had not given better response. 90%
of plants survived on multiplication media resuming normal growth. Plantlets with well
developed shoot and roots (Fig: 4.3.4d) were then transferred to pots (Fig: 4.3.4f) and
grown in green house for one month to acclimatize the plants. After one month the
acclimatized plants were transferred to field and were established showing 90% of
survival rate (Fig: 4.3.4g).
Table 4.3.4: Effect of different growth regulators on in vitro shoot initiation and
shoot multiplication of Kaempferia rotunda on MS medium.
Sl
no
MS medium +
growth regulator
(mg/L)
% of shoot
initiation
(Mean ± SE)
% of shoot
multiplication
(Mean ± SE)
No of shoots/
explants
(Mean ± SE)
No of roots/
explants
(Mean±SE)
1 BA(1) 53.6±0.45 15.6±0.5 6.3±0.2 5.2±0.22
2 BA(1)IAA(0.5) 70.78±0.37 16.5±0.4 6.8±0.2 7.6±0.27
3 BA(2)IAA(0.5) 61.53±0.46 30.6±0.16 8.74±0.24 7.9±0.25
4 BA(3) 76.13±0.52 73.22±0.47 10.11±0.42 6.6±0.32
5 BA(3)IAA(0.5) 95.82±0.35 77.0±0.36 10.5±0.52 8.8±0.52
6 BA(3)IAA(1) 86.91±0.66 84.4±0.35 15.3±0.23 10.5±0.26
7 Kn(3)NAA(0.5) 71.87±0.57 35.2±0.38 8.8±0.35 7.7±0.28
8 Kn(3)NAA(1) 74.78±0.65 47.0±0.43 7.9±0.45 11.4±0.32
9 BA(3)Kn(3)NAA
(1) 63.84±0.72 49.6±0.52
10.7±0.25 10.5±0.5
10 BA(3)Kn(3)IAA
(1) 64.97±0.66 56.2±0.54
10.2±0.32 9.66±0.6
11 BA(3)IAA(1)Ads
(50) 74.55±0.95 51.4±0.72
9.1±0.21 5.74±0.43
12 BA(3)IAA(1)Ads
(100) 73.84±0.42 45.2±0.66
12.7±0.23 9.55±0.32
Page 68
119
Table-4.3.5: Optimum requirement of growth regulators in MS media for shoot
multiplication in Alpinia and Kaempferia species.
Species Name Growth regulators
mg/L
Maximum number of shoots
per explants
(Mean ± SE)
A.galanga BA(3)+Kn(3)+NAA(1) 12.4±0.50
A.malaccensis BA(3)+Kn(3)+NAA(1) 9±0.31
K.galanga BA(1)+IAA(0.5) 12.38±0.52
K.rotunda BA(3)+IAA(1) 15.3±0.23
4.3.2. Assessment of genetic stability of regenerants
In the present study RAPD and ISSR analysis were used for evaluation of genetic
stability of in vitro grown plantlets of target species of Alpinia and two Kaempferia
analysed up to 3 years of culture at yearly interval.
4.3.2.1. Alpinia galanga
In Alpinia galanga, a total of 65 micropropagated plantlets (Fig: 4.3.5A)were analyzed
over a period of 3 years at 12 months intervals taking a minimum of 20 plants randomly
at each time. From total 15 ISSR primers, 10 primers produced 60 scorable bands
ranging from 300-1950 with an average of 6 bands per primer (Table: 4.3.6A). Total
number of 3900 bands [(number of plantlets analyzed) x (number of bands with all
primers)] were generated by the ISSR analysis and all were monomorphic in nature.
The number of bands varies from 4-8; highest i.e. 8 in primer (GA)9T ranging from
(300-1950 bp) and (GAC)5 ranging from (400-1550 bp) and lowest 4 in (GTG)5 (450-
1200 bp) and (GGA)4 (400-1050bp). ISSR analysis revealed that there was no
polymorphism among the tissue cultured plants (Fig: 4.3.5B). 9 selected RAPD primers
produced 44 scorable bands, ranging from 300 bp to 1800 bp in size (Table: 4.3.6B).
The number of bands for each primer varied from 1 to 9, with an average of 4.8 bands
per primer. Total number of 2860 bands [(number of plantlets analyzed) x (number of
bands with all primers)] produced by the RAPD techniques were shown monomorphic
patterns among all 65 plantlets analyzed. Number of monomorphic bands was highest
i.e. 8 in case of primer N16 (ranging from 400-1200 bp) and lowest i.e. 1 in case of
primer D20 (450 bp). There was no polymorphism among micropropagated plants in
this RAPD analysis (Fig. 4.3.5C).
Page 69
120
Fig. 4.3.5: Micropropagated plantlets of Alpinia galanga(A) ISSR banding
pattern with primer T(GA)9 (B) RAPD banding pattern with primer
D20 (C) (M:Marker, C:Control, Lane 1-23:micropropagated plants)
Page 70
121
4.3.2.2. Alpinia malaccensis
In Alpinia malaccensis, out of 15 ISSR primers 10 primers gave a total of 58 bands (ranging
from 200-2000 bp) which are all monomorphic in nature. Number of bands varied from 3-
10 bands with an average of.5.8 bands per primer. All the bands were monomorphic
showing no polymorphism (Fig: 4.3.6B) among 70 micropropagated plants (Fig: 4.3.6A)
analyzed up to 3 years of culture taken at yearly interval. Overall 4060 bands [(number of
plantlets analyzed) x (number of bands with all primers)] were produced by the ISSR
primers. Highest number of bands i.e. 10 in primer (GACA)4 (ranging from 400-1800 bp)
and lowest number of bands i.e. 3 in primers (AGG)6 (350-850 bp) and (GTG)5 (450-1200
bp) were amplified by ISSR analysis (Table: 4.3.7A). Out of 15 RAPD primers 9 selected
primers gave a total of 43 bands ranging from 300-2250 bp. Number of bands in all primers
varied from 1-9 with an average of 4.7 bands per primer. All the bands were monomorphic
showing no polymorphism among 70 plants analyzed (Fig: 4.3.6C). Number of
monomorphic band was highest i.e. 9 in primer N16 (ranging from 900-2250 bp) and lowest
i.e. 1 in primer A18 (1050 bp). Overall 3010 bands [(number of plantlets analyzed) x
(number of bands with all primers)] were produced by the RAPD analysis (Table: 4.3.7B).
Table 4.3.6 (A): ISSR banding pattern of micropropagated and field-grown
mother plants of Alpinia galanga
Primer Sequence Total no of
loci
Range of
amplicons [bp]
(CAA)5 CAACAACAACAACAA 7 350-1100
(GGA)4 GGAGGAGGAGGA 4 400-1050
(GA)9T GAGAGAGAGAGAGAGAGAT 8 300-1950
(GTGC)4 GTGCGTGCGTGCGTGC 6 350-875
(GTG)5 GTGGTGGTGGTGGTG 4 450-1200
(GAC)5 GACGACGACGACGAC 8 400-1550
(AGG)6 AGGAGGAGGAGGAGGAGG 5 350-950
(GACA)4 GACAGACAGACAGACA 7 400-1800
T(GA)9 TGAGAGAGAGAGAGAGAGA 6 450-1100
ISSR 15 TATATATATATATATAG 5 350-1050
Total 60
Page 71
122
Table 4.3.6 (B): RAPD banding pattern of micropropagated and field-grown
mother plants of Alpinia galanga
Table-4.3.7 (A): ISSR banding pattern of micropropagated and field-grown
mother plants of Alpinia malaccensis.
Table-4.3.7(B): RAPD banding pattern of micropropagated and field-grown
mother plants of Alpinia malaccensis.
Primer Sequence Total no of loci Range of amplicons
[bp]
A10 GTGATCGCAG 5 600-1100
A11 CAATCGCCGT 7 300-1250
A18 AGGTGACCGT 3 350-1050
D8 GTGTGCCCCA 4 450-1600
A20 GTTGCGATCC 6 550-1500
D18 GAGAGCCAAC 6 400-1800
D20 ACCCGGTCAC 1 450
N6 GAGACGCACA 3 500-1050
N16 AAGCGACCTG 8 400-1200
Total 44
Primer Sequence Total bands Range of
amplicons [bp]
(CAA)5 CAACAACAACAACAA 7 350-1100
(GGA)4 GGAGGAGGAGGA 4 300-2050
(GA)9T GAGAGAGAGAGAGAGAGAT 5 600-1200
(GTGC)4 GTGCGTGCGTGCGTGC 5 325-975
(GTG)5 GTGGTGGTGGTGGTG 3 450-1200
(GAC)5 GACGACGACGACGAC 9 450-1400
(AGG)6 AGGAGGAGGAGGAGGAGG 3 350-850
(GACA)4 GACAGACAGACAGACA 10 400-1800
T(GA)9 TGAGAGAGAGAGAGAGAGA 6 400-1350
ISSR 15 TATATATATATATATAG 6 300-1000
Total 58
Primer Sequence Total no of loci Range of amplicons
[bp]
A10 GTGATCGCAG 8 500-1400
A11 CAATCGCCGT 6 300-1975
A18 AGGTGACCGT 1 1050
D8 GTGTGCCCCA 4 450-1600
A20 GTTGCGATCC 6 550-1375
D18 GAGAGCCAAC 5 900-2050
D20 ACCCGGTCAC 2 800-1200
N6 GAGACGCACA 2 900-1000
N16 AAGCGACCTG 9 900-2250
Total 43
Page 72
123
Fig. 4.3.6 Micropropagated plantlets of Alpinia malaccensis (A), ISSR banding
pattern with primer (GA)9T (B), RAPD banding pattern with primer
D20 (C) (M:Marker, C:Control, Lane 1-23:micropropagated plants).
Page 73
124
4.3.2.3. Kaempferia galanga
In Kaempferia galanga, in order to verify the genetic stability, total number of 68
micropropagated plantlets (Fig: 4.3.7A) were analyzed taking at least 20 plants at a
time. Both ISSR and RAPD analysis was carried out up to 3years with 12 months
interval. ISSR analysis generated 61 scorable bands by 9 primers ranging from 4-10
numbers of bands. Average bands per primer was 6.7, highest 10 in primer (GACA)4
(ranging from 400-1800 bp) and lowest 3 in primer T(GA)9 (ranging from 350-1000
bp) (Table: 4.3.8A). Overall, 4148 bands [(number of plantlets analyzed) x (number of
bands with all primers)] were produced by ISSR primers and all were monomorphic in
nature (Fig: 4.3.7B). In case of RAPD analysis, 9 out of 15 primers were amplified with
total 47 bands (Table: 4.3.8B). All generated bands i.e. 3196 [(number of plantlets
analyzed) x (number of bands with all primers)] were found monomorphic (Fig:
4.3.7C). The number of bands for each primer varies form 1-9, highest number of band
9 found in primers A11 (ranging from 300-1970 bp) and N16 (ranging from 600-2100
bp) and lowest as 1 in primer A18 (950 bp) (Table: 4.3.8B).
Table 4.3.8 (A): ISSR banding pattern of micropropagated and field-grown
mother plants of K.galanga
Primer Sequence Total bands Range of
amplicons [bp]
(CAA)5 CAACAACAACAACAA 6 350-1300
(GGA)4 GGAGGAGGAGGA 7 300-1900
(GA)9T GAGAGAGAGAGAGAGAGAT 7 400-1600
(GTGC)4 GTGCGTGCGTGCGTGC 5 450-1150
(GTG)5 GTGGTGGTGGTGGTG 4 350-950
(GAC)5 GACGACGACGACGAC 9 450-1400
(AGG)6 AGGAGGAGGAGGAGGAGG 5 450-1200
(GACA)4 GACAGACAGACAGACA 10 400-1800
T(GA)9 TGAGAGAGAGAGAGAGAGA 3 350-1000
ISSR 15 TATATATATATATATAG 5 400-1050
Total 61
Page 74
125
Fig. 4.3.7 Micropropagated plantlets of Kaempferia galanga (A), ISSR banding
pattern with primer (GA) 9T (B), RAPD banding pattern with primer
D20(C) (M: Marker, C: Control, Lane 1-23: micropropagated plants)
Page 75
126
Table 4.3.8 (B): RAPD banding pattern of micropropagated and field-grown
mother plants of K.galanga
4.3.2.4. Kaempferia rotunda
In Kaempferia rotunda, ISSR and RAPD analysis were carried out to test the genetic
integrity of micropropagated plants (Fig: 4.3.8A) at yearly interval up to 3 years. 66
regenerants were analysed taking minimum 20 plants each time. Out of 15 ISSR
primers 10 were amplified and gave 62 bands ranging from 3-10 with an average of 6.2
bands per primer (Table: 4.3.9A). Total 4092 bands [(number of plantlets analyzed) x
(number of bands with all primers)], produced by the ISSR analysis, were found
monomorphic in nature among all 66 plantlets analyzed. Number of monomorphic
bands was highest i.e. 10 in case of primers (GACA)4 (ranging from 400-800 bp in
size) and lowest i.e. 3 in case of primer (GTGC)4 (ranging from 380-1250 bp in size)
and primer (AGG)6 (350-850bp). All plantlets were found to be genetically uniform
showing absence of polymorphism (Fig: 4.3.8B).From 15 RAPD primers 9 primers
gave 47 scorable bands ranging from 300-1900 bp with an average of 5.2 per primers
(Table: 4.3.9B). Overall 3102 bands [(number of plantlets analyzed) x (number of bands
with all primers)] were generated. Highest number of bands was 8 in primer A10
(ranging from 480-1400 bp) and lowest 1 in primer N6 (900 bp). No RAPD
polymorphism was detected (Fig: 4.3.8C).
Primer Sequence Total bands Range of amplicons
[bp]
A10 GTGATCGCAG 8 600-1400
A11 CAATCGCCGT 9 300-1970
A18 AGGTGACCGT 1 950
D8 GTGTGCCCCA 4 450-1500
A20 GTTGCGATCC 6 400-1300
D18 GAGAGCCAAC 5 500-1500
D20 ACCCGGTCAC 2 450-750
N6 GAGACGCACA 3 550-900
N16 AAGCGACCTG 9 600-2100
Total 47
Page 76
127
Fig. 4.3.8 Micropropagated plantlets of Kaempferia rotunda (A), ISSR banding
pattern with primer T(GA)9 (B), RAPD banding pattern with primer
D20 (C) (M:Marker, C:Control, Lane 1-23:micropropagated plants)
Page 77
128
Table 4.3.9 (A): ISSR banding pattern of micropropagated and field-grown
mother plants of K.rotunda
Table4.3.9 (B): RAPD banding pattern of micropropagated and field-grown mother
plants of K.rotunda.
Primer Sequence Total bands Range of
amplicons [bp]
(CAA)5 CAACAACAACAACAA 7 450-1300
(GGA)4 GGAGGAGGAGGA 4 300-1250
(GA)9T GAGAGAGAGAGAGAGAGAT 8 400-1450
(GTGC)4 GTGCGTGCGTGCGTGC 3 380-1250
(GTG)5 GTGGTGGTGGTGGTG 5 400-1100
(GAC)5 GACGACGACGACGAC 9 450-1400
(AGG)6 AGGAGGAGGAGGAGGAGG 3 350-850
(GACA)4 GACAGACAGACAGACA 10 400-1800
T(GA)9 TGAGAGAGAGAGAGAGAGA 6 400-1500
ISSR 15 TATATATATATATATAG 7 390-1350
Total 62
Primer Sequence Total bands Range of amplicons
[bp]
A10 GTGATCGCAG 8 480-1400
A11 CAATCGCCGT 7 300-1700
A18 AGGTGACCGT 5 1050
D8 GTGTGCCCCA 4 450-1200
A20 GTTGCGATCC 7 550-1300
D18 GAGAGCCAAC 6 400-1550
D20 ACCCGGTCAC 2 450-750
N6 GAGACGCACA 1 900
N16 AAGCGACCTG 7 500-1900
Total 47


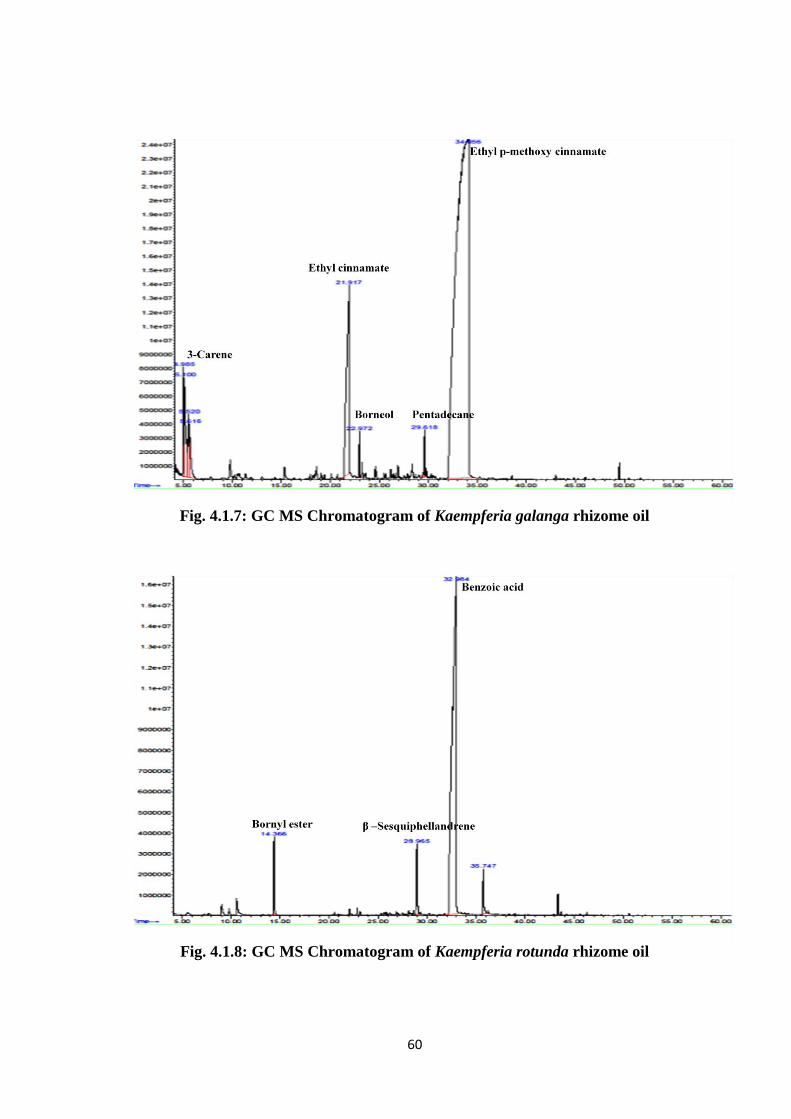


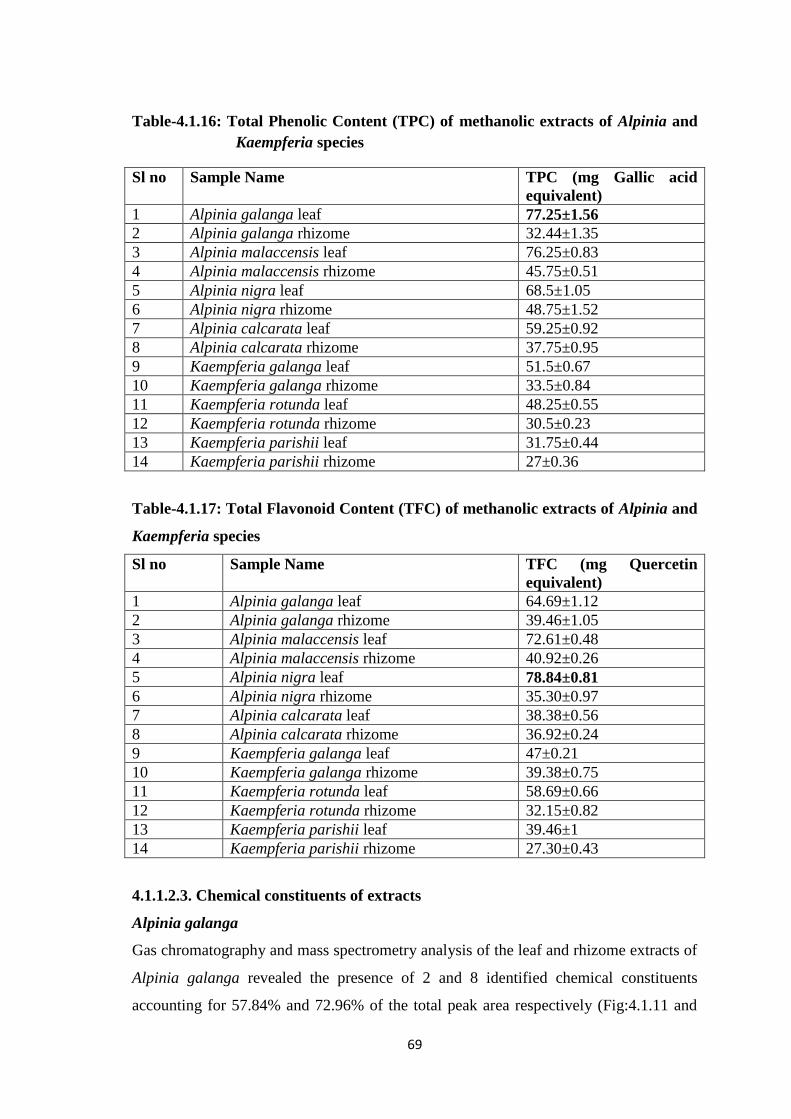
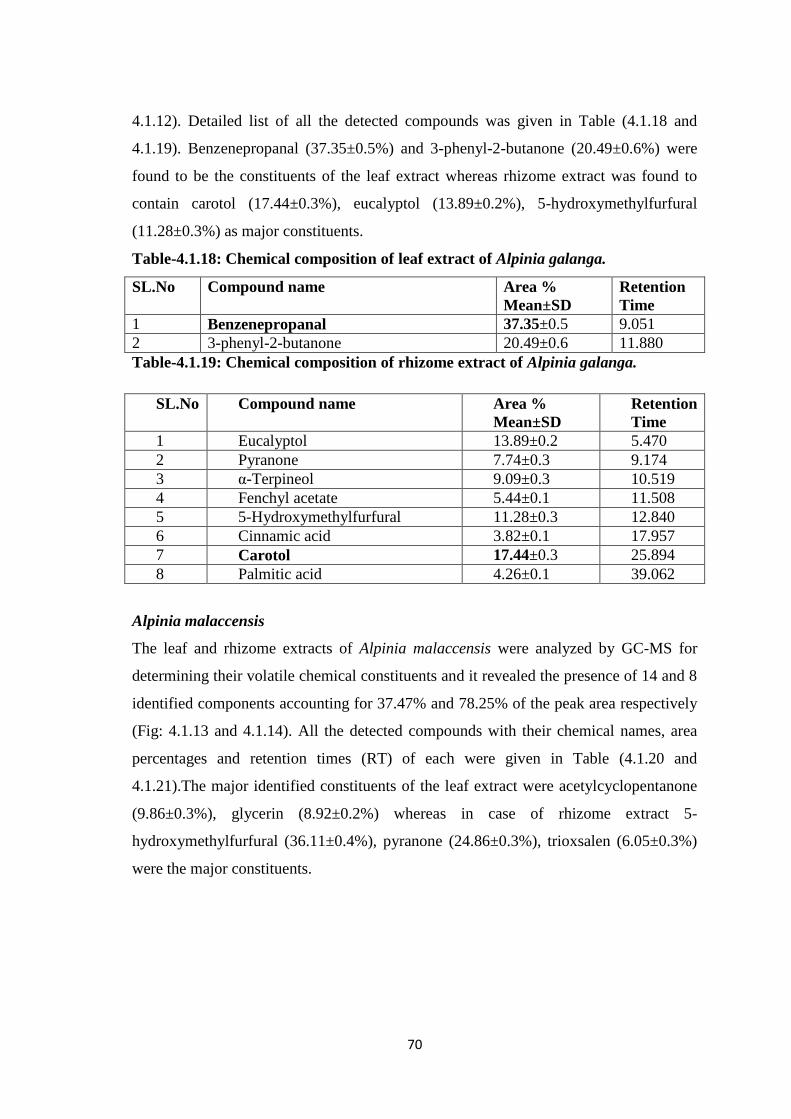


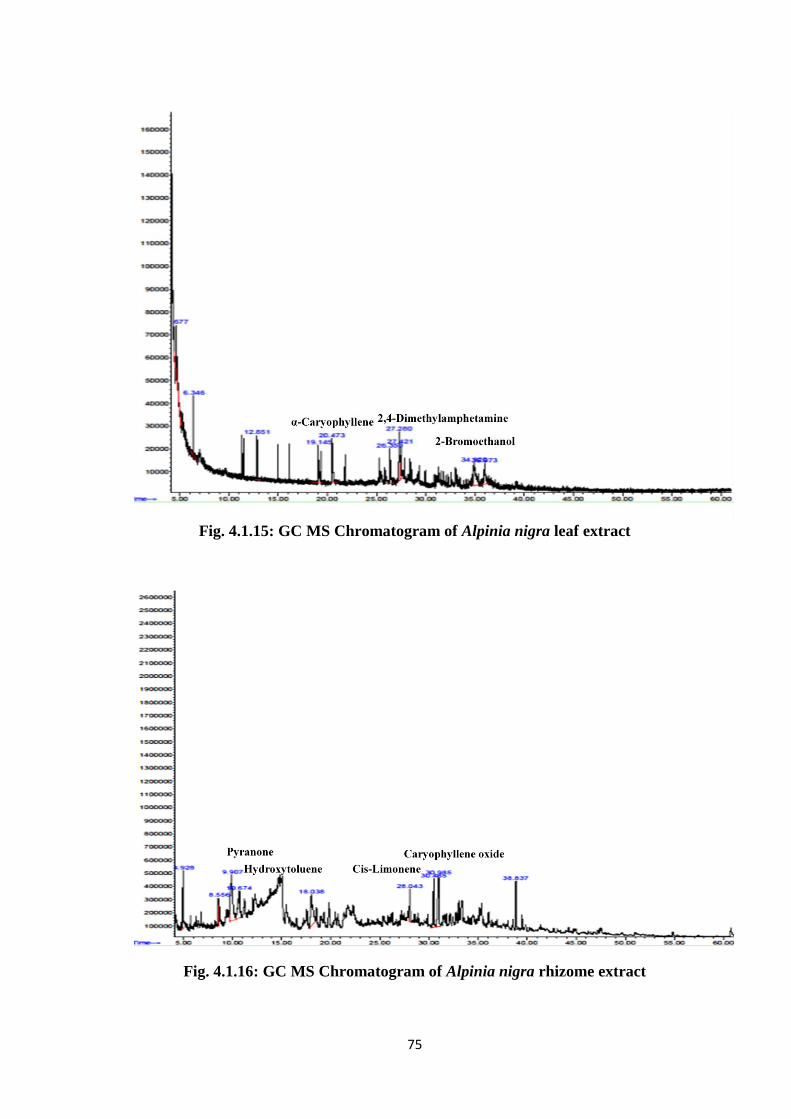


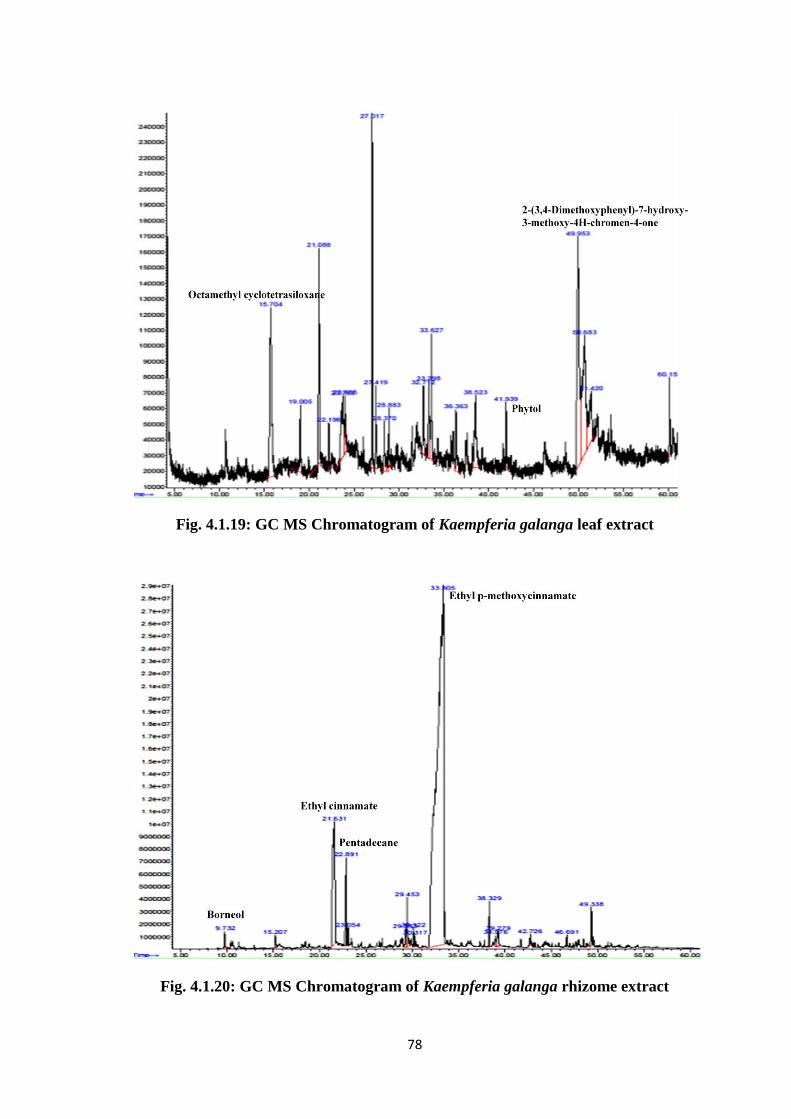
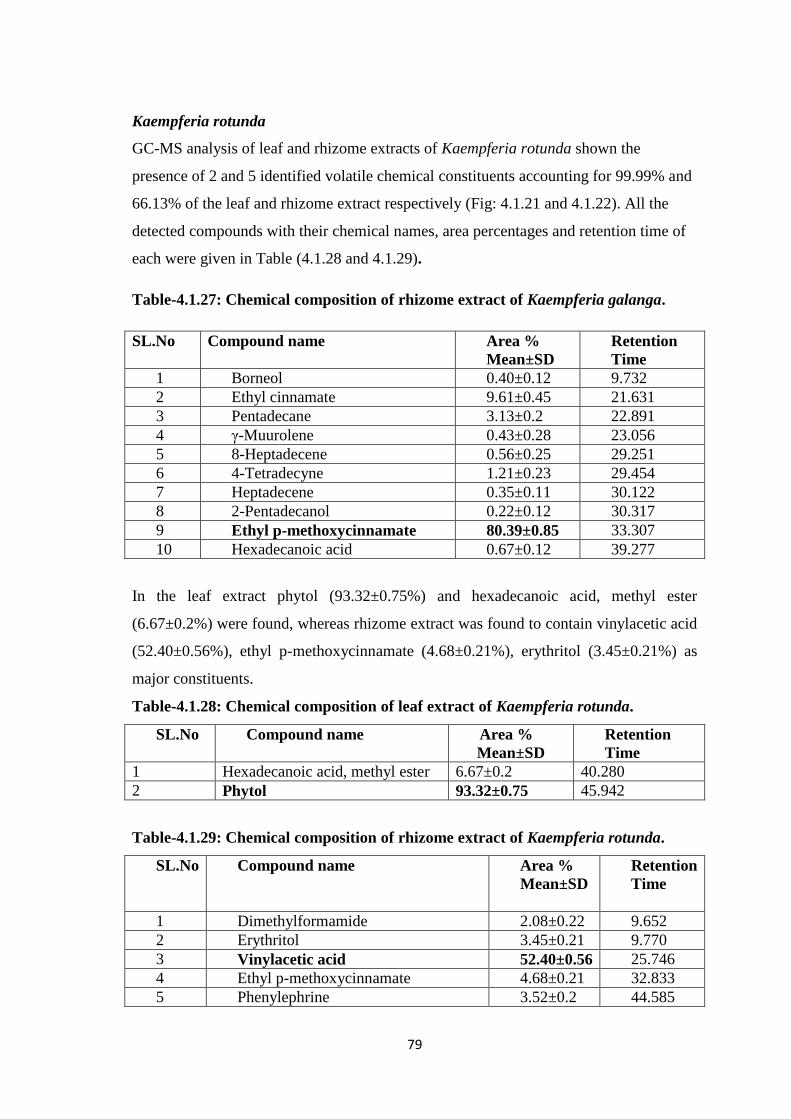
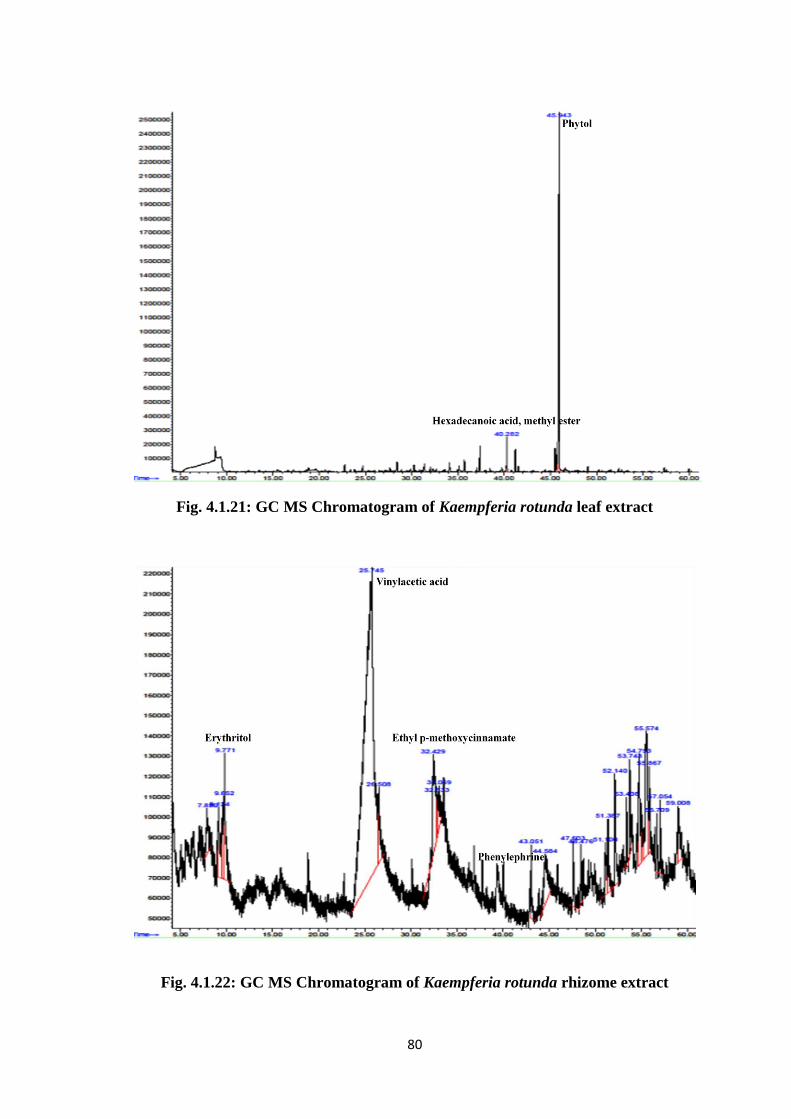

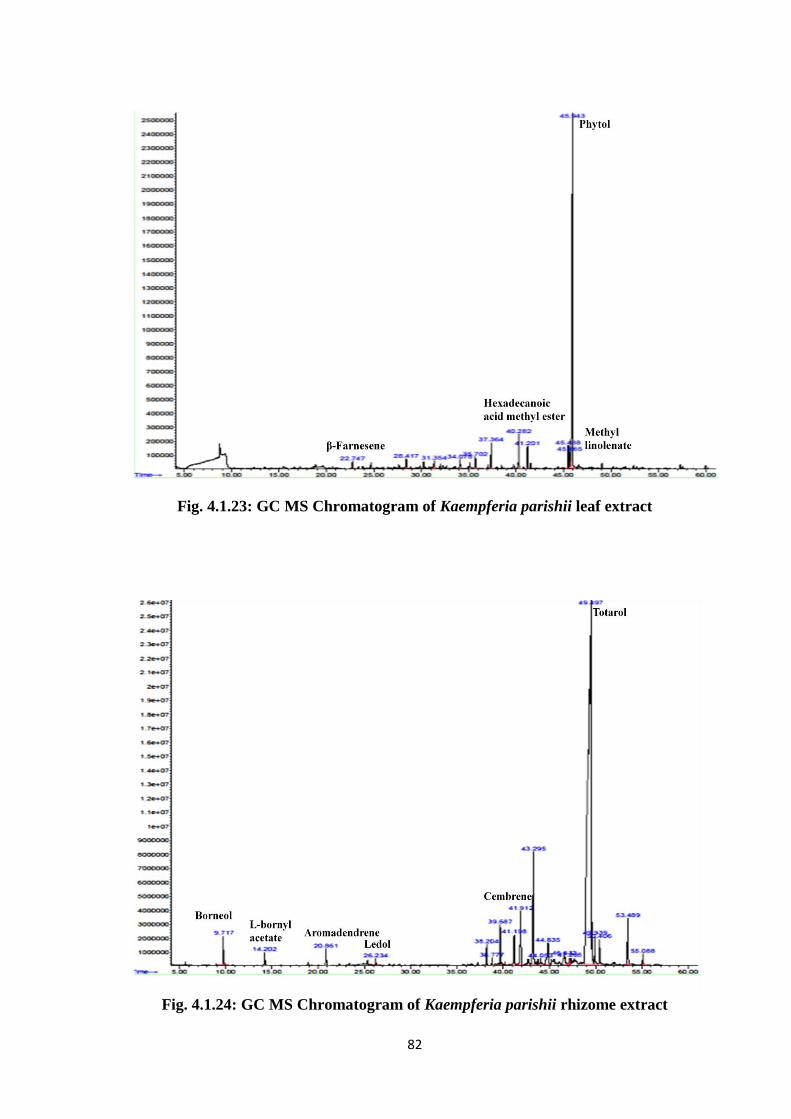
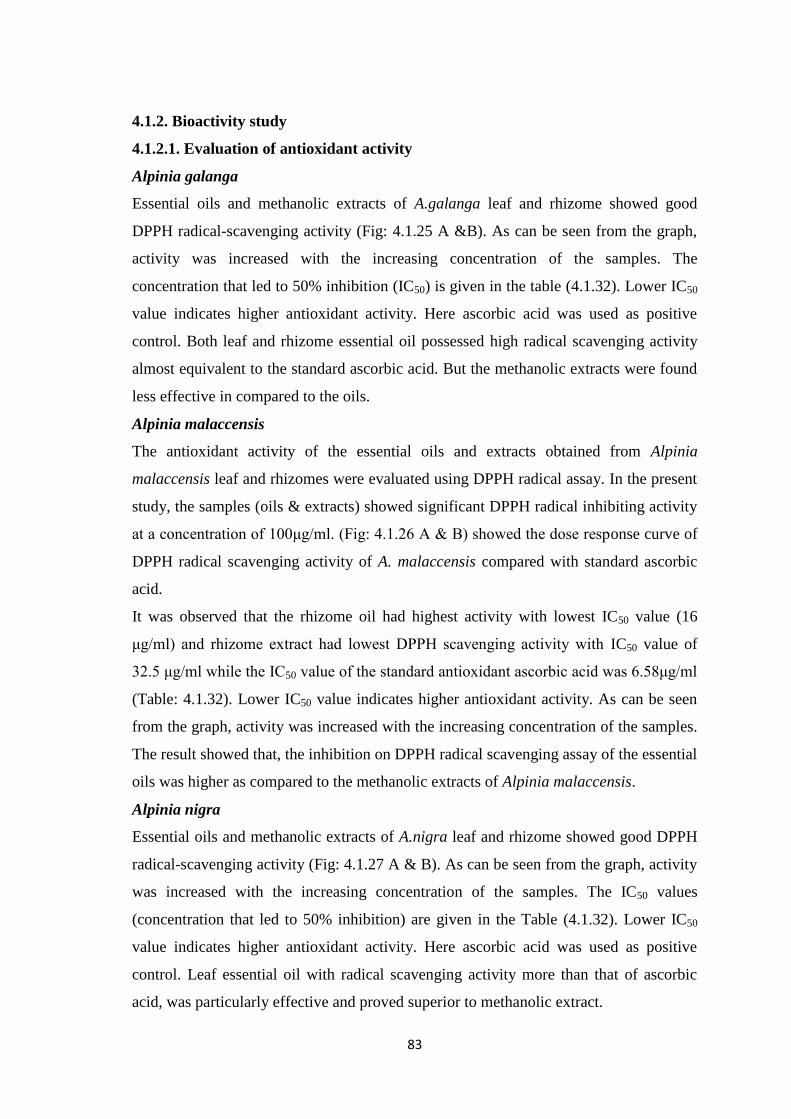

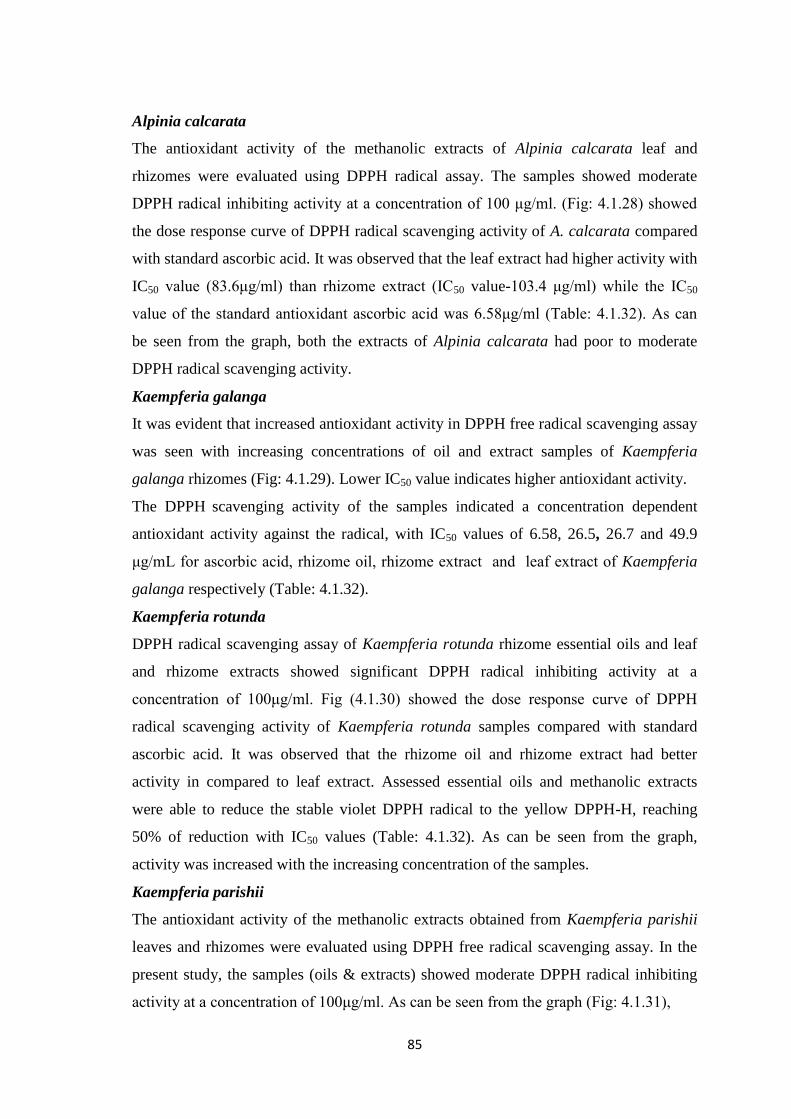


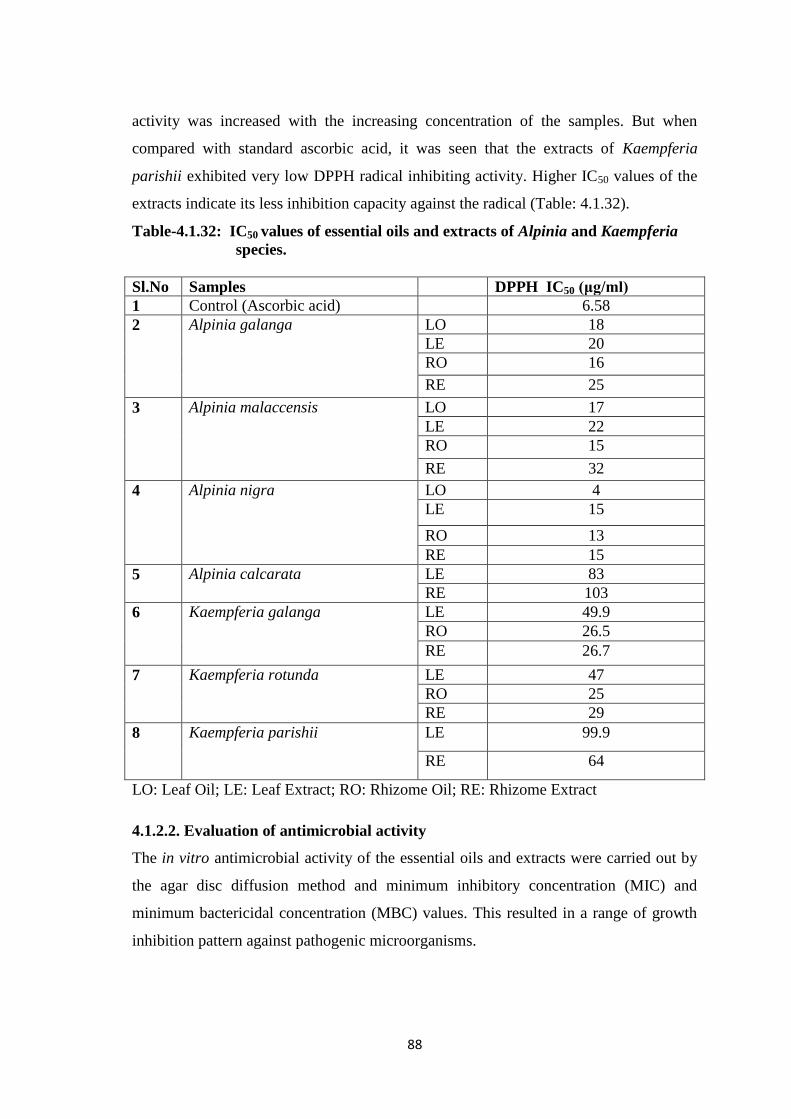


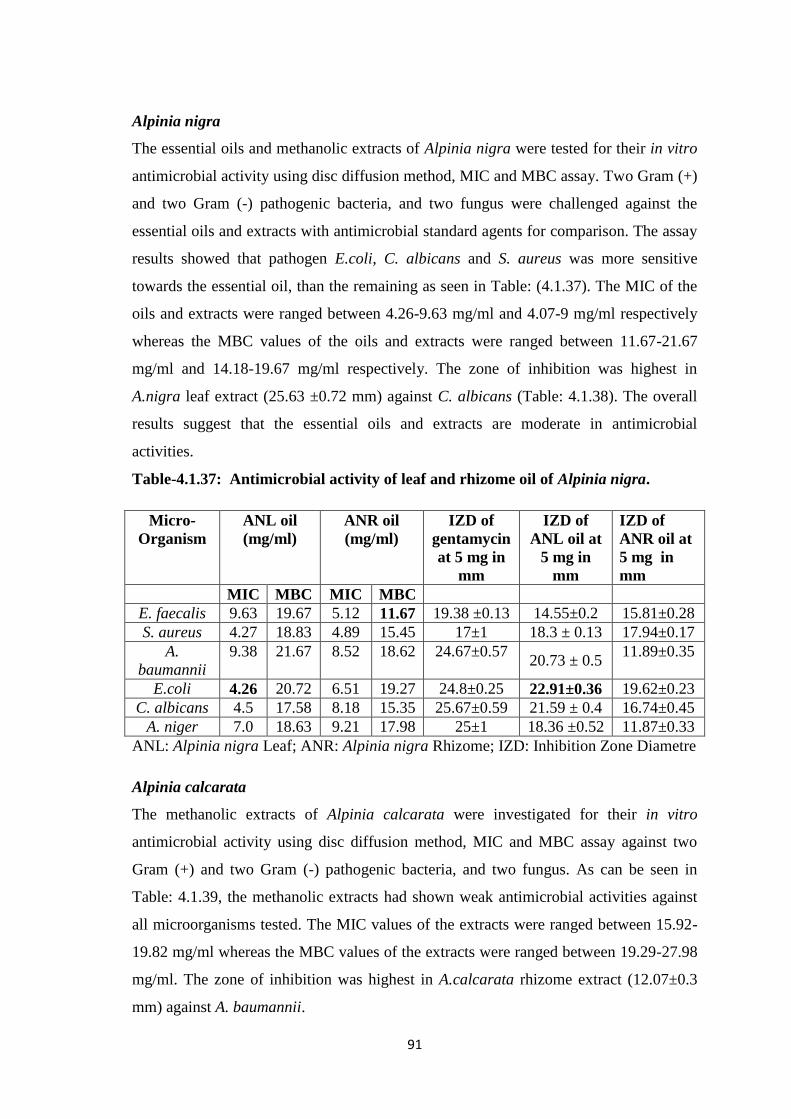
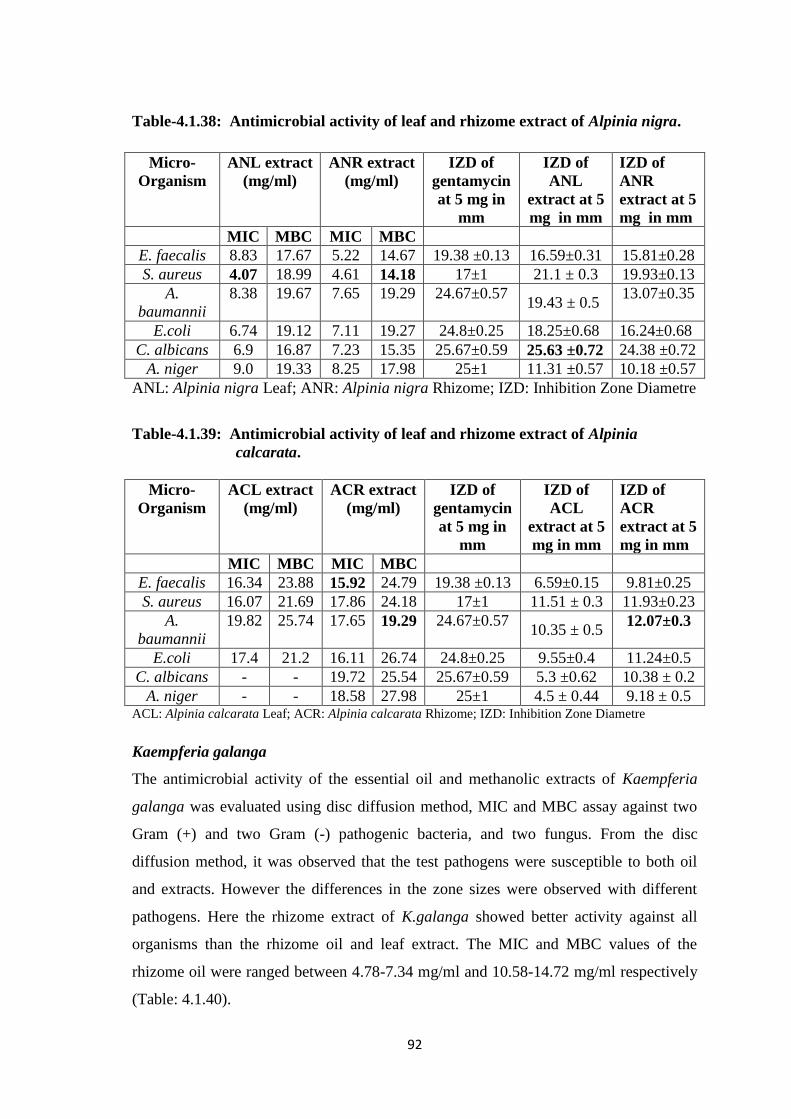


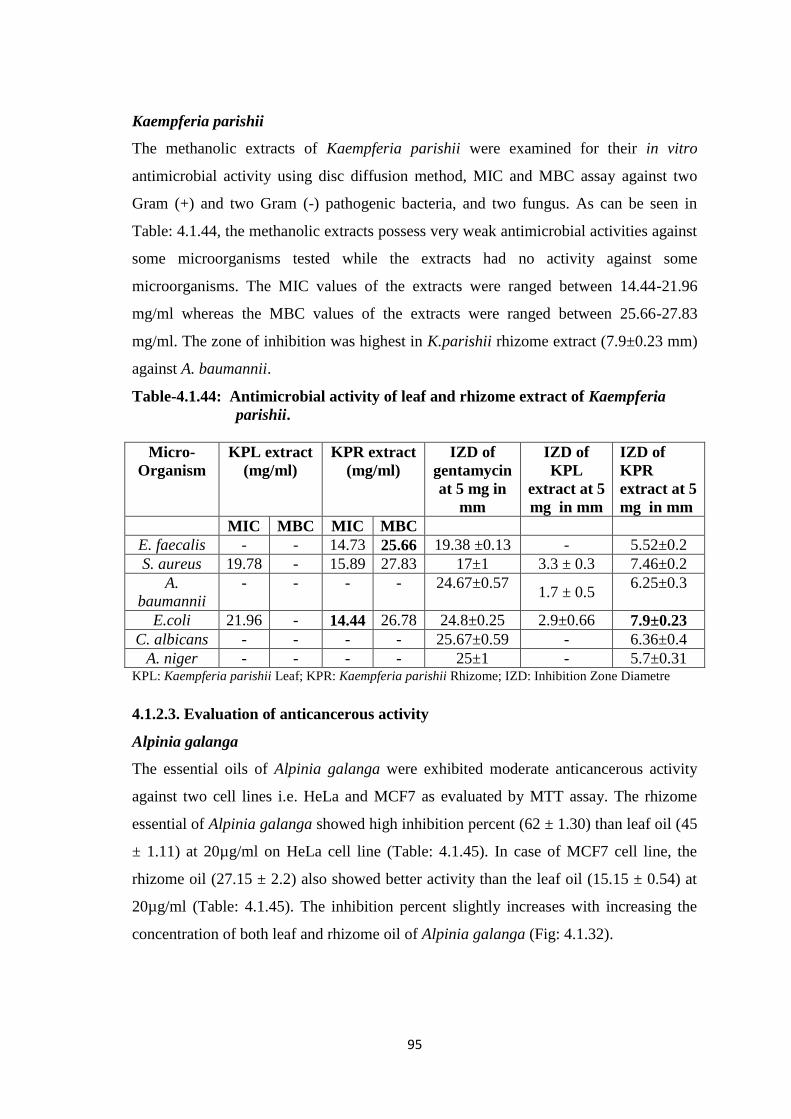
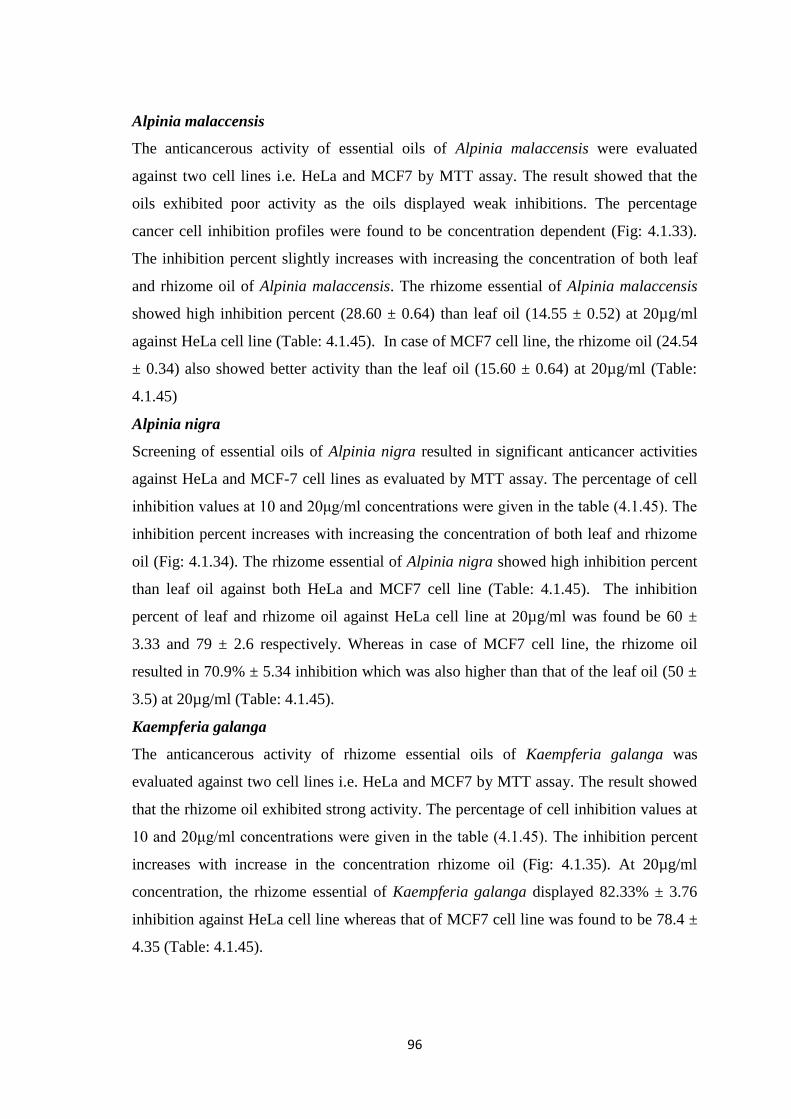

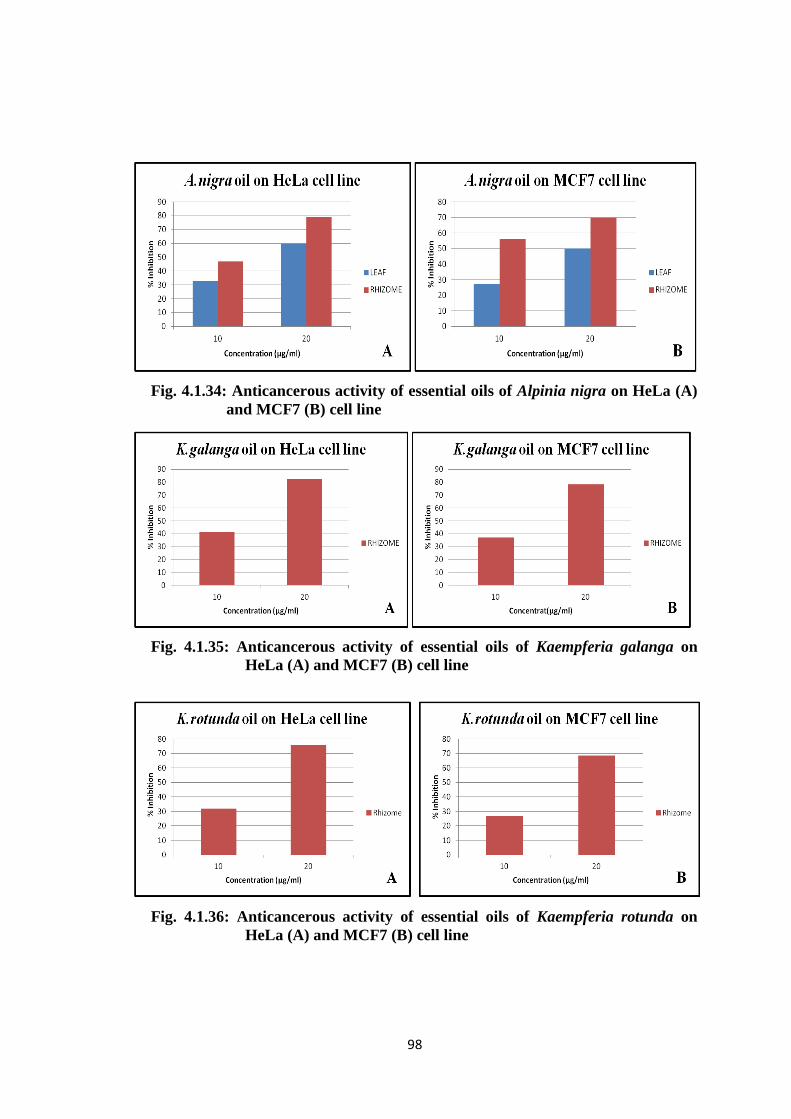
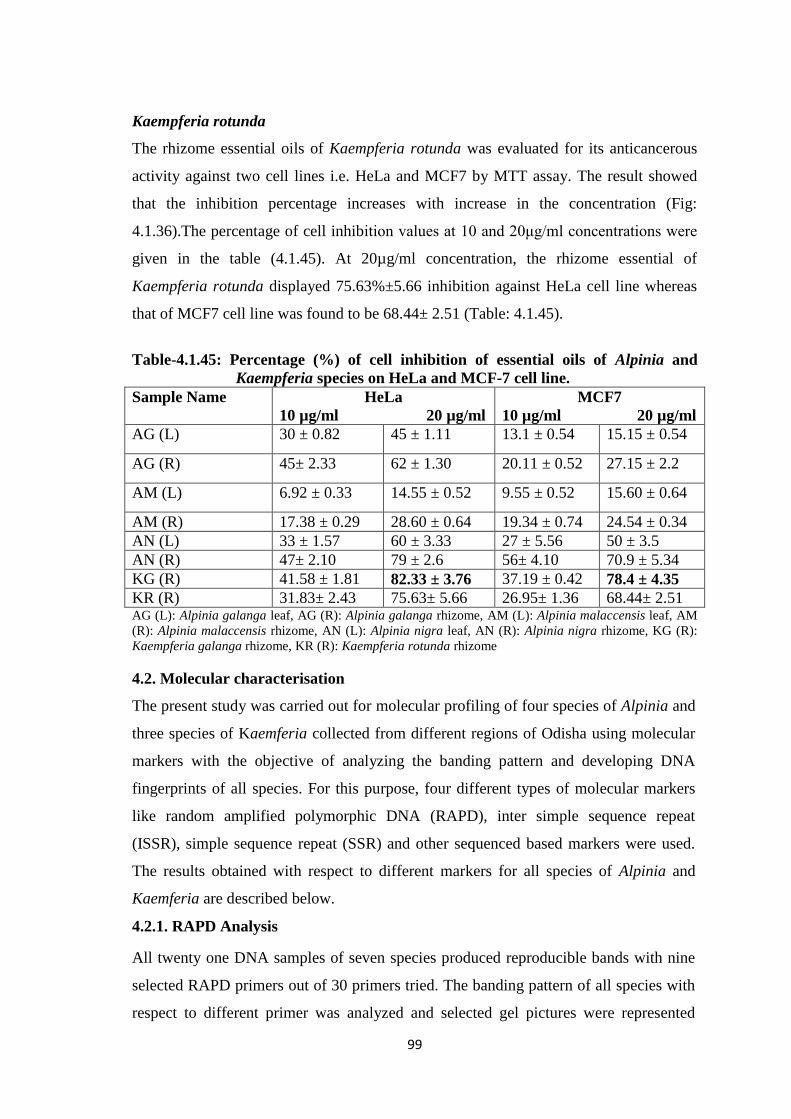

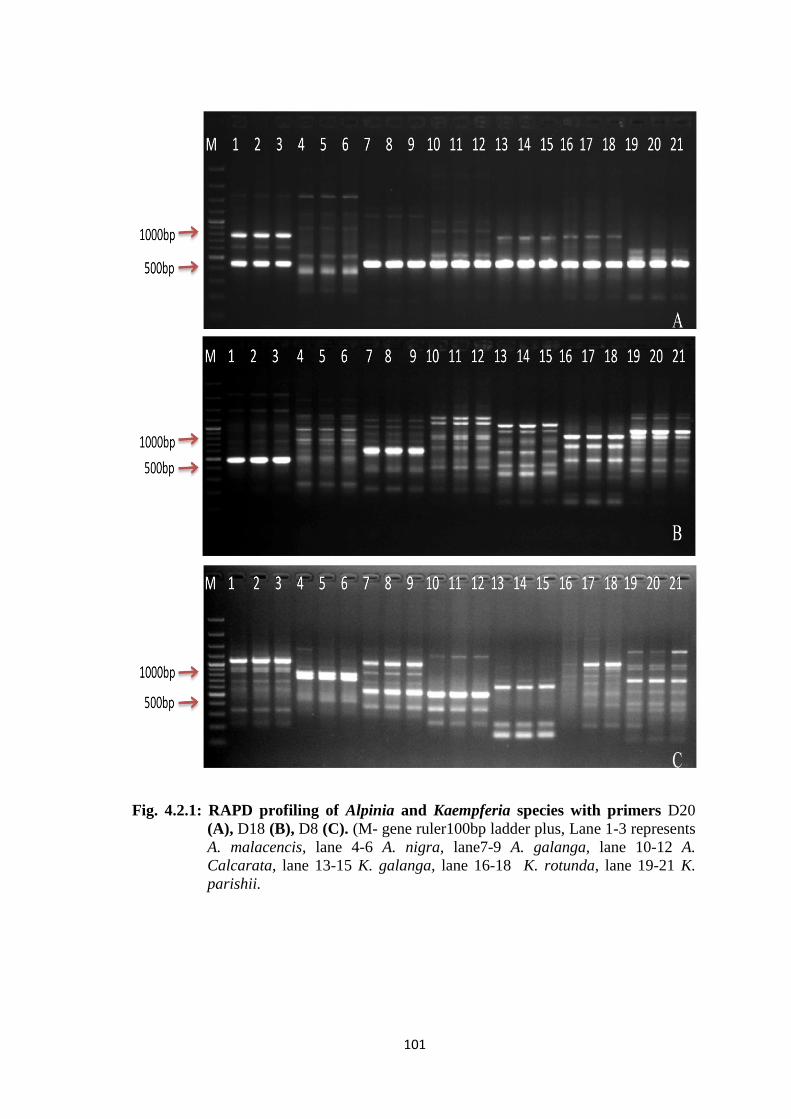
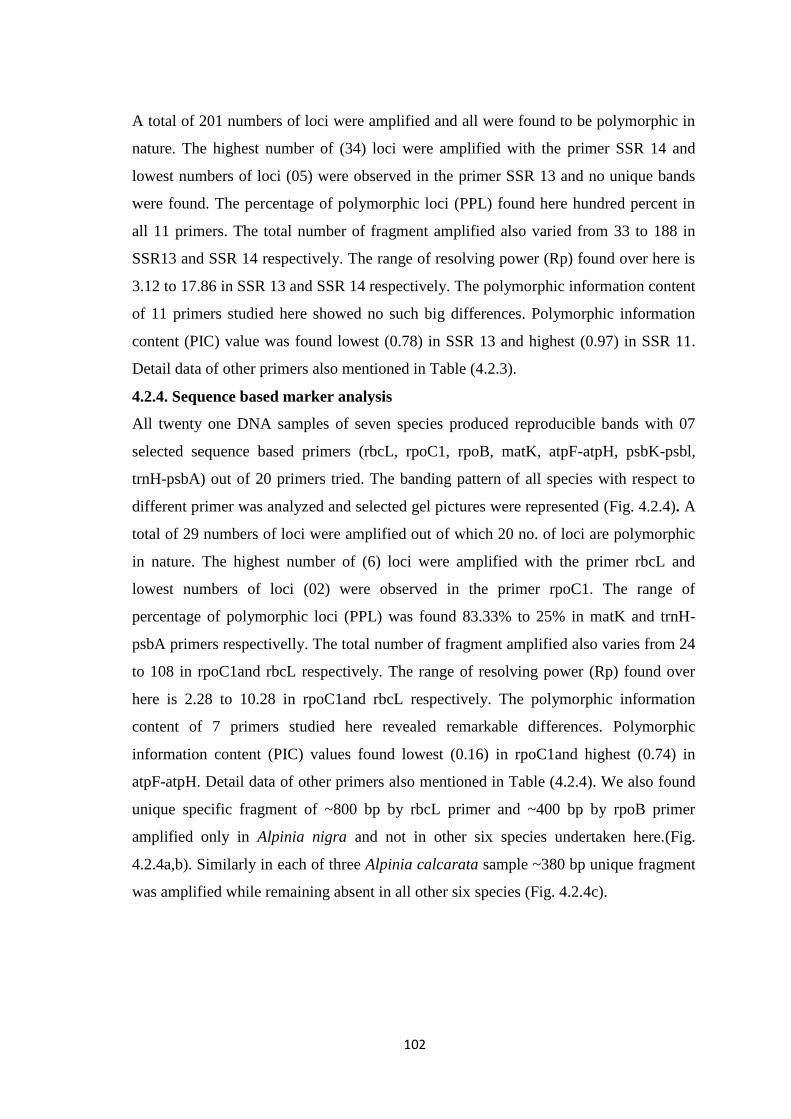
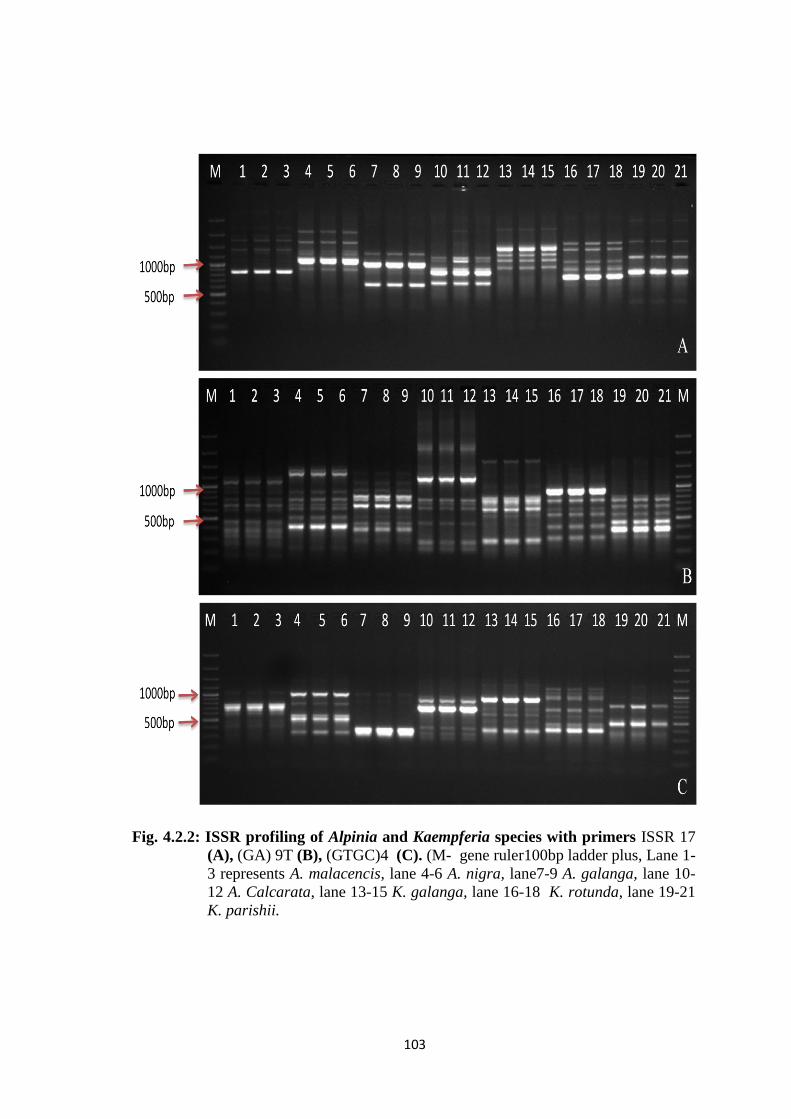


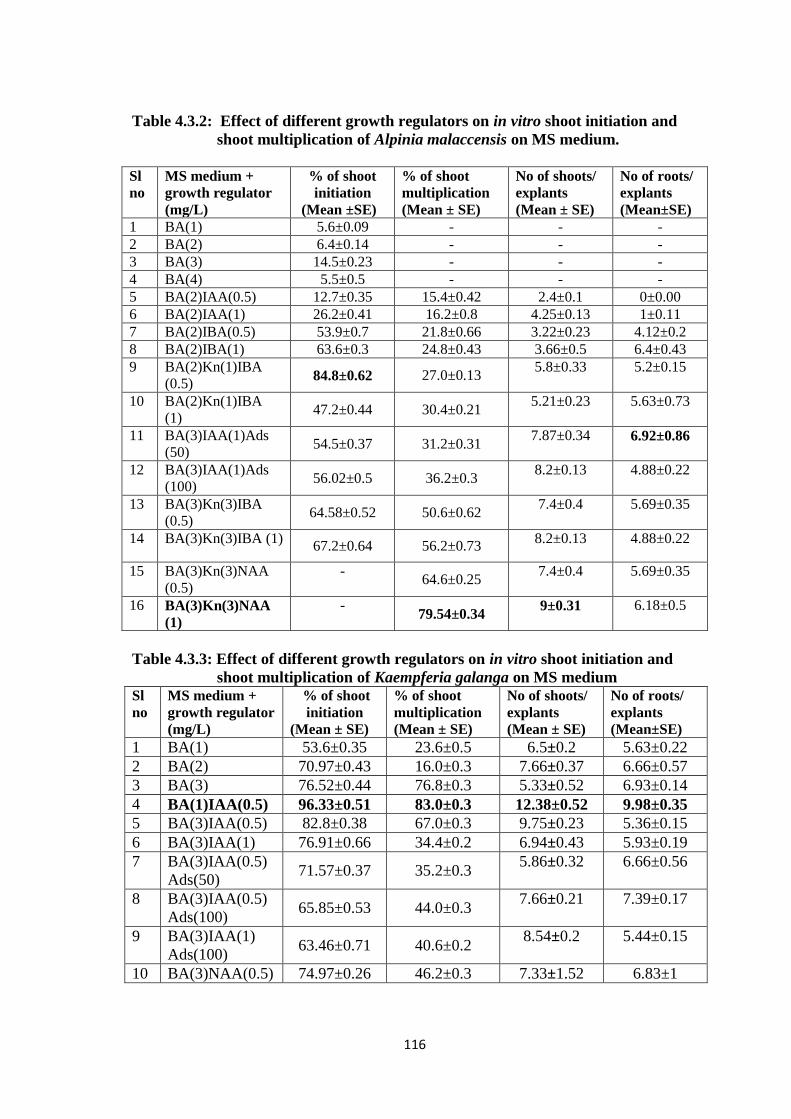

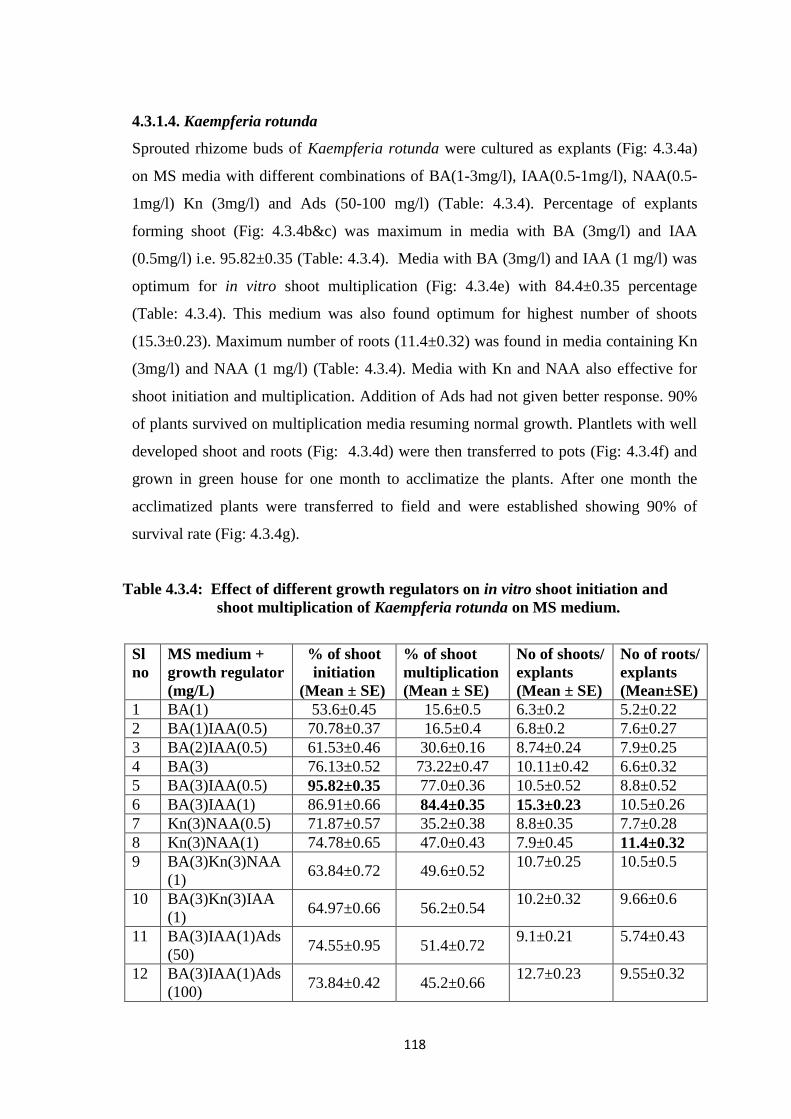


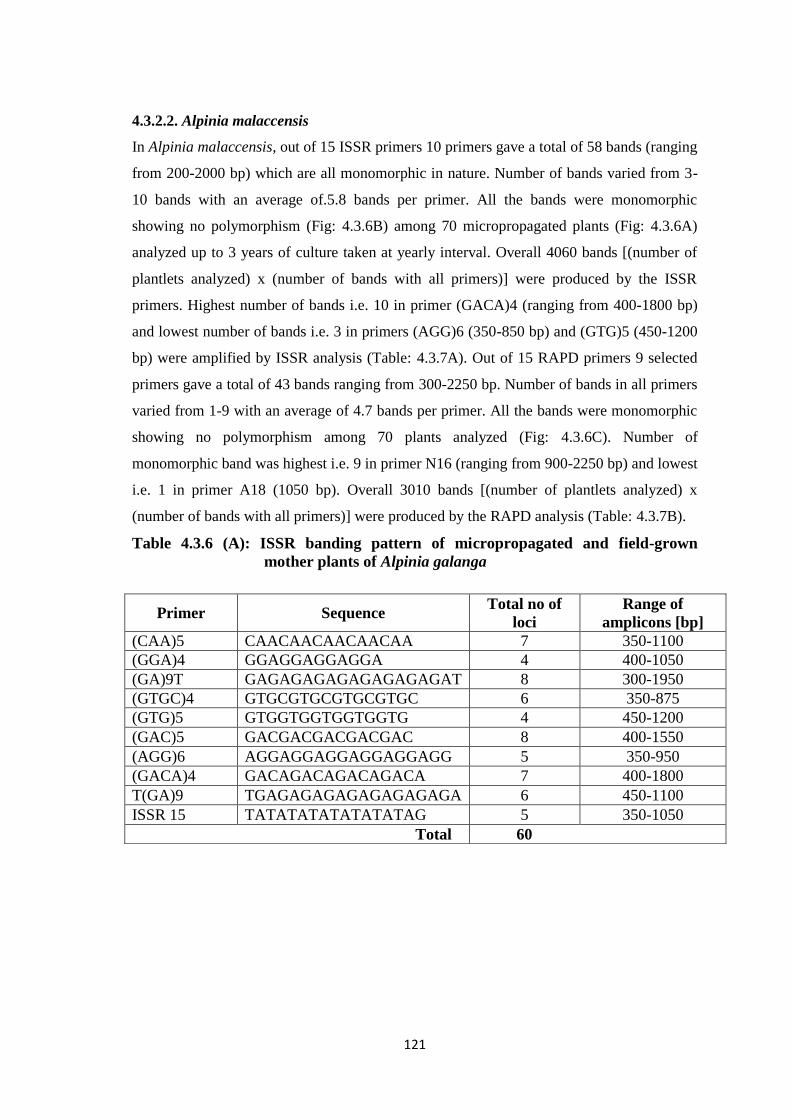
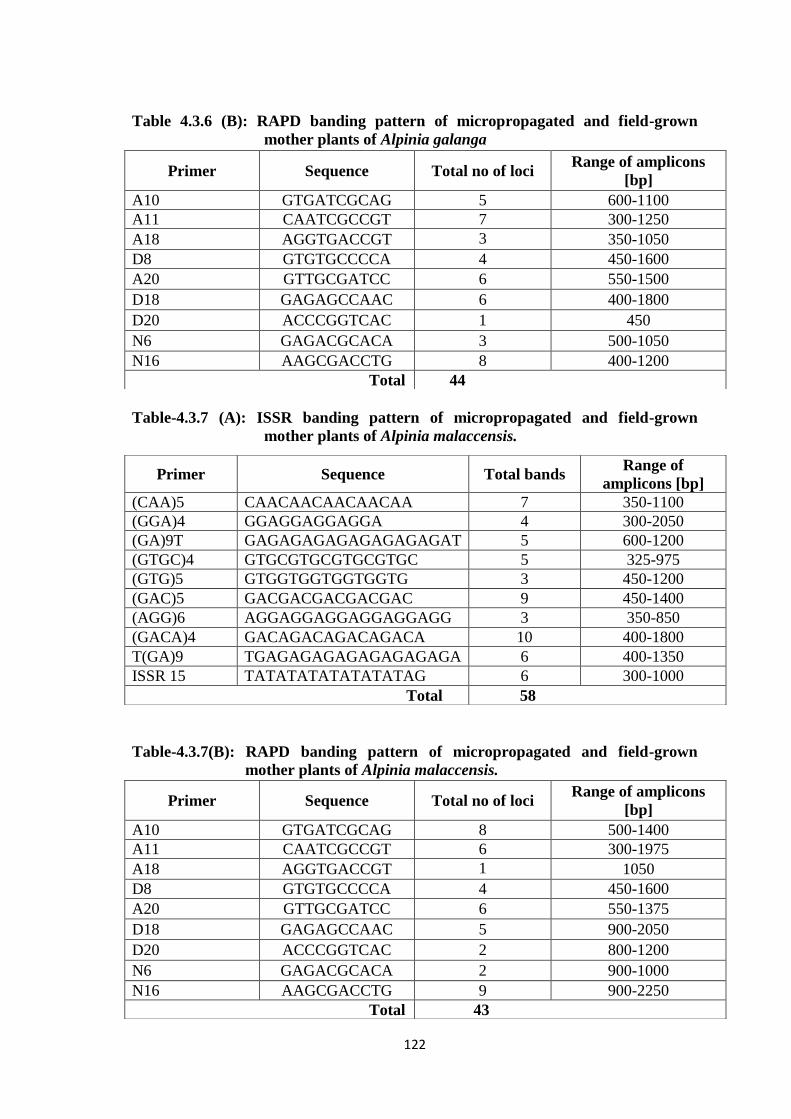


![Molecular Docking Studies of Alpinia galanga ...The chemical structures of the shortlisted ligands were either downloaded from Zinc databases[16] or drawn using embedded tools. The](https://static.documents.pub/doc/80x56/5f0522177e708231d4116efa/molecular-docking-studies-of-alpinia-galanga-the-chemical-structures-of-the.jpg)