44
CHAPTER 4
RESULTS AND DISCUSSION
4.1 Extraction yield of Alpinia scabra
Samples of A. scabra were dried in an oven as a method of preservation after
which the samples were ground to powder. The latter was carried out to allow
maximum contact of the dried sample to the extraction solvent. The solvents used in the
present study were selected based on their different polarity ranges. In term of
chemistry, polar substances would dissolve in polar solvents while non-polar substances
will dissolve in non-polar solvents (Zuo et al., 2002). Methanol, chloroform and hexane
(in order of decreasing polarity, respectively) were selected to enable the extraction and
separation of a wide range of components that are present in the samples. Application of
different extraction solvents used in this study was an attempt to produce best
separation of compounds in each extract. This was achieved by gradual isolation of
compound groups following different solvent polarities. Powdered samples were first
soaked in methanol in to extract out the polar compounds which constitutes the bulk
compounds present in the samples. Methanol is classified as high polarity solvent that
can be used to extract sugar, amino acids and glycosides from the samples (Houghton
and Raman, 1998). Usually, 80 % methanol and 70 % ethanol are most preferred
solvents for phenolic extraction from plants (Apak et al., 2007).
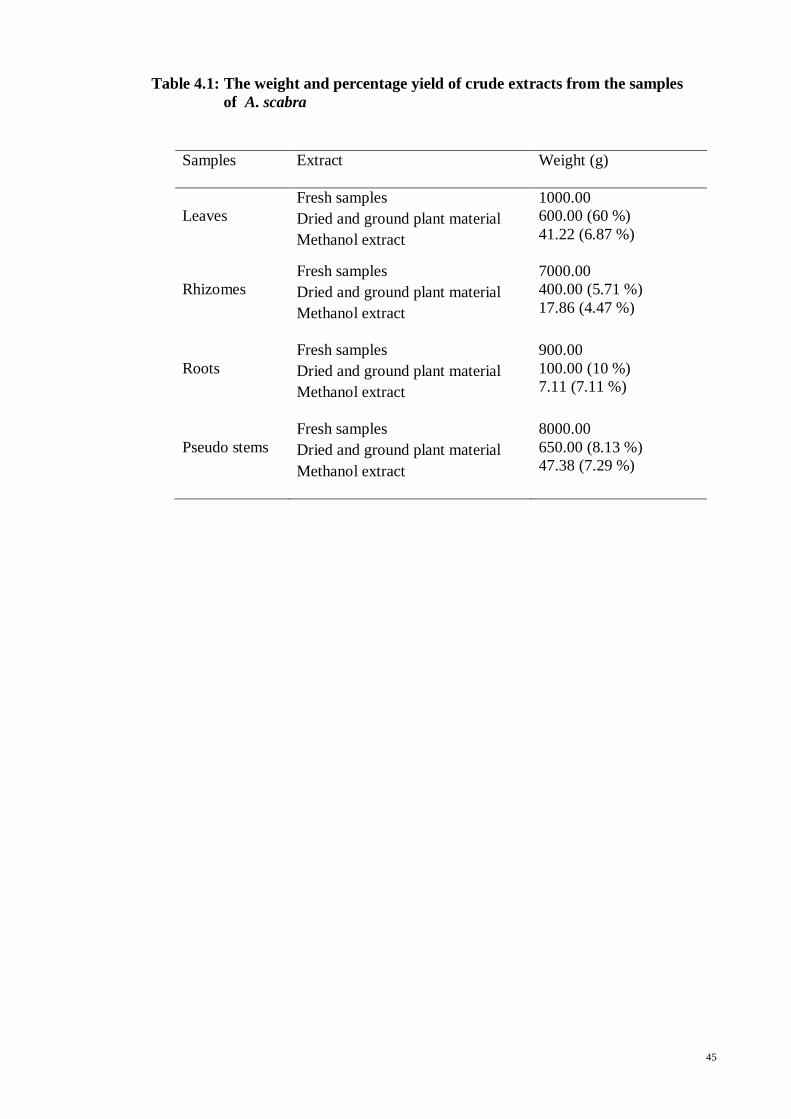
The percentage of crude methanol extract yield as shown in Table 4.1 was based
on the weight of dried and ground plant materials. The yield of crude methanol extract
of pseudo stems (7.29 %) is the highest among the four samples whereas yield of crude
methanol extract of rhizomes (4.47 %) is the lowest compared to the other samples.
45
Table 4.1: The weight and percentage yield of crude extracts from the samples
of A. scabra
Samples Extract Weight (g)
Leaves
Fresh samples
Dried and ground plant material
Methanol extract
1000.00
600.00 (60 %)
41.22 (6.87 %)
Rhizomes
Fresh samples
Dried and ground plant material
Methanol extract
7000.00
400.00 (5.71 %)
17.86 (4.47 %)
Roots
Fresh samples
Dried and ground plant material
Methanol extract
900.00
100.00 (10 %)
7.11 (7.11 %)
Pseudo stems
Fresh samples
Dried and ground plant material
Methanol extract
8000.00
650.00 (8.13 %)
47.38 (7.29 %)
46
The crude methanol extracts were further fractionated into hexane, chloroform
and water extracts. The concentrated methanol extracts were then subjected to repeated
hexane extraction to acquire a mixture of volatile oils, fats and waxes (Houghton and
Raman, 1998). The remaining hexane insoluble methanol extract was then partitioned
with chloroform and water (ratio 1:1). This crude fractionation procedure as described
by Houghton and Raman (1998) involved separation of compounds based on their
relative solubility. Alkaloids, aglycones and volatile oils will be forced into the
chloroform layer while the water layer embodies water-soluble carbohydrate polymers,
glycosides and amino acid (Oufnac et al., 2007).
The percentage yield of fractionated extracts was based on the weight of crude
methanol extract as shown in Table 4.2. For all the samples, the water extract was the
most abundant extract (52.16 % for leaves, 67.12 % for rhizomes, 72.29 % for roots and
69.76 % for pseudo stems) among the fractionated extracts in each samples while the
hexane extract gave the lowest yield which 1.21 % for leaves, 3.62 % for rhizomes, 4.36
% for roots and 1.01 % for pseudo stems.
47
Table 4.2: The weight and percentage yield of fractionated extracts from the crude
methanol extracts of A. scabra
Sample Extract Weight (g)
Leaves
(extracted from 41.22 g of
methanol extract)
Hexane
Chloroform
Water
0.50 (1.21 %)
9.64 (23.39 %)
21.50 (52.16 %)
Rhizomes
(extracted from 17.86 g of
methanol extract)
Hexane
Chloroform
Water
0.65 (3.62 %)
1.22 (6.83 %)
11.99 (67.12 %)
Roots
(extracted from 7.11 g of
methanol extract)
Hexane
Chloroform
Water
0.31 (4.36 %)
0.63 (8.86 %)
5.14 (72.29 %)
Pseudo stems
(extracted from 47.38 g of
methanol extract)
Hexane
Chloroform
Water
0.48 (1.01 %)
3.23 (6.82 %)
33.05 (69.76 %)
48
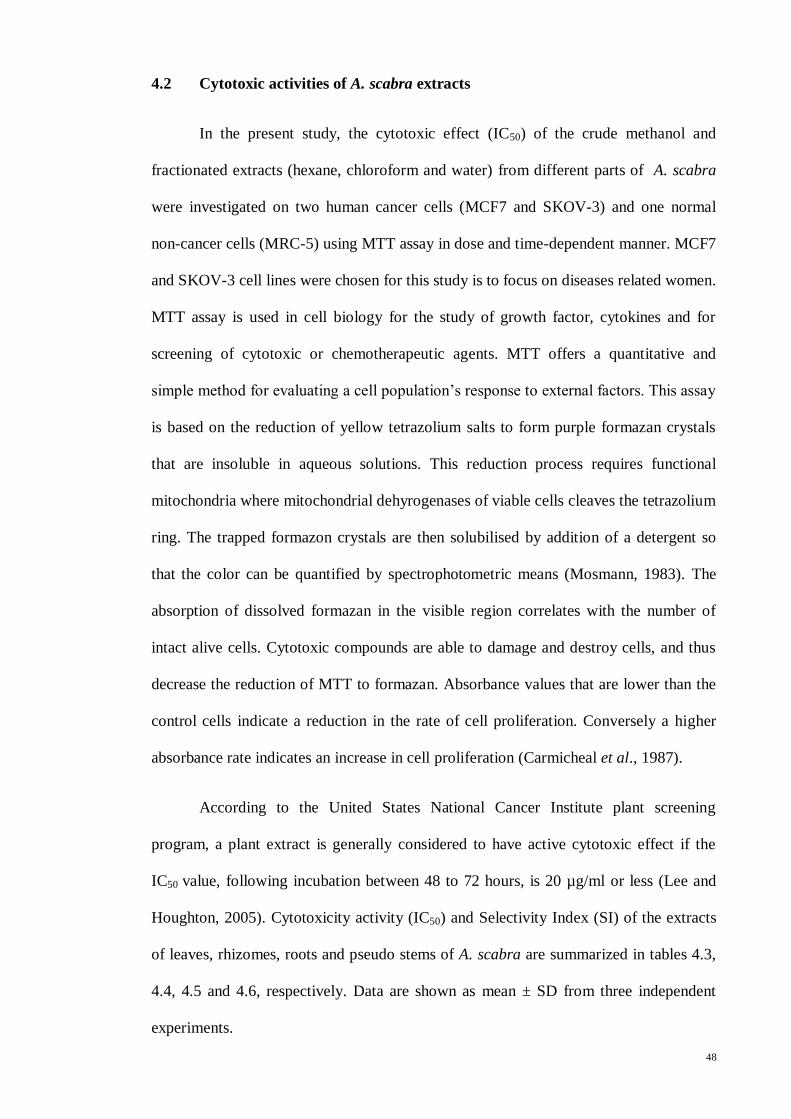
4.2 Cytotoxic activities of A. scabra extracts
In the present study, the cytotoxic effect (IC50) of the crude methanol and
fractionated extracts (hexane, chloroform and water) from different parts of A. scabra
were investigated on two human cancer cells (MCF7 and SKOV-3) and one normal
non-cancer cells (MRC-5) using MTT assay in dose and time-dependent manner. MCF7
and SKOV-3 cell lines were chosen for this study is to focus on diseases related women.
MTT assay is used in cell biology for the study of growth factor, cytokines and for
screening of cytotoxic or chemotherapeutic agents. MTT offers a quantitative and
simple method for evaluating a cell population’s response to external factors. This assay
is based on the reduction of yellow tetrazolium salts to form purple formazan crystals
that are insoluble in aqueous solutions. This reduction process requires functional
mitochondria where mitochondrial dehyrogenases of viable cells cleaves the tetrazolium
ring. The trapped formazon crystals are then solubilised by addition of a detergent so
that the color can be quantified by spectrophotometric means (Mosmann, 1983). The
absorption of dissolved formazan in the visible region correlates with the number of
intact alive cells. Cytotoxic compounds are able to damage and destroy cells, and thus
decrease the reduction of MTT to formazan. Absorbance values that are lower than the
control cells indicate a reduction in the rate of cell proliferation. Conversely a higher
absorbance rate indicates an increase in cell proliferation (Carmicheal et al., 1987).
According to the United States National Cancer Institute plant screening
program, a plant extract is generally considered to have active cytotoxic effect if the
IC50 value, following incubation between 48 to 72 hours, is 20 µg/ml or less (Lee and
Houghton, 2005). Cytotoxicity activity (IC50) and Selectivity Index (SI) of the extracts
of leaves, rhizomes, roots and pseudo stems of A. scabra are summarized in tables 4.3,
4.4, 4.5 and 4.6, respectively. Data are shown as mean ± SD from three independent
experiments.
49
Absorbance values and percentage of inhibition of leaves, rhizomes, roots and
pseudo stems of A. scabra against the MCF7, SKOV-3 and MRC-5 cells are shown in
Appendix B and C. Besides that, the IC50 value was determined by extrapolation of the
graph of concentration of extract against percentage of inhibition. The IC50 value of the
extract/fraction was calculated as the average of three replicates and an example of the
calculation of the IC50 value is shown in Appendix D.
For MCF7 cells, hexane and chloroform extracts of leaves sample have active
cytotoxic effect on MCF7 cells. The hexane extract of leaves showed high inhibition
towards MCF7 cells with IC50 value of 15.30 µg/ml at 48 hours, in comparison to IC50
value at 24 hours and 72 hours, which are 19.30 µg/ml and 16.33 µg/ml, respectively.
The chloroform extract of the leaves showed good cytotoxic effect with an IC50 value of
18.80 µg/ml at 24 hours and the rhizomes, roots and pseudo stems showed weaker
cytotoxicity profile against the MCF7 cells.
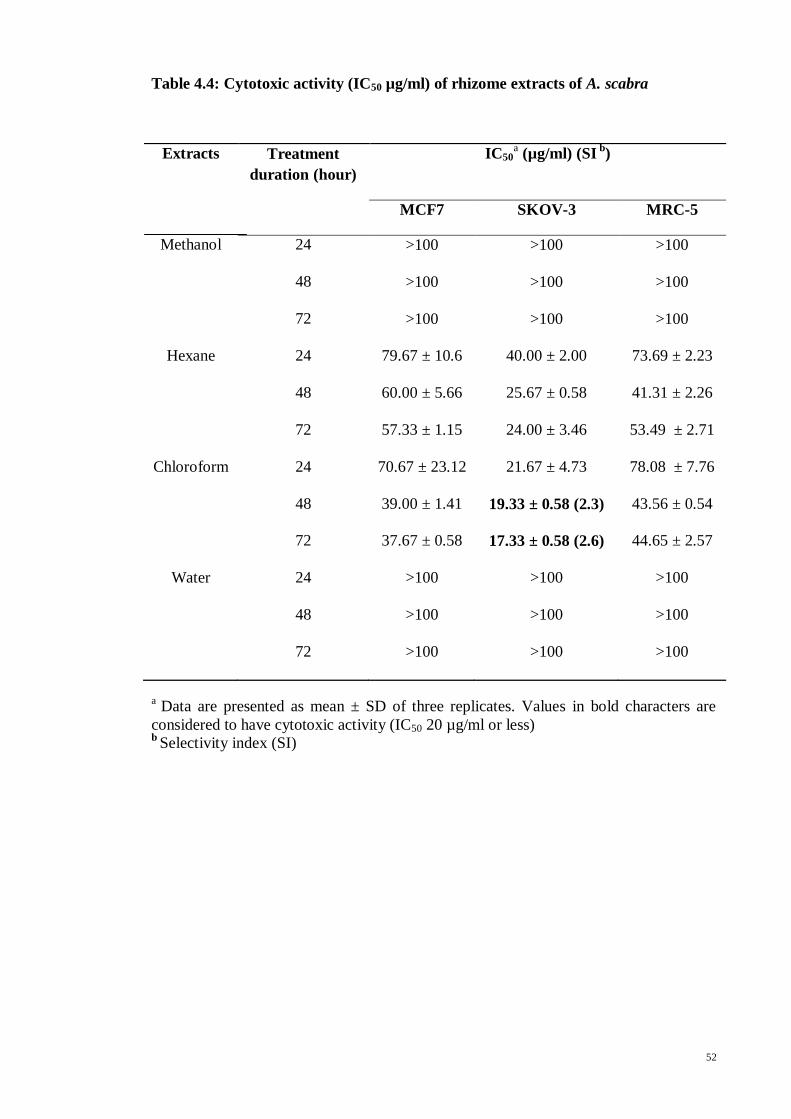
Meanwhile for SKOV-3 cells, the hexane and chloroform extracts of the leaf
sample and chloroform extract of the rhizome sample have active cytotoxic effect on the
cells. Hexane extract of the leaf showed a remarkably high inhibition towards SKOV-3
cells with IC50 value of 4.93 µg/ml at 72 hours, in comparison to IC50 value at 24 hours
and 48 hours, which are 18.00 µg/ml and 6.00 µg/ml, respectively. The chloroform
extract from the leaf samples possessed the strongest cytotoxicity at 48 hours with IC50
value of 14.33 µg/ml in comparison to the IC50 values at 24 hours and 72 hours.
Meanwhile, the chloroform extract from the rhizomes sample showed a remarkably high
inhibition towards SKOV-3 cells with IC50 value of 17.30 µg/ml at 72 hours, in
comparison to the IC50 values at 24 hours and 48 hours, which are 21.67 µg/ml and 19.33
µg/ml, respectively. Roots and pseudo stems showed weaker cytotoxicity profile against
the SKOV-3 cells. MRC-5 cells have been used as control in many similar studies
(Reddy et al., 2012, Ramasamy et al., 2012). All the 4 samples were also screened on the
50
MRC-5 cells and only the leaf hexane extract showed cytotoxicity at 48 hours and 72
hours with IC50 values of 14.64 µg/ml and 15.90 µg/ml, respectively. Selectivity of the
active extracts were determined but none of the active extracts showed selectivity to the
cancer cells since all the selectivity indexes are lower than 3 except for leaf hexane
which showed selectivity towards SKOV-3 cells at 72 hours with the SI value of 3.2
(Table 4.3).
The leaf (hexane and chloroform) and rhizome (chloroform) extracts were
selected for the bioassay-guided fractionation as it showed the strongest cytotoxic effect
against the selected cancer cells.
51
Table 4.3: Cytotoxic activity (IC50 µg/ml) of leaf extracts of A. scabra
a Data are presented as mean ± SD of three replicates. Values in bold characters are
considered to have cytotoxic activity (IC50 20 µg/ml or less) b
Selectivity index (SI)
Extracts Treatment
duration (hour)
IC50a (µg/ml) (SI
b)
MCF7 SKOV-3 MRC-5
Methanol 24 90.67 ± 6.11 47.00 ± 11.53 >100
48 56.27 ± 9.18 37.67 ± 2.52 57.58 ± 1.25
72 53.33 ± 6.43 34.33 ± 0.58 65.35 ± 1.68
Hexane 24 19.30 ± 5.7 (1.6) 18.00 ± 2.65 (1.7) 31.38 ± 2.31
48 15.30 ± 4.04 (1.0) 6.00 ± 1.00 (2.4) 14.63 ± 2.08
72 16.33 ± 0.58 (1.0) 4.93 ± 0.12 (3.2) 15.90 ± 0.94
Chloroform 24 18.80 ± 1.06 (2.4) 20.00 ± 1.00 (2.3) 45.88 ± 3.81
48 23.67 ± 7.64 14.33 ± 1.53 (2.3) 32.26 ± 2.11
72 25.00 ± 0 14.67 ± 0.58 (2.2) 32.90 ± 0.76
Water 24 >100 >100 >100
48 >100 >100 >100
72 >100 >100 >100
52
Table 4.4: Cytotoxic activity (IC50 µg/ml) of rhizome extracts of A. scabra
a Data are presented as mean ± SD of three replicates. Values in bold characters are
considered to have cytotoxic activity (IC50 20 µg/ml or less) b
Selectivity index (SI)
Extracts Treatment
duration (hour)
IC50a (µg/ml) (SI
b)
MCF7 SKOV-3 MRC-5
Methanol 24 >100 >100 >100
48 >100 >100 >100
72 >100 >100 >100
Hexane 24 79.67 ± 10.6 40.00 ± 2.00 73.69 ± 2.23
48 60.00 ± 5.66 25.67 ± 0.58 41.31 ± 2.26
72 57.33 ± 1.15 24.00 ± 3.46 53.49 ± 2.71
Chloroform 24 70.67 ± 23.12 21.67 ± 4.73 78.08 ± 7.76
48 39.00 ± 1.41 19.33 ± 0.58 (2.3) 43.56 ± 0.54
72 37.67 ± 0.58 17.33 ± 0.58 (2.6) 44.65 ± 2.57
Water 24 >100 >100 >100
48 >100 >100 >100
72 >100 >100 >100
53
Table 4.5: Cytotoxic activity (IC50 µg/ml) of root extracts of A. scabra
aData are presented as mean ± SD of three replicates.
b Selectivity index (SI)
Extracts Treatment
duration (hour)
IC50a (µg/ml) (SI
b)
MCF7 SKOV-3 MRC-5
Methanol 24 70.67 ± 5.86 56.67 ± 1.15 44.98 ± 10.59
48 47.67 ± 4.93 34.67 ± 0.58 47.70 ± 8.68
72 64.00 ± 0.00 34.00 ± 4.36 38.94 ± 5.02
Hexane 24 56.00 ± 2.00 33.33 ± 1.15 30.59 ± 0.36
48 33.67 ± 5.03 28.33 ± 3.51 30.71 ± 3.15
72 40.67 ± 1.15 28.00 ± 1.73 29.59 ± 5.98
Chloroform 24 67. 33 ± 5.03 44.00 ± 5.29 30.27 ± 0.33
48 37.33 ± 4.16 37.00 ± 0.58 51.09 ± 10.80
72 42.67 ± 2.31 33.67 ± 3.21 38.39 ± 5.57
Water 24 >100 >100 >100
48 >100 >100 >100
72 >100 >100 >100
54
Table 4.6: Cytotoxic activity (IC50 µg/ml) of pseudo stem extracts of A. scabra
aData are presented as mean ± SD of three replicates.
b Selectivity index (SI)
Extracts Treatment
duration (hour)
IC50a (µg/ml) (SI
b)
MCF7 SKOV-3 MRC-5
Methanol 24 >100 >100 >100
48 >100 >100 >100
72 >100 >100 >100
Hexane 24 >100 40.67 ± 3.51 >100
48 84.00 ± 1.00 34.00 ± 1.73 55.86 ± 16.71
72 67.30 ± 1.15 34.67 ± 0.58 49.74 ± 1.33
Chloroform 24 80.00 ± 15.10 56.00 ± 5.29 >100
48 66.67 ± 1.16 30.67 ± 5.13 52.86 ± 1.75
72 59.30 ± 1.15 33.00 ± 1.73 48.18 ± 2.34
Water 24 >100 >100 >100
48 >100 >100 >100
72 >100 >100 >100
55
4.3 Extraction, isolation and identification of chemical constituents from A.
scabra
Bioassay-guided method was used to isolate the most effective constituent of
leaf and rhizome chloroform extract in inhibiting the growth of human cancer cells.
Bioassay-guided fractionation of medicinal plants is a feature of routine in the attempt
to isolate bioactive components from natural sources. Most of the plant compounds that
have been found to be medicinally useful and interesting tend to be secondary
metabolites (Fakim, 2006).
4.3.1 Bioassay-guided fractionation of the leaf chloroform extract
The cytotoxic effect of the fractions (LC1 - LC10) derived from the chloroform
extract of leaf by vacuum liquid chromatography (VLC) was evaluated in order to
determine the fraction that give the highest activity. The cytotoxic activities of ten
fractions were tested on MCF7, SKOV-3 and MRC-5 cell lines using MTT assay at 72
hours. The fraction LC4 was the only fraction found to be active in the cytotoxicity
screening against MCF7 and SKOV-3 cell lines with IC50 values of 18.53 and 11.12
µg/ml, respectively (Table 4.7). Hence, fraction LC4 warranted further purification by
VLC and yielded 17 sub-fractions (VLC1 - VLC17). As shown in Table 4.7, sub-
fraction VLC9 showed good cytotoxicity against MCF7 and SKOV-3 cell lines (IC50
values of 15.53 and 10.89 µg/ml, respectively) but weak cytotoxicity profile against the
MRC-5 cell line. In Table 4.7, the cytotoxicity in ascending order was leaf chloroform
extract < LC4 < VLC9. This may be due to the cytotoxic compounds present in VLC9
after the purification of leaf chloroform extract and LC4 via VLC. Thus, the active
ingredients in VLC9 may lead to valuable compounds that have the ability to kill cancer
cells but not toxic against normal MRC-5 cells. The incubation time of 72 hours was
selected to allow sufficient time for bioactive compounds to produce effect without
56
having to re-feed the cells. Besides, insufficient incubation time may give a false
negative indication (Riddell et al., 1986; Carmichael et al., 1987).
57
Table 4.7: Cytotoxic activity (IC50 µg/ml) of fractions and sub-fraction obtained
from leaf chloroform extract
Fraction (LC) /
Sub-fraction
(VLC)
IC50a(µg/ml)
MCF7 SKOV- 3 MRC-5
LC1 50.00 ± 5.00 92.30 ± 4.78 >100
LC2 42.20 ± 4.48 56.00 ± 6.60 >100
LC3 33.40 ± 4.05 40.50 ± 2.56 >100
LC4
LC5
18.53 ± 1.02
51.18 ± 4.56
11.12 ± 0.24
39.18 ± 1.34
>100
>100
LC6 >100 >100 >100
LC7 >100 >100 >100
LC8 >100 >100 >100
LC9 >100 >100 >100
LC10
VLC9
>100
15.53 ± 0.50
>100
10.89 ± 0.64
>100
>100
Chloroform 25.00 ± 0.00 14.67 ± 0.58 32.90 ± 0.76
aData are presented as mean ± SD from three independent experiments triplicate for
each. Values in bold characters are considered to have cytotoxic activity (IC50 20 µg/ml
or less)
58
4.3.2 Bioassay-guided fractionation of the rhizome chloroform extract
The cytotoxic effect of the fractions (RC1 - RC18) derived from the chloroform
extract of rhizome by VLC was evaluated in order to determine the fraction that give
the highest activity. The cytotoxic activities of 18 fractions were tested on SKOV-3 and
MRC-5 cell lines using MTT assay at 72 hours. Table 4.8 shows the IC50 values of the
18 fractions from the chloroform extract of rhizome. Fraction RC5 was the only fraction
which exhibited remarkable cytotoxicity (IC50 value of 2.84 µg/ml) and showed high
selectivity (SI value of 14.15) against the SKOV-3 cells, compared to the rhizome
chloroform extract. This showed the improvement of cytotoxicity and selectivity after
the purification procedure. Besides that, variations in the cytotoxic activities among the
chloroform extract and RC5 against SKOV-3 could be attributed to the distribution of
the several identified cytotoxic compounds in different fractions/sub-fractions (Cheng et
al., 2006).
59
Table 4.8: Cytotoxic activity (IC50 µg/ml) of fractions obtained from the rhizome
chloroform extract
Fraction IC50(µg/ml) (SIb)
SKOV-3 MRC-5
RC1 94.56 ± 4.32 95.70 ± 3.00
RC2 88.90 ± 4.78 66.00 ± 5. 66
RC3 25.49 ± 2.56 50.80 ± 1.24
RC4
RC5
23.35 ± 2.24
2.84 ± 0.60 (14.15)
71.00 ± 3.40
40.20 ± 1.50
RC6 39.90 ± 1.18 >100
RC7 32.63 ± 6.78 >100
RC8 50.24 ± 7.78 >100
RC9 64.50 ± 1.40 >100
RC10
RC11
RC12
RC13
RC14
RC15
RC16
RC17
RC18
66.82 ± 2.26
51.30 ± 3.12
45.70 ± 4.00
21.60 ± 10.80
29.70 ± 2.50
25.33 ± 3.56
24.75 ± 2.85
45.08 ± 3.45
43.89 ± 4.76
>100
>100
>100
>100
>100
>100
>100
>100
>100
Chloroform 17.33 ± 0.58 (2.6) 44.65 ± 2.57
aData are presented as mean ± SD from three independent experiments triplicate for
each. Values in bold characters are considered to have cytotoxic activity (IC50 20 µg/ml
or less); bSelectivity Index (SI)
60
4.3.3 GC-MS analysis of cytotoxic extracts, fractions and sub-fraction
The cytotoxic hexane leaf extracts were analysed using GC-MS (Appendix E) in
the present study. The identified compounds are methyl palmitate 61.02 % and methyl
stearate 24.91 % which comprise of 85.93 % of the total detected compounds in the
hexane extract. Methyl palmitate EI-MS m/z (%): 270 [M] +
(2), 239 (2), 227 (5), 213
(2), 199 (4), 185 (5), 171 (8), 157 (2), 143 (18), 129 (8), 115 (4), 107 (1), 97 (8), 87
(70), 74 (100), 65 (1), 55 (30). Methyl stearate EI-MS m/z (%): 298 [M] +
(6), 255 (8),
241 (2), 213 (4), 199 (8), 185 (6), 143 (26), 129 (20), 111 (4), 97 (10), 87 (70), 74
(100), 55(56). All the compounds were identified by GC-MS analysis as well as
comparison of its mass spectral data with reported data (Sri Nurestri et al., 2009).
Structures of the compounds are shown in Figure 4.1. Meanwhile, many unidentified
compounds were present in the leaf chloroform extract, rhizome chloroform extract,
fraction LC4, RC5 and sub-fraction VLC9 (Appendix F - J). Due to an insufficient
amount of the above extracts, further studies on the isolation and chemical
characterization of the pure bioactive compounds were not carried out.
Previous report by Sri Nurestri et al. (2009) suggested that methyl esters might
exert cytotoxic effect against normal MRC-5 cells but not on KB, MCF7 and HCT116
cells. This finding supports the data from the present study on the cytotoxicity of A.
scabra extracts against MRC-5 cells. As shown in Table 4.3, the hexane leaf extract
showed cytotoxic activity on MRC-5 cells at 48 and 72 hours with IC50 values of 14.63
and 15.90 µg/ml, respectively. This can be due to the presence of methyl palmitate and
methyl stearate in the extract. Furthermore, this finding on cytotoxicity of methyl esters
is supported by Takeara et al. (2008) which reported that methyl palmitate showed
cytotoxic effect on T-cell leukemia cell line (Molt-4) with IC50 value of 2.28 µg/ml
while methyl stearate was cytotoxic to acute promyeloblastic leukemia cell line (HL-60)
and Molt-4 cell line with IC50 values of 3.08 and 4.65 µg/ml, respectively.
61
Figure 4.1: Structures of methyl palmitate and methyl stearate
CH3
O CH3
O Methyl palmitate
CH3
O
O
CH3
Methyl stearate
62
4.4 Detection of apoptosis
In the present study, active extracts and fractions of A. scabra studied with IC50
value equal to or less than 20 µg/ml are considered cytotoxically active and were
selected for further assessment of their apoptotic activities by various morphological
and biochemical methods. Cytotoxically active extracts from leaves, rhizomes, fractions
LC4, RC5 and sub-fraction VLC9 were analysed for their potential apoptotic activity on
MCF7 and SKOV-3 cell lines using phase-contrast and fluorescence microscopy
method and detection of DNA fragmentation by agarose electrophoresis.
4.4.1 Morphological assessment of apoptotic cells by phase-contrast inverted
microscope
Phase-contrast microscopy revealed the early stages of apoptosis which are
characterized by the shrinkage of cells, blistering, and membrane blebbing (Xu et al.,
2004). The results from the present study (Figure 4.2, 4.3 and 4.4) showed that there
were obvious morphological changes in MCF7 and SKOV-3 cells after treatment with
the cytotoxic extracts, fractions and sub-fraction which were indicative of cell
apoptosis. The untreated control MCF7 and SKOV-3 cells maintained their original
morphology which are cuboids and in polygonal shapes, and were adherent to the
plates. The MCF7 cells were treated with hexane and chloroform extracts of leaves
(Figure 4.2) while SKOV-3 cells were treated with leaf hexane, leaf chloroform and
rhizome chloroform extracts (Figure 4.3) for 24, 48 and (or) 72 hours according to the
IC50 values (Table 4.3 and 4.4). Figure 4.4 shows MCF7 and SKOV-3 cells treated with
fraction LC4, sub-fraction VLC9 and fraction RC5 at 72 hours according to the IC50
values in Tables 4.7 and 4.8. The most recognizable morphological features of apoptotic
cells observed in this study were shrinkage of cells due to cytoplasmic condensation,
rounding up of cells, bleb formation, chromatin condensation and apoptotic bodies
formation. Other morphological change observed in apoptotic cells was the rounded up
63
cells losing contact with neighbouring cells and caused some sensitive cells to detach
from the surface of the well plates. These morphological observations of apoptotic cells
were in agreement with previous report (Ramasamy et al., 2012). Furthermore, cell
shrinkage happens only in apoptotic cell death. Cells intracellular concentration of
monovalen ions (K+ and Na
+) was able to inhibit activation of cell death cascade. As a
result, the ions will be expelled out during apoptotic event and this will cause cell
shrinkage. Compare to necrosis, ionic homeostatis occurs due to the drastically decrease
of energy level. This event will cause the increase of cell volume and subsequently,
swelling and total cell lysis will be observed (Bortner and Cidlowski, 1998; Hong et al.,
2002).
64
Figure 4.2: Morphological observation of MCF7 cells treated with the cytotoxic
leaf hexane and chloroform extracts under phase-contrast inverted microscope
(magnification 200x). Arrows indicate (A) cell shrinkage and (B) membrane blebbing
as evidence of apoptosis. Note that the cells were treated with the following
concentrations of extracts: a = 19.3 µg/ml, b= 15.30 µg/ml, c = 16.33 µg/ml and d =
18.80 µg/ml. Figures shown were obtained from at least three independent experiments
with similar parameter.
24 hours 48 hours 72 hours
Con
trol
Lea
f h
exan
e
Lea
f ch
loro
form
A
A
B
A
B
A
a b c
d
65
24 hours 48 hours 72 hours
Con
trol
Lea
f h
exan
e
Lea
f ch
loro
form
Rh
izom
e ch
loro
form
A
B
C
B
A
B
A
B
A
C
B
C
a b c
d e f
g h
66
Figure 4.3: Morphological observation of SKOV-3 cells treated with the cytotoxic
leaf hexane, leaf chloroform and rhizome chloroform extracts under phase-
contrast inverted microscope (magnification 200x). Arrows indicate (A) cell
shrinkage; (B) membrane blebbing and (C) apoptotic bodies as evidence of apoptosis.
Note that the cells were treated with the following concentrations: a = 18.00 µg/ml, b =
6.00 µg/ml, c = 4.93 µg/ml, d = 20.00 µg/ml, e = 14.33 µg/ml, f = 14.67 µg/ml, g =
19.33 µg/ml and h = 17.33 µg/ml. Figures shown were obtained from at least three
independent experiments with similar parameter.
67
MCF7 SKOV-3
Con
trol
Fra
ctio
n L
C4
Su
b-f
ract
ion
VL
C9
Su
b-f
ract
ion
RC
5
a b
c d
e
B
A
B
A
A
C
A
B
A
B
68
Figure 4.4: Morphological observation of MCF7 and SKOV-3 cells treated with
the cytotoxic fractions LC4, VLC9 and RC5 under phase-contrast inverted
microscope (magnification 200x). Arrows indicate (A) cell shrinkage; (B) membrane
blebbing and (C) apoptotic bodies as evidence of apoptosis. Note that the cells were
treated with the following concentrations: a = 18.53 µg/ml, b = 11.12 µg/ml, c = 15.53
µg/ml, d = 10.89 µg/ml and e = 2.84 µg/ml. Figures shown were obtained from at least
three independent experiments with similar parameter.
69
4.4.2 DNA fragmentation analysis by agarose electrophoresis
DNA fragmentation is a biochemical hallmark of apoptotic cell death. To
elucidate whether the active extracts and fractions decrease cell survival by the
induction of DNA fragmentation, genomic DNA isolated from MCF7 and SKOV-3
cells were exposed according to the IC50 value concentration, electrophoresed and
photographed as shown in Figures 4.5 and 4.6. Typical DNA ladder formation can be
seen clearly in the MCF7 and SKOV-3 cells treated with doxorubicin whereas DNA
from untreated MCF7 and SKOV-3 cells did not show any fragmentation or smearing.
In MCF7 cells-treated with cytotoxic active extracts and sub-fractions (Figure 4.5), the
formation of DNA ladder was observed less clearly as there were interspersing smear in
the lanes. This pattern can be clearly observed in MCF7 cells-treated with hexane and
chloroform extract of leaf, fraction LC4 and sub-fraction VLC9 at concentrations of
19.30, 18.80, 18.53 and 15.53 µg/ml, respectively. The smearing could be due to some
post-apoptotic necrosis cells (Ramasamy et al., 2012).
For the SKOV-3 cells (Figure 4.6), the ladder-like appearance of DNA observed
mildly in the cells treated with hexane and chloroform extract of leaf at concentrations
of 18.0 and 20.0 µg/ml, respectively. SKOV-3 cells which are treated with chloroform
extract of rhizome, fraction LC4, sub-fraction VLC9 and fraction RC5 at concentrations
of 21.67, 11.12, 10.89 and 2.84 µg/ml, respectively did not show any DNA laddering or
even smearing effect. This can be due to the concentration of the particular extract and
sub-fractions which were used to treat the cells were low since at lower doses of
treatment, only high molecular weight intact DNA was observed (Yew et al., 2009).
Besides that, in some cases, DNA fragmentation appears to be delayed, partial, or
absent in cells which otherwise meet the morphological criteria for apoptosis and maybe
show more limited DNA degradation with the formation of 300- or 50-kb fragments
(Zakeri et al., 1993).
70
The large band present at the top of the gel as observed in SKOV-3 cells treated
with fraction LC4 and RC5 may represent large semi-fragmented pieces of DNA and
indicates incomplete apoptotic fragmentation in the sample material (Matassov et al.,
2004).
71
Figure 4.5: DNA fragmentation of MCF7 cells after treated with
cytotoxic extracts and sub-fractions for 24 hours
50 b
p D
NA
Mark
er
Un
trea
ted
cel
l
Lea
f h
exan
e ex
tract
Lea
f ch
loro
form
extr
act
Fra
ctio
n L
C4
Su
b-f
ract
ion
VL
C 9
Posi
tive
con
trol
2000
bp
1500
1000
750
500
300
150
50
72
U
ntr
eate
d c
ell
Posi
tive
con
trol
Figure 4.6: DNA fragmentation of SKOV-3 cells after treated with
cytotoxic active extracts and sub-fractions for 24 hours.
50 b
p D
NA
mark
er
Lea
f h
exan
e ex
tract
Lea
f ch
loro
form
extr
act
extr
act
Rh
izom
e ch
loro
form
extr
act
Fra
ctio
n L
C4
Su
b-f
ract
ion
VL
C 9
Fra
ctio
n R
C 5
bp
2000
1500
1000
750
500
300
150
50
73
4.4.3 Morphological detection of apoptosis using DAPI nuclear stain
DAPI is a fluorescent stain that allows examination of nuclei in a fluorescence
microscope for morphologic assessment of changes during apoptosis (Kapuscinski,
1995). Apoptosis is initially characterized by morphological features, such as chromatin
condensation, nuclear fragmentation, and membrane blebbing (Kerr et al., 1972). To
gain an insight on the effect of cytotoxic extracts, fractions, sub-fraction and
doxorubicin on nuclear alterations, cells were stained with DAPI. Figure 4.7 and 4.8
show the apoptotic morphological characteristics, as visualized by DAPI staining, of
MCF7 and SKOV-3 cells treated (for 24 hours) with cytotoxic extracts, fractions, sub-
fraction and doxorubicin (positive control) according to the IC50 values. In the control-
untreated group (Figure 4.7 (a) and 4.8(a), the cells were rounded in shape and the large
nuclei were homogenously stained with a less bright blue color. This is because when
healthy cells are exposed to DAPI, staining is restricted to chromatin. Treated MCF7
and SKOV-3 cells displayed bright blue fluorescence with higher intensity than
untreated cells due to the highly condensed chromatin.
Besides that, signs of nuclear shrinkage and chromatin condensation which are
hallmark of apoptosis were also observed as shown in Figure 4.7 and 4.8. Apoptosis is
also characterized by the condensation of nuclear chromatin followed by the eventual
breakup of the chromatin leading to nuclear fragmentation (Willingham, 1999). This
indicated that MCF7 and SKOV-3 cells underwent apoptosis when treated with the
cytotoxic extracts, fractions and sub-fraction. This nuclear morphology changes were in
agreement with previous report (Hsiung and Kadir, 2011).
74
a) Negative control
b) Leaf hexane
c) Leaf chloroform
d) Fraction LC4
e) Sub-fraction VLC9
f) Positive control - doxorubicin
Figure 4.7: Morphological observation with DAPI staining by fluorescence
microscope for MCF7 cells at 24 hours (magnification 400x). Arrows indicate signs
of nuclear shrinkage and chromatin condensation. DNA samples in the untreated cells
were homogenously stained and less intense compared to those in treated cells.
75
a) Negative control
b) Leaf hexane
c) Leaf chloroform
d) Rhizome chloroform
e) Fraction LC4
f) Sub-fraction VLC9
g) Fraction RC5
h) Positive control - doxorubicin
Figure 4.8: Morphological observation with DAPI staining by fluorescence
microscope for SKOV-3 cells at 24 hours (magnification 400x). Arrows indicate
signs of nuclear shrinkage and chromatin condensation. The untreated cells were
rounded in shape and the large nuclei were homogenously stained with less bright blue
color.