81 CHAPTER 4 SYNTHESIS AND CHARACTERIZATION OF POLYIMIDES BASED ON BPDA, BTDA, 6FDA AND ODA 4.1 INTRODUCTION The dielectric constants of terpolyimides, BPDA/BTDA/ODPA- ODA with different proportions, were above 3.52 as discussed in the previous chapter. Since the values are high for applications in microelectronics and insulations, it was planned to substitute ODPA with monomers carrying large free volume in order to substantially reduce dielectric constant (Hougham et al1996). In this context 6FDA, which was reported (Clair et al 1988) to have such property was chosen and used for synthesizing copolyimide BPDA/6FDA, and terpolyimides BPDA/BTDA/6FDA-ODA. Copoly(amic acid) BPDA/6FDA-ODA (CP3), and terpoly(amic acid)s BPDA/BTDA/6FDA-ODA, were synthesized by the reaction of ODA with appropriate dianhydride(s) in DMAc at 40% solid content (w/v) in nitrogen atmosphere as depicted in Scheme 4.1 and 4.2. The conversion of PAA into polyimide is also shown in the same scheme. The mole ratio of the dianhydrides to form copoly(amic acid) was 1:1. The mole ratio of the dianhydrides to form terpolyimides is shown in Table 4.1. Homopolyimide BPDA-ODA (HP1) and copolyimide BPDA/BTDA-ODA (CP1) of Chapter 3 were used for comparison. ODA was first dissolved in DMAc and the dianhydrides were then added to it in one lot to produce a random co/terpolyimide as discussed in Chapter 3.
Transcript
81
CHAPTER 4
SYNTHESIS AND CHARACTERIZATION OF
POLYIMIDES BASED ON BPDA, BTDA, 6FDA AND ODA
4.1 INTRODUCTION
The dielectric constants of terpolyimides, BPDA/BTDA/ODPA-
ODA with different proportions, were above 3.52 as discussed in the previous
chapter. Since the values are high for applications in microelectronics and
insulations, it was planned to substitute ODPA with monomers carrying large
free volume in order to substantially reduce dielectric constant
(Hougham et al1996). In this context 6FDA, which was reported
(Clair et al 1988) to have such property was chosen and used for synthesizing
copolyimide BPDA/6FDA, and terpolyimides BPDA/BTDA/6FDA-ODA.
Copoly(amic acid) BPDA/6FDA-ODA (CP3), and terpoly(amic
acid)s BPDA/BTDA/6FDA-ODA, were synthesized by the reaction of ODA
with appropriate dianhydride(s) in DMAc at 40% solid content (w/v) in
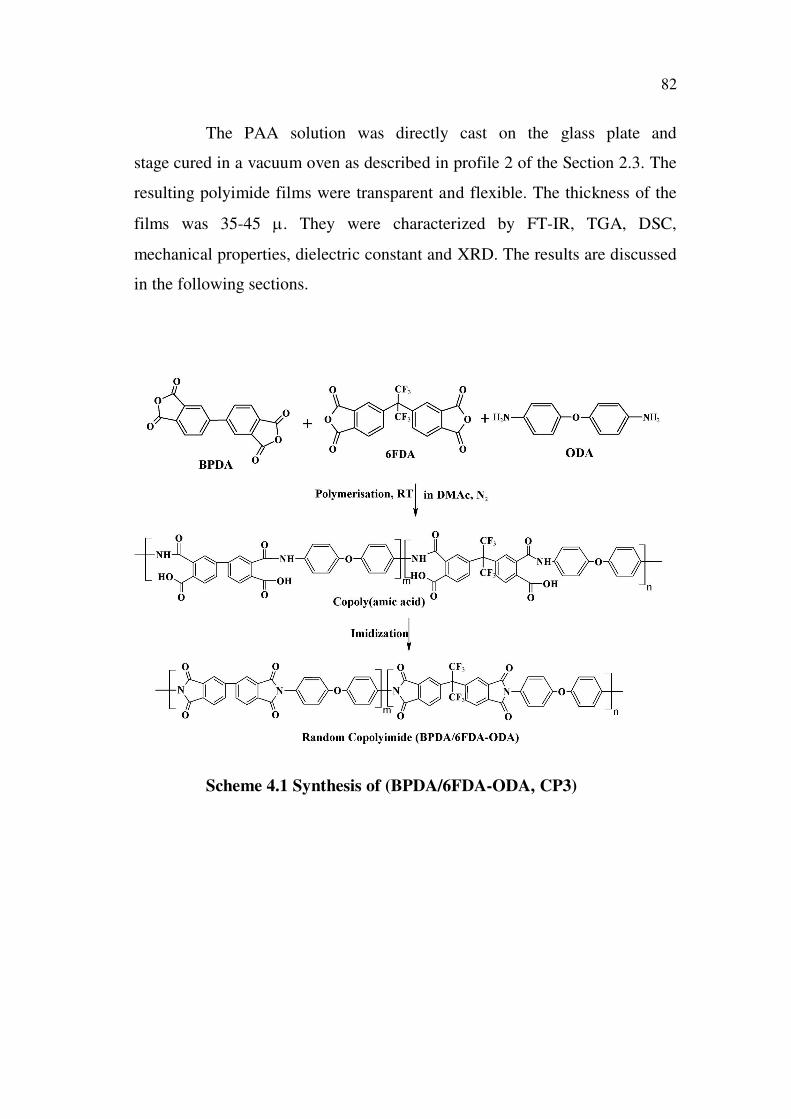
nitrogen atmosphere as depicted in Scheme 4.1 and 4.2. The conversion of
PAA into polyimide is also shown in the same scheme. The mole ratio of the
dianhydrides to form copoly(amic acid) was 1:1. The mole ratio of the
dianhydrides to form terpolyimides is shown in Table 4.1. Homopolyimide
BPDA-ODA (HP1) and copolyimide BPDA/BTDA-ODA (CP1) of Chapter 3
were used for comparison. ODA was first dissolved in DMAc and the
dianhydrides were then added to it in one lot to produce a random
co/terpolyimide as discussed in Chapter 3.
82
The PAA solution was directly cast on the glass plate and
stage cured in a vacuum oven as described in profile 2 of the Section 2.3. The
resulting polyimide films were transparent and flexible. The thickness of the
films was 35-45 . They were characterized by FT-IR, TGA, DSC,
mechanical properties, dielectric constant and XRD. The results are discussed
in the following sections.
Scheme 4.1 Synthesis of (BPDA/6FDA-ODA, CP3)
83
Scheme 4.2 Synthesis of terpolyimide (BPDA/BTDA/6FDA-ODA)
84
Table 4.1 Properties of homo, co and terpolyimides synthesized from
BPDA, BTDA, 6FDA and ODA
Mole ratio of the
monomersFilm
specim
en code
Polyimide composition
BP
DA
BT
DA
6F
DA
OD
A
Film
Colour
HP1 BPDA-ODA 1 0 0 1Pale
yellow
CP1 BPDA/BTDA-ODA 0.5 0.5 0 1Dark
Yellow
CP3 BPDA/6FDA-ODA 0.5 0 0.5 1 Yellow
TP4 BPDA/BTDA/6FDA-ODA 0.5 0.25 0.25 1 Yellow
TP5 BPDA/BTDA/6FDA-ODA 0.25 0.5 0.25 1Dark
Yellow
TP6 BPDA/BTDA/6FDA-ODA 0.25 0.25 0.5 1 Yellow
4.2 CHARACTERIZATION
4.2.1 Fourier Transform Infra-red Analysis
The FT-IR spectrum of CP3 is shown in Figure 4.1 and its group
vibrations are presented in Table 4.2. This analysis was undertaken to
establish completion of imidization. The peak at 3638 cm-1
was due to OH
stretching vibration of free acid groups. The peak at 3486 cm-1
was assigned
to asymmetric N-H stretching vibration of free amine. The free amino group
was to produce its symmetric NH2 stretching vibration at about 3300 cm-1
, but
this peak appeared as a shoulder to the peak at 3486 cm-1
. The low intensity of
the peak at 3486 cm-1
confirmed very low content of such free unused amino
and acid groups. The aromatic C-H stretching vibration occurred at 3072 cm-1
.
The peaks at 1772and 1743 cm-1
were due to asymmetric and symmetric
stretching vibrations of O=C-N-C=O imide groups respectively. The aromatic
85
ring skeletal vibrations produced their characteristic peaks at 1621, 1495 and
1420 cm-1
. The peak at 1375 cm-1
was assigned to C-N vibration. The
phenoxy C-O vibration of ODA occurred at 1221 cm-1
. The group of peaks
below 1000 cm-1
was due to aromatic CH bending vibrations. The formation
cyclic imide was also confirmed by its characteristic peaks at 1113 and
737 cm-1
(Wang et al 2006a). From this analysis it was established that the
polymerization of BPDA, 6FDA and ODA resulted in the formation of mainly
cyclic imides. Though the above features were same as that of BPDA-ODA,
HP1 (Figure 3.1), the peak at 1271 cm-1
in this spectrum appeared as a new
one, it was assigned to C-F vibration.
Table 4.2 Group vibrations of BPDA/6FDA-ODA (CP3)
Wavenumber (cm-1
) Group vibrations
3638 OH stretching vibration of free acid groups
3486 asymmetric N-H stretching vibration of free amine
3072 aromatic C-H stretching vibration
1772asymmetric stretching vibrations of O=C-N-C=O of
imide groups
1743symmetric stretching vibrations of O=C-N-C=O of
imide groups
1621, 1495 and 1420 aromatic ring skeletal vibrations
1375 C-N vibration
1271 C-F vibration
1221 phenoxy C-O vibration
1113 and 737 cyclic imide
Below 1000 aromatic C-H bending vibrations
The FT-IR spectra of terpolyimides, TP4, TP5 and TP6 are shown
in Figure 4.2, 4.3 and 4.4 respectively. All of them showed their characteristic
peaks due to keto C=O stretch of BTDA at about 1719 cm-1
, and C-F stretch
of 6FDA at about 1270 cm-1
in addition to that of BPDA-ODA (Figure 3.1).
86
Figure 4.1 FT-IR spectrum of BPDA/6FDA-ODA (CP3)
87Figure 4.2 FT-IR spectrum of BPDA/BTDA/6FDA-ODA (TP4)
88
Figure 4.3 FT-IR spectrum of BPDA/BTDA/6FDA-ODA (TP5)
89 Figure 4.4 FT-IR spectrum of BPDA/BTDA/6FDA-ODA (TP6)
90
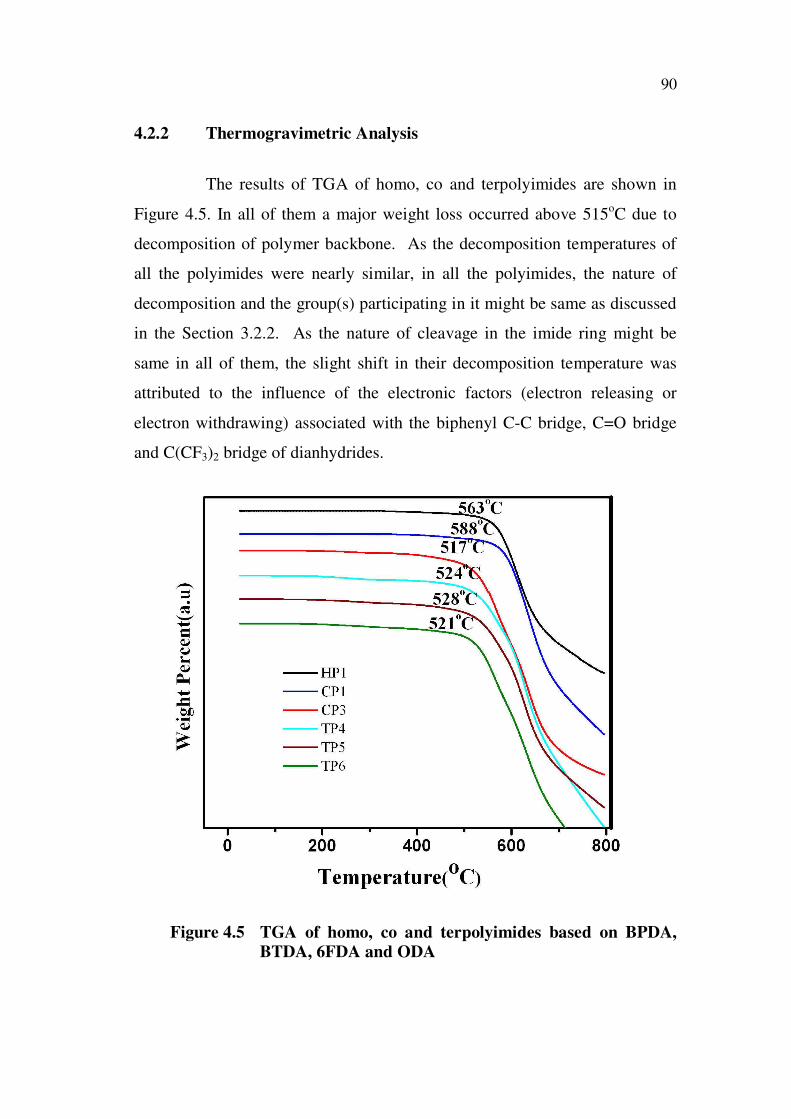
4.2.2 Thermogravimetric Analysis
The results of TGA of homo, co and terpolyimides are shown in
Figure 4.5. In all of them a major weight loss occurred above 515oC due to
decomposition of polymer backbone. As the decomposition temperatures of
all the polyimides were nearly similar, in all the polyimides, the nature of
decomposition and the group(s) participating in it might be same as discussed
in the Section 3.2.2. As the nature of cleavage in the imide ring might be
same in all of them, the slight shift in their decomposition temperature was
attributed to the influence of the electronic factors (electron releasing or
electron withdrawing) associated with the biphenyl C-C bridge, C=O bridge
and C(CF3)2 bridge of dianhydrides.
Figure 4.5 TGA of homo, co and terpolyimides based on BPDA,
BTDA, 6FDA and ODA
91
The decomposition temperature of CP1 (588oC) was higher than
HP1 (563oC) as discussed in Section 3.2.2. The decomposition temperature of
CP3 (517oC) was lower than CP1 (588
oC), as the C(CF3)2 bridge of 6FDA
cannot provide as much electron delocalization as the keto bridge of BTDA. It
is also reflected in terpolyimides, for example, the decomposition temperature
of TP4 (524oC) was lower than CP1 (588
oC) and higher than CP3 (517
oC),
TP5 (528oC) was lower than CP1 (588
oC), and TP6 (521
oC) was slightly
higher than CP3 (517oC).
4.2.3 Differential Scanning Calorimetry
The DSC results of the homo, co and terpolyimides are shown in
Figure 4.6. The Tg of CP1 (288oC) was lower than HP1 (306
oC), because the
substitution of BPDA with BTDA reduced the Tg significantly as discussed in
the Section 3.2.3. The Tg of CP3 (271oC) was also lower than HP1 (306
oC), as
50% BPDA was substituted with 6FDA. Since the aromatic rings in 6FDA are
isolated by C-(CF3)2 group, the imide NCO bond might not be much
polarized. As a consequence, the interchain interaction might be significantly
reduced and Tg lowered, when BPDA was substituted by 6FDA. Similar
decrease in interchain interaction was also manifested in terpolyimides, for
example, the Tg of TP4 (281oC) was lower than CP1 (288
oC) and higher than
CP3 (271oC), the Tg of TP5 (266
oC) was lower than CP1 (288
oC), and the Tg
of TP6 (261oC) was lower than CP3 (271
oC).
92
Figure 4.6 DSC of homo, co and terpolyimides based on BPDA,
BTDA, 6FDA and ODA
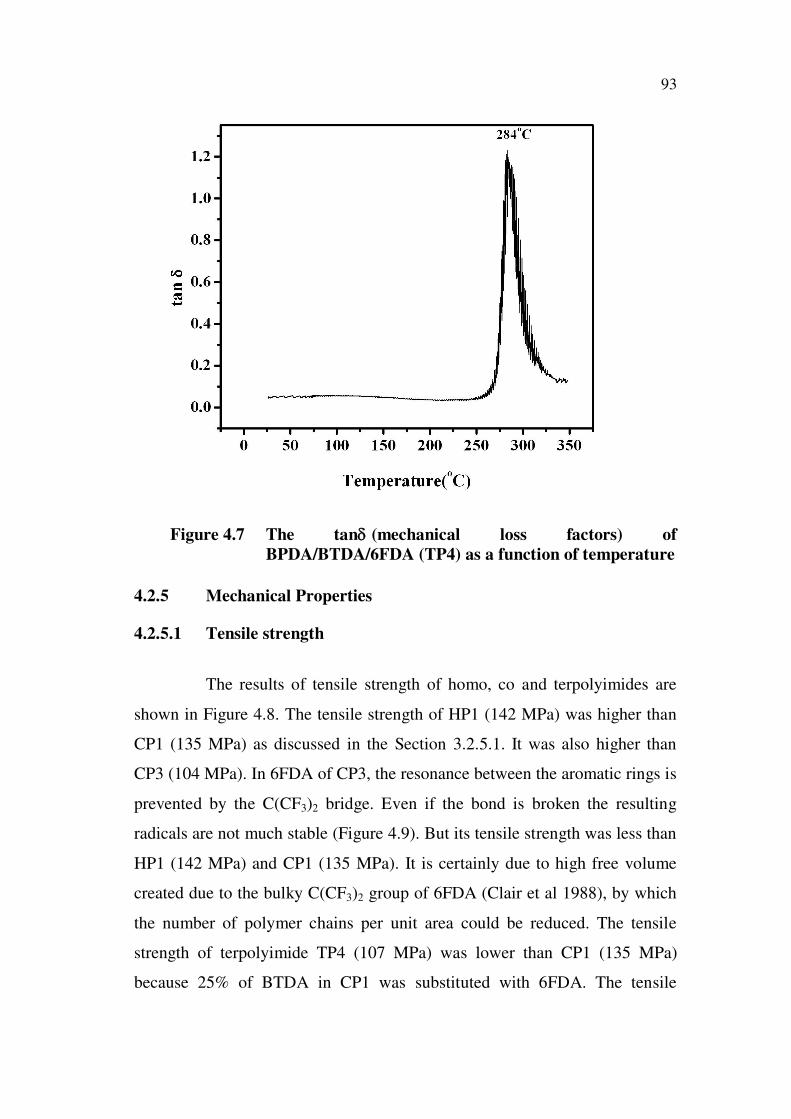
4.2.4 Dynamic Mechanical Analysis
The results of DSC of homo, co and terpolyimides depicted single
Tg for all of them. In order to further confirm it, the DMA was also
undertaken. The plot of tan vs temperature of BPDA/BTDA/6FDA-ODA
(TP4) is shown in Figure 4.7. The Tg occurred at 284oC. The appearance of
single Tg established absence of blocks due to any dianhydride in the polymer
backbone. Hence all the three dianhydrides might be reacting with ODA to
form a random terpolyimide.
93
Figure 4.7 The tan (mechanical loss factors) of
BPDA/BTDA/6FDA (TP4) as a function of temperature
4.2.5 Mechanical Properties
4.2.5.1 Tensile strength
The results of tensile strength of homo, co and terpolyimides are
shown in Figure 4.8. The tensile strength of HP1 (142 MPa) was higher than
CP1 (135 MPa) as discussed in the Section 3.2.5.1. It was also higher than
CP3 (104 MPa). In 6FDA of CP3, the resonance between the aromatic rings is
prevented by the C(CF3)2 bridge. Even if the bond is broken the resulting
radicals are not much stable (Figure 4.9). But its tensile strength was less than
HP1 (142 MPa) and CP1 (135 MPa). It is certainly due to high free volume
created due to the bulky C(CF3)2 group of 6FDA (Clair et al 1988), by which
the number of polymer chains per unit area could be reduced. The tensile
strength of terpolyimide TP4 (107 MPa) was lower than CP1 (135 MPa)
because 25% of BTDA in CP1 was substituted with 6FDA. The tensile
94
strength of TP4 (107 MPa) was higher than CP3 (104 MPa), as it contained
less amount of 6FDA. The tensile strength of TP5 (100 MPa) was less than
CP1 (135 MPa) as 25% of BPDA was replaced by 6FDA. The tensile strength
of TP6 (97 MPa) was lower than CP3 (104 MPa) as 25% of BPDA was
substituted with BTDA. From the above discussion the following conclusions
were drawn.
1. Substitution of BPDA with BTDA reduced tensile strength because
of the stability of the free radicals of BTDA that could be formed at
break.
2. Substitution of BTDA by 6FDA reduced tensile strength as the
6FDA creates more free volume by which the number of polymer
chains was reduced per unit area. Higher percentage of 6FDA than
others reduced the tensile strength dramatically.
3. For higher tensile strength the following order of preference can be
followed for the synthesis of polyimides: BPDA>BTDA>6FDA.
Figure 4.8 Tensile strength of homo, co and terpolyimides based
on BPDA, BTDA, 6FDA and ODA
95
Figure 4.9 Stability of radicals derived from BPDA, BTDA and
6FDA of the polyimides
4.2.5.2 Tensile modulus
The results of tensile modulus of homo, co and terpolyimides are
shown in Figure 4.10. The tensile modulus of HP1 (3.9 GPa) was higher than
CP1 (3.5 GPa), as BPDA without bridge could have more resistance to
deform than BTDA. The tensile modulus of CP1 (3.5 GPa) was higher than
CP3 (2.6 GPa), as BTDA could have higher resistance to deform than 6FDA.
In 6FDA its high free volume is the major factor for its low tensile modulus
compared to HP1 and CP1. The tensile modulus of TP4 (3.4 GPa) was lower
than CP1 (3.5 GPa), as 25% of BTDA with high resistance to deform was
substituted by 6FDA. The tensile modulus of TP5 (3.0 GPa) was lower than
CP1 (3.5 GPa) as 25% BPDA with resistance to deform was substituted by
6FDA. The tensile modulus of TP6 (2.5 GPa) was lower than CP3 (2.6 GPa),
as 25% BPDA was substituted by BTDA. Based on the above discussion the
96
following conclusions were drawn. The resistance to deform for the
dianhydrides decreased in the following order: BPDA>BTDA>6FDA.
Figure 4.10 Tensile modulus of homo, co and terpolyimides based
on BPDA, BTDA, 6FDA and ODA
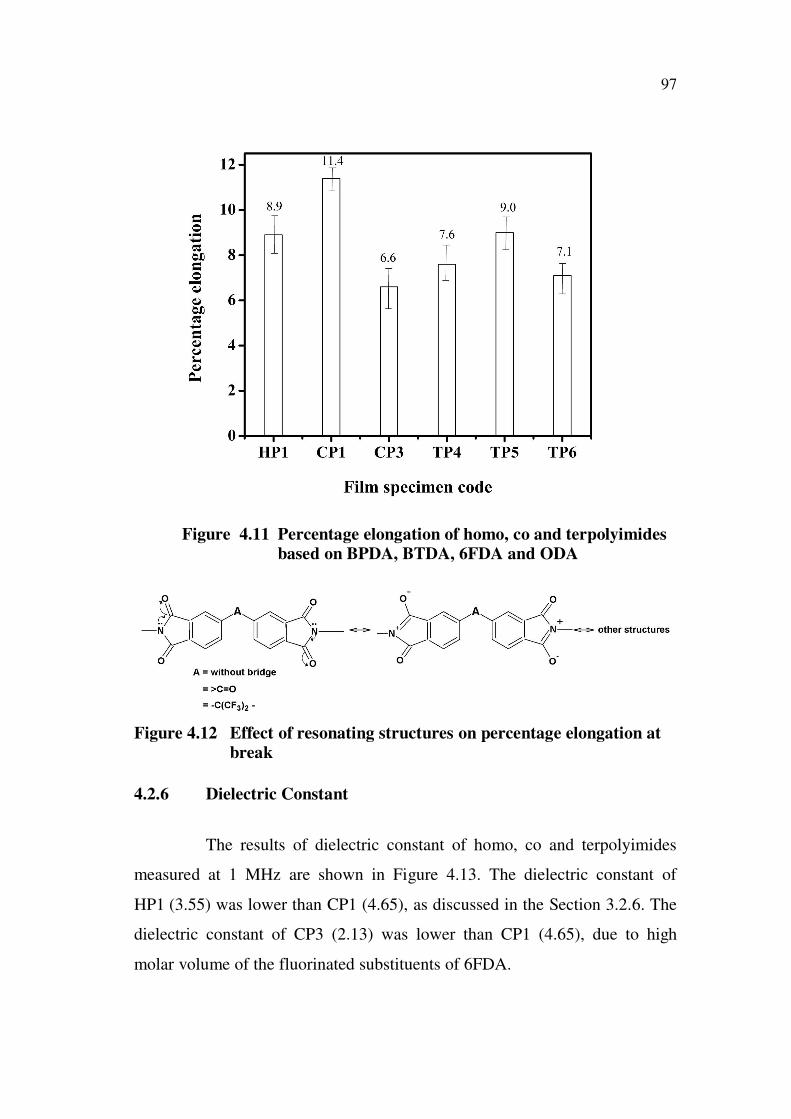
4.2.5.3 Percentage elongation
The results of percentage elongation of homo, co and terpolyimides
are shown in Figure 4.11. The percentage elongation at break of HP1 (8.9)
was lower than CP1 (11.4) as discussed in the Section 3.2.5.3. The percentage
elongation of CP3 (6.6) was lower than CP1 (11.4) as C(CF3)2 bridge in
6FDA will not promote as much resonance delocalisation of nitrogen lone
pair as in BTDA (Figure 4.12). The percentage elongation of TP4 (7.6) was
lower than CP1 (11.4), as 25% of BTDA with high nitrogen lone pair
delocalisation was substituted with 6FDA. The percentage elongation of TP5
(9.0) was lower than CP1 (11.4), as 25% of BPDA with high nitrogen lone
pair delocalisation was substituted by 6FDA. The tensile strength of TP6 (7.1)
was higher than CP3 (6.6), as 25% BPDA was substituted with BTDA.
97
Figure 4.11 Percentage elongation of homo, co and terpolyimides
based on BPDA, BTDA, 6FDA and ODA
Figure 4.12 Effect of resonating structures on percentage elongation at
break
4.2.6 Dielectric Constant
The results of dielectric constant of homo, co and terpolyimides
measured at 1 MHz are shown in Figure 4.13. The dielectric constant of
HP1 (3.55) was lower than CP1 (4.65), as discussed in the Section 3.2.6. The
dielectric constant of CP3 (2.13) was lower than CP1 (4.65), due to high
molar volume of the fluorinated substituents of 6FDA.
98
Figure 4.13 Dielectric constant of homo, co and terpolyimides
based on BPDA, BTDA, 6FDA and ODA
The incorporation of fluorinated substituents was also reported to
have low dielectric constant due to low ratio of molar polarizability over
molar volume (Yen et al 2003). The high molar volume of -C(CF3)2- groups
of 6FDA could also reduce chain packing. Hence it is also an important
factor to reduce the dielectric constant of CP3. Hougham et al (1994) studied
homopolymides of 6FDA containing a series of fluorinated and
non-fluorinated diamines. A trend of decreasing dielectric constant with
increasing fluorine content was observed. Since absorbed water raises the
dielectric constant significantly, the authors surmised that the increase in
hydrophobicity with increasing fluorine content was mainly responsible for
the observed trend. But in this study the polyimides were obtained after stage
curing up to 250oC, hence hydrophobicity offered by fluorine content might
not be a main factor for the comparison of dielectric constant. The dielectric
constants of terpolyimides were also influenced by the composition of the
dianhydrides. The dielectric constant of TP4 (2.89) was lower than
99
CP1 (4.65), as 25% of BTDA was substituted by 6FDA, but higher than CP3
as 25% of 6FDA was substituted by BTDA. The dielectric constant of
TP5 (4.09) was lower than CP1 (4.65), as 25% of BPDA was substituted by
6FDA. The dielectric constant of TP6 (2.38) was higher than CP3 (2.13), as
25% of BPDA was substituted by BTDA.
4.2.7 X-ray Diffraction
The X-ray diffraction patterns of terpolyimides, TP4, TP5 and TP6
are shown in Figure 4.14. The XRD pattern of TP4 and TP5, which contained
25% 6FDA, showed broadened envelope without any peaks. Hence both are
entirely amorphous. The spectrum of TP6, which contained 50% of 6FDA
showed broadened envelope with a peak at 16.8o
(2 . It is a characteristic
feature of crystallinity. In other words TP6 was confirmed to be
semicrystalline. Hence at low percentage of 6FDA loading (25%), the
material was incapable of folding polyimide chains to form tiny crystallites,
whereas at 50% loading, the chains could fold to form tiny crystallites. Work
by Brink et al (1994) illustrated the suppression of ordered morphology by
6FDA when incorporated in rigid polyimides comprised of PMDA and