Page 1
33
*Chapter 4A
Cathodic hydrogen evolution
4A.1 BACKGROUND
Being an energy carrier, and not a primary source of energy in itself,
hydrogen has to be produced from some primary source of energy whereby it
carries the energy originally stored in the primary source. In this context water
electrolysis is envisaged as an important source of zero emission hydrogen in the
future. The main obstacle in the commercial exploitation of water electrolysis for
large scale hydrogen production is the high electricity consumption which makes
the process economically unattractive, despite having several technical and
environmental advantages. From this perspective, the hydrogen evolution reaction
(HER) is of industrial interest and, therefore has attracted much research effort.
The development of novel materials with low overpotential towards HER has been
the subject area of many studies. A number of contributions have also touched
upon the kinetics and reaction mechanism for HER. The principal focus has been
the inter-electrode potential required for water electrolysis as it has a strong
bearing on the energy efficiency of the process.
From an economic and technical standpoint electrode kinetics is of primary
importance. In electrode reactions there is a direct proportionality relationship
between the faradaic current and the electrolysis rate.
i (amperes) = dQ/dt (coulombs/s) (4A.1)
Q / (nF) = N (moles electrolyzed) (4A.2)
* Parts of this Chapter have been published in International Journal of Hydrogen Energy
Page 2
34
where n is the stoichiometric number of electrons consumed in the electrode
reaction and F is the Faraday constant. Thus,
Rate of electrolysis (mol/s) = dN/dt = i / (nF) (4A.3)
Unlike a homogeneous reaction, occurring everywhere within the medium at a
uniform rate, an electrode reaction is a heterogeneous reaction, occurring only at
the electrode-electrolyte interface. Due to this reason, their reaction rates are
usually described in units of mol/s per unit area, that is,
Rate (mol s-1 cm-2) = i / (nFA) = j / (nF) (4A.4)
where j is the current density (A / cm2).
From thermodynamic consideration, every electrode charge transfer is
characterized by an equilibrium potential. For a general cathodic charge transfer,
the electrode reaction can be schematically represented as
M + e– ↔ M¯ {4A.1}
At equilibrium, the rate of the forward reaction is just equal to the rate of the
reverse reaction so that there is no net reaction indicated by an absence of faradaic
current. In order to have an appreciable cathodic reaction the rate of the forward
reaction must be made appreciably higher than that of the reverse reaction. In
practical parlance this would be measured by the current density at the cathode.
For this to happen the actual applied potential at the cathode must be of a higher
magnitude (more negative) than that implied by the equilibrium potential. In fact,
one drives the reaction by supplying the activation energy electrically.
Page 3
35
The departure of the electrode potential from the equilibrium value upon
passage of faradaic current is termed polarization. The extent of polarization is
measured by the overpotential, η,
η = Eappl - Eeq (4A.5)
where,
Eappl = Applied potential
Eeq = Equilibrium potential
Information about an electrode reaction is often gained by determining current
density as a function of potential. Such curves, obtained under steady state
conditions, are called polarization curves. Each value of current density, j, is
driven by a certain overpotential, η, which is a distinguishing characteristic of the
particular electrode-electrolyte system. Besides the electrode reaction, this depends
upon mass transfer effects, chemical reactions preceding or succeeding the
electrode charge transfer, and other surface phenomena like adsorption, desorption
etc.
As mentioned above, at equilibrium, the net current is zero. But even when
the net current is zero at the equilibrium, we still envision balanced faradaic
activity. It can be expressed in terms of the exchange current, i0. It is equal in
magnitude to either component current, cathodic (representing forward reaction) or
anodic (representing backward reaction). Being a heterogeneous reaction, the
exchange current is normalized to unit area to provide the exchange current
density,
j0 = i0 / A (4A.6)
Page 4
36
The exchange current can be viewed as a kind of idle current for charge exchange
across the electrode-electrolyte interface. If we want to draw a net current that is
only a small fraction of this bidirectional idle current, then only a small
overpotential will be required to extract it. The role of the slight overpotential is to
unbalance the rates in the two directions so that one of them predominates. Higher
the net current we require higher the additional activation energy we must supply.
Hence, higher the overpotential required. From this perspective, we see that the
exchange current is the measure of any system’s ability to deliver a net current
without a significant energy loss due to activation.
As previously emphasized, non sulfur black liquor from agricultural
residues, produced in small pulp and paper mills, poses a disposal problem. Hence,
these mills consider this resource rich material as a liability. Being aqueous
alkaline electrolyte black liquor can be a potential candidate for hydrogen
production by electrolysis. This chapter presents the studies on cathodic hydrogen
evolution in black liquor electrolysis.
4A.2 EARLY FINDINGS
When black liquor is subjected to electrolysis, hydrogen is produced at the
cathode with the overall reaction being.
2 H2O → 2 H2 + O2 {4A.2}
The exact reaction mechanism at the electrodes and the elementary reaction steps
involved may be complex. Initial electrolysis experiments were conducted in a
Hoffman voltameter to determine the relative volumetric proportion of hydrogen,
produced at cathode, and gaseous product, if any, at anode. The distinguishing
Page 5
37
feature of black liquor electrolysis was that negligible gaseous products are
produced at the anode. This could be verified through repeated experimental runs
with all black liquors.
Preliminary bulk electrolysis experiments were conducted in a laboratory
setup schematically presented in Figure 3.1 to understand the basic facets of black
liquor electrolysis. Black liquors obtained by laboratory pulping of raw materials
were used in these preliminary experiments. Laboratory pulping conditions and the
initial characteristics of the black liquor are reported in Table 4A.1 and Table
4A.2, respectively. Control experiments were conducted with solution of
potassium hydroxide in distilled water replacing black liquor with all other
arrangements remaining same. Experimental runs, Run 1 and Run 2, were
conducted with wheat straw black liquor 1. In Run 1 a new set of electrodes were
used. Solids deposited at anode were removed and the electrodes were then reused
in Run 2. Similarly, Run 3 and Run 4 were conducted with bagasse black liquor
and Run 5 and Run 6 were conducted on eucalyptus black liquor. Control
experiments Contl 1 and Contl 2 were carried out with 4 % w/w KOH and Contl 3
and Contl 4 were carried out with 20 % w/w KOH.
Results of black liquor electrolysis along with those of control experiments
are shown in Table 4A.3. It can be seen that the energy stored as hydrogen from
black liquor electrolysis (at HHV) is in the range of 84% - 96% of the electrical
energy spent during electrolysis. In comparison, the control experiments of
alkaline water electrolysis, Contl 2 and Contl 4 resulted in 49% and 66%,
respectively, of electrical energy spent in electrolysis being stored as hydrogen.
Page 6
38
Table 4A.1 Laboratory pulping conditions
Wheat straw Bagasse Eucalyptus Amount of raw material (g)
150 150 200
NaOH added (g) 29 29 46.5 Water added (ml) 750 750 800 Pulping temperature (0C)
165 165 170
Time to temperature (min)a
60 60 70
Time at temperature (min)b
150 150 180
a: Time required for the reaction charge to reach the pulping temperature. b: Reaction time provided at the pulping temperature.
Table 4A.2 Initial characteristics of black liquor
Wheat straw Bagasse Eucalyptus Total dissolved solids
11.32% 10.67% 14.38%
organic/inorganic ratio
Organics 50.34% Inorganics 49.66%
Organics 50.94% Inorganics 49.06%
Organics 55.61% Inorganics
44.39% pH 12.62 12.23 13.11 RAA (g/l) 9.8 9.5 10.2
It may be mentioned here that modern water electrolyzers with advanced designs
and zero gap arrangement of electrodes are capable of storing 85% - 90% of
electrical energy as hydrogen (Kreuter and Hofmann, 1998; Gonzalez et al., 2004).
From this perspective these early results indicated that black liquor electrolysis
Page 7
39
Table 4A.3 Results of preliminary electrolysis runs
Current
density (mA/cm2)
Inter electrode potential (V)
Electrical energy
spent (J)
Hydrogen produced
(mg)
Energy equivalent
of hydrogen at HHV (J)
Lignin separated
(mg)
Energy equivalent of lignin
separated (J)
Gaseous product at
anode
Run 1 0.36 – 0.25 1.41 – 1.21 422.87 2.596 367.96 119 1436.4 Negligible Run 2 0.20 – 0.11 1.49 – 1.37 282.28 1.911 270.87 88 1059.7 Negligible Run 3 0.34 – 0.24 1.43 – 1.25 387.51 2.347 332.67 110 1327.8 Negligible Run 4 0.20 – 0.10 1.47 – 1.33 323.47 2.190 310.42 102 1231.2 Negligible Run 5 1.27 – 0.63 1.34 – 1.24 180.28 1.213 171.93 35 512.6 Negligible Run 6 0.70 – 0.21 1.37 – 1.29 358.35 2.135 301.25 60 879.2 Negligible Contl 1 0.50 – 0.03 1.35 – 1.31 - - - - - - - - - - - - Contl 2 0.59 – 0.14 2.41 – 1.97 424.75 1.464 207.59 - - - - Oxygen Contl 3 0.59 – 0.03 1.48 – 1.36 - - - - - - - - - - - - Contl 4 0.98 – 0.17 2.39 – 1.98 363.31 1.696 240.50 - - - - Oxygen
Page 8
40
is competitive with, and in some cases better than, water electrolysis in terms of
the fraction of electrical energy stored as hydrogen.
Another important observation from these experiments was the inter
electrode potential required for electrolysis. As evident from Table 4A.3, hydrogen
production in black liquor electrolysis could be obtained at inter electrode potential
as low as 1.21 V. In comparison, under similar conditions, hydrogen evolution
stopped at an inter electrode potential of 1.31 V in the case of alkaline water
electrolysis. In the 1st control experiment (Contl 1 in Table 4A.3) the current
density rapidly dropped and electrolysis ceased within a very short span of time
without any noticeable production of hydrogen. Control experiment 2 (Contl 2 in
Table 4A.3) was then carried out with increased inter electrode potential. Control
experiments 3 and 4 were carried out with increased electrolyte concentration. But,
here also, no hydrogen production was observed at lower inter electrode potential
(Contl 3 in Table 4A.3). Although, it will be premature to draw any conclusion
regarding the thermodynamics and electrochemical parameters of black liquor
electrolysis vis a vis water electrolysis, it certainly provided the basis for future
research keeping in mind that inter electrode potential is directly linked with
energy transformations during electrolysis (Ulleberg, 2003).
As mentioned above, one distinguishing feature of black liquor electrolysis
was that negligible gaseous products are produced at the anode. This can give the
process significant advantages over other electrolytic hydrogen production
methods. First, since only one gaseous product, i.e. hydrogen, is produced during
electrolysis, there is no necessity of putting any diaphragm or membrane between
Page 9
41
the cathode and the anode to prevent the gases from mixing with each other, which
is the case in water electrolysis. This not only can simplify the electrolyzer design
but can also reduce the ohmic resistance which would otherwise have been there
due to the presence of the diaphragm or membrane. Further, since there is
preferential movement of ions across the diaphragm or the membrane, in these
processes separate catholyte and anolyte circuits are to be maintained. Such a
necessity should not arise in the case of black liquor electrolysis.
Second, and more importantly, the alkali lignin separated at the anode is a
valuable product in itself. As shown in Table 4A.3, it has good calorific value to
be used as a fuel. Thus, when taken in conjunction with the hydrogen produced the
process can give more useful energy than the electrical energy spent in the process,
thereby significantly improving the economics of the process. In addition, the
separated lignin can also be used in several important industrial applications thus
adding to its technical and commercial value.
4A.3 HYDROGEN EVOLUTION REACTION
With the above initial findings, electrochemical experiments were
conducted to study the kinetic and mechanistic aspects of cathodic hydrogen
evolution reaction in black liquor electrolysis. Alkaline water electrolysis was also
studied as a reference system with control experiments carried with 0.1 M aqueous
solution of sodium hydroxide.
Cathodic hydrogen evolution reaction in alkaline water electrolysis follows
the reaction steps (Rosalbino et al., 2003; Wu et al., 2004; Rosalbino et al., 2005;
Kaninski et al., 2007)
Page 10
42
M + H2O + e– ↔ MHads + OH¯ (Volmer reaction step) {4A.3}
MHads + H2O + e– ↔ H2 + M + OH¯ (Heyrovsky reaction step) {4A.4}
MHads + MHads ↔ H2 + 2 M (Tafel reaction step) {4A.5}
With the overall reaction being
2 H2O + 2 e– ↔ H2 + 2 OH¯ {4A.6}
with an equilibrium potential (Eeq) , of – 1.07 V vs. SCE (Kreysa and Hakansson,
1986; Rosalbino et al., 2005; Bard and Faulkner, 2006). When black liquor is
subjected to electrolysis, hydrogen is produced at the cathode. A comparison of
cathodic hydrogen evolution in alkaline water electrolysis and black liquor
electrolysis is shown in Figure 4A.1 as steady state polarization plots. As
illustrated, the behaviour very closely fits the Tafel equation (Rosalbino et al.,
2005; Bard and Faulkner, 2006; Kaninski et al., 2007)
η = a + b log j = (2.3 RT/αnF) log j0 – (2.3 RT/αnF) log j (4A.7)
where,
j = current density
b = Tafel constant
η = overpotential
j0 = exchange current density
R = universal gas constant (8.314 kJ mol-1 K-1)
α = charge transfer coefficient
n = number of electrons exchanged
F = Faraday constant (96485 C mol-1)
Page 11
43
Figure 4A.1. Steady state polarization curves for hydrogen evolution reaction in alkaline water electrolysis and black liquor electrolysis
It is evident from Figure 4A.1 that the electrode processes are similar in
alkaline water electrolysis and black liquor electrolysis. In the high overpotential
range (η between –150 to – 400 mV), the polarization plots are linear. The
cathodic Tafel slopes are –112.8 mV dec-1, –116.9 mV dec-1, 137.9 mV dec-1, and
–135.3 mV dec-1 for alkaline water, wheat straw black liquor, bagasse black liquor
and eucalyptus black liquor, respectively. These values are in agreement with
those obtained for the hydrogen evolution reaction in alkaline water by other
investigators (Rosalbino et al., 2005; Jafarian et al., 2007; Kaninski et al., 2007)
and indicate the Volmer reaction step to be the rate determining step (Wu et al.,
2004; Metikos et al., 2006; Azizi et al., 2007; Kaninski et al., 2007). The
-500
-450
-400
-350
-300
-250
-200
-150
-100
-50
00.01 0.1 1 10 100
Log j (mA/cm2)
Ove
rpot
entia
l (m
V)Alkaline waterEucalyptusWheat strawBagasse
0.01 0.1 1 10 100
Page 12
44
corresponding values for the exchange current densities are 1.075 mA/cm2, 2.194
mA/cm2, 1.585 mA/cm2 and 9.856 mA/cm2, respectively. Since the exchange
current density is a measure of the kinetic facility of the electrode process (Bard
AJ, Faulkner, 2006), the results suggest facile electrode kinetics for hydrogen
evolution reaction in black liquor electrolysis compared to alkaline water
electrolysis.
At low overpotential, the η ― log j plots (Figure 4A.1) show appreciable
deviation from linearity with decreasing Tafel slopes. This indicates that the
overall process is no longer limited by the Volmer reaction step, at low
overpotentials (Kaninski et al., 2007; Shervedani and Madram, 2007).
Figure 4A.2. j – η plots at low overpotential for hydrogen evolution reaction in alkaline water electrolysis and black liquor electrolysis
-70-60-50-40-30-20-100
Overpotential (mV)
Alkaline water
Wheat straw
Eucalyptus
0
0.5
1
1.5
2
2.5
3
BagasseCur
rent
den
sity
(mA
/cm
2 )
Page 13
45
At low overpotential, the bevaiour is better represented by linear j ― η plots
(Figure 4A.2). Significantly, this Figure reveals that alkaline water electrolysis
requires much higher overpotential (41.8 mV) before noticeable hydrogen
evolution reaction (as shown by a cathodic current) can actually commence. In
comparison, for black liquor electrolysis, these overpotentials are much lower,
being 17.9 mV for wheat straw black liquor, 13.9 mV for bagasse black liquor and
0 mV for eucalyptus black liquor. This observation is consistent with the
preliminary findings.
Page 14
46
*Chapter 4B
Anodic counter reactions
4B.1 BACKGROUND
A complete electrochemical cell would consist of two electrodes, a cathode
and an anode. The complete cell reaction, thus, has two components, the cathodic
half reaction and its anodic counterpart. In electrolytic hydrogen production in
alkaline media, water is reduced to hydrogen and hydroxyl ions at the cathode as
represented in reaction {4A.6}. Actual half reaction taking place at the anode,
however, would depend on the composition of the electrolyte and the potential
employed. Thus in water electrolysis hydroxyl ions are oxidized to oxygen and
water according to the reaction steps
2 OH¯ → H2O + O2 + ׃ e¯ {4B.1a}
2 O׃ → O2 {4B.1b}
Overall,
4 OH¯ → 2H2O + O2 + 4 e¯ {4B.1}
Similarly, in brine electrolysis, the anodic counter reaction is
2 Cl¯ ↔ Cl2 + 2 e– {4B.2}
The minimum interelectrode potential to be applied to an electrochemical
cell would be
Emin = Eeq(cathode) + Eeq(anode) (4B.1)
where,
Emin = Minimum interelectrode potential required
* Parts of this chapter have been published in International Journal of Hydrogen Energy
Page 15
47
Eeq(cathode) = Equilibrium potential for cathodic half reaction
Eeq(anode) = Equilibrium potential for anodic half reaction
As discussed in Chapter 4A, however, at this minimum interelectrode potential,
the forward and the backward reactions would be proceeding at the same rate with
no net overall electrolysis reaction. The actual interelectrode potential to be
applied for a given overall rate of electrolysis, therefore, would include other
potential terms as given below
Eappl = Eeq(cathode) + η(cathode) + Eeq(anode) + η(anode) + Eohmic (4B.2)
where,
Eappl = Actual interelectrode potential applied
η(cathode) = overpotential at cathode
η(anode) = overpotential at anode
Eohmic = Potential drop due to resistance offered by various components of the cell
In equation (4B.2), the term, Eeq(anode), would depend on the anodic counter
reaction. It is clear that the half reaction at the anode and the equilibrium potential
associated with it, has a role to play in determining the required cell voltage. It
would, therefore, influence the energy dynamics of the process and mandates
investigation.
4B.1.1 Electrochemical techniques
The complete electrochemical behaviour of a system can be obtained
through a series of steps to different potentials with the recording of the current
time curves, to yield a three dimensional i-t-E surface. However, potential steps
that are very closely spaced are needed for well resolved i-E curves. Alternatively,
Page 16
48
more information can be gained in a single experiment of Linear Sweep
Voltammetry, wherein the electrode potential is linearly varied with time and the i-
E curve is directly recorded. This amounts, in a qualitative way, to traversing the
three dimensional i-t-E realms. For a single electrode reaction the observation is a
peaked current-potential curve.
When the potential scan is reversed at a certain potential, we have the
equivalent of double potential step chronoamperometry. This technique, called the
Cyclic Voltammetry, is a powerful tool for initial electrochemical studies of new
systems. It is also useful in obtaining information about fairly complicated
electrode reactions. Crucial insights about the electrode charge transfer process is
revealed by the analysis of the shape of the current-potential response, the peak
positions and the peak currents.
In square wave voltammetry, the electrode is taken through a series of
measurement cycles. Over many cycles, the waveform is a bipolar square wave
superimposed on a background potential staircase. Current samples are taken twice
per cycle, at the end of each pulse. Consequently, the result of single square wave
voltammetry run is three voltammograms showing forward, reverse, and difference
currents against the potential on the corresponding background potential staircase.
Square wave voltammetry provides exceptional versatility. Square-wave
voltammetry has several advantages. Among these are its excellent sensitivity and
the rejection of background currents, along with speed of experimentation.
Page 17
49
4B.2 EARLY FINDINGS
As reported in Chapter 4A, the distinguishing feature of black liquor
electrolysis was that negligible gaseous products are produced at the anode.
Instead, alkali lignin was separated, and deposited as particulate solids, at the
anode to the tune of about 28 – 46 mg/mg of hydrogen produced. Almost complete
absence of gaseous products at anode indicates either a totally different half
reaction or other secondary reactions. If reaction {4B.1} is the half reaction taking
place at anode then the oxygen produced should be obtained as gaseous product
irrespective of the presence of black liquor solids. But this is not the case. One of
the possibilities is that the oxygen produced is consumed in secondary reactions
involving the organic constituents of black liquor. The atomic oxygen produced in
the reaction step {4B.1a} then has a competing reaction pathway in addition to the
reaction step {4B.1b} which can be schematically denoted as
Organics + O׃ → products {4B.3}
Molecular oxygen produced as result of the reaction step {4B.1b} may also react
with black liquor organics albeit at a much slower rate as compared to reaction
{4B.3}. Atomic oxygen is well known for its very high reactivity owing to its two
unpaired electrons. At any point of time the amount of molecular oxygen produced
will depend on the relative rates of the reactions {4B.1b} and {4B.3}; higher the
rate of reaction {4B.3} compared to reaction {4B.1b} lower will be the amount of
molecular oxygen produced.
There is another possibility which can account for the negligible gaseous
products at anode. Alkaline pulping of lignocelluloses is known to follow an ionic
Page 18
50
reaction pathway (Clayton et al., 1983) resulting in organic anions (Rojas and
Salager, 1994). Anions present in the black liquor are mainly lignin degradation
products resulting from the reaction of native lignin with alkali during alkaline
pulping (Clayton et al., 1983; Sjostrom, 1993; Vu et al., 2003). Therefore, in black
liquor, organic anions are also present besides OH¯ ions and the possibility of
some of them being electroactive cannot be ruled out.
From the results of Table 4A.3, it may be argued that the amount of alkali
lignin separated in different experimental runs, are not in the same mass ratio with
the amount of hydrogen produced. This can be due to two reasons. One, the alkali
lignin in black liquor is a polydisperse substance resulting from the alkaline
depolymerization of native lignin which itself differs in its chemical structure in
different species of raw material as well as within the same raw material
(Sjostrom, 1993). Further the extent of alkaline depolymerization is dependent on
the reaction conditions prevailing during pulping (Clayton et al., 1983). Thus, in
different samples of black liquor, the ionic fragments of alkali lignin will have
different charge to mass ratio. Since, from the Faraday’s law of electrolysis the
amount of any chemical species deposited for a given amount of electrical charge
passed during electrolysis is dependent on the charge to mass ratio of the ionic
species, the amount of alkali lignin separated for a given amount of hydrogen
produced should be different in different electrolysis experiments.
The second reason might be the presence of OH¯ ions, though in small
concentration, in black liquor. Thus, during electrolysis, a small proportion of the
total charge carried by the anions will be actually carried by OH¯ ions. Different
Page 19
51
hydroxyl ion concentration in different black liquor samples, therefore, will carry
different proportions of the total charge carried by the anions. This will also alter
the amount of alkali lignin separated for a given amount of hydrogen produced for
different black liquor samples.
With this preliminary understanding, the anodic counter reactions in black
liquor electrolysis were studied with standard electrochemical techniques and the
results are presented below.
4B.3 ANODIC COUNTER REACTIONS IN BLACK LIQUOR
ELECTROLYSIS
4B.3.1 Linear Sweep Voltammetry
In alkaline water electrolysis, the anodic reaction at the counter electrode is
the oxygen evolution reaction (OER) (Plata-Torres et al., 2007), as given in
reaction {4B.1}. This reaction has an equilibrium potential of 0.16 V vs. SCE
(Bard and Faulkner, 2006). The significance of this reaction is that for hydrogen
production by alkaline water electrolysis, a minimum of 1.23 V inter-electrode
potential is required even if all activation overpotentials (cathodic as well as
anodic) are neglected. In practice, the inter-electrode potential exceeds this
minimum value by the sum of cathodic and anodic overpotentials required to drive
the reactions at an accepted rate.
Figure 4B.1 is the current – potential response of linear sweep voltammetry
(LSV) obtained for the anodic activity in alkaline water electrolysis as compared
to black liquor electrolysis. For all the electrolytes, noticeable OER could be
Page 20
52
Figure 4B.1. Linear sweep voltammograms of anodic electroactivity in alkaline water electrolysis and black liquor electrolysis
observed at an overpotential (Eappl – Eeq) in excess of 600 mV. As expected, in the
absence of any electroactive anion other than OH¯, OER is the only anodic
electroactivity observed in the case of alkaline water electrolysis. In all black
liquor electrolysis, wheat straw, bagasse, and eucalyptus, however, strong anodic
elctroactivity is noticed in a potential window of –0.2 V to 0.2 V, well shifted
from the OER region. In soda black liquor extracted from laboratory pulping
experiments, the only inorganic anion present will be OH¯. The additional anodic
0
2
4
6
8
10
12
-1.5 -1 -0.5 0 0.5 1 1.5 2
E (V)
Cur
rent
den
sity
(mA
/cm
2)
EucalyptusWheat strawAlkaline waterBagasse
Page 21
53
electroactivity in black liquor electrolysis, thus, arises from some of the organic
anions present in black liquor. Black liquors from the alkaline pulping of
lignocelluloses are known to have organic anions, as already reported. This is
consistent with the preliminary findings that organics are electrodeposited on the
anode during black liquor electrolysis.
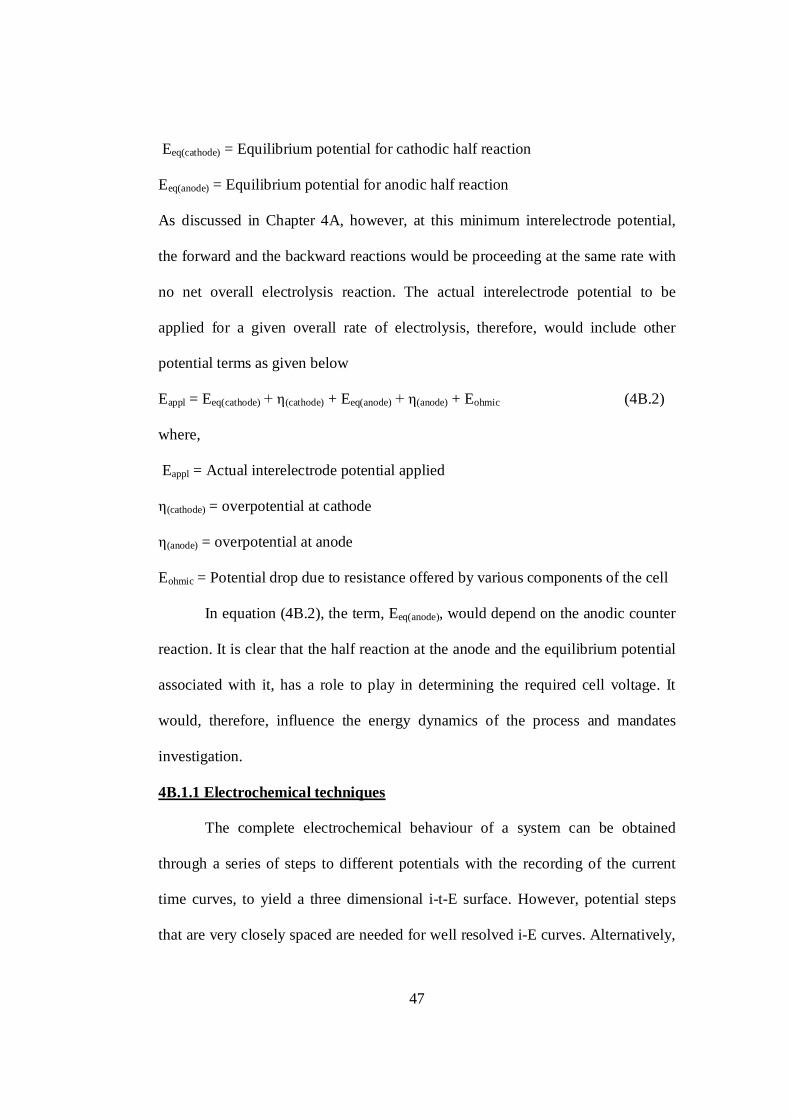
4B.3.2 Cyclic Voltammetry
The additional anodic electroactivity in black liquor electrolysis was
examined using cyclic voltammetry (CV) and the results are shown in Figures
4B.2, 4B.3, and 4B.4 for wheat straw black liquor, bagasse black liquor, and
eucalyptus black liquor, respectively, using scan rates of 20 mV/s and 40 mV/s.
Figure 4B.2. Cyclic voltammograms of anodic electroactivity in electrolysis of wheat straw black liquor
-0.5
0
0.5
1
1.5
2
2.5
3
-0.8 -0.6 -0.4 -0.2 0 0.2 0.4
E (V)
Cur
rent
den
sity
(mA
/cm
2)
20 mV/s40 mV/s
Page 22
54
Figure 4B.3. Cyclic voltammograms of anodic electroactivity in electrolysis of bagasse black liquor
Figure 4B.4. Cyclic voltammograms of anodic electroactivity in electrolysis of eucalyptus black liquor
-0.5
0
0.5
1
1.5
2
2.5
3
-0.8 -0.6 -0.4 -0.2 0 0.2 0.4
E (V)
Cur
rent
den
sity
(mA
/cm
2)
20 mV/s40 mV/s
-1
0
1
2
3
4
5
6
-0.8 -0.6 -0.4 -0.2 0 0.2 0.4
E (V)
Cur
rent
den
sity
(mA
/cm
2)
20 mV/s40 mV/s
Page 23
55
In all the voltammograms, no cathodic peak was noticed on the reverse run
of the potential scan, suggesting sluggish electron transfer kinetics (Bard and
Faulkner, 2006). For the wheat straw black liquor, the anodic peak shifted to –
15.1 mV from – 36.8 mV upon increase in the scan rate from 20 mV/s to 40 mV/s.
Similar shifts from – 56.7 mV to – 32.9 mV, for bagasse black liquor, and from –
77.7 mV to – 66.3 mV, for eucalyptus black liquor, was observed with the increase
in scan rate. This shift in the anodic peak towards more positive potentials upon
increase in the potential scan rate also supports totally irreversible charge transfer
(Nicholson and Shain, 1964; Bard and Faulkner, 2006). Using the relationship
(Nicholson and Shain, 1964; Bard and Faulkner, 2006)
| Ep – Ep/2 | = 1.857 RT/αnF
Where,
Ep = potential at which the current is at its peak value (mV)
Ep/2 = potential at which the current is half the peak value (mV)
the value of αn is found to be 0.528, 0.507, and 0.564 for wheat straw black liquor,
bagasse black liquor, and eucalyptus black liquor, respectively. For most of the
charge transfer processes, including organic moieties, the value of α is close to 0.5
(O’Dea et al., 1993; Codognoto et al., 2002). Since the value of n can only be a
positive integer, these results suggest a one electron oxidative charge transfer.
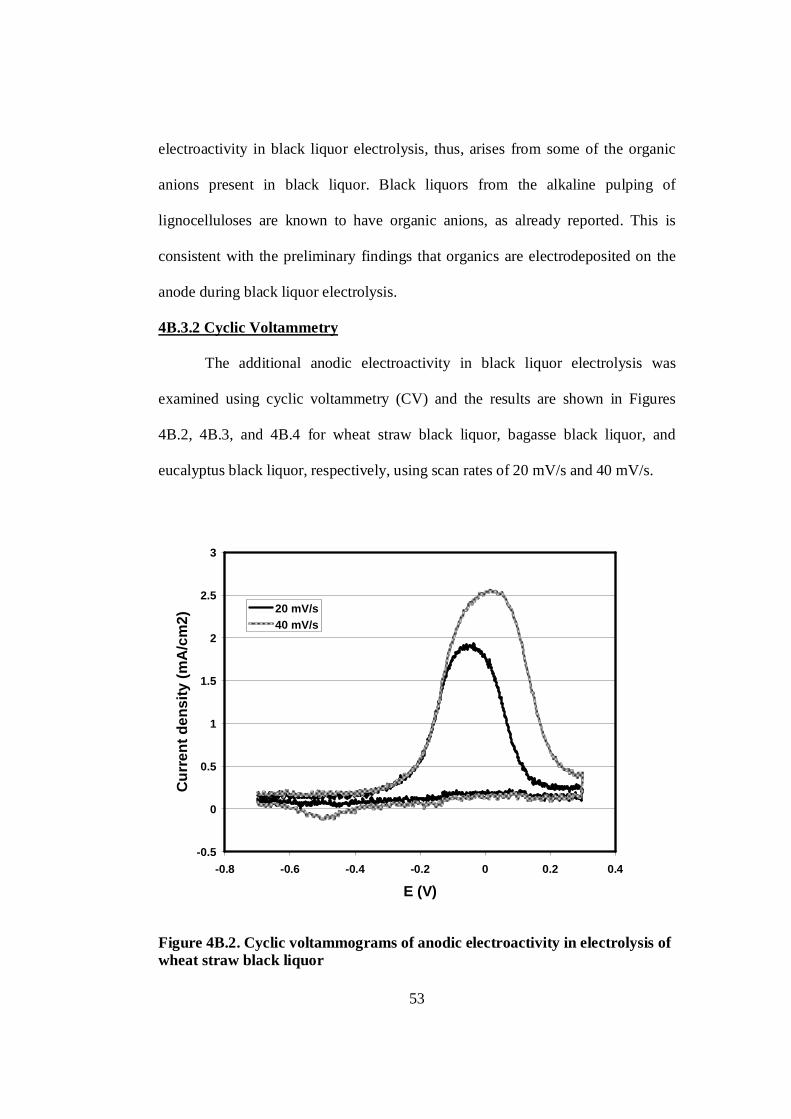
4B.3.3 Square Wave Voltammetry
Figures 4B.5, 4B.6, and 4B.7 are the square wave voltammetry (SWV)
responses of black liquor electrolysis for wheat straw black liquor, bagasse black
Page 24
56
Figure 4B.5. Square wave voltammograms of anodic electroactivity in electrolysis of wheat straw black liquor
Figure 4B.6. Square wave voltammograms of anodic electroactivity in electrolysis of bagasse black liquor
-50
0
50
100
150
200
250
-600 -400 -200 0 200 400 600E (mV)
Cur
rent
den
sity
(μA
/cm
2)
DifferenceForwardReverse
-50
0
50
100
150
200
250
-600 -400 -200 0 200 400 600
E (mV)
Cur
rent
den
sity
(uA
/cm
2)
differenceforwardreverse
Page 25
57
Figure 4B.7. Square wave voltammograms of anodic electroactivity in electrolysis of eucalyptus black liquor
liquor, and eucalyptus black liquor, scanning a potential window from – 0.5 V to
0.5 V. The irreversibility of the oxidative electron transfer was again obvious from
the absence of cathodic peak in the reverse current voltammograms. From the
theory of square wave voltammetry (Nuwer, 1991; Fatouros and Krulic, 1998;
Miles and Compton, 2000) for such systems, involving one electron oxidative
charge transfer:
α = 1.66 RT/WF
where, W is the half width on the negative side of the difference current
voltammogram at mid height with respect to the peak potential. Accordingly, the
value of α was found to be 0.568, 0.519, and 0.508 for wheat straw black liquor,
-5
0
5
10
15
20
25
30
-600 -400 -200 0 200 400 600
E (mV)
Cur
rent
den
sity
(μA
/cm
2)
DifferenceForwardReverse
Page 26
58
bagasse black liquor, and eucalyptus black liquor, respectively. These values are in
close agreement with those obtained from cyclic voltammetry. Also, in the case of
bagasse, and eucalyptus black liquors, it is important to note that the square wave
voltammetry response consists of several minor current peaks, which suggest that
the electrode process in these cases might be a combination of several elementary
steps. Such splitting of the voltammetric response in square wave voltammetry for
organic moieties is not unusual, going by the inherently high sensitivity of the
technique (O'Dea et al., 1993; Mirceski et al., 1997; Diaz et al., 2000; Mirceski et
al., 2000).
Mechanistic details notwithstanding, this anodic electroactivity in black
liquor electrolysis has important ramifications for hydrogen production. For
irreversible electrode kinetics, the position of the current peak in square wave
voltammetry is shifted from the formal potential, E1/2. For oxidative charge
transfer, the peak potential, Ep, should be at a more positive potential than E1/2
(O'Dea et al., 1981). The magnitude of this shift, Ep – E1/2, varies almost linearly
with log (κτ1/2) (O'Dea et al., 1981). Here, κ is the kinetic parameter given by
κ = k0/DOα/2DR
(1-α)/2
and τ is the period of the square wave voltammetry signal, for the general scheme
of reaction
R → O + e–
k0 is the standard rate constant and DO and DR are the diffusivities. In the absence
of the value of κ for the system under study, a precise determination of Ep – E1/2 is
not possible from the SWV peak positions. However, these values are expected to
Page 27
59
be in the range of 100 – 300 mV (O'Dea et al., 1981). Thus, from Figures 4B.5,
4B.6, and 4B.7, it follows that E1/2 is between – 0.24 V to – 0.44 for the anodic
counter reaction in the electrolysis of wheat straw black liquor. It should be
between – 0.31 V to – 0.51 V for bagasse black liquor, and – 0.27 V to – 0.47 V
for eucalyptus black liquor. Therefore, by black liquor electrolysis, it should be
possible to produce hydrogen with an inter-electrode potential between 0.8 V to
0.6 V compared to 1.23 V for alkaline water electrolysis. This agrees with the
preliminary findings, reported in Chapter 4A, that hydrogen could be produced at
lower inter-electrode potential in black liquor electrolysis, compared to water
electrolysis. This can have significant bearing on the energy efficiency of
electrolytic hydrogen production as the amount of hydrogen produced per unit
electrical energy spent, and, therefore, the energy efficiency is inversely
proportional to the inter-electrode potential (Ulleberg, 2003).
It is also imperative to note that carrying out the electrolysis at a lower
inter-electrode potential would exclude the OER. This is consistent with the
previous observation that no gaseous products are formed at the anode in black
liquor electrolysis. In water electrolysis, a membrane or a diaphragm is needed as a
physical barrier between the cathode and the anode to prevent the two gaseous
products from mixing with each other. Therefore, in black liquor electrolysis it
should be possible to do away with the inter-electrode membrane or diaphragm,
thereby lowering the ohmic losses. This in turn should result in further increase in
the energy efficiency of the process. One could argue that with the exclusion of
OER the process would only have a small anodic current density as apparent from
Page 28
60
Figures 4B.1 to 4B.4. This would require larger electrode surface area for the same
production rate, thus additional fixed cost. This can be partly offset by improved
cell and electrode designs, as practiced in modern electrolyzers. However, the
benefits of reduced energy consumption should far outweigh the added fixed costs
as electrical energy consumption constitutes the major part of electrolytic
hydrogen production cost.
Page 29
61
*Chapter 4C
Lignin characterization
4C.1 BACKGROUND
In chapters 4A and 4B it has been emphasized that one of the
distinguishing features of black liquor electrolysis is the electrodeposition of lignin
at the anode. Therefore, any conceivable commercial application of black liquor
electrolysis would depend on the economic value of lignin.
Currently, much of the lignin produced by the paper industry is consumed
as a fuel to meet the in-house energy demand. However, there is increasing trend
in the mills worldwide to decrease energy consumption through various energy
saving measures. Consequently, a part of the lignin may not be needed in-house
and could be sold. In small mills, without a chemical recovery system in place, any
lignin separated from black liquor should be a product in hand. The most apparent
use for this lignin would be as a biofuel. However, as illustrated in chapter 2,
lignin has the potential to be used as a renewable source of various chemical
feedstocks.
Lignin is a generic name, wherein the chemical nature and related
characteristics depend, not only on its biological origin, but also profoundly on its
method of isolation. In fact, no method of isolation gives a highly representative
and totally unaltered native lignin. Lignins are heterogeneous in relation to the
presence of functional groups and type of bonds between functional units. Once
separated from black liquor, with its characteristics known, lignin can possibly be
* Part of this paper has been published in Industrial Crops and products. Another part is accepted for publication in Thermochimica Acta.
Page 30
62
put to industrial applications besides its traditional use as a biofuel. Presently, Acid
precipitation is the most common method to recover lignin from black liquor.
Electrodeposition on anode during electrolysis of black liquor presents a new
isolation method. Characterization of electrodeposited lignin, and its comparison
with that separated through acid precipitation, therefore, merits investigation.
Spectroscopic methods have been widely used in the characterization of
lignin. Compared to degradative wet chemistry techniques, these methods can
provide the analysis of the whole lignin structure and direct detection of lignin
moieties. In particular, the advent of NMR techniques has extended the prospect of
lignin structural analysis considerably. 13C NMR spectroscopy has been shown to
be of significant potential in providing detailed structural information for lignins,
mainly due to its significantly larger chemical shift dispersion.
Lignin is able to give a large amount of char when heated at high
temperature in an inert atmosphere. Owing to its high carbon content, lignin can be
a good precursor material for preparing carbon products, like fibers and films.
Here also, different lignins would behave differently and thermochemical analysis
of a lignin formulation is important to ascertain its suitability for thermal
degradation.
4C.2 SPECTROSCOPIC CHARACTERIZATION
Electrodeposited lignins and acid precipitated lignins were obtained from
black liquor samples as outlined in chapter 3. For these studies, soda black liquor
of wheat straw and bagasse were obtained from different mills while eucalyptus
Page 31
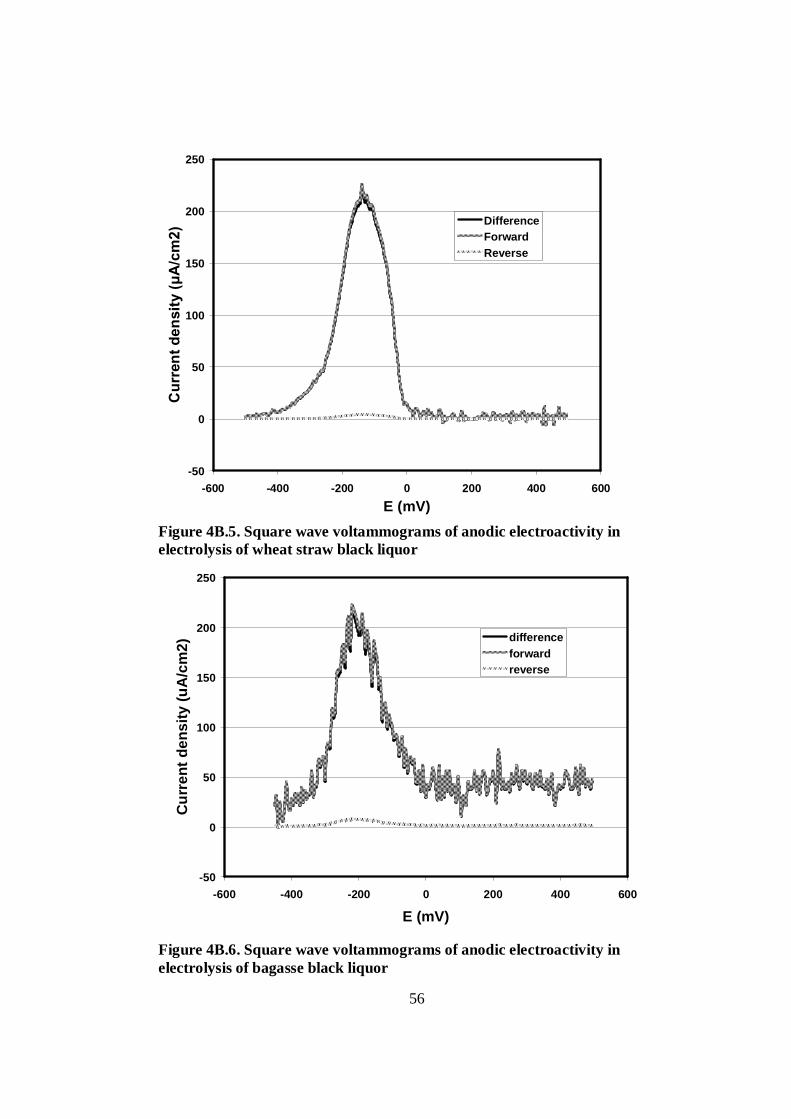
63
chips were pulped in the laboratory. Initial characteristics of the black liquors are
shown in Table 4C.1.
Table 4C.1 Initial characteristics of black liquor
Total dissolved
solids (%) Organic/inorganic
ratio pH
Wheat straw 6.03 Organics 53.76% Inorganics 46.24%
11.9
Bagasse 6.18 Organics 54.19% Inorganics 45.81%
11.7
Eucalyptus 7.92 Organics 57.52% Inorganics 42.48%
12.2
4C.2.1 Fourier Transform Infrared spectra
4C.2.1.1 Acid Precipitated Lignin
Figures 4C.1, 4C.2, and 4C.3 show the IR spectra of black liquor organics
separated by acidification of wheat straw black liquor, bagasse black liquor, and
eucalyptus black liquor. These contain most of the characteristic absorption bands
of such organics and assigned accordingly (Thring et al. 1991; Sun et al. 2000; Sun
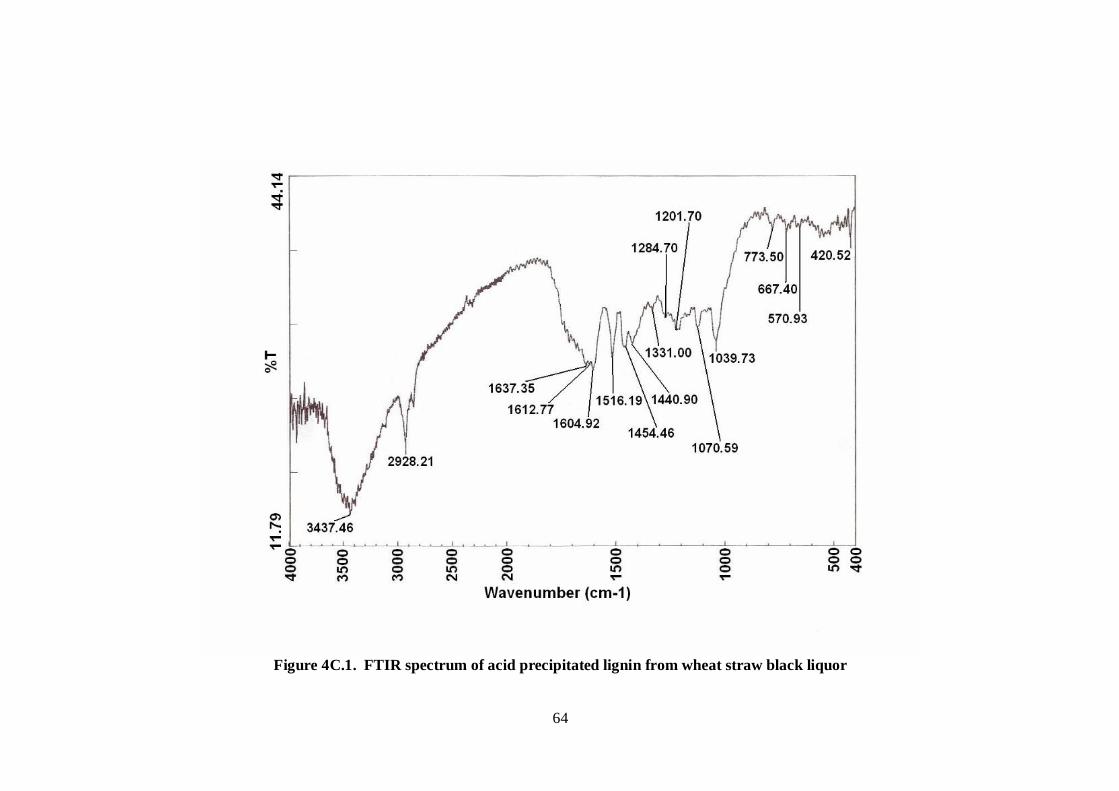
and Tomkinson 2002; Angles et al. 2003). Prominent among these are 3437 cm-1
(wheat straw), 3397 cm-1 (bagasse), and 3393 cm-1 (eucalyptus), assigned to O–H
stretching of hydroxyl, 2928 cm-1 (wheat straw), 2931 cm-1 (bagasse), and 2934
cm-1 (eucalyptus), assigned to C–H stretching in methyl and methylene groups,
1637 cm-1, 1604 cm-1, 1516 cm-1 (wheat straw), 1600 cm-1, 1509 cm-1 (bagasse),
1598 cm-1, 1509 cm-1 (eucalyptus), assigned to aromatic skeletal vibrations, 1454
cm-1 (wheat straw), 1458 cm-1 (bagasse), 1459 cm-1 (eucalyptus), assigned to C –
H deformations and aromatic ring vibrations, 1440 cm-1 (wheat straw), 1417 cm-1
(bagasse), 1421 cm-1 (eucalyptus), assigned to aromatic skeletal vibrations, 1331
Page 32
64
Figure 4C.1. FTIR spectrum of acid precipitated lignin from wheat straw black liquor
Page 33
65
Figure 4C.2. FTIR spectrum of acid precipitated lignin from bagasse black liquor
Page 34
66
Figure 4C.3. FTIR spectrum of acid precipitated lignin from eucalyptus black liquor
Page 35
67
cm-1 (wheat straw), 1339 cm-1 (eucalyptus), assigned to syringyl ring breathing with CO stretching,
1284 cm-1 (wheat straw), 1278 cm-1 (bagasse), 1266 cm-1 (eucalyptus), assigned to guaiacyl ring
breathing with C–O stretching, and 1039 cm-1 (wheat straw, and eucalyptus), 1022 cm-1 (bagasse),
assigned to aromatic C–H guaiacyl type and C–H deformation of primary alcohol. Acid precipitated
lignin from bagasse had a unique band at 1703 cm-1 (assigned to unconjugated carboxyl–carbonyl
stretching) which is absent in other lignin formulations. Besides these there are few other bands
which could be assigned as under. 1201 cm-1 (wheat straw), 1216 cm-1 (bagasse) and 1221 cm-1
(eucalyptus) assigned to C–C, C–O, and C=O stretching (Scholze and Meier, 2001; Zhao and Liu,
2010). 1070 cm-1 (wheat straw) from C3 ̶ OH valence vibration (Fackler et.al., 2010; Yang et.al.,
2010). 1119 cm-1 (bagasse and eucalyptus) assigned to C−O stretching and symmetric stretching of
C–O–C (Zhao and Liu, 2010). 949 cm-1 (bagasse) arising from C–H deformation in degraded
carbohydrates (Yang et.al., 2010). 829 cm-1 (bagasse) and 833 cm-1 (eucalyptus) from C–H out of
plane deformation in position 2,5,6 of guaiacol (Scholze and Meier, 2001; Fackler et.al., 2010).
Bands between 586-726 in different samples could be generally assigned to lateral C–C bond and the
648 cm-1 band in eucalyptus probably arises from carboxylic groups (Liu et.al., 2008).
4C.2.1.2 Electrodeposited Lignin
In contrast, if we look at the IR spectra of solids deposited on the anode during electrolysis
(Figure 4C.4 for wheat straw, 4C.5 for bagasse, and 4C.6 for eucalyptus), it is obvious that these
spectra are similar to that of Figures 4C.1 to 4C.3 in the high frequency region (4000 – 2200 cm-1)
showing characteristic absorption of O–H stretching of hydroxyl (3450 cm-1 for wheat straw, 3406
cm-1 for bagasse, 3393 cm-1 for eucalyptus), and C–H stretching of methyl and methylene groups
(2924 cm-1 for wheat straw, 2933 cm-1 for bagasse, 2930 cm-1 for eucalyptus). However, the
absorption band of O–H stretching of hydroxyl is shifted to higher frequency in electrodeposited
solids for wheat straw and bagasse.
In wheat straw the frequencies 1637 cm-1, 1510 cm-1 (assigned to aromatic skeletal
vibrations) and 1460 cm-1 (assigned to CH deformations and aromatic ring
Page 36
68
Figure 4C.4. FTIR spectrum of electrodeposited lignin from wheat straw black liquor
Page 37
69
Figure 4C.5. FTIR spectrum of electrodeposited lignin from bagasse black liquor
Page 38
70
Figure 4C.6. FTIR spectrum of electrodeposited lignin from eucalyptus black liquor
Page 39
71
vibrations) are also similar. However, the similarity ends here and the spectrum of
Figure 4C.4 is markedly different from that of Figure 4C.1 in the intermediate and
low frequency regions. Notable differences are as follows: The frequencies 1612
cm-1 and 1604 cm-1 (aromatic skeletal vibrations) are absent. In Figure 4C.4 the
frequencies 1423 cm-1, and 1222 cm-1 can be assigned to aromatic skeletal
vibrations, and ring breathing with CO stretching, respectively. Other frequencies
present are 794 cm-1 and 466 cm-1 in Figure 4C.4.
Similar comparisons could also be made for bagasse and eucalyptus. In
Figure 4C.5 (bagasse) the important frequencies similar to Figure 4C.2 are 1604
cm-1, 1512 cm-1 (assigned to aromatic skeletal vibrations), 1458 cm-1 (assigned to
CH deformations and aromatic ring vibrations), 1413 cm-1 (assigned to aromatic
skeletal vibrations). Major dissimilarities are the absence of absorption bands at
1703 cm-1 (unconjugated carboxyl–carbonyl stretching), and 1278 cm-1 (guaiacyl
ring breathing with C–O stretching), and the presence of frequency 1325 cm-1
(syringyl ring breathing with CO stretching). In Figure 4C.6 (eucalyptus)
important similarities with Figure 4C.3 are the absorption bands 1602 cm-1, 1511
cm-1 (aromatic skeletal vibrations), 1458 cm-1 (CH deformations and aromatic ring
vibrations). Significant differences are the absence of frequencies 1421 cm-1
(aromatic skeletal vibrations), 1339 cm-1 (syringyl ring breathing with CO
stretching), and 1266 cm-1 (guaiacyl ring breathing with C–O stretching). Rather
the band assigned to syringyl ring breathing with CO stretching is shifted to 1322
cm-1 in the spectrum of electrodeposited solids.
Page 40
72
In all the FTIR spectra, detailed interpretation of the bands between 1400
and 1000 cm-1 is difficult since the variations in different modes couple and
therefore make the contribution to the different absorption bands more complex.
Nevertheless, it can be inferred from the above comparison that the
electrodeposited solids are chemically different from the acid precipitated solids,
especially in their aromatic part. Also, for wheat straw and bagasse the inter and/or
intra molecular hydrogen bonding environment differs in the electrodeposited
solids compared to the acid precipitated solids, manifested by shift in O – H
stretching frequency (Silverstein and Webster 2003).
4C.2.2 1H NMR spectra
Integration of the 1H-NMR regions, rather than the individually resolved
peaks, has long been applied to estimate the different structural features in lignin
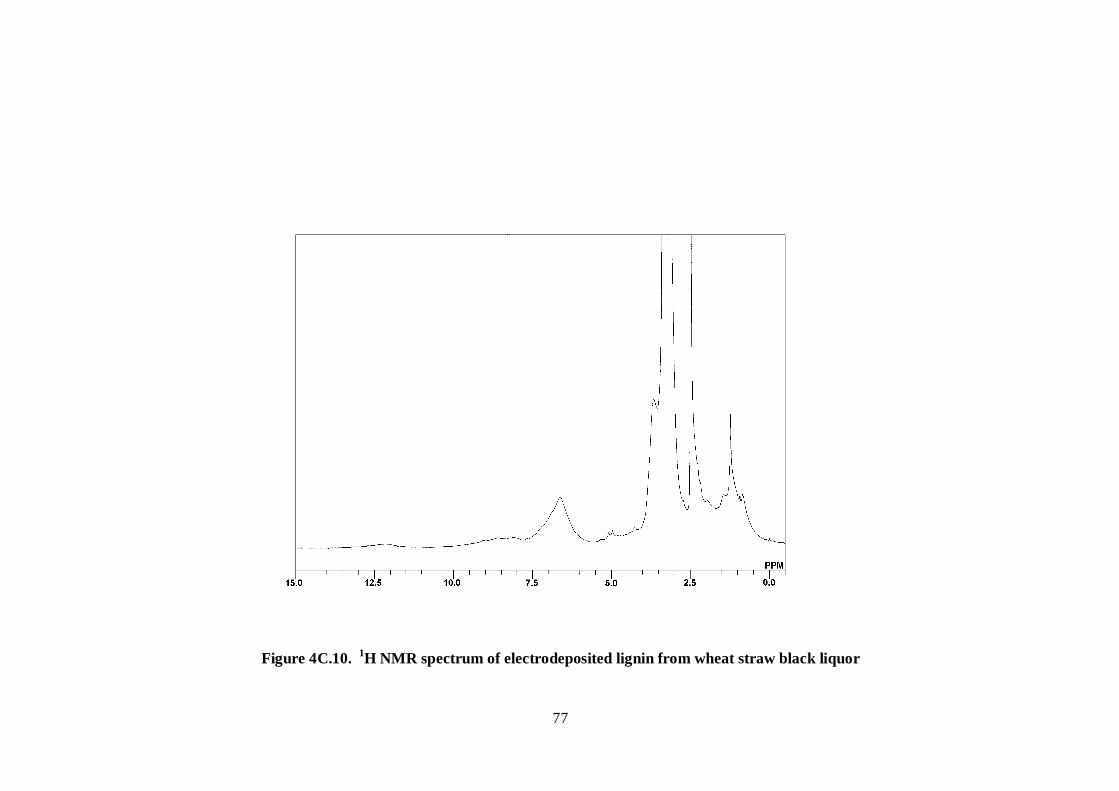
formulations (Goncalves et al. 2000; Guerra et al., 2004). The 1H-NMR spectra of
wheat straw lignin, bagasse lignin, and eucalyptus lignin are shown in Figures
4C.7, 4C.8, and 4C.9 (acid precipitated lignin) and Figures 4C.10, 4C.11, and
4C.12 (electrodeposited lignin), respectively. Table 4C.2 shows the hydrogen
signal integrations subdivided into different structural regions (Ragauskas et al.
1999; Goncalves et al. 2000; Guerra et al., 2004; Hiltunen et al. 2006). This
enables us to compare the 1H NMR spectrum of organics separated by
acidification to that of solids separated by electrolysis. From the elemental analysis
of the samples (Table 4C.3), these are assigned empirical formulae as presented in
Table 4C.4.
Page 41
73
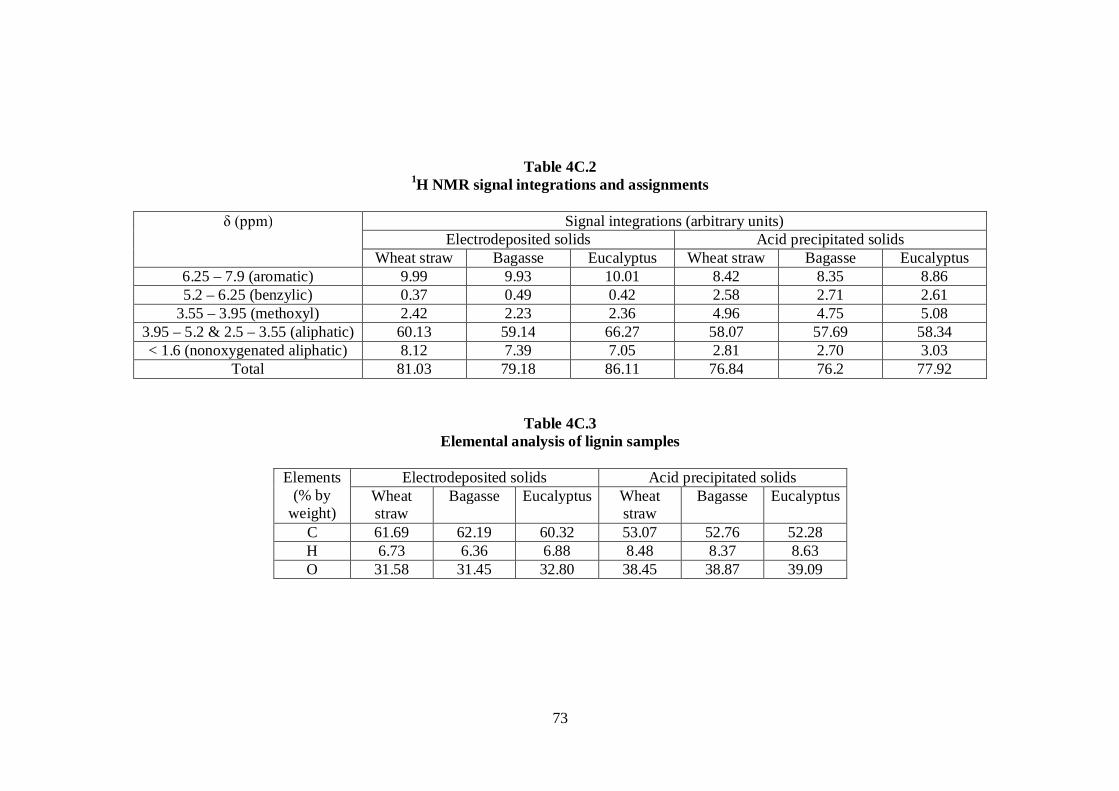
Table 4C.2 1H NMR signal integrations and assignments
δ (ppm) Signal integrations (arbitrary units)
Electrodeposited solids Acid precipitated solids Wheat straw Bagasse Eucalyptus Wheat straw Bagasse Eucalyptus
6.25 – 7.9 (aromatic) 9.99 9.93 10.01 8.42 8.35 8.86 5.2 – 6.25 (benzylic) 0.37 0.49 0.42 2.58 2.71 2.61
3.55 – 3.95 (methoxyl) 2.42 2.23 2.36 4.96 4.75 5.08 3.95 – 5.2 & 2.5 – 3.55 (aliphatic) 60.13 59.14 66.27 58.07 57.69 58.34 < 1.6 (nonoxygenated aliphatic) 8.12 7.39 7.05 2.81 2.70 3.03
Total 81.03 79.18 86.11 76.84 76.2 77.92
Table 4C.3 Elemental analysis of lignin samples
Elements
(% by weight)
Electrodeposited solids Acid precipitated solids Wheat straw
Bagasse Eucalyptus Wheat straw
Bagasse Eucalyptus
C 61.69 62.19 60.32 53.07 52.76 52.28 H 6.73 6.36 6.88 8.48 8.37 8.63 O 31.58 31.45 32.80 38.45 38.87 39.09
Page 42
74
Figure 4C.7. 1H NMR spectrum of acid precipitated lignin from wheat straw black liquor
Page 43
75
Figure 4C.8. 1H NMR spectrum of acid precipitated lignin from bagasse black liquor
Page 44
76
Figure 4C.9. 1H NMR spectrum of acid precipitated lignin from eucalyptus black liquor
Page 45
77
Figure 4C.10. 1H NMR spectrum of electrodeposited lignin from wheat straw black liquor
Page 46
78
Figure 4C.11. 1H NMR spectrum of electrodeposited lignin from bagasse black liquor
Page 47
79
Figure 4C.12. 1H NMR spectrum of electrodeposited lignin from eucalyptus black liquor
Page 48
80
Table 4C.4 (A) Formula for Electrodeposited Lignin samples
Wheat straw Bagasse Eucalyptus
Empirical formula C5.14H6.73O1.97 C5.18H6.36O1.97 C5.03H6.88O2.05 C9 formula C9H11.59O3.37(OCH3)0.12 C9H10.86O3.36(OCH3)0.11 C9H12.11O3.6(OCH3)0.11
Table 4C.4 (B) Formula for Acid Precipitated Lignin samples
Wheat straw Bagasse Eucalyptus
Empirical formula C4.42H8.48O2.4 C4.4H8.37O2.43 C4.36H8.63O2.44 C9 formula C9H16.83O4.71(OCH3)0.38 C9H16.7O4.81(OCH3)0.36 C9H17.42O4.86(OCH3)0.41
Page 49
81
Subsequently, the customary C9 lignin formulae are worked out (Table 4C.4)
taking into account the total signal integrations for all protons, and those
corresponding to methoxyl group. For example, wheat straw electrodeposited
lignin could be represented by an empirical formula, C5.14H6.73O1.97. From Table
4C.2, an area of 81.03 arbitrary units corresponds to 6.73 hydrogen atoms in the
empirical formula. The area representing methoxyl group is 2.42 units which
would be equivalent to 0.2 hydrogen atoms in the empirical formula. Since, in the
methoxyl group, every carbon atom is associated with three hydrogen atoms, 0.2
hydrogen atoms would correspond to 0.07 methoxyl groups. The empirical
formula could, then, be rewritten as C5.07H6.53O1.9(OCH3)0.07, which in C9
representation would be C9H11.59O3.37(OCH3)0.12.
From Table 4C.4, it can be seen that electrodeposited lignin has lesser
number of methoxyl groups compared to acid precipitated lignin. In wheat straw,
the acid precipitated lignin has 38 methoxyl groups per 100 phenylpropane units
whereas this number is only 12 for electrodeposited lignin. In bagasse, the acid
precipitated lignin has 36 methoxyl groups per 100 phenylpropane units in
comparison to 11 methoxyl groups for electrodeposited lignin. These figures are
41 and 11 methoxyl groups per 100 phenylpropane units, respectively for
eucalyptus.
Integration of 1H-NMR regions (Table 4C.2) between δ 6.25 – 7.9 ppm
also reveals that EDL has larger proportion of aromatic protons compared to APL.
This indicates lesser extent of substituent groups and linkages through the aromatic
ring for EDL. Signal integrations between δ 4.5 – 5.2 ppm and δ 0.0 – 1.6 ppm
Page 50
82
represent the βH (hydrogen attached to the β carbon), and hydrogen in non-
oxygenated aliphatic region, respectively (Guerra et al., 2004). The acid
precipitated solids have a larger proportion of hydrogen attached to the β carbon as
well as hydrogen in non-oxygenated aliphatic region. This indicates higher
occurrence of β―O―4 type entities (Guerra et al., 2004). Overall, the
electrodeposited lignin, from all black liquors, has higher carbon to hydrogen ratio
than the acid precipitated lignin (Table 4C.3).
4C.2.3 13C NMR spectra
The above observations are further confirmed by the 13C NMR spectra of
the solids shown in Figures 4C.13, 4C.14, and 4C.15 (for acid precipitated solids)
and Figures 4C.16, 4C.17, and 4C.18 (electrodeposited lignin). In 13C NMR
spectra of lignins the signals in the region from 100 to 155 ppm originate from
aromatic carbons (Kuo et al., 1991; Landucci et al., 1998; Goncalves et al., 2000;
Sun and Tomkinson, 2002; Jaaskelainen et al., 2003; Wu and Argyropoulos, 2003;
Capanema et al., 2004; Pu and Ragauskas, 2005; Hiltunen et al., 2006). Of these,
the region 129 – 155 ppm represents quaternary carbons (Landucci et al., 1998;
Goncalves et al., 2000).
In Figures 4C.13, 4C.14, and 4C.15 signals are present, as expected, at δ
152.14, δ 147.49, δ 115.50, δ 115.22, δ 115.04 and δ 101.84 ppm (wheat straw), δ
152.07, δ 147.15, δ 115.33, δ 115.09 and δ 101.93 (bagasse), and δ 152.21, δ
148.3, δ 115.49, δ 115.25, δ 115.02, δ 101.63 (eucalyptus) corresponding to both
quaternary aromatic carbons and tertiary aromatic carbons. The quaternary
aromatic signals in acid precipitated solids (Signals at δ 152 and δ 147 ppm) could
Page 51
83
Figure 4C.13. 13C NMR spectrum of acid precipitated lignin from wheat straw black liquor
Page 52
84
Figure 4C.14. 13C NMR spectrum of acid precipitated lignin from bagasse black liquor
Page 53
85
Figure 4C.15. 13C NMR spectrum of acid precipitated lignin from eucalyptus black liquor
Page 54
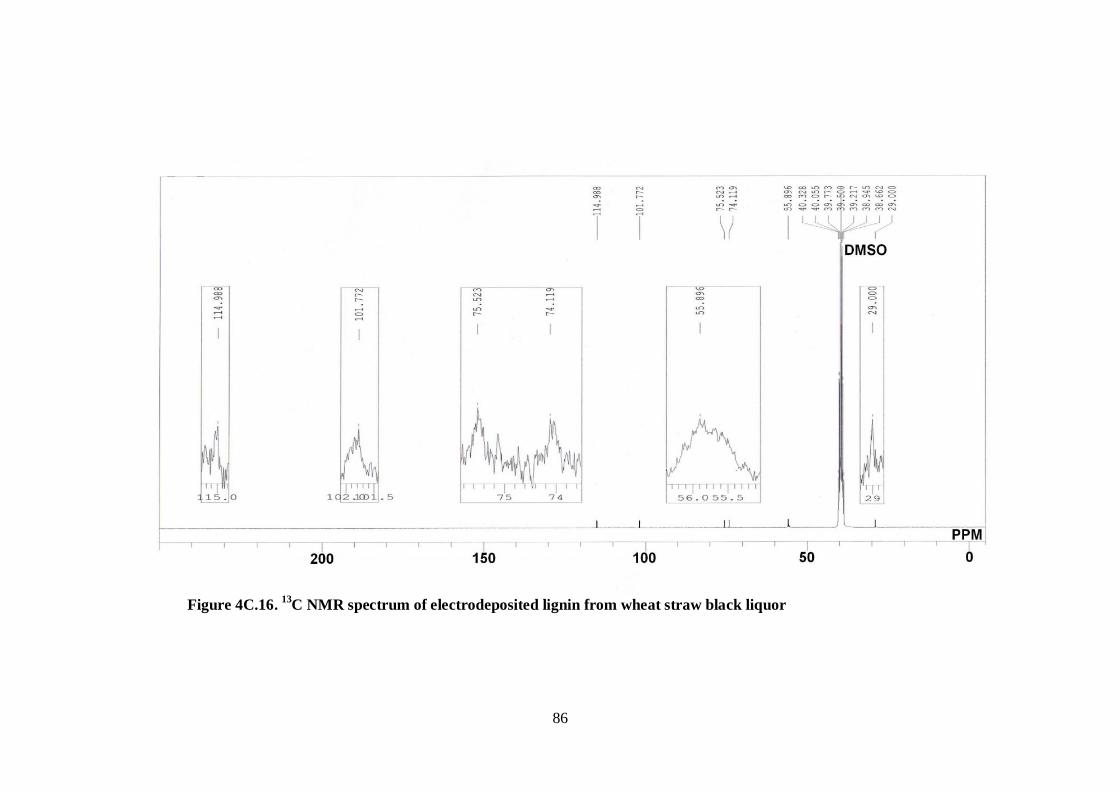
86
Figure 4C.16. 13C NMR spectrum of electrodeposited lignin from wheat straw black liquor
Page 55
87
Figure 4C.17. 13C NMR spectrum of electrodeposited lignin from bagasse black liquor
Page 56
88
Figure 4C.18. 13C NMR spectrum of electrodeposited lignin from eucalyptus black liquor
Page 57
89
be assigned to condensed and etherified substructures of syringyl and guaiacyl moieties
(Landucci et al., 1998; Capanema et al., 2004; Pu and Ragauskas, 2005). Signals at 115
and 101 ppm arise from various protonated aromatic carbons (Capanema et al., 2004; Pu
and Ragauskas, 2005). These are on expected lines.
In contrast, 13C NMR spectra of electrodeposited lignins (Figures 4C.16, 4C.17,
and 4C.18) do not show the presence of any quaternary aromatic carbon by total absence
of signals between δ 129 to δ 155 ppm. This is rather interesting and totally
uncharacteristic of known lignin formulations and derivatives. This is in apparent conflict
with the well known C6C3 backbone of lignins and could not be explained.
In the aliphatic part of the spectra the signals at δ 75 – 72 ppm are similar in acid
precipitated lignins and electrodeposited lignins and so are the signals at δ 56 ppm. δ 75
– 72 ppm signals could be assigned to inter-monomer linkages through α and γ carbons in
the side chain (Landucci et al., 1998; Capanema et al., 2004; Pu and Ragauskas, 2005). δ
56 ppm signal arises from methoxyl group carbon, a common feature of lignin
formulations. On the other hand, in electrodeposited lignins there are no signals at δ 63
ppm, assigned to Cγ̶ OH (Gil and Pascoal, 1999) in acid precipitated lignin.
4C.3 THERMOCHEMICAL CHARACTERIZATION
4C.3.1 Differential Thermal Analysis
The thermal transformations of wheat straw lignin, bagasse lignin, and eucalyptus
lignin are shown in Figures 4C.19, 4C.20, and 4C.21, respectively. For all the black
liquors the electrodeposited lignins underwent an initial endothermic transformation; the
maximum peak temperatures being 70 0C, 75 0C, and 70 0C,
Page 58
90
Figure 4C.19. DTA results of lignins from wheat straw black liquor
Figure 4C.20. DTA results of lignins from bagasse black liquor
-70
-60
-50
-40
-30
-20
-10
0
10
0 100 200 300 400 500 600 700 800Temperature (oC)
DTA
(uV)
Wheat straw EDLWheat straw APL
139 mJ/mg
70 Cel
145 mJ/mg69 Cel
-128 mJ/mg
390 Cel
-70
-60
-50
-40
-30
-20
-10
0
10
0 100 200 300 400 500 600 700 800Temperature (oC)
DTA
(uV)
Bagasse EDLBagasse APL
169 mJ/mg
75 Cel
-196 mJ/mg
392 Cel
210 mJ/mg
75 Cel
Page 59
91
Figure 4C.21. DTA results of lignins from eucalyptus black liquor
respectively, for wheat straw, bagasse, and eucalyptus. This is due to the presence of
adsorbed water and confirms to the results previously reported in literature (Pucciariello
et.al., 2004). The associated enthalpy changes were 139 mJ/mg, 210 mJ/mg, and 156
mJ/mg, respectively. For wheat straw solids the transformation occurred between 29 0C
and 145 0C, for bagasse solids this spanned from 33 0C to 158 0C, and for eucalyptus it
ranged from 32 0C to 152 0C. In addition, the EDL from bagasse black liquor exhibited
two more endothermic transformations involving modest enthalpy changes of 12.8 and
12.1 mJ/mg. The first transformation was centered at 249 0C spanning from 215 0C to 282
0C. The second one occurred between 320 0C and 367 0C with the peak at 344 0C.
-70
-60
-50
-40
-30
-20
-10
0
10
0 100 200 300 400 500 600 700 800
Temp. (oC)
DTA
(uV)
Eucalyptus EDLEucalyptus APL
390 Cel
-140 mJ/mg
70 Cel70 Cel
156 mJ/mg
166 mJ/mg
Page 60
92
In comparison, the acid precipitated lignins, from all the black liquors, had similar
initial endothermic transformations. For wheat straw (Fig. 4C.19) it occurred between 32
0C and 149 0C, peaking at 69 0C, with an enthalpy change of 145 mJ/mg. For bagasse
(Fig. 4C.20), the transformation was observed between 36 0C and 160 0C with the peak at
75 0C and enthalpy change of 169 mJ/mg. In eucalyptus, this transformation was noticed
between 30 0C to 151 0C (peak at 70 0C) associated with an enthalpy change of 166
mJ/mg. However, upon further heating all the acid precipitated lignin samples exhibited a
pronounced exothermic transformation, which was totally absent in the case of
electrodeposited lignin. For wheat straw this exothermic transformation, evolving 128
mJ/mg of energy, took place in the temperature range of 319 0C to 443 0C with the
maximum at 390 0C. The similar transformation for bagasse evolved 196 mJ/mg of
energy in the temperature range of 321 0C to 447 0C with the maximum at 392 0C. And
for eucalyptus the exothermic transformation occurred between 315 0C and 452 0C with
an expulsion of 140 mJ/mg heat; the peak being at 390 0C. Such exothermic
decomposition of lignin has been reported by other investigators for commercially
available kraft lignin (Khezami et al., 2005) and lignin precipitated from black liquor
(Rohella et al., 1996) and, therefore, is on expected lines.
4C.3.2 Thermo Gravimetric Analysis
Figures 4C.22, 4C.23, and 4C.24 present the TGA thermograms of wheat straw
lignin, bagasse lignin, and eucalyptus lignin.
Page 61
93
Figure 4C.22. TGA results of lignins from wheat straw black liquor
Figure 4C.23. TGA results of lignins from bagasse black liquor
0
20
40
60
80
100
120
0 100 200 300 400 500 600 700 800Temperature (oC)
TGA
(%)
Wheat straw EDLWheat straw APL
0
20
40
60
80
100
120
0 100 200 300 400 500 600 700 800Temperature (oC)
TGA
(%)
Bagasse EDLBagasse APL
Page 62
94
Figure 4C.24. TGA results of lignins from eucalyptus black liquor
Figure 4C.25. DTG results of lignins from wheat straw black liquor
0
20
40
60
80
100
120
0 100 200 300 400 500 600 700 800
Temp. (oC)
TGA
(%)
Eucalyptus EDLEucalyotus APL
0
50
100
150
200
250
300
0 100 200 300 400 500 600 700 800
Temperature (oC)
DTG
(ug/
min
)
Wheat straw EDLWheat straw APL
67 Cel125.2
357 Cel227.2 ug/min
63 Cel133.3 ug/min
357 Cel271.7 ug/min
Page 63
95
Figure 4C.26. DTG results of lignins from bagasse black liquor
Figure 4C.27. DTG results of lignins from eucalyptus black liquor
0
50
100
150
200
250
300
350
0 100 200 300 400 500 600 700 800Temperature (oC)
DTG
(ug/
min
)Bagasse EDLBagasse APL
70 Cel152.4 ug/min
320 Cel329.2 ug/min
361 Cel286.1 ug/min
70 Cel147.9 ug/min
0
50
100
150
200
250
300
0 100 200 300 400 500 600 700 800Temp. (oC)
DTG
(ug/
min
)
Eucalyptus EDLEucalyptus APL
377 Cel281.9 ug/min
357 Cel238.8 ug/min72 Cel
164 ug/min
73 Cel126.2 ug/min
Page 64
96
The rates of thermal degradation are presented in Figures 4C.25, 4C.26, and 4C.27. TGA
results for the electrodeposited lignin samples show two distinct phases of weight loss.
Initially, upon heating, the electrodeposited lignin from wheat straw black liquor
underwent a weight loss of 8.65% with a maximum rate of 125.2 μg/min. at 67 0C. As can
be seen, this initial loss in weight coincided with the endothermic peak of the DTA
results, and was due to the expulsion of residual amount of moisture. Such moisture loss
upon heating is normal in the case of lignins obtained from black liquor (Fierro et al.,
2005) as also for other types of lignins (Pucciariello et.al., 2004). Similar results were
observed for bagasse where the initial heating resulted in 9.02% weight loss with a
maximum rate of 152.4 μg/min. at 70 0C. And for eucalyptus, this initial weight loss was
7.57%; maximum rate of 164 μg/min weight loss occurring at 72 0C .Upon further
heating, the wheat straw electrodeposited lignin had a profound thermal degradation
between 250 0C to 450 0C accounting for 27.7% weight loss. The rate of this degradation
peaked at 357 0C with the maximum rate being 227.2 μg/min. Beyond 450 0C the material
continued to degrade at a much slower rate leaving a char residue of 47% at 800 0C.
Similar behavior was observed for bagasse where the prominent thermal degradation
between 250 0C to 450 0C accounted for 30.7% weight loss. The peak thermal
degradation rate of 329.2 μg/min. occurred at 320 0C. Gradual thermal degradation
continued above 450 0C and a char residue of 46.5% was obtained at 800 0C. In the case
of eucalyptus, again a profound degradative weight loss of 25.6% was noticed between
245 0C and 450 0C. Here, the maximum rate of thermal degradation was 281.9 μg/min.,
which was observed at 377 0C. Beyond this temperature the material continued to thermo-
degrade at a slower rate and a final char residue of 49% was left. For all the
Page 65
97
electrodeposited lignins, the notable feature of the high temperature degradation was its
largely athermic nature, as indicated by the DTA results.
Two distinct phases of weight loss upon heating is also evident for the acid
precipitated lignin. For wheat straw the initial expulsion of residual moisture, coinciding
with the DTA endothermic peak, accounted for 7.21% weight loss with a maximum rate
of 133.3 μg/min. at 63 0C. Similar transformation was observed in bagasse showing
7.59% weight loss and a maximum dehydration rate of 147.9 μg/min. at 70 0C. In
eucalyptus the initial weight loss was 7.49%. The maximum dehydration rate was 126.2
μg/min. at 73 0C. Upon further heating all the acid precipitated lignin samples underwent
thermal decomposition. For wheat straw, appreciable weight loss of 26.53% was noticed
between 300 0C and 450 0C with a maximum decomposition rate of 271.7 μg/min. at 357
0C. For bagasse, similar fast decomposition, accounting for 25.75% weight loss, took
place in the temperature span of 300 0C to 450 0C. Decomposition rate peaked to 286.1
μg/min. at 361 0C. In eucalyptus there was a steep weight loss of 23.85% in the
temperature range of 310 0C to 440 0C. A maximum rate of weight loss of 238.8 μg/min.
was observed at 357 0C. However, in comparison to electrodeposited lignins, the high
temperature thermal decomposition of acid precipitated lignins was a distinctly
exothermic phenomenon as indicated in the DTA thermograms. For these solids gradual
thermal degradation continued as they were heated past 440 – 450 0C leaving a char
residue of 43%, 44%, and 45%, respectively, for wheat straw, bagasse, and eucalyptus.
Acid precipitated lignins from black liquor are reported to yield 40 – 50 % char upon
similar thermal degradation (Tejado et al., 2007). Higher char residues obtained for
electrodeposited lignins are consistent with their higher carbon content (Table 4C.3). This
Page 66
98
could also arise from the structural differences between electrodeposited lignins and acid
precipitated lignins as revealed by their spectroscopic studies. Pyrolytic degradation of
lignin is known to involve fragmentation of inter-unit linkages and formation of highly
condensed aromatic structures leading to char residues (El-Saied and Nada, 1993; Tejado
et al., 2007).
Page 67
99
*Chapter 4D
Pollution abatement and recovered values
4D.1 BACKGROUND
It has been spelled out in Chapters 1 and 2 that disposal of the black liquor
generated poses an existential dilemma for the small pulp and paper mills on account of
environmental concern. This is mainly due to the enormous pollution load carried by the
untreated black liquor. Organics present in the black liquor exert a very high oxygen
demand on the receiving water bodies. Most of these organics are of bio-recalcitrant and
bio-inhibitory nature manifested by a high COD. Also, they are a potential source of
carbon neutral energy. Besides these the black liquor contains inorganic constituents
which are of economic value to the mill. To be viable, any potential black liquor
treatment option must address these issues.
Lignin is the main constituent of black liquor organics and the main contributor
towards its high oxygen demand. Chapters 4A, 4B, and 4C, have established that lignin is
separated from black liquor during its electrolysis. Its removal from black liquor,
therefore, should reduce the pollution load and make it more amenable to disposal.
Combined with simultaneous hydrogen production, it presents an interesting route for
pollution prevention; as well as recovery of value added products. It remains to be
examined, however, if the treated liquor left after electrolysis is suitable for disposal.
Further, a detailed estimation of the material and energy balances involved in the process
is essential for the proper evaluation of its suitability.
* Part of this chapter is published in Tappi Journal.
Page 68
100
4D.2 LOW POTENTIAL ELECTROLYSIS
Electrolysis experiments were carried out in a laboratory setup schematically
shown in Figure 3.2 and as per the procedure detailed in Chapter 3. The initial
characteristics of the black liquors are presented in Table 4D.1.
Table 4D.1 Initial characteristics of black liquors
Total dissolved
solids (%) Organic/inorganic ratio COD (g/l) Silica (% of
total dissolved solids)
Wheat straw
6.03 Organics 53.76% Inorganics 46.24%
61.12 6.83
Bagasse 6.18 Organics 54.19% Inorganics 45.81%
62.77 3.76
Eucalyptus 7.92 Organics 57.52% Inorganics 42.48%
77.27 0.43
Under alkaline conditions the cathodic hydrogen evolution reaction (Rosalbino et
al., 2003)
H2O + e– ↔ H + OH¯ {4D.1}
proceeds with an equilibrium potential (Eeq) of – 1.07 V vs. Saturated Calomel Electrode.
From thermodynamic considerations the anodic oxygen evolution reaction (Plata-Torres
et al., 2007)
2 OH¯ ↔ O + H2O + 2 e– {4D.2}
takes place at an Eeq of 0.16 V vs. Saturated Calomel Electrode. In practice, however,
appreciable oxygen evolution reaction could be observed only at overpotential in excess
of 200 mV. In comparison organic anions in black liquor could be electrolyzed at the
Page 69
101
anode at much lower potential as discussed in Chapter 4B. As a result, in low potential
black liquor electrolysis organics are electrodeposited at the anode with negligible
oxygen evolution.
Experiments were carried out with 25 ml black liquor samples. 1.2 V
interelectrode potential was applied. The characteristics of electrolyzed black liquor are
shown in Table 4D.2. The electrolyzed black liquor had a reduced proportion of organic
solids and less COD compared to untreated black liquor. After prolonged electrolysis for
72 hours the COD of a 25 ml sample could be reduced by 13.8%, 13.4%, and 9.3%, for
wheat straw, bagasse and eucalyptus black liquors, respectively. Though, this COD
reduction is not sufficient to make it suitable for discharge into receiving water bodies,
the partial removal of organics could be helpful in situations where the combustion
capacity of the recovery boiler is the limiting factor. Further, for the three black liquors,
every gram of COD reduced was accompanied by the production of 178, 196, and 251 ml
of hydrogen and 0.55, 0.56, and 0.61 grams of lignin with the electrical energy
consumption of 1983, 2185, and 2809 joules, respectively. The hydrogen produced was
free from carbon dioxide as no change in the concentration of bubbling KOH solution
was observed.
When electrolysis experiments were repeated with 10 ml black liquor samples
diluted to 25 ml, COD reductions of 31.8%, 33.9%, and 22.6%,
Page 70
102
Table 4D.2 Results of low potential electrolysis
a All values in brackets indicate electrolysis results for 10 ml black liquor samples diluted to 25 ml
Electrical energy
spenta (J)
Organic/inorganic ratio
COD (g/l)
% COD reduction
Silica (% of total
dissolved solids)
Hydrogen produced
(ml)
Lignin separated
(mg)
COD loading per
unit electrode surface
(mg/cm2)
COD reduced per unit
electrode area
(mg/cm2) Wheat straw
417 (406)a
Organics 49.86% (43.15%) Inorganics 50.14% (56.85%)
52.71 (41.67)
13.8 (31.8)
7.32 37.5 (36.5)
115 (112) 21.44 (8.18)
2.81 (2.60)
Bagasse 460 (454)
Organics 50.13% (42.97%) Inorganics 49.87% (57.03%)
54.35 (41.46)
13.4 (33.9)
4.06 41.2 (40.6)
118 (116) 20.99 (8.40)
2.82 (2.85)
Eucalyptus 505 (485)
Organics 54.97% (50.47%) Inorganics 45.03% (49.53%)
70.08 (59.84)
9.3 (22.6) 0.46 45.1 (43.3)
109 (105) 25.84 (10.34)
2.40 (2.33)
Page 71
103
respectively, were achieved for the three black liquors. Thus, besides the initial
COD of the black liquor, the percentage COD reduction depended on the
parameter, COD loading per unit electrode surface. Modern industrial electrolyzers
with their compact designs and closely spaced electrodes (Kreuter and Hofmann,
1998; Ulleberg, 2003) are likely to achieve a very low value for this parameter and
higher percentage of COD reduction might be possible. However, for a particular
black liquor the parameter COD reduced per unit electrode area remained almost
unchanged for a given electrical energy consumption.
The process is energetically attractive. For the wheat straw black liquor the
energy equivalent of hydrogen produced at the Lower Heating Value (LHV) is 401
J which is 96.2 % of the electrical energy consumed in the process. These values
are 95.8%, and 95.5%, respectively, for bagasse black liquor and eucalyptus black
liquor. These results are consistent with the earlier findings for low potential black
liquor electrolysis, reported in Chapter 4A. If used in a fuel cell 50 – 65 % of the
energy equivalent of hydrogen can be converted to useful electrical energy
(Kasseris et al., 2007; van Ruijven et al., 2007). This amounts to an overall energy
efficiency of 48 – 63 %. When used in combined heat and power (CHP) mode,
fuel cells can achieve efficiencies of 80 % with 15 – 30 % energy available as
thermal energy (USDOE, 2002). For small mills, selling the hydrogen as an eco-
friendly fuel can be another alternative for generating additional revenue. In
addition the lignin separated in the process is a good biofuel.
As the extent of COD reduction as well as the hydrogen production and
lignin separation will depend on the extent of electrolysis, different electrolytic
Page 72
104
runs were performed. The results are shown in Figure 4D.1. Here, it is important to
note that the rate of COD reduction decreases with time and reaches a plateau
region after nearly 28 hours. As discussed in Chapters 4A and 4B, in low potential
black liquor electrolysis, electroactive organic anions are responsible for the
anodic counter reaction, with practically negligible oxygen evolution reaction.
With progressive separation of lignin from black liquor, the abundance of
electroactive organic anions goes on reducing which reflects in the falling rate of
COD reduction.
Figure 4D.1. COD reduction with varying extent of low potential electrolysis
0
5
10
15
20
25
30
35
40
0 20 40 60 80
CO
D re
duct
ion
(%)
Time (h)
Wheat straw (low COD loading)
Wheat straw (high COD loading)
Bagasse (low COD loading)
Bagasse (high COD loading)
Eucalyptus (low COD loading)
Eucalyptus (high COD loading)
Page 73
105
4D.3 ELECTROLYSIS AT HIGHER POTENTIAL
4D.3.1 Material balances
From theoretical consideration, in aqueous alkaline solutions anodic
oxygen evolution reaction starts at an interelectrode potential of 1.23 V. In high
potential black liquor electrolysis, therefore, oxygen evolution reaction also
contributes to the anodic counter reaction resulting in the generation of highly
reactive nascent oxygen. Following were the distinct observations in high potential
black liquor electrolysis.
When sufficient time was provided for electrolysis it resulted in complete
oxidation of the organics present in the black liquor; thus giving complete
COD removal.
At the end an aqueous solution with some precipitated solids was obtained.
The aqueous solution consisted entirely of sodium carbonate and the
precipitated solids were analyzed and determined to be silica.
Compared to low potential electrolysis very little amount of electrodeposited
lignin was obtained at the anode.
These results are significant because they provide an alternative way of
recovering chemicals from black liquor outside the established evaporation –
combustion, and evaporation – gasification route. The established methods are
technoeconomically unviable for small scale mills because of their scale of
operation. Electrolyzers, however, owing to their modular designs, can be stacked
up into arrays of any capacity (Ulleberg, 2003; Dale et. Al., 2008; Deshmukh and
Boehm, 2008). This opens up the possibility for small scale operation.
Page 74
106
Table 4D.3 Results of high potential electrolysis
Black liquor
type Electrical
energy spent (J) Sodium
carbonate recovered (mg)
Hydrogen produced (ml)
Carbon dioxide
produced (mg)
Lignin separated
(mg)
Silica separated (mg)
Time of electrolysis
(h)
Interelectrode potential 1.5 V
Wheat straw 26914 (10790)a 780 (314) 2082 (838) 1505 (603) 28 70 114 (45) Bagasse 27848 856 2144 1560 26 29 122 Eucalyptus 34768 1100 2666 2045 23 negligible 127
Interelectrode potential 3 V
Wheat straw 56246 (22597) 782 (314) 2090 (842) 1509 (605) 25 71 62 (25) Bagasse 58884 858 2140 1557 27 30 66 Eucalyptus 72890 1098 2660 2041 25 negligible 68
Interelectrode potential 6 V
Wheat straw 112118 (39915)
778 (315) 2087 (840) 1509 (606) 26 69 34 (14)
Bagasse 117445 855 2138 1558 27 29 37 Eucalyptus 146293 1100 2664 2040 25 negligible 40
Interelectrode potential 12 V
Wheat straw 225051 (89739)
784 (318) 2085 (840) 1503 (600) 29 72 19 (8)
Bagasse 234245 856 2132 1552 30 29 20 Eucalyptus 292297 1096 2672 2048 22 negligible 22
a All values in brackets indicate electrolysis results for 10 ml black liquor samples diluted to 25 ml.
Page 75
107
The quantitative results of high potential black liquor electrolysis are shown in
Table 4D.3. Here, 1363, 1366, and 1380 ml of hydrogen was produced,
respectively, for the three black liquors, for every gram of COD reduced. Whereas,
the lignin separated per gram of COD reduced was only 18, 17, and 12 mg,
respectively. This suggests that oxidation, rather than electrodeposition of lignin, is
mainly responsible for the COD reduction in this case. The generation of nascent
oxygen could provide oxidizing conditions strong enough for the complete
oxidation of the organics present in the black liquor with the main chemical
reactions being:
H2O → H2 + O (electrolytic water splitting) {4D.3}
Organics + O → CO2 + H2O (oxidation of organics) {4D.4}
This explains the recovery of inorganics, present in the black liquor, as aqueous
solution of sodium carbonate. Carbon dioxide produced in excess of that bound to
sodium as sodium carbonate emerged as gas and was estimated by absorption in
KOH. This amounted to 0.98, 0.99, and 1.06 gram, respectively, of carbon dioxide
produced for every gram of COD reduced in this case. In addition, 68 % of the
silica present in the wheat straw black liquor precipitated out from the solution,
and was obtained as solids. For the bagasse black liquor 50 % of the silica initially
present was precipitated.
4D.3.2 Energy balances
The interelectrode potential employed had a profound effect on the
electrical energy required for the process and time required for the completion of
the process. For the wheat straw black liquor it took 17614 J of electrical energy
Page 76
108
for the removal of one gram of COD at interelectrode potential of 1.5 V. It
increased to 36810 J, 73376 J, and 147285 J, respectively, for 3 V, 6 V, and 12 V
interelectrode potential. At the same time, the time required for complete COD
removal decreased from 114 hours to 19 hours. Similar changes were observed for
the other two black liquors. The other way of reducing the time requirement
without increasing the interelectrode potential and compromising on the energy
consumption, was to decrease the ratio, COD loading per unit electrode surface.
Thus, for the selected electrolysis experiments using 10 ml black liquor diluted to
25 ml, the time requirement reduced for the similar electrical energy consumption
(Table 4D.3, values in brackets).
An account of energy inputs and outputs from the process is shown in
Table 4D.4. Electrical energy is spent in the process. Of this energy, the energy
stored as hydrogen, and the energy in the form of separated lignin is directly
usable and could be considered as readily recovered. At 1.5 V interelectrode
potential, this amounted to 84 – 86 % of the total electrical energy input. This
dropped to 40 – 41 % at 3 V interelectrode potential and further to 20 – 21 %, and
10 %, respectively, at 6 V and 12 V interelectrode potential. Thus, a high
interelectrode potential could remove COD at a faster rate only at the expense of
energy efficiency. The 50 – 65 % of energy stored as hydrogen can be converted to
useful electrical energy through fuel cells (Kasseris et al., 2007; van Ruijven et al.,
2007). In CHP mode, efficiencies as high as 80 % can be achieved, with 15 – 30
% energy available as process heat (USDOE, 2002).
Page 77
109
As the organics present in the black liquor are oxidized, the exothermic
reactions involved would release energy in the form of heat. In the bench scale
laboratory experiments conducted this energy remained unaccounted for as it was
largely dissipated to the surrounding. However, this energy should be potentially
Table 4D.4 Energy balance in high potential electrolysis
Black liquor type Electrical energy
spent (J) Energy equivalent of hydrogen
produced (J at LHV) Energy
equivalent of lignin separated
(J) Wheat straw (1.5 V) 26914 22277 773 Bagasse (1.5 V) 27848 22940 710 Eucalyptus (1.5 V) 34768 28526 595 Wheat straw (3 V) 56246 22363 690 Bagasse (3 V) 58884 22898 737 Eucalyptus (3 V) 72890 28461 647 Wheat straw (6 V) 112118 22330 718 Bagasse (6 V) 117445 22876 737 Eucalyptus (6 V) 146293 28504 647 Wheat straw (12 V) 225051 22309 801 Bagasse (12 V) 234245 22812 819 Eucalyptus (12 V) 292297 28590 569
recoverable. One gram of COD removed would release about 14.5 kJ of thermal
energy. The extent to which this energy can be put to productive use would depend
upon the process and equipment design. This can have significant bearing on the
overall energy dynamics of the operation.
Table 4D.5 presents simulated results for a model agricultural residue pulp
mill for possible black liquor treatment through electrolysis. It envisages two
Page 78
110
scenarios; one wherein the hydrogen produced is utilized for captive CHP
generation. A pulp mill with 50 t/day pulp production is likely to produce 56.5
tonnes sodium carbonate and 2 tonnes lignin every day for electricity consumption
of 273081 kWh. In addition, process heat to the tune of 538.5 – 834.5 GJ should
be available daily. In the second scenario, the hydrogen produced is sold as a value
added product. Here, in addition to the daily production of sodium carbonate and
lignin, 13.5 tonnes of hydrogen should be available for sale at the expense of
542500 kWh of electricity. Process heat available should be 296 – 592 GJ.
Table 4D.5
Simulated results for a model agro residue pulp mill for one day operation Parameters Values Unbleached pulp production 50 tonnes Black liquor generated 1750 m3 Total COD load 108.5 tonnes (at 62 g/l) Total electrical energy required 542500 kWh (@ 18000 J/g COD
removed) Energy equivalent of hydrogen generated
1616.5 GJ
Electricity that could be produced from hydrogen
269419 kWh (@ 60 % efficiency)
Process heat that could be available from CHP generation
242.5 GJ (@ 15 % efficiency)
Net electrical energy required 273081 kWh Hydrogen produced (mills can opt for selling the produced hydrogen instead of captive power generation)
13.5 tonnes
Sodium carbonate produced 56.5 tonnes Lignin produced 2 tonnes Process heat that could be available from oxidation of organics
296 GJ (at 20 % heat recovery) 444 GJ (at 30 % heat recovery) 592 GJ (at 40 % heat recovery)
Page 79
111
4D.4 IMPACT ON AIR ENVIRONMENT
Transportation sector is perceived to be one of the worst in terms of
emission of greenhouse gases (GHG) and other air pollutants owing to the use of
fossil fuels in internal combustion engines (Gonzalez et al., 2004; Rosa et al.,
2004; Greiner et al., 2007). Here, hydrogen is excellently suited as an alternative
(Bockris, 2002) and is being pursued earnestly by researchers, administrators and
policymakers (Salgado and Martinez, 2004). When used in fuel cell vehicles the
amount of gasoline replaced by a given amount of hydrogen is (Greiner et al.,
2007)
Vgas = (Mhyd × LHVhyd × ηFC) / LHVgas × ηICE (4D.1)
Where
Vgas = volume of gasoline
Mhyd = mass of hydrogen
LHVhyd = lower heating value of hydrogen, 120 MJ/kg (Greiner et al., 2007)
ηFC = efficiency of fuel cell vehicle
LHVgas = lower heating value of gasoline, 32.7 MJ/l (Hetland and Mulder, 2007)
ηICE = efficiency of gasoline vehicle
Today’s internal combustion engine driven gasoline fuelled vehicles have about
18.5 – 19 % efficiency (GM, 2002) which is expected to improve to about 19.5%
by the year 2010 (GM, 2002; Hetland and Mulder, 2007). Compared to this,
current hydrogen powered fuel cell driven vehicles are reported to have 36%
efficiency which is likely to improve to 44% by 2010 (Hetland and Mulder, 2007).
Some estimates even put the efficiency of fuel cell vehicles at as high as 50 – 60%
Page 80
112
(Suppes et al., 2004; van Ruijven et al., 2007). With 36% efficiency of fuel cell
vehicle and 18.5 – 19 % efficiency of gasoline vehicles, a kg of hydrogen can
replace between 6.95 to 7.14 liters of gasoline. This figure is expected to be 8.28
liters in year 2010. With an emission factor of 72 kg CO2 per GJ for gasoline
(Damen et al., 2007), a kg of hydrogen replacing gasoline will save the emission of
nearly 16.5 to 17 kg of CO2. This can increase to 19.5 kg CO2 emission saved if
2010 predictions are realized. In addition emission of significant amount of
harmful air pollutants like NOx and SOx will be curbed with hydrogen powered
fuel cell vehicles replacing conventional gasoline vehicles.
Thus, a mill separating 10 tonnes/day lignin through low potential black
liquor electrolysis will co-produce 110 to 146 tonnes of hydrogen in a year with
potential replacement of 761025 to 1208880 liters of gasoline in vehicular
transport. If the electricity required for the electrolysis could be sourced from a
carbon neutral source (e.g. wind, solar, etc.), this amounts to 1807 to 2847 tonnes
of additional CO2 emission saved annually besides curbed emission of SOx and
NOx. This will significantly improve the environmental acceptability of the mill
and will earn tradable carbon credits.
In the case of high potential black liquor electrolysis, a mill with a
production capacity of 50 tonnes/day could produce 4455 tonnes of hydrogen
annually (Table 4D.5, assuming 330 working days in a year). If the mill opts for
the sale of hydrogen to the transport sector, this could amount to potential
replacement of 30821512 l of gasoline amounting to 73184 tonnes of CO2
Page 81
113
emission curbed annually, when the electricity required for the electrolysis could
be sourced from a carbon neutral source.
Page 82
114
*Chapter 4E
Economic evaluation
4E.1 BACKGROUND
Chapters 4A to 4D has detailed the scientific insight into the process of
black liquor electrolysis and established its technical viability as a treatment option
for non sulfur black liquor. Its environmental benefits have also been brought into
focus. Businesses, however, are run for earning profits. For this reason, for a
process to be acceptable, it must go through the scrutiny of economic evaluation.
For economic comparison of the different investment options the
method of discounted payback period (Chandrasekar and Kandpal, 2004; Kaldellis
et al., 2005) is used. To determine the present worth of any sum X from the nth
year we have (El-Kordy et al., 2002)
Xp = X {(1 + i)/(1+ r)}n (4E.1)
Where
Xp = present worth of X
i = rate of inflation
r = discount rate
At payback period, N,
Present worth of total earning = Present worth of total cost (4E.2)
Present worth of total earning = AE [1 – {(1 + i)/(1 + r)}N] / [1 – {(1 + i)/(1 + r)}]
+ Sp (4E.3)
* Part of this chapter is published in Tappi Journal.
Page 83
115
Present worth of total cost = I + AC [1 – {(1 + i)/(1 + r)}N] / [1 – {(1 + i)/(1 + r)}]
(4E.4)
Where
AE = Annual earning
Sp = Present worth of salvage value
I = Capital investment
AC = Annual cost
For low potential black liquor electrolysis annual earning will include
proceeds from selling hydrogen and lignin. For high potential black liquor
electrolysis annual earning will include proceeds from selling hydrogen and lignin,
and the economic value of sodium hydroxide that would be available to the mill by
causticizing the sodium carbonate produced during electrolysis. In both the cases,
black liquor electrolysis will require capital investment on the electrolyzer and
hydrogen storage. Electrolyzer will also need annual cost of operation and
maintenance. Annual cost would include the cost of electricity, in both the cases.
In addition, for high potential electrolysis, causticizing of sodium carbonate would
also involve annual cost. The key economic parameters and their range of values
are presented in Table 4E.1. In addition an annual inflation rate of 4% and
discount rate of 6% is taken for the economic evaluation. Currency exchange rate
of € 1 = Rs. 70 has been used.
Page 84
116
Table 4E.1 Key economic parameters
Low potential black liquor
electrolysis High potential black liquor
electrolysis Capital Investment
a) Electrolyzer Rs. 28000 – 91000 per kW (€ 400 – 1300 per kW)
b) Compressed H2 storage Rs. 62300 per kg (€ 890 per kg)
a) Electrolyzer Rs. 28000 – 91000 per kW (€ 400 – 1300 per kW)
b) Compressed H2 storage Rs. 62300 per kg (€ 890 per kg)
Equipment life a) Electrolyzer 20 yearsa b) H2 storage 20 yearsa
a) Electrolyzer 20 yearsa b) H2 storage 20 yearsa
Salvage value a) Electrolyzer 20% of capital investmenta
b) H2 storage 20% of capital investment
a) Electrolyzer 20% of capital investmenta
b) H2 storage 20% of capital investment
Gasoline price Rs. 35 – 70 per liter (€ 0.5 – 1.0 per liter)
Rs. 35 – 70 per liter (€ 0.5 – 1.0 per liter)
Electricity price Rs. 1400 – 4200 per MWh (€ 20 – 60 per MWh)
Rs. 1400 – 4200 per MWh (€ 20 – 60 per MWh)
Lignin price Rs. 1050 per MWh (€ 15 per MWh)
Rs. 1050 per MWh (€ 15 per MWh)
Operation and maintenance cost
Electrolyzer 5% of capital investment
Electrolyzer 5% of capital investment
NaOH Price NA Rs. 14000 – 22750 per tonne (€ 200 – 325 per tonne)b
Causticizing cost NA Rs. 9100 per tonne Na2CO3 (€ 130 per tonne Na2CO3)b
a(Gonzalez et al., 2004); bConservatively estimated from industry sources
4E.2 LOW POTENTIAL ELECTROLYSIS
Using equations, (4E.2), (4E.3), and (4E.4), the payback period for low
potential black liquor electrolysis can be calculated as:
N = log [1 – {(1 – (1.04/1.06))(IEL + IHS – Sp)/((AEhyd + AElignin) – (ACelec +
AMEL))}]/log (1.04/1.06) (4E.5)
Page 85
117
Where
IEL = Capital cost of electrolyzer
IHS = Capital cost of hydrogen storage
AEhyd = Annual earning from sale of hydrogen
AElignin = Annual earning from sale of lignin
ACelec = Annual cost of electricity
AMEL = Annual maintainance cost of electrolyzer
For low potential black liquor electrolysis the best economic scenario
pertains to an electrolyzer capital cost of Rs. 28000 per kW (€ 400 per kW). As
explained in Chapter 4D, hydrogen can be used as a gasoline replacement in
vehicular transport. Higher the prevailing gasoline price higher should be the
hydrogen selling price and the revenue earned on account of it. Lower the
electricity price, better it would be economically for the electrolysis process. With
these considerations, in the best case scenario, low potential black liquor
electrolysis should have a payback period of 0.6 years. This value is 4.2 years in
the worst case scenario.
4E.2.1 Sensitivity analysis
4E.2.1.1 Effect of capital costs
Keeping all other parameters constant, except the capital cost of the
electrolyzer, equation (4E.5) reduces to
N = log [1 – (0.0163 IEL + K1)/(K2 – 0.05 IEL)]/log(1.04/1.06) (4E.6)
Where, K1 and K2 are constants dependent on economic conditions chosen.
Page 86
118
Economics of low potential black liquor electrolysis will depend upon the capital
costs of the electrolyzer and the same is depicted in Figure 4E.1.
Figure 4E.1. Effect of capital costs on the economic performance of low potential black liquor electrolysis
The payback period increases almost linearly with increase in the capital costs; the
increase being 70 – 80 % if the electrolyzer capital cost increases from 28000
Rs./kW (400 €/kW) to 91000 Rs./kW (1300 €/kW). There is, however, a fair bit of
uncertainty in the electrolyzer capital costs as electrolysis technology for hydrogen
production has not yet reached wide commercialization level. There is currently a
lot of speculation regarding the future improvement of these technologies in terms
of performance as well as cost (Kasseris et al., 2007). Capital costs for
electrolyzers have been reported to be 63000 Rs./kW (900 €/kW) (Khan and Iqbal,
0
0.5
1
1.5
2
2.5
3
3.5
0 20000 40000 60000 80000 100000
Payb
ack
peri
od (y
ear)
Electrolyzer cost (Rs. /kW)
Gasoline price Rs. 35/l, electricity price Rs. 3500/MWhGasoline price Rs. 55/l, electricity price Rs. 3500/MWhGasoline price Rs. 70/l, electricity price Rs. 3500/MWhGasoline price Rs. 55/l, electricity price Rs. 2100/MWh
Page 87
119
2005), 91000 Rs./kW (1300 €/kW) (Greiner et al., 2007), 17500 – 94500 Rs./kW
(250 – 1350 €/kW) (van Ruijven et al., 2007), 28000 – 105000 Rs./kW (400 –
1500 €/kW) (Kasseris et al., 2007), and 10500 – 49000 Rs./kW (150 – 700 €/kW)
(Fingersh, 2004). Forecasts in USA envisage an electrolyzer capital cost of 11900
Rs./kW (170 €/kW or 250 US$/kW) by the year 2015 compared to the 2005 cost
of 35000 Rs./kW (500 €/kW or 730 US$/kW) (USDOE, 2006). The sensitivity
analysis, therefore, covers a range of 28000 – 91000 Rs./kW (400 – 1300 €/kW) as
electrolyzer capital cost. With all these diverse possibilities, Figure 4E.1 shows the
payback period for low potential black liquor electrolysis to vary from a low of 0.7
years to a moderately high value of 3.6 years.
Besides the electrolyzer, hydrogen storage will also need capital
investment. This analysis includes a compressed hydrogen storage facility for one
day production for a capital investment of 62300 Rs./kg (890 €/kg) (Khan and
Iqbal, 2005). Again, there is a lot of uncertainty for these cost values as also the
various storage options for hydrogen. Realistic estimates put the capital investment
for compressed hydrogen storage at 48300 Rs./kg (690 €/kg) in present scenario
with projected values of 26600 Rs./kg (380 €/kg) by 2015 (Kasseris et al., 2007).
If the 2015 projections were actually realized, low potential black liquor
electrolysis could have a payback period of as low as 0.4 years in the best
economic scenario.
Page 88
120
4E.2.1.2 Effect of gasoline price
Figure 4E.1 also reveals the economic sensitivity of low potential black
liquor electrolysis on gasoline price and electricity price. Keeping all other
parameters constant, except the gasoline price, equation (4E.5) reduces to
N = log [1 – {K3/(800000 Cgas – K4)}]/ log(1.04/1.06) (4E.7)
Where, K3 and K4 are constants dependent on economic conditions chosen, and
Cgas is the gasoline price. To see the effect of gasoline prices on the economic
performance of low potential black liquor electrolysis, simulations are shown in
Figure 4E.2 for different investment costs. Simulated economic performance, as
indicated by the payback period, shows a strong nonlinear dependence on gasoline
price. Payback period is all the more sensitive in the low gasoline price regimes.
This is certainly expected as sale proceeds from hydrogen would constitute the
major earning. With low investment costs, payback period less than 1 year should
be possible even with a gasoline price of 50 Rs./l (0.7 €/l). Even with high
investment costs the expected payback period is less than 1.5 years if the gasoline
price is 55 Rs./l (0.8 €/l) or more.
Gasoline prices are associated with lot of uncertainty and speculation, not
only due to economic reasons but also geopolitical considerations. According to
US Department of Energy (DOE) estimates, gasoline price is projected to be in the
range of 35 – 42 Rs./l (0.5 – 0.6 €/l) including 10 – 12% distribution and
marketing cost for expected crude price of around 4100 Rs./barrel (59 €/barrel or
85 USD/barrel) (USDOE, 2009). However, it is imperative to note here that crude
Page 89
121
Figure 4E.2. Effect of gasoline price on the economic performance of low potential black liquor electrolysis (electricity price Rs. 3500/MWh)
price has already touched 150 USD/barrel and can again reach such levels in
future. This is due to an ever increasing energy demand combined with dwindling
proven reservoirs as well as geopolitical factors. Current gasoline price in
Australia ranges from 55 – 63 Rs./l (0.8 to 0.9 €/l) (NRMA, Australian energy
market sources). Current average gasoline price in Europe (includes France,
Germany, Italy, and Spain) is 96 Rs./l (1.38 €/l) (IEA, 2007). In United Kingdom
gasoline sells in the price range of 100 – 105 Rs./l (1.4 – 1.5 €/l) (British market
sources). Current price in Canada is 50 Rs./l (0.7 €/l) (IEA, 2007). In India, with
0
0.5
1
1.5
2
2.5
3
3.5
0 20 40 60 80
Payb
ack
peri
od (y
ear)
Gasoline price (Rs./l)
Electrolyzer cost Rs. 28000/kW
Electrolyzer cost Rs. 49000/kW
Electrolyzer cost Rs. 70000/kW
Electrolyzer cost Rs. 91000/kW
Page 90
122
an administered price regime for petroleum derived fuels, the prevailing price of
gasoline is about 50 Rs./l (0.7 €/l), down from the high of about 58 Rs./l (0.85 €/l)
when the crude prices were at its peak.
4E.2.1.3 Effect of electricity price
The major operating cost involved in electrolysis would be the cost of
electricity. Keeping all other parameters constant, except the electricity price,
equation (4E.5) reduces to
N = log [1 – {K3/(K5 – 3300 Celec)}]/log(1.04/1.06) (4E.8)
Where, K5 is a constant dependent on economic conditions chosen, and Celec is the
electricity price. Simulated dependence of the economic performance of low
potential black liquor electrolysis on electricity price is presented in Figure 4E.3.
Payback period has a slight non linear dependence on the electricity price.
Compared to gasoline price, payback period is less sensitive to electricity price and
varies within a much narrower window. With a low capital cost, and gasoline price
of 55 Rs./l (0.8 €/l) (which is reasonable from the previous discussion), economic
breakeven should be achieved within 1 year for the entire range of electricity
prices. Even with high capital cost, the payback period is within 1.5 years for
electricity prices up to 2800 Rs./MWh (€ 40/MWh).
Again, large variations in the price of electricity prevail in the different
geographical regions of the globe. These may be due to choice and availability of
sources, market forces, as well as policy interventions. A Dutch study reports
electricity prices of 2800 – 4900 Rs./MWh (40 – 70 €/MWh) (Damen et al., 2007).
Page 91
123
It is reported to be 3100 Rs./MWh (44 €/MWh) in a Chinese study (Chang et al.,
2007). Price of electricity in India is around 3850 Rs./MWh (55 €/MWh) (Kothari
et al., 2008). Average US price of electricity for industrial consumption is 3000
Rs./MWh (43 €/MWh) (EIA USDOE, 2009).
Figure 4E.3. Effect of electricity price on the economic performance of low potential black liquor electrolysis (gasoline price Rs. 55/l)
4E.3 HIGH POTENTIAL ELECTROLYSIS
Referring to Chapter 4D, high potential black liquor electrolysis is more
attractive from the mill perspective as it could provide complete removal of
0
0.2
0.4
0.6
0.8
1
1.2
1.4
1.6
1.8
2
0 1000 2000 3000 4000 5000
Payb
ack
peri
od (y
ear)
Electricity price (Rs./MWh)
Electrolyzer cost Rs. 28000/kW
Electrolyzer cost Rs. 49000/kW
Electrolyzer cost Rs. 70000/kW
Electrolyzer cost Rs. 91000/kW
Page 92
124
organic pollutants with all inorganic chemicals recovered for reuse in the mill.
From the technical standpoint, however, it suffers the disadvantage of higher
electricity consumption. Using equations, (4E.2), (4E.3), and (4E.4), the payback
period for high potential black liquor electrolysis can be calculated as:
N = log [1 – {(1 – (1.04/1.06))(IEL + IHS – Sp)/((AEhyd + AElignin + AENaOH) –
(ACelec + ACcaust + AMEL))}]/log (1.04/1.06) (4E.9)
Where, AENaOH is the annual earning from NaOH produced and ACcaust is the
annual cost of causticizing. Similar to low potential electrolysis, here also a low
investment cost, low electricity price and a high gasoline price would be
economically favourable. In addition, for high potential black liquor electrolysis,
sodium carbonate recovered and subsequently causticized to sodium hydroxide
would carry significant economic value. On the other hand causticizing would
involve expenditure. With all these considerations, in the best case scenario, high
potential black liquor electrolysis should have a payback period of 0.7 years. This
value is 14.5 years in the worst case scenario. It is apparent that high potential
electrolysis is much more sensitive to economic scenarios compared to low
potential electrolysis.
4E.3.1 Sensitivity analysis
4E.3.1.1 Effect of capital costs
Keeping all other parameters constant, except the capital cost of the
electrolyzer, equation (4E.9) reduces to
N = log [1 – (0.0163 IEL + K6)/(K7 – 0.05 IEL)]/log(1.04/1.06) (4E.10)
Page 93
125
Where, K6 and K7 are constants dependent on economic conditions chosen.
Economic dependence of high potential black liquor electrolysis on the capital
costs of the electrolyzer is shown in Figure 4E.4.
Figure 4E.4. Effect of capital costs on the economic performance of high potential black liquor electrolysis
There is almost a proportional increase in payback period with increasing capital
cost of the electrolyzer. Payback period would be upwardly revised by more than
100% if the electrolyzer capital cost increases from a low of 28000 Rs./kW (400
€/kW) to a high value of 91000 Rs./kW (1300 €/kW). In most of the economic
0
1
2
3
4
5
6
7
8
9
0 50000 100000
Payb
ack
peri
od (y
ear)
Electrolyzer cost (Rs./kW)
Gasoline price Rs. 35/l, electricity price Rs. 3500/MWh, NaOH price Rs. 14000/MtGasoline price Rs. 55/l, electricity price Rs. 3500/MWh, NaOH price Rs. 14000/MtGasoline price Rs. 70/l, electricity price Rs. 3500/MWh, NaOH price Rs. 14000/MtGasoline price Rs. 55/l, electricity price Rs. 2100/MWh, NaOH price Rs. 14000/MtGasoline price Rs. 55/l, electricity price Rs. 2100/MWh, NaOH price Rs. 19000/Mt
Page 94
126
scenarios, however, a payback period of around 2.5 years should be possible which
makes reasonable economic sense. As for low potential electrolysis, here again,
the hydrogen storage cost would contribute to the total capital cost. If the best
projections on this front are realized and all other economic conditions are
favourable, the payback period could be as low as 0.3 years.
4E.3.1.2 Effect of gasoline price
From the analysis for low potential electrolysis it was borne out that the
gasoline price has a profound influence on the economic performance. Keeping all
other parameters constant, except the gasoline price, equation (4E.9) reduces to
N = log [1 – {K8/(3.1×107 Cgas – K9)}]/ log(1.04/1.06) (4E.11)
Where, K8 and K9 are constants dependent on economic conditions chosen.
Analysis for high potential black liquor electrolysis is depicted in Figure 4E.5. The
dependence of payback period on gasoline price is nonlinear. It can be seen that
there is a steep increase in payback period if the gasoline price falls below 50 Rs/l
(0.7 €/l). For a gasoline price of 63 Rs./l (0.9 €/l) and above a payback period of 2
years or less should be achievable for all capital cost regimes. Running high
potential electrolysis would not be a sound investment if the gasoline price is less
than about 50 Rs./l (0.7 €/l) with the electrolyzer cost also high.
Page 95
127
Figure 4E.5. Effect of gasoline price on the economic performance of high potential black liquor electrolysis (electricity price Rs. 3500/MWh, NaOH price Rs. 14000/t)
4E.3.1.3 Effect of electricity price
Keeping all other parameters constant, except the electricity price, equation
(4E.9) reduces to
N = log [1 – {K8/(K10 – 1.79×10⁵ Celec)}]/log(1.04/1.06) (4E.12)
Where, K5 is a constant dependent on economic conditions chosen. With gasoline
price 55 Rs./l (0.8 €/l), the payback period for high potential black liquor
electrolysis should be 3 years or less for any electricity price or capital cost. The
simulations are shown in Figure 4E.6. The non linearity in the variation of payback
period with electricity price is much less than that observed for gasoline price.
0
1
2
3
4
5
6
7
8
9
0 20 40 60 80
Payb
ack
peri
od (y
ear)
Gasoline price (Rs./l)
Electrolyzer cost Rs. 28000/kW
Electrolyzer cost Rs. 49000/kW
Electrolyzer cost Rs. 70000/kW
Electrolyzer cost Rs. 91000/kW
Page 96
128
Even with moderately high electrolyzer cost, the payback on investment is
expected to be achieved within nearly 2 years if electricity price does not exceed
3500 Rs./MWh (50 €/MWh). As discussed above such electricity prices are quite
reasonable. Payback periods of about 3 years should also be acceptable for running
high potential electrolysis given its immense environmental benefits.
Environmental gains are often considered as economic externalities; but this
conception is fast changing.
Figure 4E.6. Effect of electricity price on the economic performance of high potential black liquor electrolysis (gasoline price Rs. 55/l, NaOH price Rs. 14000/t)
0
0.5
1
1.5
2
2.5
3
3.5
0 1000 2000 3000 4000 5000
Payb
ack
peri
od (y
ear)
Electricity price (Rs./MWh)
Electrolyzer cost Rs 28000/kW
Electrolyzer cost Rs 49000/kW
Electrolyzer cost Rs 70000/kW
Electrolyzer cost Rs 91000/kW
Page 97
129
It was argued in Chapter 4D that if the electricity required for the
electrolysis could be sourced from a carbon neutral source (e.g. wind, solar, etc.)
the hydrogen replacing gasoline could curb significant amounts of CO2 emission
earning valuable carbon credits for the mill. With the advancements in technology
and increased market penetration electricity from renewables, especially from
wind should be economically competitive. Cost of electricity from wind is
reported to be in the range of 2100 – 4900 Rs./MWh (30 – 70 €/MWh) (Afgan et
al., 2007; Griener et al., 2007). In the last couple of decades wind energy
technology has matured as one of the most encouraging renewable energy sources
(Hoogwijk et al., 2004; Kose et al. 2004). For developing countries it opens a
window of economic opportunity as well. Carbon credits are tradable economic
instruments. In the European Climate Exchange, future contracts price for trading
of carbon credits have varied between 1400 – 1750 Rs./t (20 – 25 €/t) in the first
three months of 2008 (ECE, 2008). The current prices are in the range of 900 –
1050 Rs./t (13 – 15 €/t) owing to a decrease in demand arising out of the economic
downturn.
4E.3.1.4 Effect of sodium hydroxide price
One of the important value added products from high potential black liquor
electrolysis is sodium carbonate which can be causticized to sodium hydroxide for
reuse in pulping. Economic value associated with this should, therefore have a
positive influence. Price of sodium hydroxide depends upon many factors;
important ones being the demand push or pull, not only for sodium hydroxide
itself, but more so for chlorine, the accompanying product in brine electrolysis. As
Page 98
130
a result, large variation in the sodium hydroxide price can be noticed. Keeping all
other parameters constant, except the sodium hydroxide price, equation (4E.9)
reduces to
N = log [1 – {K8/(12665 CNaOH + K11)}]/ log(1.04/1.06) (4E.13)
Where, K11 is a constant dependent on economic conditions chosen, and CNaOH is
the NaOH price. The simulated effect of the price of sodium hydroxide on the
payback period for high potential black liquor electrolysis is shown in Figure 4E.7.
Figure 4E.7. Effect of NaOH price on the economic performance of high potential black liquor electrolysis (gasoline price Rs. 55/l, electricity price Rs. 3500/MWh)
0
0.5
1
1.5
2
2.5
3
10000 15000 20000 25000
Payb
ack
peri
od
NaOH price (Rs./t)
Electrolyzer cost Rs 28000/kW
Electrolyzer cost Rs 49000/kW
Electrolyzer cost Rs 70000/kW
Electrolyzer cost Rs 91000/kW
Page 99
131
Compared to other economic parameters sodium hydroxide price has a less
pronounced effect and the payback period decreases almost in proportion to the
increase in price. With the more likely prices of electricity and gasoline as
discussed above payback period for high potential black liquor electrolysis should
be within 2.5 years if the sodium hydroxide prices are at least 17500 Rs./t (250
€/t).
4E.3.1.5 Other factors
In the previous chapter it was revealed that significant amount of process
heat would be available in high potential black liquor electrolysis for mill use. The
exact economic value for this could not be ascertained as it would depend on the
manner of its recovery and how a particular mill makes use of it. However, this
available process heat should certainly have a positive economic contribution and
bring down the payback period.
On the basis of equivalent biofuels a reasonable upper limit for lignin price
could be between 1050 Rs./MWh (15 €/MWh) (Axelsson et al., 2006) and 850
Rs./MWh (12 €/MWh) (Wising et al., 2006). In the present analysis lignin price of
1050 Rs./MWh (15 €/MWh) has been used. Lignin price would probably be higher
than 1750 Rs./MWh (25 €/MWh) if lignin were used e.g. as raw material for
specialty chemicals or as a replacement for fossil fuels (Olsson et al., 2006). The
market for lignin as a specialty chemical, however, is limited in volume at present
(Axelsson et al., 2006). Sulfur free lignin from small facilities, which typically use
soda process, can attract higher price as biofuel as well.