29
1 Chapter 5 Demand Forecasting
| Date post: | 02-Jan-2016 |
| Category: |
Documents |
| Upload: | wendy-cash |
| View: | 20 times |
| Download: | 0 times |

1
Chapter 5
Demand Forecasting

2
1.Importance of Forecasting
Helps planning for long-term growth
Helps in gauging the economic activity (auto sales, new home sales, electricity demand)
Reduces risk and uncertainty in managerial decisions.

3
Types of Forecasts
Qualitative Forecasts- Forecasts based on the survey of experienced managers
Quantitative Forecasts- Forecasts based on statistical analysis (Trend projections)

4
2.Qualitative ForecastsSurveys and opinion polls are used to:
Make short-term forecasts when quantitative data are not available
Supplement quantitative forecasts
Forecast demand for new products for which data do not exist.

5
2:Qualitative Forecasts: Examples
Surveys of business executives plant and equipment expenditure plans
Surveys of plans for inventory change and expectations
Surveys of consumers’ expenditure plans

6
Opinion polls -Executive polling
-Sales force polling
-Consumer intention polling

7
4.Quantitative Forecast Methods
Time Series Analysis - use of past values of an economic variable in order to predict its future value.
Trend Projections (linear trend, growth rate trend).
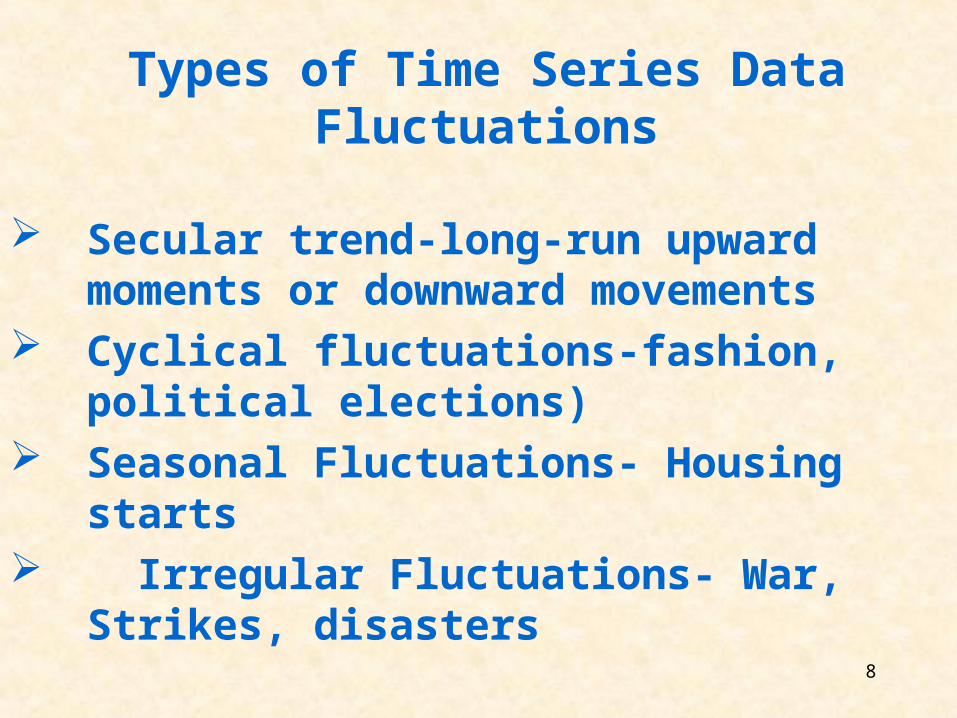
Types of Time Series Data Fluctuations
Secular trend-long-run upward moments or downward movements
Cyclical fluctuations-fashion, political elections)
Seasonal Fluctuations- Housing starts
Irregular Fluctuations- War, Strikes, disasters
8

9
Cyclical fluctuations - major expansions and contractions in economic data series which recur every several years (Housing construction, auto demand).
Seasonal variation - regular fluctuations in economic activity during each year as caused by weather or social customs (Housing starts, Christmas sales).

10
Irregular or random fluctuations variation in data series due to unique events such as war, natural disaster, and strikes.

11
6. Trend ProjectionExtension of past changes in time series data into the future (sales, interest rate, stock value forecasting)
a)Constant amount of change or growth
Sales = f(time trend)
St = a + bt constant amount
of growth
12
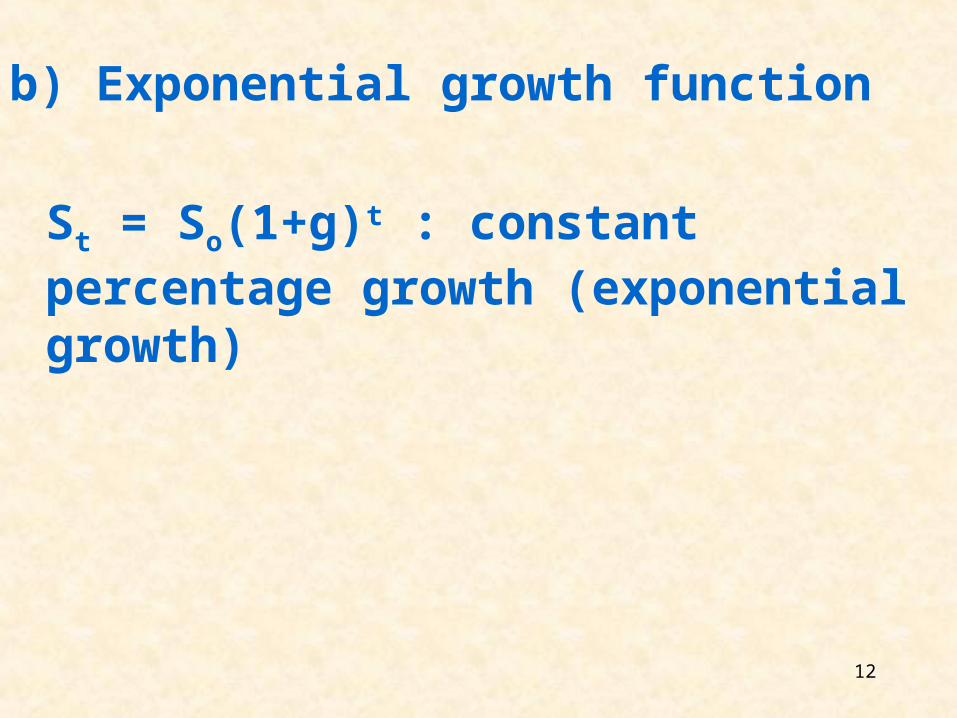
b) Exponential growth function
St = So(1+g)t : constant percentage growth (exponential growth)

13
6a. Linear Trend Projection

14
Demand for Electricity in KWH(million)
Year St t Year St t92-1 11 1 94-1 14 9 -2 15 2 -2 18 10 -3 12 3 -3 15 11 -4 14 4 -4 17 12 93-1 12 5 95-1 15 13 -2 17 6 -2 20 14 -3 13 7 -3 16 15 -4 16 8 -4 19 16
15
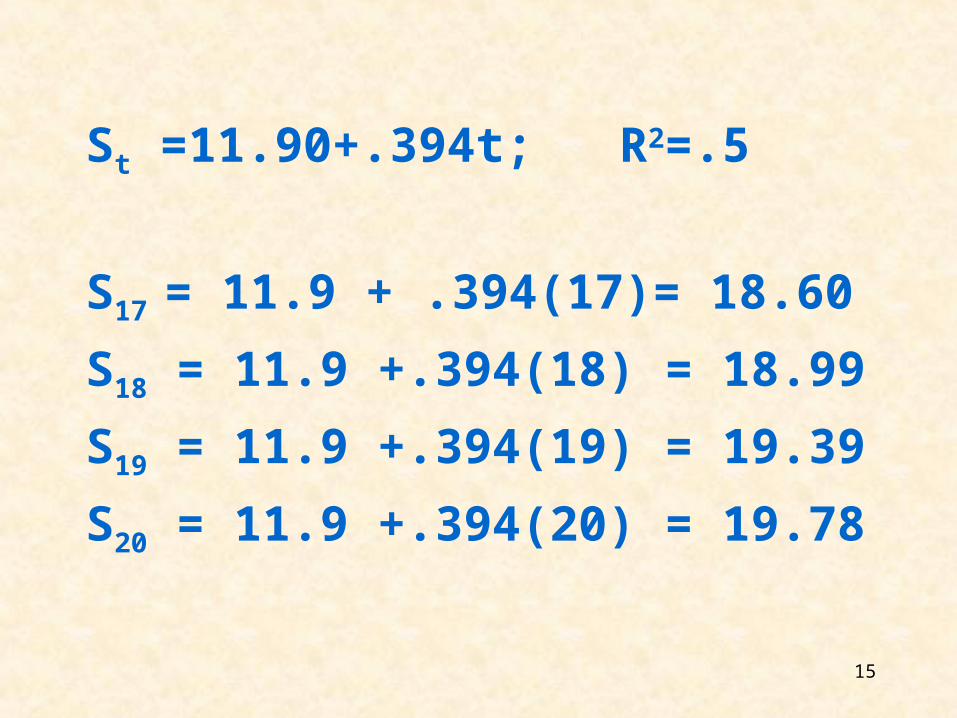
St =11.90+.394t; R2=.5
S17 = 11.9 + .394(17)= 18.60
S18 = 11.9 +.394(18) = 18.99
S19 = 11.9 +.394(19) = 19.39
S20 = 11.9 +.394(20) = 19.78

16
6b. Exponential Growth ProjectionModel: St = S0 ( 1 +g)t
ln St = lnS0 + t ln(1 + g)
Year lnSt t
92.1 2.398 1
. . .
. . .
. . .
95.4 2.944 16

17
ln St = 2.49 + .026t
Taking the antilog of both sides yields,
St= 12.06(1.026)t; R2= .5
S17 = 12.06(1.026)17 = 18.76
S18 = 12.06(1.026)18 = 19.14
S19 = 12.06(1.026)19 = 19.64
S20 = 12.06(1.026)20 = 20.15
tt gSS )1(0

18
Notice that forecasts based on linear trend model tend to be less accurate the further one forecasts into the future.
19
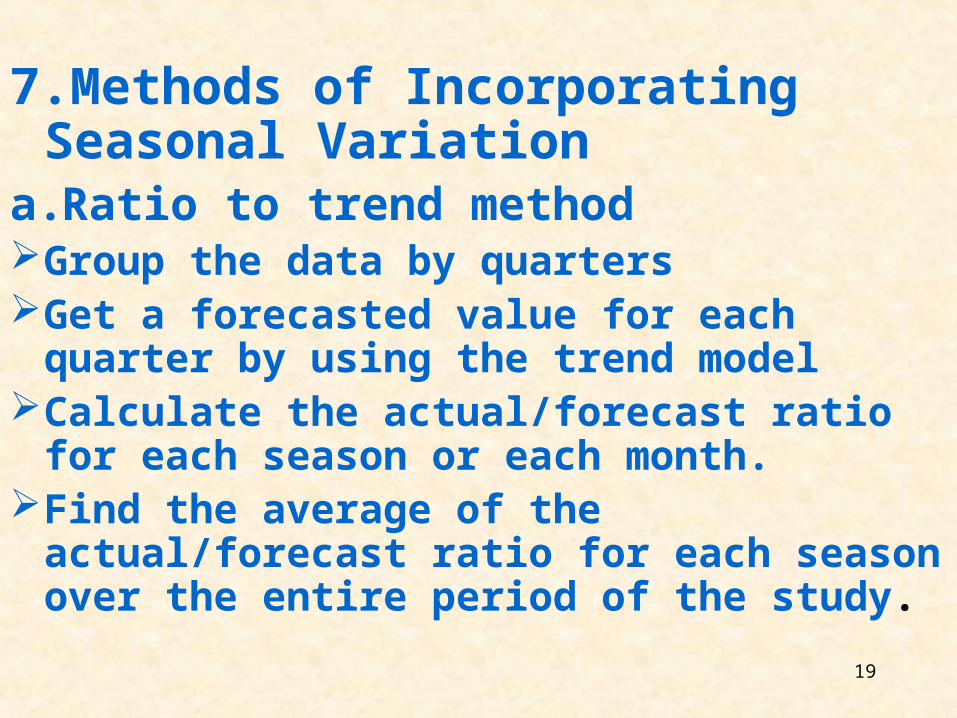
7.Methods of Incorporating Seasonal Variation
a.Ratio to trend methodGroup the data by quartersGet a forecasted value for each quarter by using the trend model
Calculate the actual/forecast ratio for each season or each month.
Find the average of the actual/forecast ratio for each season over the entire period of the study.

20
b. The dummy variable methodMultiply each unadjusted forecasted value of the economic variable by its corresponding seasonal adjusting factor.
Include n-1 dummy variables in the trend equation and run the regression.

21
Time-Series Growth Patterns
Y
tt ̂
Time(t)
tt g)1(ˆ
0
Y
Time(t) Time(t)
Y
2ˆ cttt
(a)Linear trend (b)Exponential growth trend
(c)Declining rate of growth trend

22
8.Some shortcomings of Time Series Analysis
Assumes that past behaviors will be repeated in the future
Cannot forecast turning pointsDoes not examine the underlying causes of fluctuations in economic variables.

23
9.Smoothing Techniques (Irregular Time Series Data)
Refer to the methods of predicting future values of a time series on the basis of an average of its past values only
They are used when the data show irregular variation (random).

24
a. Moving Averages Help to generate acceptable future period
value of a variable when the time series are subject to random fluctuations.
-See, Table 5-5 in the handout 3-quarter vs 5-quarter Moving Average
Forecasts and Comparison
Objective: Forecast 13th quarter value,
given time series data for the previous 12 quarters

25
Choose the appropriate period based on the lowest RMSE.
RMSE= At = actual value of the time series in period t.
Ft = the forecasted value of the time series in period t.
Problem: Gives equal weight to
each period
nFA tt /)( 2

26
b. Exponential smoothing
- a smoothing technique in which the forecast for period t+1 is a weighted average of the actual (At)and forecasted values(Ft) of the time series in period t.

27
Ft+1 = wAt + (1-w)Ft
where Ft+1 = the forecast of F in period t +1.
w= the weight assigned to the
actual value of the time
series, 0<w<1.
1-w = the weight assigned to
the forecasted value of
the time series.

28
10. Using Econometric Models to Forecast
AdvantagesSeek to explain the economic phenomenon being forecasted- i.e. enables mgt to assess the impact of changes in policies (price, Ad)
Predict the direction and magnitude of change

29
Models can be modified based on the comparison of actual and forecast value.
Examples:
Comment: The above advantages have to be weighed against the difficulties of getting the forecast values of each of the explanatory variables.


