National Science Board | 5 | 1 Science & Engineering Indicators 2018 Table of Contents Highlights ................................................................................................................................................................................. 5-5 Spending for Academic R&D .............................................................................................................................................. 5-5 Infrastructure for Academic R&D ....................................................................................................................................... 5-6 Doctoral Scientists and Engineers in Academia ............................................................................................................... 5-6 Outputs of S&E Research: Publications.............................................................................................................................. 5-8 Introduction............................................................................................................................................................................. 5-9 Chapter Overview ................................................................................................................................................................. 5-9 Chapter Organization ......................................................................................................................................................... 5-10 Expenditures and Funding for Academic R&D .................................................................................................................. 5-11 National Academic R&D Expenditures in All Fields......................................................................................................... 5-12 National Academic R&D Spending ................................................................................................................................... 5-16 Sources of Support for Academic R&D ........................................................................................................................... 5-18 Academic R&D Expenditures, by Field ............................................................................................................................. 5-29 Academic R&D, by Public and Private Institutions ......................................................................................................... 5-31 Infrastructure for Academic R&D ....................................................................................................................................... 5-40 Research Facilities ............................................................................................................................................................... 5-40 Research Equipment .......................................................................................................................................................... 5-49 Cyberinfrastructure ............................................................................................................................................................ 5-51 Doctoral Scientists and Engineers in Academia ............................................................................................................... 5-53 Trends in Academic Employment of S&E Doctorate Holders ........................................................................................ 5-57 Academic Researchers ....................................................................................................................................................... 5-76 Academic Employment in Postdoc Positions ................................................................................................................. 5-80 Federal Research Support of S&E Doctorate Holders Employed in Academia ........................................................... 5-84 Outputs of S&E Research: Publications ............................................................................................................................. 5-92 Publication Output, by Country....................................................................................................................................... 5-109 Publication Output, by U.S. Sector .................................................................................................................................. 5-113 Coauthorship and Collaboration in S&E Literature ...................................................................................................... 5-117 Trends in Citation of S&E Publications ........................................................................................................................... 5-133 Conclusion ........................................................................................................................................................................... 5-148 Glossary ............................................................................................................................................................................... 5-149 Definitions.......................................................................................................................................................................... 5-149 Key to Acronyms and Abbreviations............................................................................................................................... 5-150 References ........................................................................................................................................................................... 5-151 List of Sidebars Data on the Financial and Infrastructure Resources for Academic R&D ................................................................................ 5-12 Established Program to Stimulate Competitive Research ........................................................................................................ 5-25 Data on Doctoral Scientists and Engineers in Academia .......................................................................................................... 5-54 CHAPTER 5 Academic Research and Development
Spending for Academic R&D .............................................................................................................................................. 5-5Infrastructure for Academic R&D ....................................................................................................................................... 5-6Doctoral Scientists and Engineers in Academia ............................................................................................................... 5-6Outputs of S&E Research: Publications.............................................................................................................................. 5-8
Expenditures and Funding for Academic R&D.................................................................................................................. 5-11
National Academic R&D Expenditures in All Fields......................................................................................................... 5-12National Academic R&D Spending ................................................................................................................................... 5-16Sources of Support for Academic R&D ........................................................................................................................... 5-18Academic R&D Expenditures, by Field ............................................................................................................................. 5-29Academic R&D, by Public and Private Institutions ......................................................................................................... 5-31
Infrastructure for Academic R&D ....................................................................................................................................... 5-40
Research Facilities............................................................................................................................................................... 5-40Research Equipment .......................................................................................................................................................... 5-49Cyberinfrastructure ............................................................................................................................................................ 5-51
Doctoral Scientists and Engineers in Academia ............................................................................................................... 5-53
Trends in Academic Employment of S&E Doctorate Holders ........................................................................................ 5-57Academic Researchers ....................................................................................................................................................... 5-76Academic Employment in Postdoc Positions ................................................................................................................. 5-80Federal Research Support of S&E Doctorate Holders Employed in Academia ........................................................... 5-84
Outputs of S&E Research: Publications ............................................................................................................................. 5-92
Publication Output, by Country....................................................................................................................................... 5-109Publication Output, by U.S. Sector.................................................................................................................................. 5-113Coauthorship and Collaboration in S&E Literature ...................................................................................................... 5-117Trends in Citation of S&E Publications ........................................................................................................................... 5-133
Definitions.......................................................................................................................................................................... 5-149Key to Acronyms and Abbreviations............................................................................................................................... 5-150
Data on the Financial and Infrastructure Resources for Academic R&D ................................................................................ 5-12Established Program to Stimulate Competitive Research ........................................................................................................ 5-25Data on Doctoral Scientists and Engineers in Academia .......................................................................................................... 5-54
Foreign-Trained Academic S&E Doctoral Workforce.................................................................................................................. 5-55Postdoctoral Researchers ............................................................................................................................................................. 5-84Open Access ................................................................................................................................................................................... 5-93Bibliometric Data and Terminology............................................................................................................................................. 5-97Bibliometric Data Filters............................................................................................................................................................. 5-104S&E Publication Patterns, by Gender ....................................................................................................................................... 5-129
List of Tables
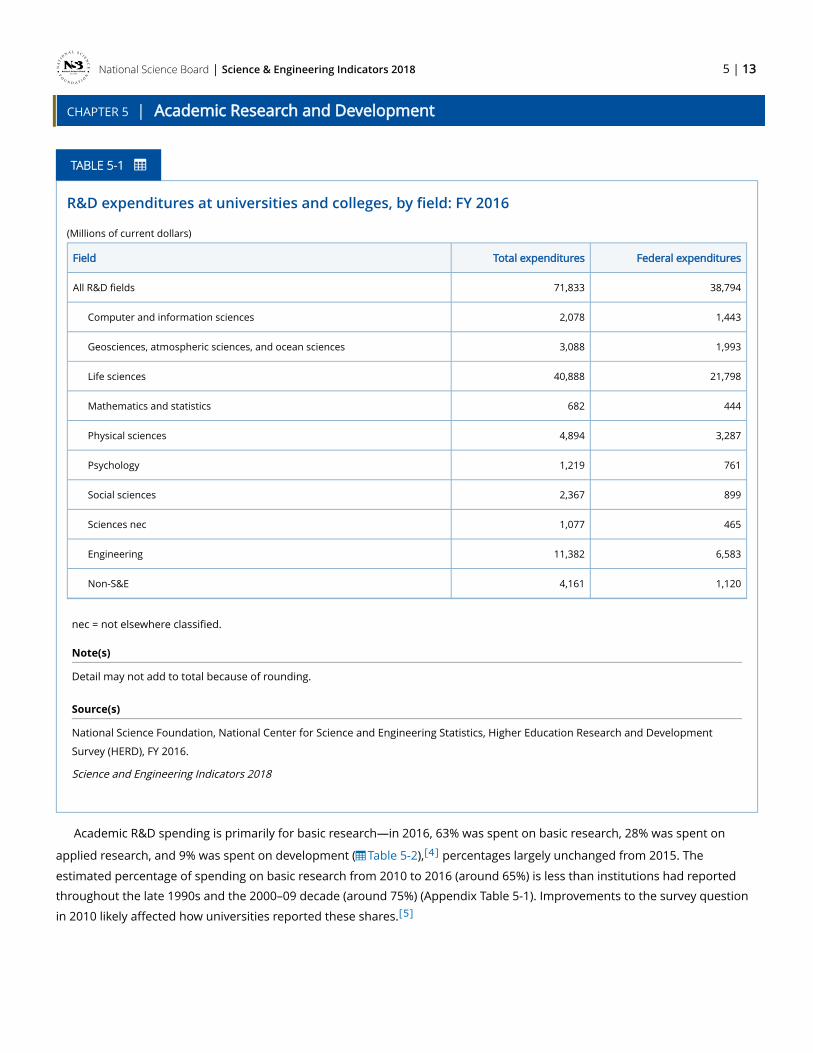
R&D expenditures at universities and colleges, by field: FY 2016................................................................... 5-13Table 5-1
Higher education R&D expenditures, by source, character of work, and institution type:FYs 2012–16 ........................................................................................................................................................... 5-14
Table 5-2
Higher education R&D expenditures, by Carnegie classification, institution type, and typeof cost: FY 2016 ..................................................................................................................................................... 5-17
Table 5-3
Top six federal agencies' shares of federally funded academic R&D expenditures: FYs2007–16.................................................................................................................................................................. 5-21
Table 5-4
Federal funding of academic S&E R&D, by agency and field: FY 2016 ........................................................... 5-24Table 5-5
EPSCoR and EPSCoR-like program budgets, by agency: FYs 2002–16 ............................................................ 5-26Table 5-A
Growth of academic R&D expenditures, by field: FYs 1997–2016................................................................... 5-30Table 5-6
Total and institutionally funded R&D expenditures at universities and colleges, by fiscalyear, institution type, and Carnegie classification: FYs 2012–16 ..................................................................... 5-32
Table 5-7
Higher education R&D expenditures at all universities and colleges financed byinstitutional funds, by source, fiscal year, institution type, and Carnegie classification: FYs2012–16.................................................................................................................................................................. 5-34
Table 5-8
Condition of S&E research space in academic institutions, by field: FY 2015 ............................................... 5-44Table 5-9
New construction of S&E research space in academic institutions, by field and time ofconstruction: FYs 2006–17 ................................................................................................................................... 5-46
Table 5-10
Foreign-trained S&E doctorate holders employed in academia, by degree field and sex: 2015................. 5-56Table 5-B
Foreign-trained S&E doctorate holders employed in academia, by research and teachingfocus: 2015............................................................................................................................................................. 5-57
Table 5-C
Tenure status, by field of S&E doctorate holders employed in academia: 1995 and 2015 ......................... 5-62Table 5-11
Tenure status of S&E doctorate holders employed in academia, by age: 1995 and 2015........................... 5-63Table 5-12
Tenure status of S&E doctorate holders employed in academia, by career stage and fieldof doctorate: 2015 ................................................................................................................................................ 5-65
Table 5-13
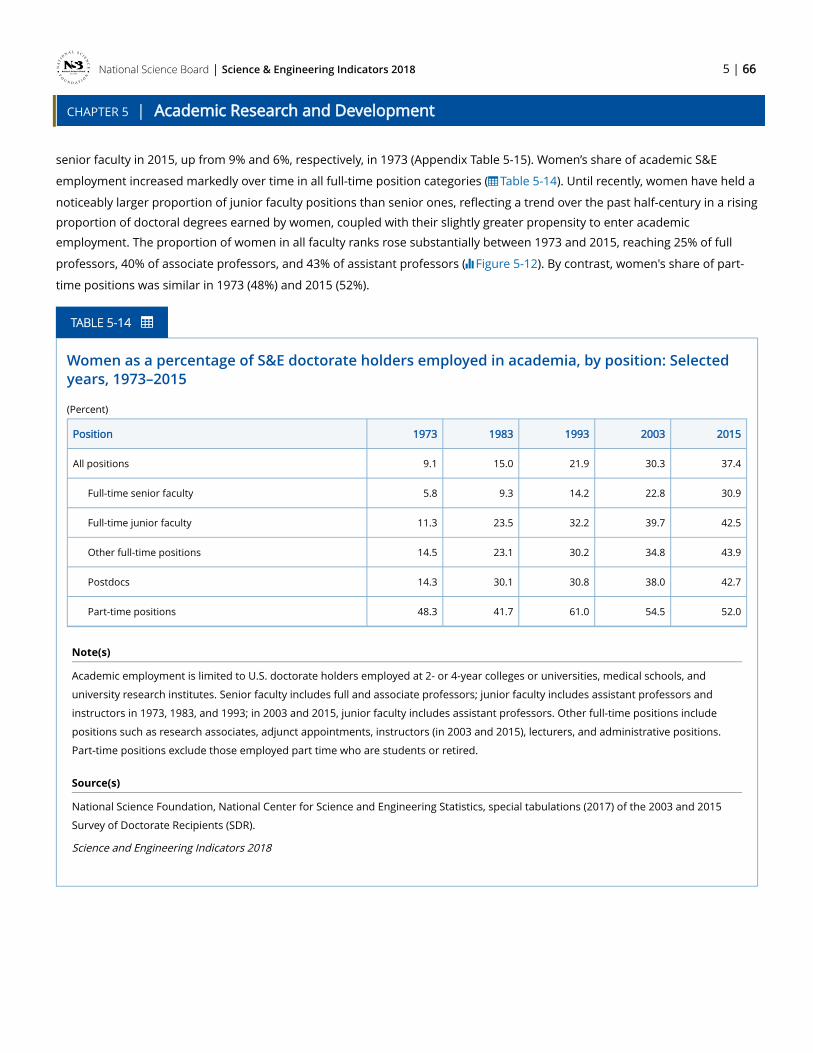
Women as a percentage of S&E doctorate holders employed in academia, by position:Selected years, 1973–2015 .................................................................................................................................. 5-66
Table 5-14
Tenured S&E doctorate holders employed in academia, by sex and field: 1995 and 2015......................... 5-69Table 5-15
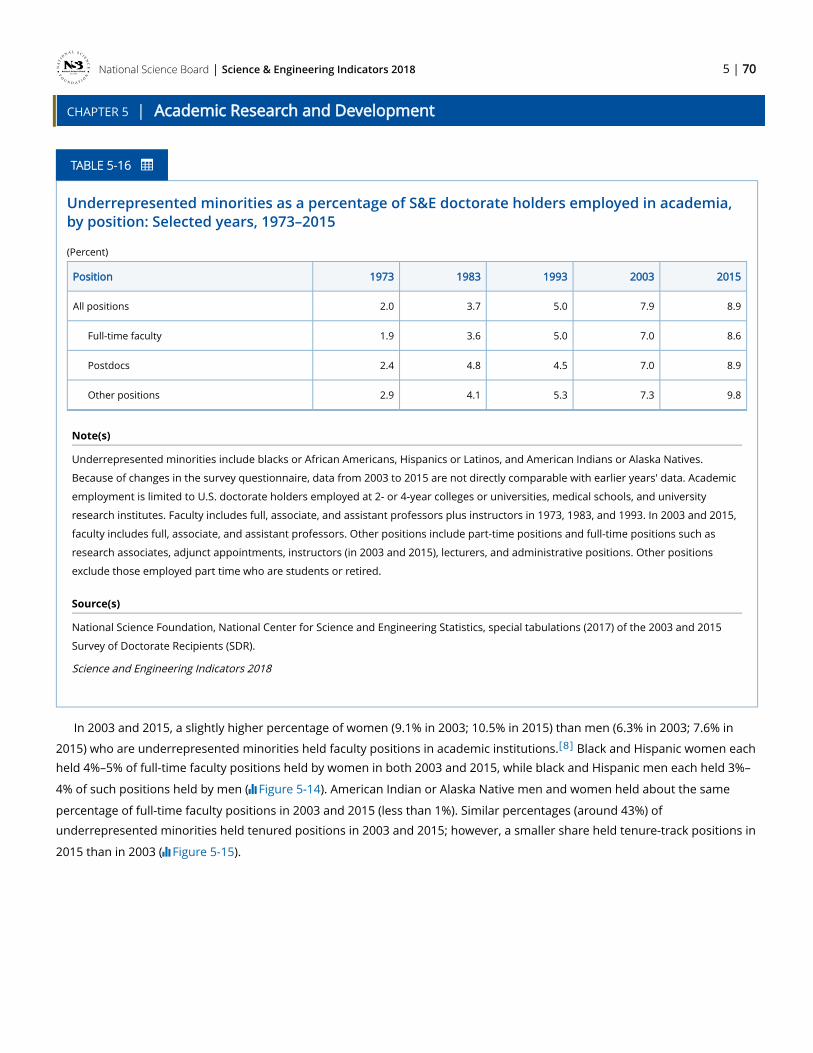
Underrepresented minorities as a percentage of S&E doctorate holders employed inacademia, by position: Selected years, 1973–2015 .......................................................................................... 5-70
Table 5-16
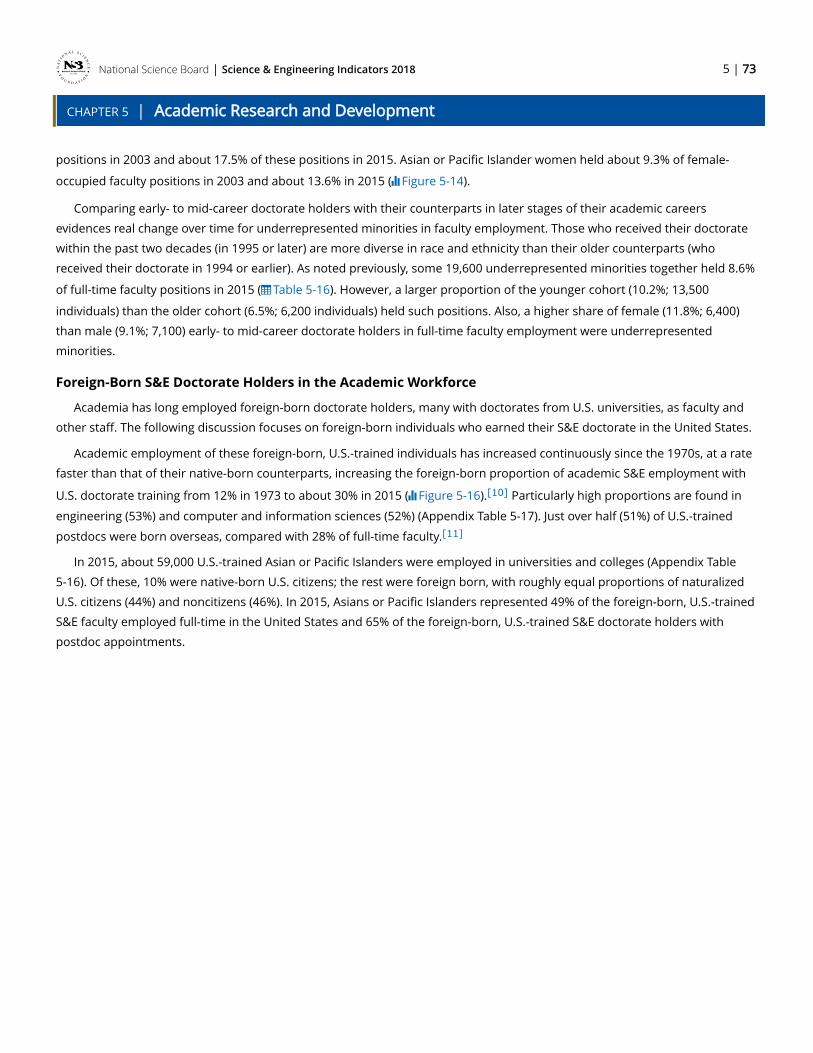
S&E doctorate holders employed in academia, by age: 1995 and 2015 ........................................................ 5-75Table 5-17
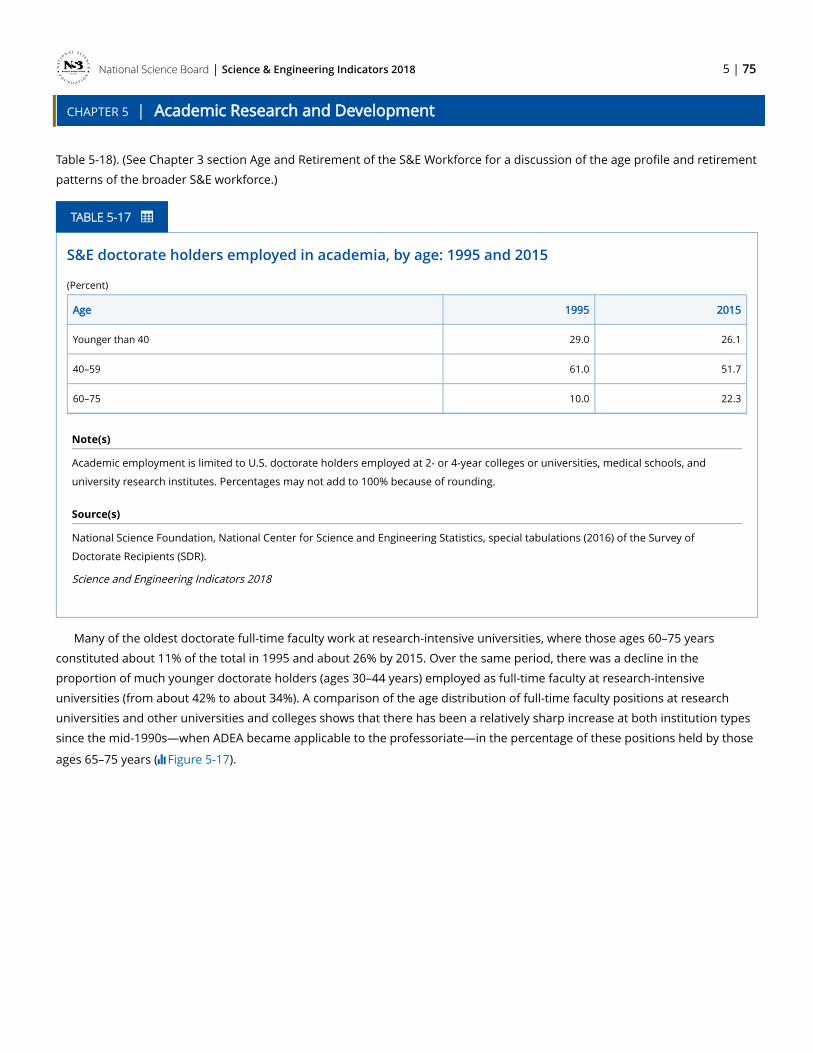
Full-time S&E faculty reporting research as primary work activity, by years sincedoctorate and degree field: 2015........................................................................................................................ 5-79
Table 5-18
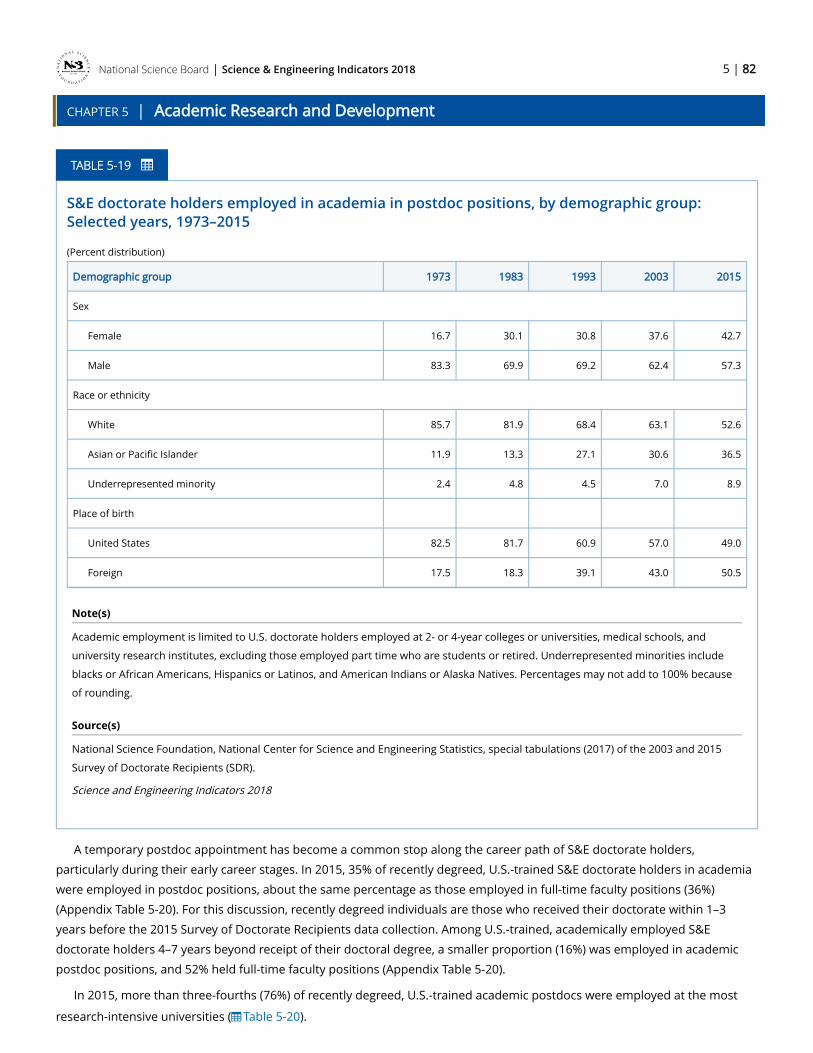
S&E doctorate holders employed in academia in postdoc positions, by demographic group:Selected years, 1973–2015 .................................................................................................................................. 5-82
Table 5-19
S&E doctorate holders employed in academia in postdoc positions, by Carnegieclassification of employer and years since doctorate: 2015............................................................................ 5-83
NIH and NSF research grant applications and funding success rates: 2001–16 ........................................... 5-87Table 5-21
S&E articles in all fields, by country or economy: 2006 and 2016 ................................................................ 5-101Table 5-22
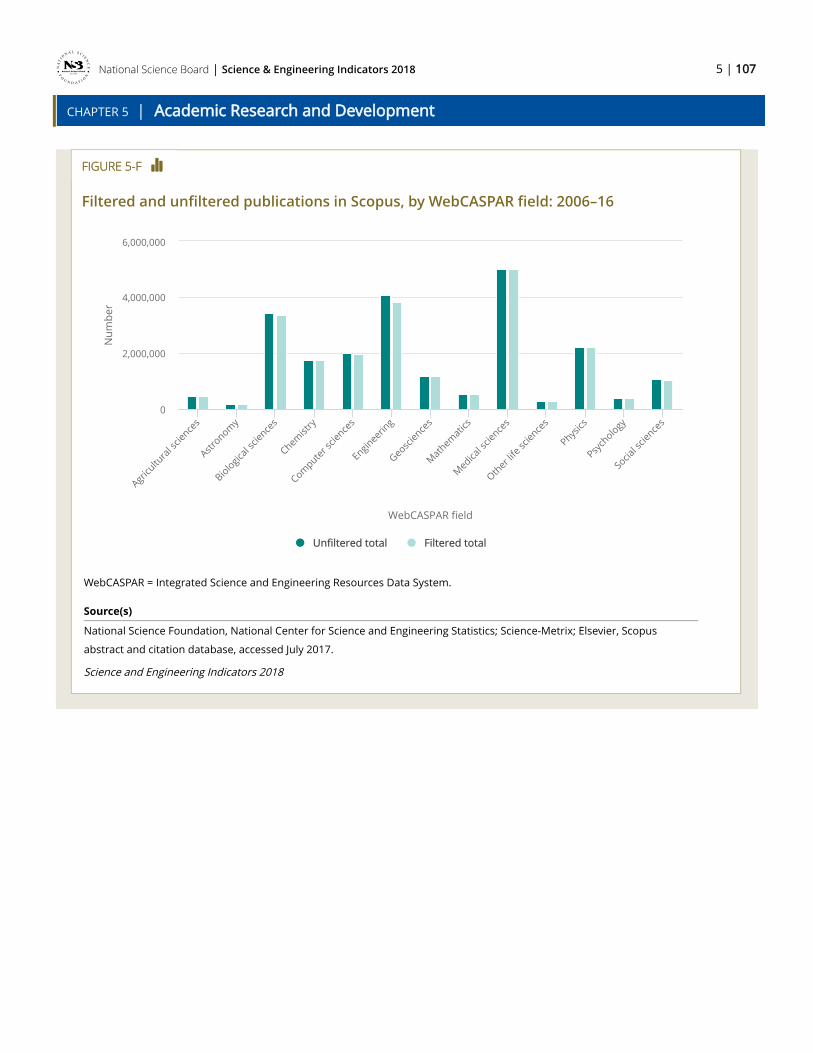
Number of titles and publications filtered from the Scopus database........................................................ 5-108Table 5-D
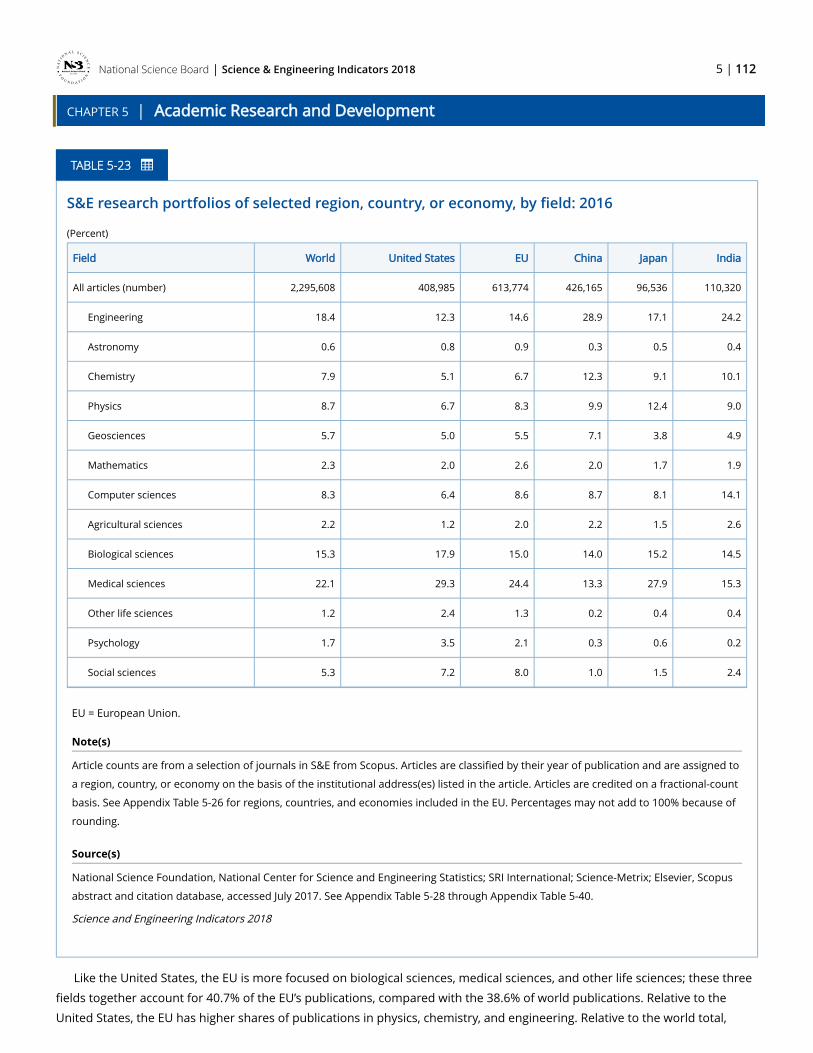
S&E research portfolios of selected region, country, or economy, by field: 2016....................................... 5-112Table 5-23
Share of U.S. S&E articles, by sector and field: 2016 ...................................................................................... 5-116Table 5-24
Shares of U.S. sector publications coauthored with other U.S. sectors and foreigninstitutions: 2006 and 2016 ............................................................................................................................... 5-120
Table 5-25
International coauthorship of S&E articles with the United States, by selected countryor economy: 2016 ............................................................................................................................................... 5-125
Table 5-26
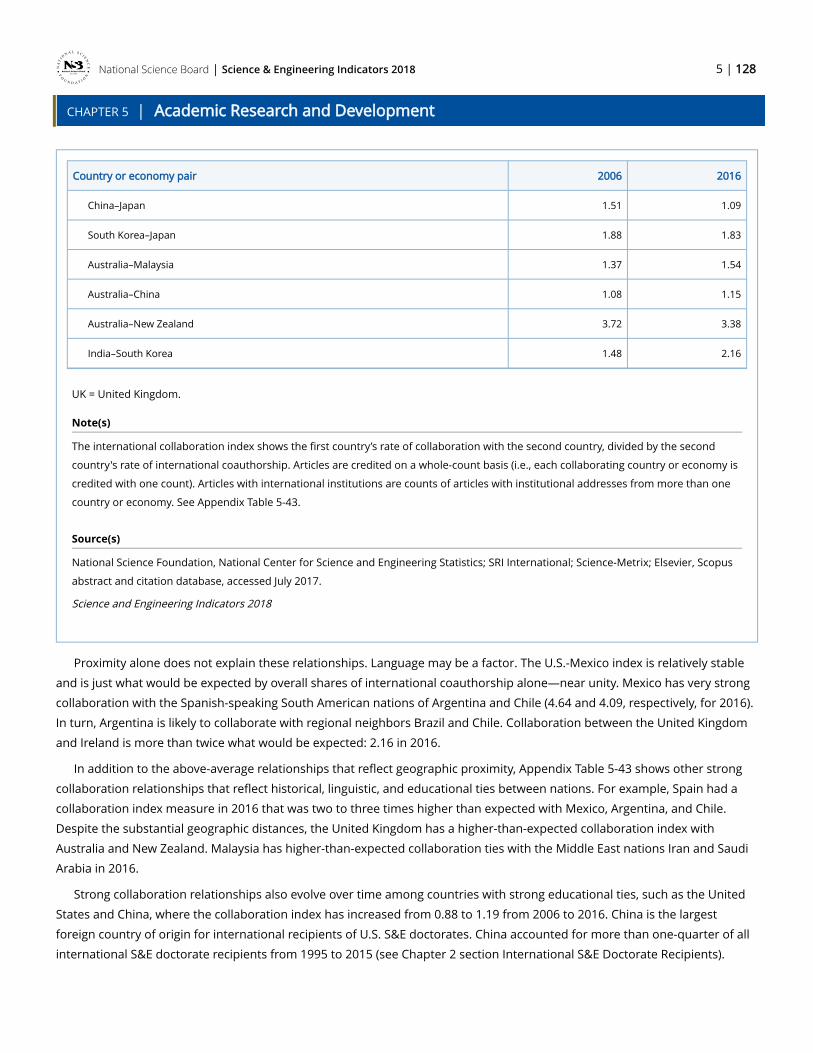
Index of international collaboration on S&E articles, by selected country or economypair: 2006 and 2016............................................................................................................................................ 5-127
Table 5-27
Relative citation index, by selected region, country, or economy pair: 2014 .............................................. 5-136Table 5-28
Academic R&D expenditures, by source of funding: FYs 1972–2016.............................................................. 5-19Figure 5-1
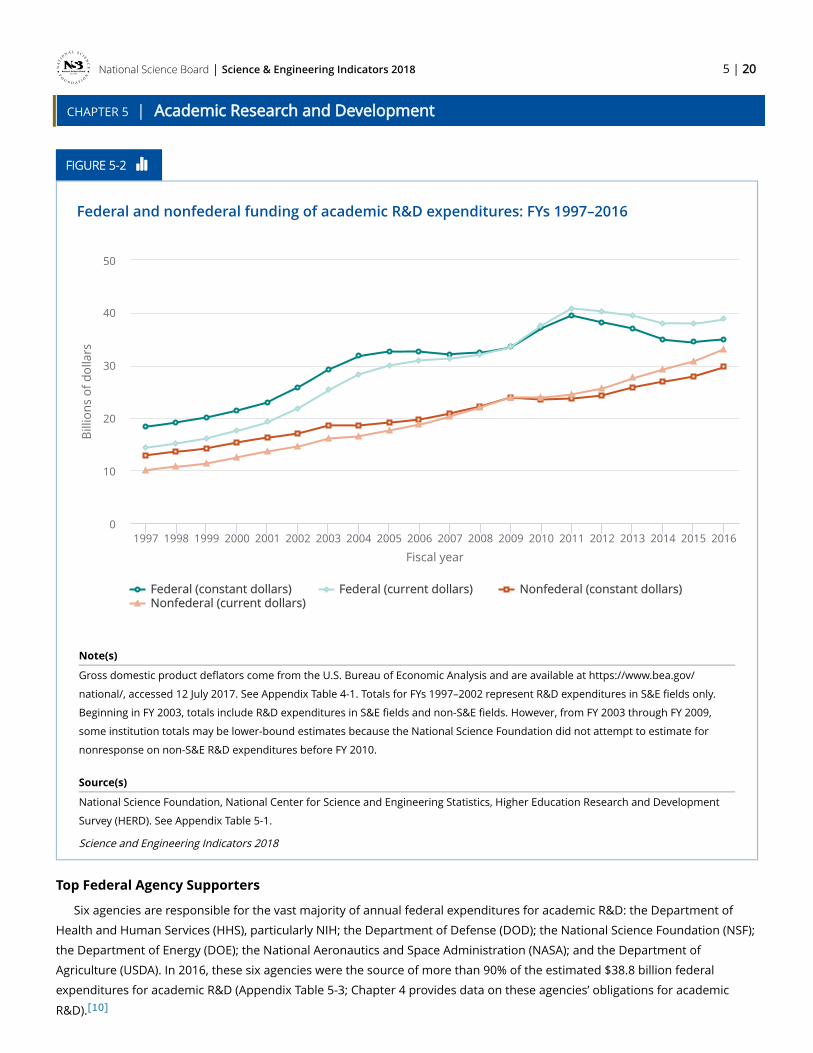
Federal and nonfederal funding of academic R&D expenditures: FYs 1997–2016....................................... 5-20Figure 5-2
Federally financed academic R&D expenditures, by agency and S&E field: FY 2016 ................................... 5-22Figure 5-3
Sources of R&D funding for public and private academic institutions: FY 2016........................................... 5-36Figure 5-4
Share of academic R&D, by institution rank in R&D expenditures: FYs 1997–2016...................................... 5-37Figure 5-5
Change in S&E research space in academic institutions, by 2-year period: FYs 1988–2015........................ 5-41Figure 5-6
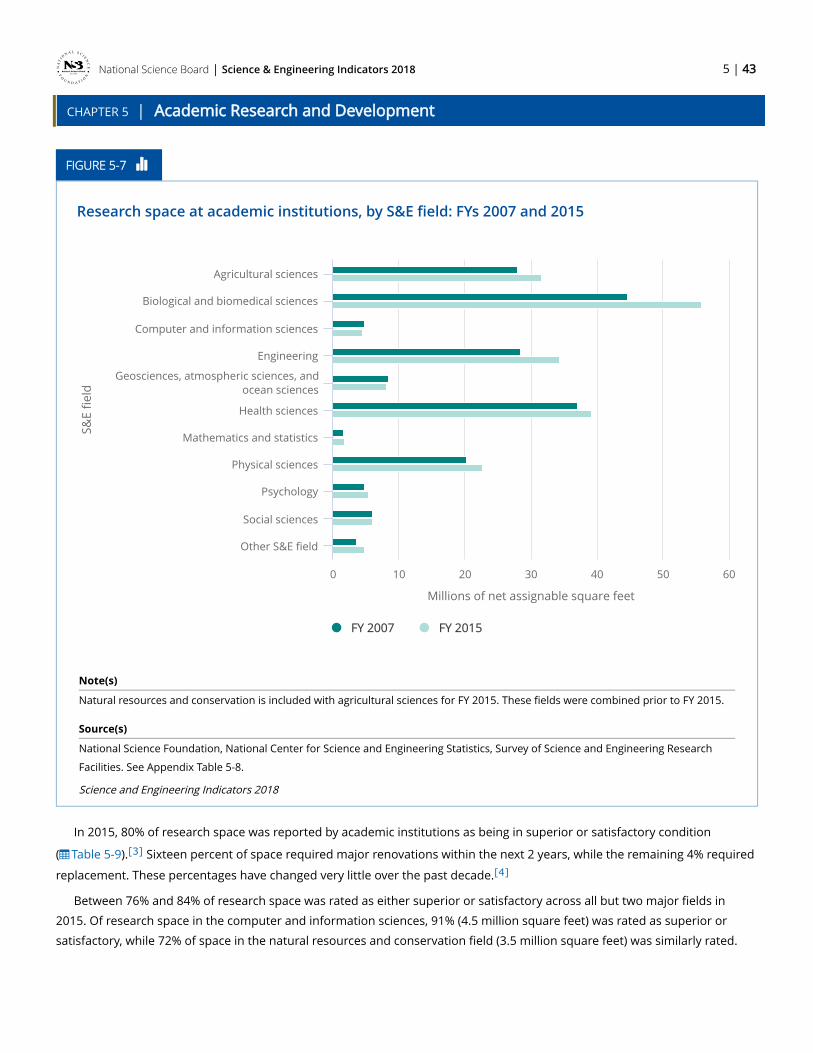
Research space at academic institutions, by S&E field: FYs 2007 and 2015 .................................................. 5-43Figure 5-7
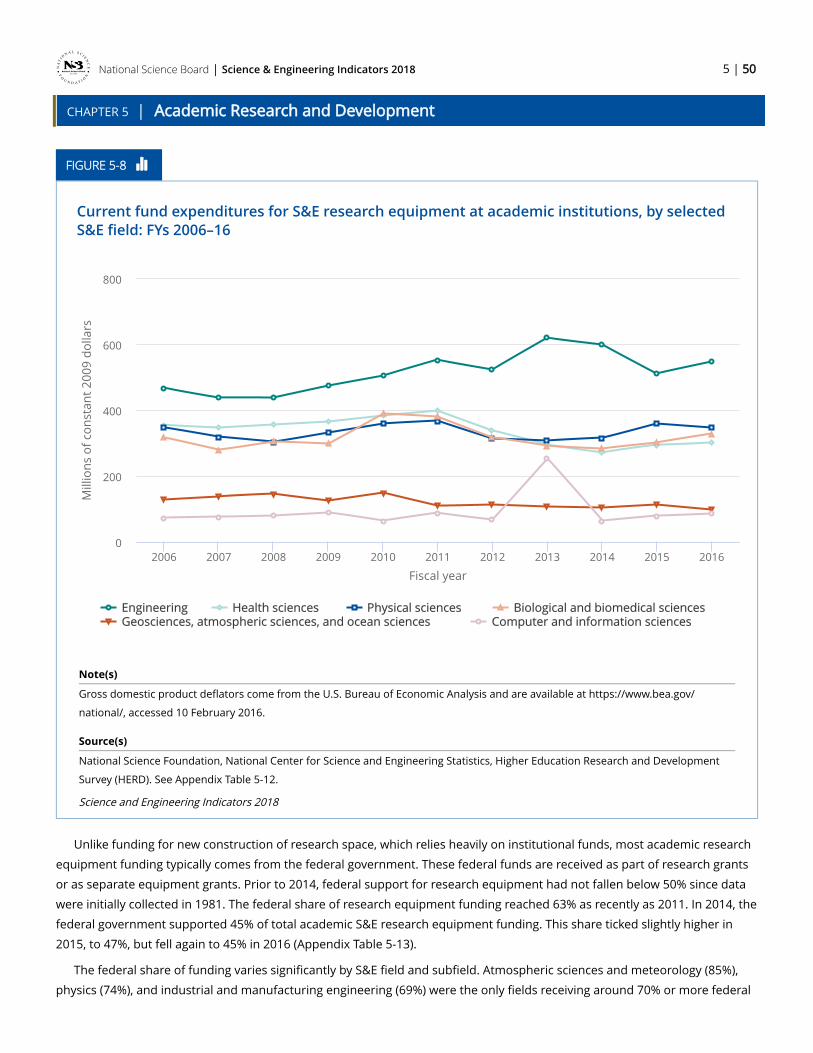
Current fund expenditures for S&E research equipment at academic institutions, byselected S&E field: FYs 2006–16 .......................................................................................................................... 5-50
Figure 5-8
S&E doctorate holders employed in academia, by type of position: 1973–2015.......................................... 5-59Figure 5-9
S&E doctorate holders employed in academia, by field: Selected years, 1973–2015 .................................. 5-60Figure 5-10
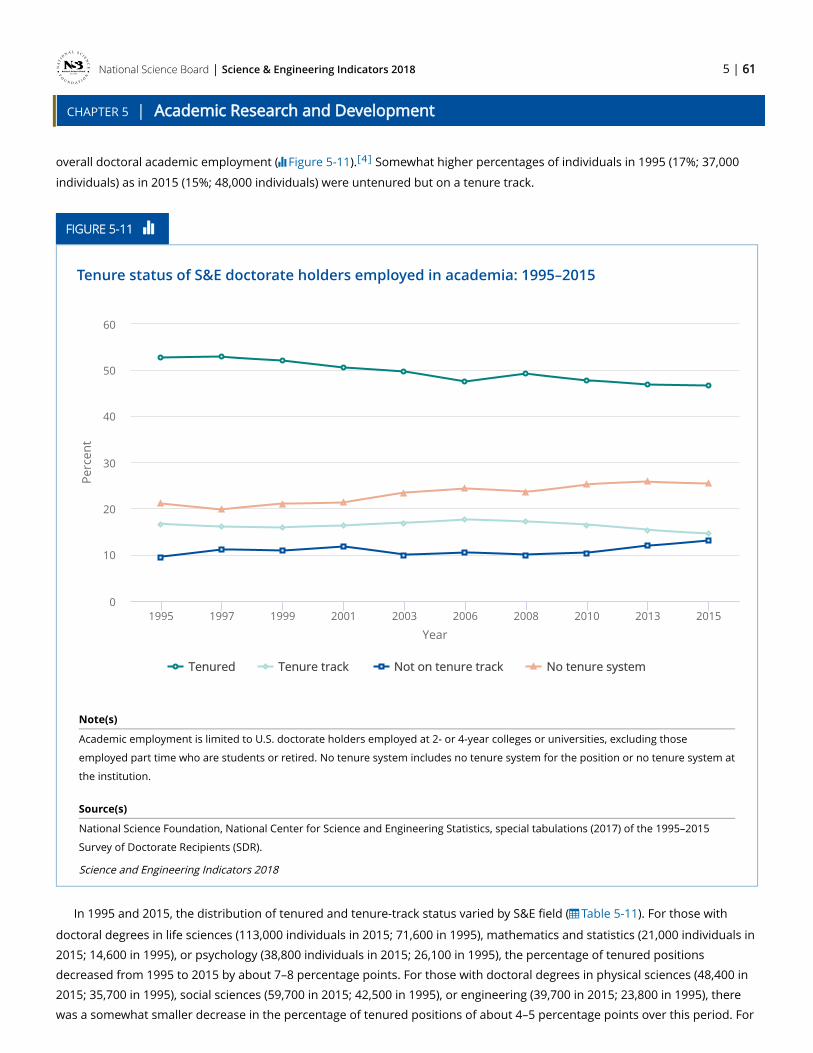
Tenure status of S&E doctorate holders employed in academia: 1995–2015............................................... 5-61Figure 5-11
Women as a percentage of S&E doctorate holders employed full time in academia, byacademic rank: Selected years, 1973–2015 ....................................................................................................... 5-67
Figure 5-12
Women as a percentage of younger and older S&E doctorate holders employed full time inacademia, by academic rank: 2015..................................................................................................................... 5-68
Figure 5-13
Black, Hispanic, and Asian S&E doctorate holders employed in academia as a percentage offull-time faculty positions, by sex: 2003 and 2015............................................................................................ 5-71
Figure 5-14
Tenure status of underrepresented minority S&E doctorate holders employed in academia:2003 and 2015....................................................................................................................................................... 5-72
Figure 5-15
U.S.-trained S&E doctorate holders employed in academia, by birthplace: 1973–2015 .............................. 5-74Figure 5-16
Full-time faculty ages 65–75 at research universities and other higher educationinstitutions: 1973–2015 ........................................................................................................................................ 5-76
Figure 5-17
Primary work activity of full-time doctoral S&E faculty: Selected years, 1973–2015 .................................... 5-78Figure 5-18
S&E doctorate holders employed in academia in a postdoctoral position, by S&E degreefield: Selected years, 1973–2015 ......................................................................................................................... 5-81
Figure 5-19
S&E doctorate holders employed in very high research activity institutions with federalresearch support, by sex, race, and ethnicity: 2015 ......................................................................................... 5-86
Early career S&E doctorate holders employed in full-time faculty positions with federalsupport, by field: 1991 and 2015 ........................................................................................................................ 5-89
Figure 5-21
Share of publications available in publisher-provided open access and total open access:2006–15.................................................................................................................................................................. 5-94
Figure 5-A
Annual percentage of U.S. publications available in publisher-provided open access andtotal open access: 2006–15.................................................................................................................................. 5-95
Figure 5-B
Percentage of publications available in publisher-provided open access and total openaccess, by research domain: 2006–15 ................................................................................................................ 5-96
Figure 5-C
Filtered and unfiltered publications in Scopus, by year: 2006–16 ................................................................ 5-105Figure 5-D
Filtered and unfiltered publications in Scopus, by region, country, or economy: 2006–16....................... 5-106Figure 5-E
Filtered and unfiltered publications in Scopus, by WebCASPAR field: 2006–16 .......................................... 5-107Figure 5-F
S&E articles, by global share of selected region, country, or economy: 2006–16 ....................................... 5-110Figure 5-22
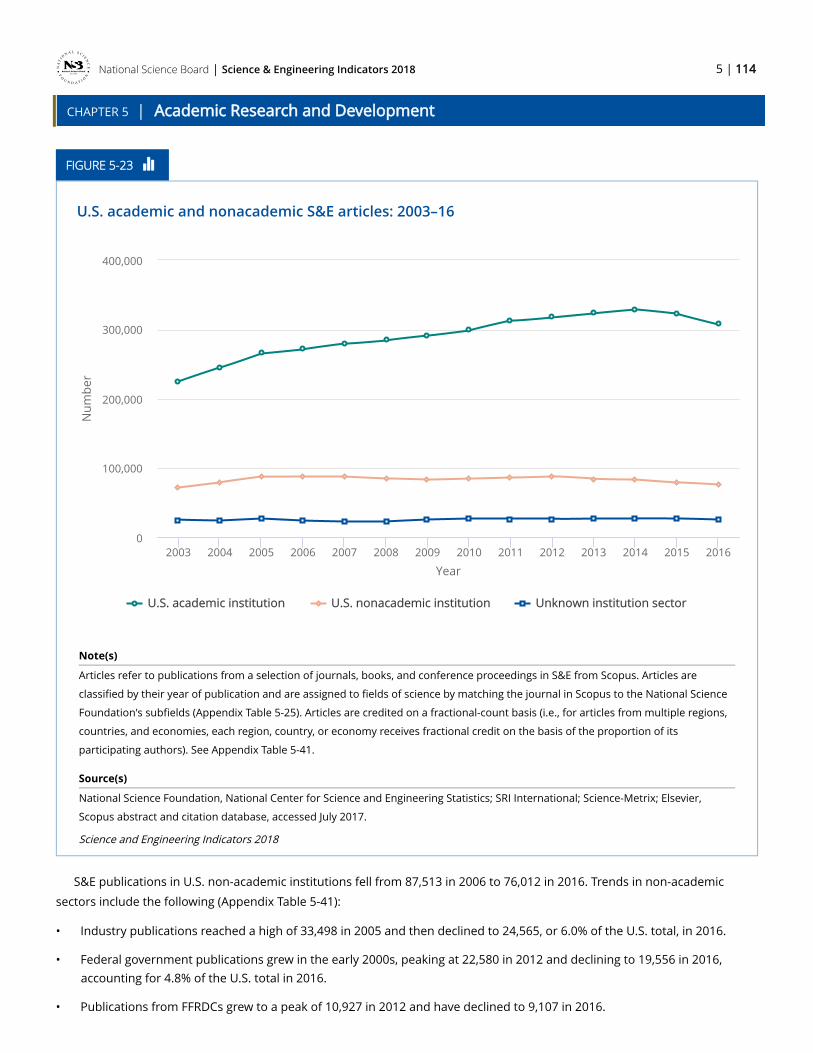
U.S. academic and nonacademic S&E articles: 2003–16 ................................................................................ 5-114Figure 5-23
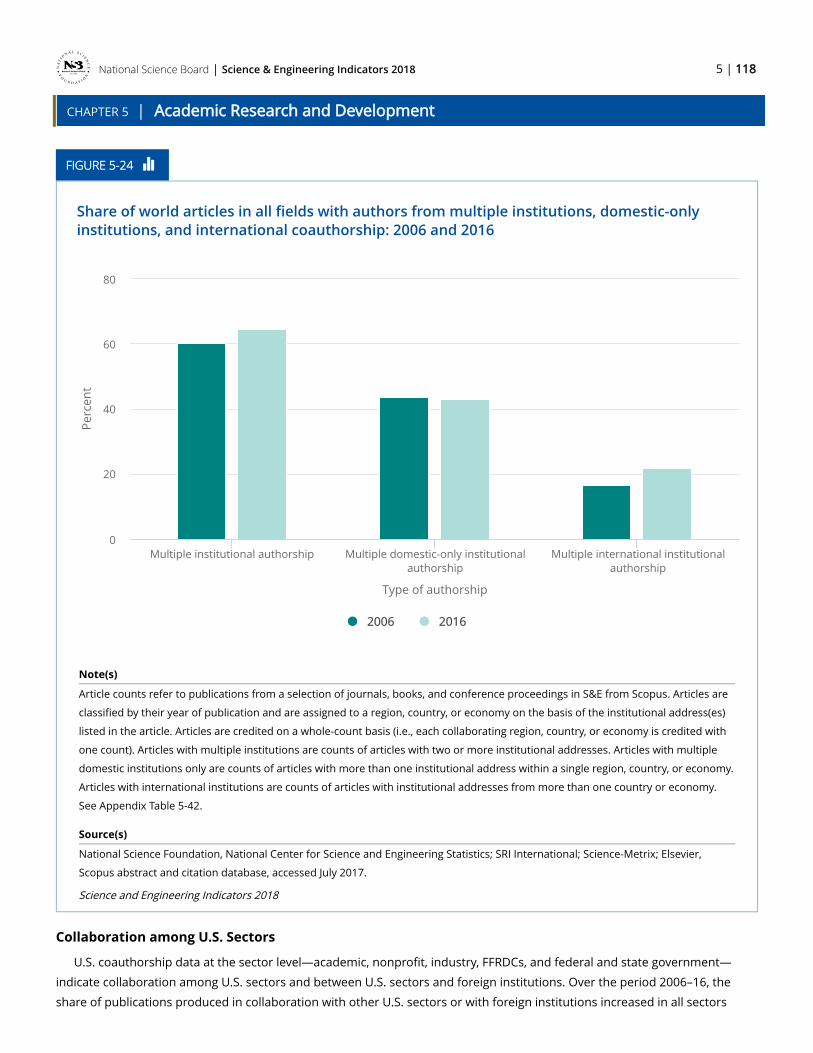
Share of world articles in all fields with authors from multiple institutions,domestic-only institutions, and international coauthorship: 2006 and 2016 ............................................. 5-118
Figure 5-24
Share of world S&E articles with international collaboration, by S&E field: 2006 and2016...................................................................................................................................................................... 5-122
Figure 5-25
Share of S&E articles internationally coauthored, by selected region, country, oreconomy: 2006 and 2016................................................................................................................................... 5-123
Figure 5-26
Trends in the proportion of female authors of S&E publications in Scopus: 2006–15............................... 5-130Figure 5-G
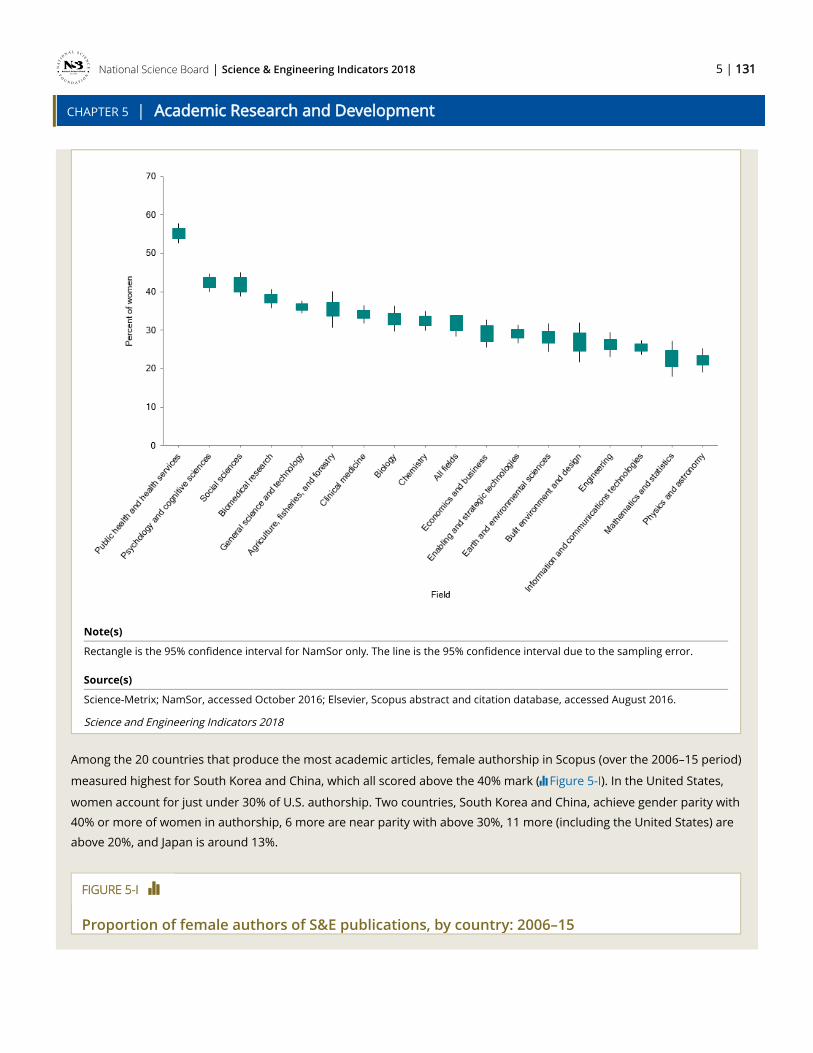
Proportion of female authors of S&E publications, by field: 2006–15 ......................................................... 5-130Figure 5-H
Proportion of female authors of S&E publications, by country: 2006–15.................................................... 5-131Figure 5-I
Share of citations to selected region, country, or economy that are received fromauthors abroad: 1996–2014 .............................................................................................................................. 5-134
Figure 5-27
Average relative citations, by region, country, or economy: 1996–2014...................................................... 5-139Figure 5-28
Average relative citations for the United States, by S&E field: 2004 and 2014 ........................................... 5-140Figure 5-29
Share of S&E publications in the top 1% of most cited publications, by selected region,country, or economy: 2004–14.......................................................................................................................... 5-142
Figure 5-30
S&E publication output in the top 1% of cited publications, by selected region, country,or economy: 2004–14 ......................................................................................................................................... 5-144
Figure 5-31
Average relative citations for U.S. S&E articles, by sector: 2004–14 ............................................................. 5-146Figure 5-32
National Science Board | 5 | 5
CHAPTER 5 | Academic Research and Development
Science & Engineering Indicators 2018
Highlights
Spending for Academic R&D
In 2016, U.S. academic institutions spent $72 billion on research and development.
• Basic research constituted just under two-thirds of academic R&D spending; the remainder was split between applied research (28%) and development (9%).
• Although the federal government provided more than half of academic R&D funds in 2016 (54%), its share declined for the fifth year in a row.
• By contrast, universities’ share of academic R&D spending has grown in recent years and reached its highest level ever in 2016 (25%).
Six agencies provided more than 90% of federal support for academic R&D.
• In declining order of funding and based on reports from universities, the major federal agencies that support academic R&D are the Department of Health and Human Services (HHS), the Department of Defense (DOD), the National Science Foundation (NSF), the Department of Energy (DOE), the National Aeronautics and Space Administration (NASA), and the Department of Agriculture.
• HHS (mainly through the National Institutes of Health) provides the majority of total federal funds for life sciences and psychology.
• NSF and DOD together provide the majority of federal funding for computer sciences, mathematical sciences, and engineering.
• HHS, NSF, and DOD together provide the majority of federal funding for social sciences.
• NSF and NASA together provide half of the federal funding for geosciences, while NSF and DOE together provide half of the federal funding for physical sciences.
Over most of the last three decades, the distribution of academic R&D expenditures shifted in favor of life sciences and
away from physical sciences. However, over the last decade, engineering R&D has grown faster than R&D in life sciences.
• Life sciences received the largest share (57%) of funding in 2016, followed by engineering (16%).
• Within life sciences, biological and biomedical sciences and health sciences have grown more rapidly than agricultural sciences.
• Within engineering, bioengineering and biomedical engineering and aerospace engineering have grown faster than the other engineering fields, although from lower bases.
• The other broad fields of science—computer sciences, geosciences, mathematical sciences, physical sciences, psychology, and social sciences—together accounted for 20% of academic R&D spending in 2016.
• Just under 2% of academic R&D expenditures were not classified within a broad field of science and included a portion of the multidisciplinary or interdisciplinary R&D conducted by U.S. academic institutions.
• Non-S&E fields—such as education, business, and humanities—accounted for just under 6% of total spending.
National Science Board | 5 | 6
CHAPTER 5 | Academic Research and Development
Science & Engineering Indicators 2018
Funding sources for academic R&D continued to differ in importance for public and private institutions in 2016.
• Public universities relied more heavily than private ones on state and local government funds (8% versus 1%) and more heavily on their own funds (27% versus 21%).
• Private universities relied more heavily on the federal government (60% versus 51%).
• Private universities relied a bit more than their public counterparts on business funding (7% versus 5%) and nonprofit funding (8% versus 6%).
Infrastructure for Academic R&D
Research space at academic institutions has continued to grow annually since the 1980s, although the pace of growth
has slowed over the last decade.
• Total research space at universities and colleges increased by 1.4% from 2013 to 2015, which was the smallest growth in three decades.
• Research space for the biological and biomedical sciences accounted for 26% of all S&E research space in 2015, making it the largest of all the major fields.
• In 2015, 80% of research space was reported as being in either superior or satisfactory condition by academic institutions, 16% required renovations, and 4% needed replacement.
In 2016, universities spent just over $2.1 billion on movable capitalized research equipment, an increase of 3% from the
amount spent in 2015.
• Equipment spending accounted for 3.1% of total academic S&E R&D expenditures in 2016, which was the lowest share in three decades.
• Three S&E fields accounted for 87% of equipment expenditures in 2016: life sciences (40%), engineering (29%), and physical sciences (18%).
• In 2014, the federal share of support for all academic research equipment funding fell below 50% for the first time since data collection began in 1981. The 2016 federal support share remained below 50% for the third consecutive year, reaching 45%. This share reached 63% as recently as 2011.
Doctoral Scientists and Engineers in Academia
The academic workforce with research doctorates in science, engineering, and health (hereafter referred to as S&E)
numbered just under 400,000 in 2015.
• The vast majority of this population (about 330,000) was trained in the United States. The foreign-trained portion numbered about 68,000.
• Between 2013 and 2015, the S&E doctoral workforce grew more slowly in the academic sector (7%) than in the business sector (15%).
• In 2015, about 45% of the U.S.-trained S&E doctorate holders were employed in academia, compared with just under 50% in the mid-1990s and 55% in the early 1970s.
National Science Board | 5 | 7
CHAPTER 5 | Academic Research and Development
Science & Engineering Indicators 2018
Full-time faculty positions for U.S.-trained S&E doctorate holders have been in steady decline for four decades, offset by
a rise in other types of full- and part-time positions.
• The percentage of S&E doctorate holders employed in academia who held full-time faculty positions declined from about 90% in the early 1970s to about 70% in 2015.
• Compared with 1995, a smaller share of the doctoral academic workforce had achieved tenure in 2015. In 1995, tenured positions accounted for an estimated 53% of doctoral academic employment; this decreased to 47% in 2015. Tenure-track positions as a share of doctoral academic employment declined slightly between 1995 and 2015, while the share of positions outside of the tenure system increased.
The demographic profile of the U.S.-trained academic doctoral workforce has shifted substantially over time.
• The number of women in academia grew rapidly between 1995 and 2015, more than doubling from 52,000 to 123,000. In 2015, women constituted 37% of academically employed doctorate holders, up from 24% in 1995. Women as a share of full-time senior doctoral faculty also increased substantially.
• Among younger individuals (those degreed since 1995), women constituted 44% of the academic doctoral workforce, while among the older cohort (those degreed in 1994 or earlier), women constituted only 26%.
• In 2015, underrepresented minorities (blacks, Hispanics, and American Indians or Alaska Natives) constituted 8.9% of total academic doctoral employment and 8.6% of full-time faculty positions, up from about 2% in 1973 and from 7%–8% of these positions in 2003.
• Among women in full-time faculty positions, 10.5% were from underrepresented minority groups, a higher percentage than for their male counterparts (7.6%).
• Among those degreed since 1995, underrepresented minorities held 10.2% of full-time faculty positions, while among the cohort degreed before 1995, they held only 6.5% of full-time faculty positions.
• Just under 30% of U.S.-trained doctorate holders in academia were foreign born, contrasted with about 12% in 1973 and 19% in 1995.
• Over one-half of all U.S.-trained postdoctorates (postdocs) were born outside of the United States.
• The U.S.-trained doctoral academic workforce has aged substantially over the past two decades. In 2015, 25% of those in full-time faculty positions were between 60 and 75 years of age, compared with 11% in 1995.
Since 1993, the proportion of full-time faculty who identify research as their primary work activity has increased, and the
proportion of full-time faculty who identify teaching as their primary activity has decreased.
• Just under 40% of full-time faculty identified research as their primary work activity in 2015, up from 33% in 1993.
• The share of full-time faculty who identified teaching as their primary activity declined from 53% in 1993 to 45% in 2015.
• In 2015, 35% of recently degreed full-time faculty identified research as their primary work activity.
A substantial pool of academic researchers exists outside the ranks of tenure-track faculty.
• Approximately 45,000 S&E doctorate holders were employed in academic postdoc positions in 2015, most of whom earned their doctorate overseas.
National Science Board | 5 | 8
CHAPTER 5 | Academic Research and Development
Science & Engineering Indicators 2018
• In 2015, 35% of U.S.-trained doctorate holders less than 4 years beyond receiving the doctorate held academic postdoc positions, about the same share (36%) as employed in full-time faculty positions. Among those 4–7 years beyond receiving their doctorates, 16% held postdoc positions.
• Beyond postdocs and full-time faculty, other S&E doctorate holders engaged in academic R&D include research associates and adjunct faculty.
The share of U.S.-trained academic doctorate holders receiving federal research support declined somewhat since the
early 1990s.
• In 2015, about 41% of doctorate holders received federal research support, compared with 48% during the late 1980s and very early 1990s.
• Among full-time faculty, recent doctorate recipients were less likely to receive federal research support than their more established colleagues.
• Federal research support has become less available to doctorate holders in nonfaculty positions, declining from about 60% in 1973 to about 42% in 2015.
Outputs of S&E Research: Publications
U.S. researchers accounted for just under one-fifth of the global output volume of peer-reviewed S&E articles; academic
researchers contributed about three-quarters of the U.S. total. In 2016, China and the United States were the two largest
global producers of peer-reviewed S&E articles.
• China and the United States produced 18.6% and 17.8%, respectively, of the world’s 2.3 million total S&E publications in 2016. Over the last decade for which data are available, between 2006 and 2016, the U.S. share declined from 24.4%, while China’s share grew from 12.1%.
• The period from 2006 to 2016 shows the ascendance of the share of peer-reviewed publications from Asia and India. China’s compound annual growth rate of 8.43% was one of the fastest growing among the top 15 producers of S&E publications. Also among the top 15 producers, Iranian output grew the fastest, growing 15.1% annually from 2006 to 2016. Indian researcher output grew at an annual rate of 11.1%.
• Japan, the country with the sixth largest share of S&E publications in 2016, experienced a decline in global share from 7.0% to 4.2% from 2006 to 2016. Shares of Germany and the United Kingdom, the fourth and fifth largest producers, declined from 5.4% to 4.5% and from 5.6% to 4.3%, respectively.
• India is the third largest producer of S&E articles, with a 4.8% share of world S&E publication output in 2016. South Korea reached 2.8%, while Brazil reached 2.3%.
• When viewed as one region, the share for the European Union (EU) declined, from 30.7% in 2006 to 26.7% in 2016.
Biological and medical sciences dominate research output in the United States, Japan, and the EU. Engineering
publications account for the greatest percentage of the publications from China.
• Among the major producers of S&E publications, the United States has the highest concentration of publications in medical sciences.
• The United States has 47.2% and the EU has 39.4% of their publications in two fields combined, biological and medical sciences. Japan has 43.1% of its publications in those fields.
National Science Board | 5 | 9
CHAPTER 5 | Academic Research and Development
Science & Engineering Indicators 2018
• China has 28.9% of its publications in engineering and 27.3% in biological and medical sciences combined.
• Of these major producers, India has the highest concentration of publications in computer sciences and the second highest concentration in engineering.
S&E research publications are increasingly collaborative and increasingly international in authorship.
• More than 64.7% of global S&E publications had multiple authors in 2016, compared with about 60.1% of such publications in 2006.
• The percentage of worldwide publications produced with international collaboration (i.e., by authors with institutional addresses from at least two countries) rose from 16.7% to 21.7% between 2006 and 2016.
• International collaboration grew between 2006 and 2016 in all fields of science, with the highest percentage of international collaboration in astronomy.
• In the United States, 37.0% of publications were coauthored with researchers at institutions in other countries in 2016, compared with 25.2% in 2006.
• Among the major producers of S&E publications, the United Kingdom had the highest international collaboration rate in 2016, at 57.1%.
The impact of S&E publications has also become more global. U.S. S&E publications increasingly cite S&E publications
from foreign authors and increasingly receive citations from foreign-authored publications.
• World citations to U.S. research publications increased from 47.0% to 55.7% between 2004 and 2014.
• The average impact of U.S. publications—a measure of citations received relative to the number of S&E articles published and the fields in which they appear—was 42% higher in 2014 than the global average for citations.
• China’s citation rate rapidly increased across 2004–14, improving from fewer citations than would be expected, based on number of publications from China's researcher institutions, to just reaching the expected level of citations.
• In 2014, publications with U.S. authors were almost twice as likely to be among the world’s top 1% most-cited publications than would be expected based on the volume of U.S. publications.
• By this measure, S&E publications from the Netherlands, Sweden, and Switzerland are more than twice as likely to be among the top 1% of highly cited articles.
Introduction
Chapter Overview
Financial resources for the large and decentralized U.S. R&D system exceeded $450 billion in recent years. R&D performed
by academic institutions, relatively small at about 15% of total expenditures, has a vital role that belies its size in the overall
system. Universities conduct just under half of the nation’s basic research and, in the process, introduce undergraduates to
research protocols, train graduate students and future doctorate holders, and support postdoctoral researchers in conducting
advanced scientific inquiry.[1] Knowledge generated from this work is broadly shared in international peer-reviewed journals, in which U.S.-based authors feature prominently.
National Science Board | 5 | 10
CHAPTER 5 | Academic Research and Development
Science & Engineering Indicators 2018
Chapter Organization
The chapter opens with an examination of trends in spending on academic R&D. It discusses funding sources and spending
patterns by institution types and fields. Comparisons are made between public and private institutions and between very high
research activity institutions and others. This section illustrates the important role of federal funding for academic R&D,
showing a continuing decline in the federal share of total spending, while the share paid for by universities themselves has
increased.
The second section analyzes trends in infrastructure by field for academic R&D, including research facilities and research
equipment. In addition, this section comments on the role of academic research cyberinfrastructure, such as high-
performance computing, networking, and storage resources.
The chapter then turns to the people conducting academic research and teaching the next generation of scientists and
engineers. It traces substantial, decades-long trends in the demographics of the academic doctoral workforce, structural
changes in its composition, and patterns in the distribution of federal funds that support this workforce’s research. The
chapter’s focus broadens with an examination of research articles (the bulk involving results of academic R&D) in global peer-
reviewed journals. This examination of the U.S. role in the broad realm of international R&D focuses on the volume, patterns,
and fields of publication; the growth of coauthorship; and domestic and international collaboration. Citation patterns allow
inferences about the relative impact of academic R&D output.
The fields of science and engineering presented in this chapter reflect several small differences between each section’s
data sources. For example, the section Expenditures and Funding for Academic R&D presents data by S&E field as defined in
the survey of Higher Education Research and Development (HERD), while the section Doctoral Scientists and Engineers in
Academia presents data by S&E field as defined in the Survey of Doctorate Recipients (SDR). The data sources generally group
fields consistently, with a few exceptions.[2]
[1]Higher education institutions are primary performers of U.S. basic research, accounting for 49% of the $83.5 billion of basic research performance in 2015. The business sector performed about 26%, the federal government (agency intramural laboratories and federally funded research and development centers [FFRDCs]) performed 12%, and other nonprofit organizations performed 13%. See Chapter 4 for further discussion of national patterns of R&D.
[2] While the data sources generally group fields consistently, there are a few differences. In particular, SDR groups earth, atmospheric, and ocean sciences under physical sciences, whereas the other data sources used in this chapter group these sciences under geosciences. In the bibliometric data, chemistry and physics are separate broad fields; in the chapter’s other data sources, however, these fields are included within the broad field of physical sciences.
National Science Board | 5 | 11
CHAPTER 5 | Academic Research and Development
Science & Engineering Indicators 2018
Expenditures and Funding for Academic R&D
Academic R&D is a key component of the overall U.S. R&D enterprise.[1] Academic institutions conduct just under half of the nation’s basic research and, importantly, train young researchers in the process. (For an overview of the sources of data
used, see sidebar Data on the Financial and Infrastructure Resources for Academic R&D.)
National Science Board | 5 | 12
CHAPTER 5 | Academic Research and Development
Science & Engineering Indicators 2018
Data on the Financial and Infrastructure Resources for Academic R&DFinancial data on academic R&D are drawn from the National Science Foundation’s Survey of Research and Development
Expenditures at Universities and Colleges (1972–2009) and its successor, the Higher Education Research and
Development Survey (HERD; 2010 onward). Trend analysis is possible because both surveys capture comparable
information on R&D expenditures by sources of funds and by field. HERD offers a more comprehensive treatment of
R&D (including non-S&E fields), an expanded group of surveyed institutions, and greater detail about the sources of
funding for R&D expenditures by field (Britt 2010). The latest survey is available at https://www.nsf.gov/statistics/
srvyherd/.
HERD data are in current-year dollars and are reported on an academic-year basis. For example, FY 2016 covers July
2015–June 2016 for most institutions and is referred to in this chapter as 2016. HERD data are generally presented in
current dollars, although comparisons over more than 1 year are made in inflation-adjusted constant 2009 dollars using
gross domestic product implicit price deflators.
The data on research facility infrastructure come from the Survey of Science and Engineering Research Facilities. This
survey includes all universities and colleges in HERD with $1 million or more in S&E R&D expenditures and is completed
by university and college administrators under the direction of the institutional presidents. The latest survey is available
at https://nsf.gov/statistics/srvyfacilities/.
Data on federal obligations for academic R&D are reported in Chapter 4; that chapter also provides data on the
academic sector’s share of the nation’s overall R&D.
National Academic R&D Expenditures in All Fields
R&D expenditures by U.S. colleges and universities totaled $71.8 billion in 2016.[2] ,[3] The vast majority (94%) of this
spending was in S&E fields ( Table 5-1). The chapter will also present Higher Education Research and Development Survey
(HERD) data that are not distributed by field. Such data include institutions’ estimates of spending for basic research, applied
research, and development ( Table 5-2; Appendix Table 5-1); data on R&D funds that universities and colleges pass through
to other institutions (or receive from others); detail on institutionally financed R&D; and the types of costs universities incur as
National Science Foundation, National Center for Science and Engineering Statistics, Higher Education Research and Development Survey (HERD), FY 2016.
Science and Engineering Indicators 2018
TABLE 5-3
National Science Board | 5 | 18
CHAPTER 5 | Academic Research and Development
Science & Engineering Indicators 2018
Sources of Support for Academic R&D
Academic R&D relies on funding support from a variety of sources, including the federal government, universities’ and
colleges’ own institutional funds, state and local government, businesses, and other organizations (Appendix Table 5-2). The
federal government has consistently provided the majority of funding for academic R&D, generally around 60%, although the
share has been less in recent years.[7] Institutional funds contribute a sizeable share of this funding (25% in 2016), while state and local governments, businesses, and nonprofit organizations (such as philanthropic foundations) each provide less than
10% of R&D funds.[8] Funding from all other sources results in about 3% of total R&D spending.
Federal Support
The federal government allocates R&D funding to academia primarily through competitive review processes, and overall
support reflects the combined result of many discrete funding decisions made by the R&D-supporting federal agencies.
Varying agency missions, priorities, and objectives affect the level of funds that universities and colleges receive and how
those funds are spent. The American Recovery and Reinvestment Act of 2009 (ARRA) was an important source of federal
expenditures for academic R&D during the economic downturn and recovery from 2010 through 2012 and continued to
contribute to such spending, although in smaller amounts, in 2013 and 2014. By 2015, all ARRA funds had been spent.[9]
Excluding ARRA funds, the proportion of R&D paid for with federal funds has declined gradually since 2004 (from 64% to
54%). This decrease has contributed to a decline over this period in success rates for research grant applications at some
federal funding agencies discussed in this chapter’s section on doctoral scientists and engineers in academia. Taking a longer
perspective, the proportion of academic R&D paid for with federal funds, at 69%, was highest in 1973 ( Figure 5-1). This
proportion then declined fairly steadily throughout the remainder of the 1970s and the 1980s. During the 1990s, the federal
share, with some fluctuations, remained at or just under 60%. However, during the first half of the 2000–09 decade, the
federal proportion of academic R&D spending gradually increased to 64%, reflecting rapid increases in the budget of the
National Institutes of Health (NIH), a major academic R&D funding agency. The federal proportion fell during the latter part of
the 2000–09 decade but rose in 2010 and 2011 with the infusion of ARRA funds. It has been on a steady decline starting in
2012. In 2016, the federal government was the source for $38.8 billion (54%) of the $72 billion total in R&D spending, an
increase of only $400 million from 2015 after adjusting for inflation ( Figure 5-2).
National Science Board | 5 | 19
CHAPTER 5 | Academic Research and Development
Science & Engineering Indicators 2018
Fiscal year
Perc
ent
Federal government State and local government Business Academic institutionsAll other sources
19721974
19761978
19801982
19841986
19881990
19921994
19961998
20002002
20042006
20082010
20122014
20160
20
40
60
80
Note(s)
Totals for FYs 1972–2009 represent R&D expenditures in S&E fields only. Beginning in FY 2010, totals include R&D expenditures in
S&E fields and non-S&E fields. Academic institutions' funds exclude research funds spent from multipurpose accounts. Percentages
may not add to 100% becaue of rounding.
Source(s)
National Science Foundation, National Center for Science and Engineering Statistics, Higher Education Research and Development
Survey (HERD).
Science and Engineering Indicators 2018
FIGURE 5-1
Academic R&D expenditures, by source of funding: FYs 1972–2016
National Science Board | 5 | 20
CHAPTER 5 | Academic Research and Development
Science & Engineering Indicators 2018
Fiscal year
Billi
ons
of d
olla
rs
Federal (constant dollars) Federal (current dollars) Nonfederal (constant dollars)Nonfederal (current dollars)
Department of Health and Human Services 54.7 54.5 54.0 56.3 56.4 54.6 53.8 53.5 52.8 53.3
Department of Defense 8.9 9.5 10.1 12.0 11.8 12.2 12.7 13.0 13.4 13.7
National Science Foundation 11.4 11.8 11.8 12.6 12.6 13.1 13.7 13.5 13.5 13.2
Department of Energy 3.6 3.5 3.7 4.1 4.6 4.9 4.8 4.8 4.5 4.6
National Aeronautics and Space Administration 3.4 3.3 3.3 3.9 3.5 3.3 3.4 3.5 3.7 3.8
Department of Agriculture 2.9 2.8 2.7 2.6 2.5 2.7 2.8 2.8 3.0 3.1
Note(s)
The Department of Health and Human Services includes primarily the National Institutes of Health.
Source(s)
National Science Foundation, National Center for Science and Engineering Statistics, special tabulations (2017) of the Higher Education
Research and Development Survey (HERD).
Science and Engineering Indicators 2018
The federal government’s role in funding R&D in the various fields of S&E hinges on each agency’s mission focus ( Figure
5-3). Federal funding has played a larger role in overall support for some fields than for others (Appendix Table 5-4). The
federal government is the dominant funder in fields such as atmospheric sciences (82% in 2016), physics (72%), computer
sciences (69%), and aerospace engineering (71%). It plays a smaller role in other fields, such as economics (28%), agricultural
sciences (30%), and political sciences (27%).
TABLE 5-4
National Science Board | 5 | 22
CHAPTER 5 | Academic Research and Development
Science & Engineering Indicators 2018
Agency
Billi
ons
of c
urre
nt d
olla
rs
Engineering Social sciences Psychology Physical sciencesMathematics and statistics Life sciencesGeosciences, atmospheric sciences, and ocean sciences Computer and information sciencesNon-S&E
HHS DOD NSF DOE NASA USDA0
2
4
6
8
10
12
14
16
18
20
22
DOD = Department of Defense; DOE = Department of Energy; HHS = Department of Health and Human Services; NASA = National
Aeronautics and Space Administration; NSF = National Science Foundation; USDA = Department of Agriculture.
Source(s)
SOURCE(S): National Science Foundation, National Center for Science and Engineering Statistics, Higher Education Research and
Development Survey (HERD), FY 2016. See Appendix Table 5-3.
Science and Engineering Indicators 2018
Although fields vary in their dependence on particular agencies, most receive the majority of their funding from only one
or two agencies. HHS—primarily through NIH—supports the vast majority of federal funding in life sciences (83%) and the
majority (66%) of federal funding in psychology. NSF and DOD together play key roles in computer sciences (83%),
mathematical sciences (79%), and engineering (59%). Funding sources for R&D in geosciences and social sciences are more
diversified, with NSF and NASA providing large proportions of geosciences funding and HHS providing the largest proportion
of social sciences funding ( Table 5-5). In 2016, as in previous years, NSF was the lead federal funding agency for academic
FIGURE 5-3
Federally financed academic R&D expenditures, by agency and S&E field: FY 2016
National Science Board | 5 | 23
CHAPTER 5 | Academic Research and Development
Science & Engineering Indicators 2018
research in physical sciences, mathematical sciences, and geosciences. In 2016, DOD was the lead funding agency in
engineering and computer sciences.
Federal support for academic R&D historically has been concentrated in the nation’s most research-intensive higher
education institutions. Recognizing that human talent is widespread, federal government agencies have long supported a
program to develop academic research capability in states that are less competitive in obtaining federal research grants. See
sidebar Established Program to Stimulate Competitive Research for an overview of the program and recent statistics on its
activities.
National Science Board | 5 | 24
CHAPTER 5 | Academic Research and Development
Science & Engineering Indicators 2018
Federal funding of academic S&E R&D, by agency and field: FY 2016
(Percent)
Field All federal R&D expenditures DOD DOE HHS NASA NSF USDA Othera
DOD = Department of Defense; DOE = Department of Energy; HHS = Department of Health and Human Services; NASA = National
Aeronautics and Space Administration; NSF = National Science Foundation; USDA = Department of Agriculture.
a Includes all other agencies reported.
Note(s)
The Department of Health and Human Services includes primarily the National Institutes of Health. Percentages may not add to 100%
because of rounding.
Source(s)
National Science Foundation, National Center for Science and Engineering Statistics, special tabulations (2017) of the Higher Education
Research and Development Survey (HERD).
Science and Engineering Indicators 2018
TABLE 5-5
National Science Board | 5 | 25
CHAPTER 5 | Academic Research and Development
Science & Engineering Indicators 2018
Established Program to Stimulate Competitive ResearchThe Established Program to Stimulate Competitive Research (EPSCoR)* is a long-standing multiagency federal program
that aims to develop and raise states’ capacity to compete for federal R&D grants and thus contribute to the national
R&D capacity. It is based on the premise that universities and their S&E faculty and students are resources that can
influence a state’s development in the 21st century just as agricultural, industrial, and natural resources did in the 20th
century.
EPSCoR is rooted in the history of the National Science Foundation (NSF) and of federal support for R&D. In 1978,
Congress, concerned about a geographic concentration of federal R&D funds, authorized NSF to initiate EPSCoR, which
was targeted at states that received lesser amounts of federal R&D funds but demonstrated a commitment to
developing sustainable, competitive research capabilities anchored in academic institutions across the jurisdictions. The
ultimate aim was to move EPSCoR researchers and institutions into the mainstream of federal and private-sector R&D
support.
The experience of the NSF EPSCoR program during the 1980s prompted Congress to authorize the creation of EPSCoR
and EPSCoR-like programs in six other federal agencies: the Departments of Energy, Defense (DOD), and Agriculture; the
National Aeronautics and Space Administration; the National Institutes of Health; and the Environmental Protection
Agency (EPA). Two of these agencies, EPA and DOD, discontinued issuing EPSCoR program solicitations in FYs 2006 and
2010, respectively.
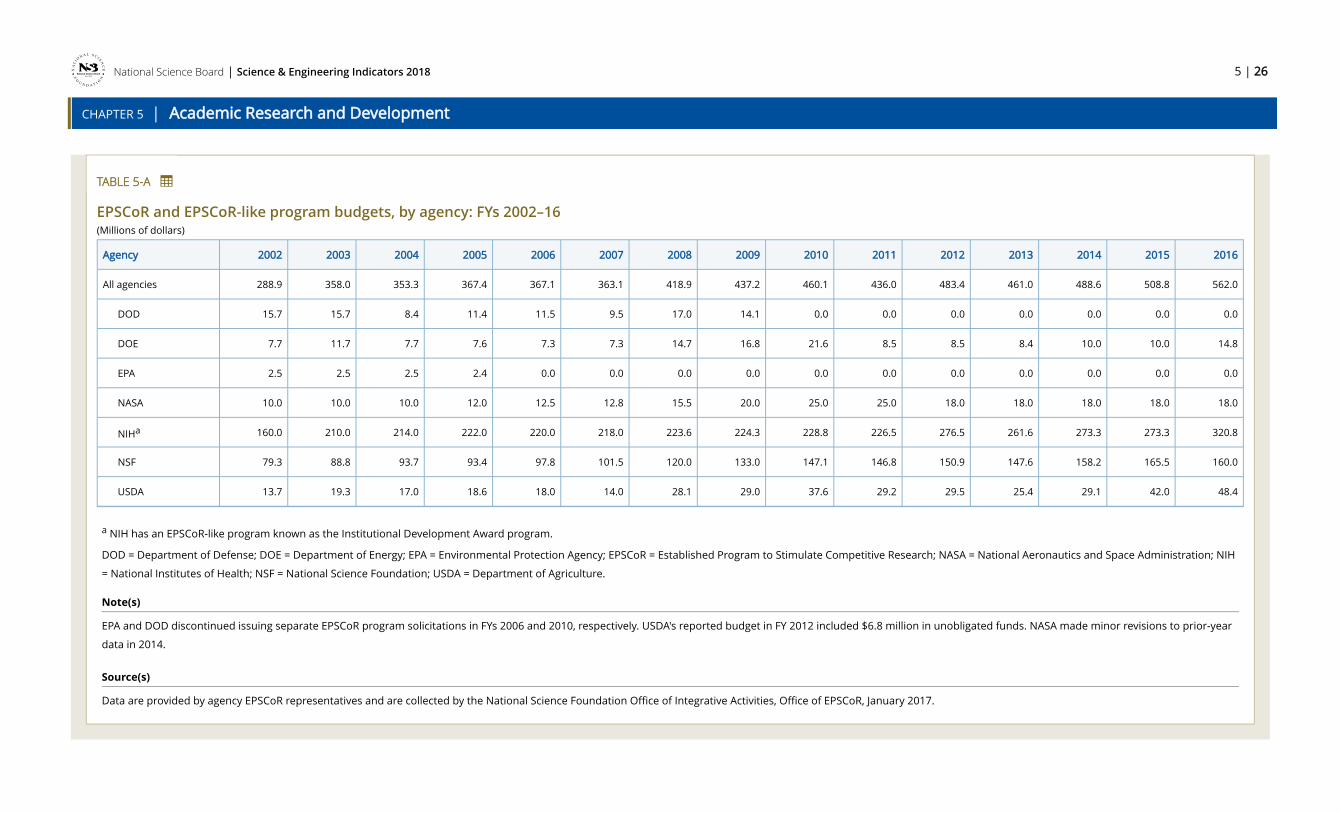
In FY 2016, the five remaining agencies spent a total of $562 million on EPSCoR and EPSCoR-like programs, up from
$288.9 million (all agencies) in 2002 ( Table 5-A).
SIDEBAR
National Science Board | 5 | 26
CHAPTER 5 | Academic Research and Development
Science & Engineering Indicators 2018
EPSCoR and EPSCoR-like program budgets, by agency: FYs 2002–16(Millions of dollars)
a NIH has an EPSCoR-like program known as the Institutional Development Award program.
DOD = Department of Defense; DOE = Department of Energy; EPA = Environmental Protection Agency; EPSCoR = Established Program to Stimulate Competitive Research; NASA = National Aeronautics and Space Administration; NIH
= National Institutes of Health; NSF = National Science Foundation; USDA = Department of Agriculture.
Note(s)
EPA and DOD discontinued issuing separate EPSCoR program solicitations in FYs 2006 and 2010, respectively. USDA's reported budget in FY 2012 included $6.8 million in unobligated funds. NASA made minor revisions to prior-year
data in 2014.
Source(s)
Data are provided by agency EPSCoR representatives and are collected by the National Science Foundation Office of Integrative Activities, Office of EPSCoR, January 2017.
TABLE 5-A
National Science Board | 5 | 27
CHAPTER 5 | Academic Research and Development
Science & Engineering Indicators 2018
Science and Engineering Indicators 2018
National Science Board | 5 | 28
CHAPTER 5 | Academic Research and Development
Science & Engineering Indicators 2018
*Prior to 2017, the program was known as the Experimental Program to Stimulate Competitive Research.
Institutional Support for Academic R&D
Notwithstanding the continuing dominant federal role in academic R&D funding, nonfederal funding sources have grown
steadily over the past 20 years ( Figure 5-2). Adjusted for inflation, nonfederal funding for academic R&D grew at a 4.5%
average annual rate between 1997 and 2016, compared with a 3.6% average annual growth rate for federal funding for
academic R&D. Growth has been particularly strong in institutions’ own funds, the largest source of nonfederal funding. In
2016, institutional funds reached $18 billion (25% of the total) (Appendix Table 5-2). This share grew rapidly from only 11% in
1973 to around 18% by 1990 ( Figure 5-1). With some fluctuation, universities’ and colleges’ share of R&D spending increased
more slowly during the decades of 1990–99 and 2000–09. With the infusion of federal ARRA funds, the institutional share
dipped slightly in 2010 and 2011 but has since climbed to 25%, its highest-ever share ( Figure 5-1; Appendix Table 5-2).
In addition to internal funding from general revenues, institutionally financed R&D includes unrecovered indirect costs and
committed cost sharing (discussed in greater detail as follows, where differences between public and private research
institutions are highlighted).[11]
Institutionally financed research includes organized research projects fully supported with internal funding and all other
separately accounted-for institutional funds for research. This category does not include funds spent on research that are not
separately accounted for, such as estimates of faculty time budgeted for instruction that is spent on research. Funds for
institutionally financed R&D may also derive from general-purpose state or local government appropriations; general-purpose
awards from industry, foundations, or other outside sources; endowment income; and gifts. Universities may also use income
from patents and licenses or revenue from patient care to support R&D.[12] (See Chapter 8 section USPTO Patenting Activity for a discussion of patent and licensing income.)
Other Sources of Funding
State and local government funds
State and local governments provided $4 billion (5.6%) of academic R&D funding in 2016. Public institutions received over
90% of the total ( Figure 5-1; Appendix Table 5-2). The state and local government funding share has declined from a peak of
10% in the early 1970s to below 6% in recent years. However, actual amounts may be understated, particularly for public
institutions, because they reflect only funds specifically targeted for R&D, while general-purpose funds may be designated by
the recipient institutions for R&D or indirect cost recovery and may thus show up as institutional research support. (See State
Indicators for some indicators of academic R&D by state, and see Chapter 2 section Trends in Higher Education Expenditures
and Revenues for a discussion of trends in higher education spending and revenues.)
Nonprofit funds
Nonprofit organizations provided $4.6 billion (6.4%) of academic R&D funding in 2016 (Appendix Table 5-4). About two-
thirds of nonprofit funding (66%) is directed toward R&D in life sciences, with health sciences being the largest recipient field
within life sciences.
Business funds
Businesses provided $4.2 billion (5.9%) of academic R&D funding in 2016, slightly less than the amount provided by
nonprofit organizations and slightly more than that provided by state and local governments ( Figure 5-1; Appendix Table
5-4). Business funding is largely directed toward R&D in the life sciences (61%) and engineering (25%).
National Science Board | 5 | 29
CHAPTER 5 | Academic Research and Development
Science & Engineering Indicators 2018
Other funds
In 2016, all other sources of support, such as foreign-government funding or gifts designated for research, accounted for
$2.2 billion (3%) of academic R&D funding (Appendix Table 5-4).
Academic R&D Expenditures, by Field
The life sciences have long accounted for the bulk of research spending: $41 billion in 2016, 57% of the total.[13] The other S&E fields, in declining order of expenditures, are engineering (16%), physical sciences (7%), geosciences (4%), social sciences
(3%), computer sciences (3%), psychology (2%), and mathematical sciences (1%) (Appendix Table 5-5). Together, the non-S&E
fields constitute 6% of total spending. In addition, just under 2% of academic R&D spending is allocated toward sciences that
include multidisciplinary or interdisciplinary work that could not be classified within a broad field. This estimate is not
comprehensive of all multidisciplinary or interdisciplinary R&D.[14] HERD asks respondents to categorize their spending within the various S&E fields to the maximum extent possible. When R&D spans more than one field, the survey asks respondents to
estimate how much is in each field.
Over the past decade, engineering grew faster than the other S&E fields, at an average annual rate of more than 3% after
adjusting for inflation. Computer sciences, life sciences, social sciences, and psychology each grew by roughly 2%–3% annually.
The mathematical, physical, and geosciences grew more slowly, at around 1% or less annually. All fields of S&E saw slower
average annual growth in recent years (from 2006 to 2015) than earlier (from 1996 to 2005) ( Table 5-6).
National Science Board | 5 | 30
CHAPTER 5 | Academic Research and Development
Science & Engineering Indicators 2018
Growth of academic R&D expenditures, by field: FYs 1997–2016
(Percent)
FieldAverage annual growth rate
1997–2006 2007–16
Computer sciences 6.1 2.8
Geosciences 3.8 0.1
Life sciences 6.4 2.1
Mathematical sciences 4.7 0.6
Physical sciences 3.2 1.2
Psychology 7.0 2.3
Social sciences 2.6 1.6
Engineering 4.8 3.2
Non-S&E NA 6.5
NA = not available; data for non-S&E fields were not collected before FY 2003.
Source(s)
National Science Foundation, National Center for Science and Engineering Statistics, special tabulations (2017) of the Higher Education
Research and Development Survey (HERD).
Science and Engineering Indicators 2018
The largest field for academic R&D, life sciences, at $41 billion, accounted for 57% of total academic spending and a slightly
smaller share (56%) of federally supported academic R&D in 2016 (Appendix Table 5-4). Within life sciences, health sciences
accounted for more than one-half of this field’s spending (and 31% of total academic R&D), while biological and biomedical
sciences constituted just under one-third of spending in the life sciences (and 18% of total academic R&D). The remainder was
spread between agricultural sciences (just under 5% of total academic R&D), natural resources and conservation, and other
life sciences—life sciences R&D that could not be classified into one of the subfields. Academic R&D expenditures in health
sciences almost doubled from 1995 to 2004 and then grew more slowly from 2005 to 2016. The sizeable increase from 1995 to
2004 resulted, in large part, from a near doubling of NIH’s budget from 1998 to 2003.
In 2016, universities spent $11.4 billion on academic R&D in engineering, the second largest field for academic R&D after
the life sciences (Appendix Table 5-4). Engineering R&D—constituting 16% of total academic R&D spending and a slightly
higher share (17%) of federal spending—has generally seen robust growth over the past decade. Bioengineering and
biomedical engineering ($1.1 billion in 2016) and aerospace engineering ($883 million) each grew steadily over the past
decade. Although these engineering fields are smaller in size than electrical ($2.5 billion), mechanical ($1.4 billion), and civil
engineering ($1.3 billion), they grew faster over the past decade. Bioengineering and biomedical engineering grew by more
TABLE 5-6
National Science Board | 5 | 31
CHAPTER 5 | Academic Research and Development
Science & Engineering Indicators 2018
than 75%, and aerospace engineering grew by just under 65% from 2006 to 2016 after adjusting for inflation. Chemical
engineering ($885 million) grew by just under 30%, and metallurgical engineering ($772 million) increased by only 7% after
adjusting for inflation (Appendix Table 5-5).
The remaining six broad fields of S&E, as well as multidisciplinary or interdisciplinary science that has not otherwise been
apportioned among fields, together accounted for about 21% of total spending in 2016. Spending in physical sciences totaled
$4.9 billion. These sciences—consisting of physics, chemistry, astronomy, and materials science—constituted 7% of total
spending and a slightly higher share (8%) of federal spending in 2016 (Appendix Table 5-4). In 1995, by contrast, spending in
physical sciences constituted more than 10% of total academic R&D spending that year (and more than 12% of federal
spending).
At $3.1 billion in 2016, spending on academic R&D in geosciences was distributed among atmospheric, geological, and
ocean sciences. In 2016, geosciences constituted about 4% of academic R&D and a slightly higher share (5%) of federal
spending (Appendix Table 5-4). Among the geosciences, only atmospheric science grew from 2007 to 2016 after adjusting for
inflation (23%). Inflation-adjusted spending decreased in geological and ocean sciences.
Universities spent $2.4 billion on R&D in social sciences in 2016. This spending constituted 3% of total spending and a
lesser share (2%) of federal spending. Spending was fairly evenly distributed among economics, political science, and
sociology, each receiving roughly 15%–20% of total social sciences funding, while the smaller field of anthropology received a
smaller share (4%). The remainder (42%) was spent on archaeology, criminology, geography, linguistics, urban studies, and
other disciplines (Appendix Table 5-4).
With academic R&D spending levels of $2 billion or less each in 2016, computer sciences, psychology, and mathematical
sciences are the smallest broad S&E fields. Universities spent $2 billion on R&D in computer sciences, just over $1 billion in
psychology, and just under $700 million in mathematical sciences.
Universities spent $4.2 billion in non-S&E fields in 2016. This spending constituted just under 6% of total spending and a
much smaller share (3%) of federal spending. Spending was mainly allocated among education R&D (at $1.4 billion), business
management ($650 million), and humanities ($435 million). The remaining non-S&E fields, including communications, law, and
social work, each spent less than $210 million on R&D in 2016 (Appendix Table 5-4 and Appendix Table 5-5).
Academic R&D, by Public and Private Institutions
For their research support, private universities rely more than their public counterparts on the federal government (60%
versus 51% of their total R&D) ( Figure 5-4). Conversely, public institutions derive more of their R&D funds from state
government sources than private ones (8% versus 1% of their total R&D).[15]
Institutional funds, as noted earlier, play a prominent role in academic R&D spending, particularly by public universities. In
2016, public universities paid for about 27% of their R&D from their own institutional funds, while private universities paid for
a smaller share (21%) ( Table 5-7). Public and private institutions reported similar proportions of unrecovered indirect costs
in their institutional total (28% versus 29%) ( Table 5-8).[16]
In addition, private universities rely somewhat more than their public counterparts on R&D funding from businesses (6.7%
versus 5.4%) and nonprofit organizations (8.1% versus 5.6%) ( Figure 5-4).
National Science Board | 5 | 32
CHAPTER 5 | Academic Research and Development
Science & Engineering Indicators 2018
Total and institutionally funded R&D expenditures at universities and colleges, by fiscal year, institution type, and Carnegie classification: FYs 2012–16
(Thousands of dollars)
Fiscal year, institution type, and Carnegie classificationAll R&D expenditures
Total Institutional fundsa
2012 65,729,007 13,587,398
Public 44,162,595 10,409,872
Research universities — very high research activity 29,343,091 7,017,320
Private 21,566,412 3,177,526
Research universities — very high research activity 17,033,727 2,261,034
2013 67,013,138 14,936,380
Public 44,849,697 11,144,662
Research universities — very high research activity 30,094,389 7,466,906
Private 22,163,441 3,791,718
Research universities — very high research activity 17,584,997 2,767,767
2014 67,196,537 15,735,059
Public 44,675,392 11,610,472
Research universities — very high research activity 30,017,465 7,863,789
Private 22,521,145 4,124,587
Research universities — very high research activity 17,860,100 3,001,686
2015 68,566,890 16,608,089
Public 45,428,226 12,135,590
Research universities — very high research activity 30,866,665 8,307,825
Private 23,138,664 4,472,499
Research universities — very high research activity 18,320,160 3,245,663
2016 71,833,308 17,974,962
Public 47,147,814 12,727,952
Research universities — very high research activity 31,841,684 8,480,727
TABLE 5-7
National Science Board | 5 | 33
CHAPTER 5 | Academic Research and Development
Science & Engineering Indicators 2018
Fiscal year, institution type, and Carnegie classificationAll R&D expenditures
Total Institutional fundsa
Private 24,685,494 5,247,010
Research universities — very high research activity 19,407,892 3,858,251
a Excludes research funds spent from multipurpose accounts.
Source(s)
National Science Foundation, National Center for Science and Engineering Statistics, Higher Education Research and Development
Survey (HERD).
Science and Engineering Indicators 2018
National Science Board | 5 | 34
CHAPTER 5 | Academic Research and Development
Science & Engineering Indicators 2018
Higher education R&D expenditures at all universities and colleges financed by institutional funds, by source, fiscal year, institution type, and Carnegie classification: FYs 2012–16
research activity19,407,892 3,858,251 2,154,612 453,452 1,250,187
a Excludes research funds spent from multipurpose accounts.
Source(s)
National Science Foundation, National Center for Science and Engineering Statistics, Higher Education Research and Development
Survey (HERD).
Science and Engineering Indicators 2018
National Science Board | 5 | 36
CHAPTER 5 | Academic Research and Development
Science & Engineering Indicators 2018
Source of R&D funding
Perc
ent
Public Private
Federal government Business Other0
20
40
60
80
Note(s)
Academic institutions' funds exclude research funds spent from multipurpose accounts.
Source(s)
National Science Foundation, National Center for Science and Engineering Statistics, Higher Education Research and Development
Survey (HERD), FY 2016. See Appendix Table 5-2.
Science and Engineering Indicators 2018
Distribution of R&D Funds across Academic Institutions
Academic R&D expenditures are highly concentrated in a relatively small number of institutions. In 2016, out of
approximately 3,000 baccalaureate-, master’s-, and doctorate-granting institutions, 640 reported spending at least $1 million
on R&D.[17] The top-spending 20 institutions accounted for more than 30% of total academic R&D spending in 2016, and the top-spending 100 institutions accounted for just under 80%. The relative shares of the large research universities have been
remarkably stable over the past two decades ( Figure 5-5).
The more numerous public institutions account for a significant share of overall academic R&D spending (Appendix Table
5-2). Among the top 100 universities and colleges in academic R&D expenditures in 2015, approximately two-thirds were
public, and one-third was private (Appendix Table 5-6).
FIGURE 5-4
Sources of R&D funding for public and private academic institutions: FY 2016
National Science Board | 5 | 37
CHAPTER 5 | Academic Research and Development
Science & Engineering Indicators 2018
Fiscal year
Perc
ent
Top 10 institutions Top 20 institutions Top 100 institutions
19971998
19992000
20012002
20032004
20052006
20072008
20092010
20112012
20132014
20152016
0
20
40
60
80
100
Note(s)
Totals for FYs 1996–2002 represent R&D expenditures in S&E fields only. Beginning in FY 2003, totals include R&D expenditures in
S&E fields and non-S&E fields. However, from FY 2003 through FY 2009, some institution totals may be lower-bound estimates
because the National Science Foundation did not attempt to estimate for nonresponse on non-S&E R&D expenditures before FY
2010.
Source(s)
National Science Foundation, National Center for Science and Engineering Statistics, Higher Education Research and Development
Survey (HERD). See Appendix Table 5-6.
Science and Engineering Indicators 2018
Collaboration via Pass-Through Funding
In recent years, pass-through funding arrangements for collaborative projects among universities and other institutions
have continued to grow in similar fashion to overall academic R&D spending. In 2016, public universities and colleges provided
$2 billion in pass-through funds to other educational institutions and an additional $1.5 billion to other subrecipients. Their
private counterparts provided $1.1 billion in pass-through funding to other higher education entities and about the same
amount ($1 billion) to other subrecipients. Public universities received just under $2 billion in pass-through funds from other
educational institutions and an additional $2.8 billion from other entities. Their private counterparts received $1.1 billion in
FIGURE 5-5
Share of academic R&D, by institution rank in R&D expenditures: FYs 1997–2016
National Science Board | 5 | 38
CHAPTER 5 | Academic Research and Development
Science & Engineering Indicators 2018
pass-through funds from other higher educational institutions and about the same amount (just over $1 billion) from other
entities. In a reflection of federal initiatives to encourage collaborative research, the large majority (over 80%) of pass-through
funding arrangements are federally financed (Appendix Table 5-7).
[1] The academic R&D totals presented here exclude expenditures at the federally funded research and development centers (FFRDCs) associated with universities. Those expenditures are tallied separately and discussed in Chapter 4. Nevertheless, the FFRDCs and other national laboratories (including federal intramural laboratories) play an important role in academic research and education, providing research opportunities for students and faculty at academic institutions, often by providing highly specialized, shared research facilities.
[2] This total represents the reported total R&D performance of the 640 institutions that reported at least $1 million in R&D expenditures during their previous fiscal year. It varies slightly from a similar total reported in Chapter 4, which removes the approximately $3 billion in pass-through funds that are double-counted in the HERD totals because such funds are counted by the universities initially receiving the money and by the universities to which the funds are passed. Also, the Chapter 4 total presents calendar-year approximations based on fiscal-year data. The 640 institutions accounted for 99.8% of the total R&D expenditures reported for FY 2016.
[3] In this chapter, the terms universities and colleges, schools, higher education, and academic institutions are used interchangeably.
[4] For a more complete discussion of these concepts, see the Chapter 4 Glossary. Chapter 4 provides further detail on federal obligations for academic R&D, by character of work.
[5] Starting in 2010, the HERD Survey asked institutions to categorize their R&D expenditures as basic research, as applied research, or as development; prior surveys had asked how much total S&E R&D the institution performed and requested an estimate of the percentage of the institution’s R&D expenditures devoted to basic research. By only mentioning basic research, the survey question may have caused some respondents to classify a greater proportion of their activities in this category. The 2010 question provided definitions and examples of the three R&D categories to aid institutions in making more accurate assignments. In debriefing interviews, institutional representatives cited the changes in the survey question as the most important factor affecting their somewhat lower estimates of the amount of basic research that institutions performed. The explicit inclusion of clinical trials and research training grants and the addition of non-S&E R&D may also have contributed.
[6]The academic R&D reported here includes separately accounted-for R&D and related recovered indirect costs. It also includes committed cost sharing and institutional estimates of unrecovered indirect costs associated with externally funded R&D projects. Indirect costs are general expenses that cannot be associated with specific research projects but pay for things that many research projects use collectively at an academic institution. Two major components of indirect costs exist: (1) facilities-related costs, such as the depreciation, maintenance, and operation of facilities used for research; and (2) administrative costs, including expenses associated with financial management, institutional review boards, and environment, health, and safety management. Some indirect costs are recovered as a result of indirect-cost proposals that universities submit based on their actual costs from the previous year.
[7] The federal government funds a much smaller proportion of R&D in non-S&E fields (27% in 2016) than it does in S&E fields (56% in 2016).
[8] See National Research Council (2012) for a report exploring ways to strengthen the partnership between government, universities, and industry in support of national goals.
National Science Board | 5 | 39
CHAPTER 5 | Academic Research and Development
Science & Engineering Indicators 2018
[9]For more information on federally funded higher education R&D expenditures funded by ARRA, see Table 2016 5-3 [NSB 2016]).
[10] Statistics on R&D performance can differ depending on whether the reporting is by R&D performers—in this case, academic institutions—or R&D funders. Reasons for this difference are discussed in the Chapter 4 sidebar Tracking R&D Expenditures: Disparities in the Data Reported by Performers and Sources of Funding.
[11] Unrecovered indirect costs are calculated as the difference between an institution’s negotiated indirect cost rate on a sponsored project and the amount that it recovers from the sponsor. Committed cost sharing is the sum of the institutional contributions required by the sponsor for specific projects (mandatory cost sharing) and the institutional resources made available to a specific project at the discretion of the grantee institution (voluntary cost sharing).
[12] Various challenges exist with measuring institutionally financed research. For some universities, including some with very high research activity, their accounting systems or administrative practices do not enable them to separate the R&D component of multipurpose accounts. Because HERD measures only spending that is fully budgeted as R&D, for these institutions, reported institutional funds are less than the full amount of academic R&D that their schools fund.
[13] Life sciences also feature prominently in research space and equipment, field of degree for S&E doctorate holders, and research publications.
[14] For more information on interdisciplinary research, see the Chapter 5 sidebar “Interdisciplinary Research: Strategic Implications and Measurement Challenges” (NSB 2016:5-31–5-32).
[15] See also the Chapter 2 section Trends in Higher Education Expenditures and Revenues for a discussion of average per-student financial flows at public and private institutions.
[16] In 1991, the Office of Management and Budget capped reimbursement of administrative costs at 26% of total direct costs. As a result, actual unrecovered indirect costs at public and private universities may be somewhat higher than the amounts reported in HERD. The share of unrecovered indirect costs within the institutional funds total has declined in recent years due to the growth in the amount of direct institutional funding for research; the total amount of unrecovered indirect costs has remained relatively stable for both public and private institutions over the past 5 years.
[17] An additional 262 institutions reported spending less than $1 million on academic R&D in FY 2015. These institutions received a shorter version of the survey questionnaire and are not represented in this chapter.
National Science Board | 5 | 40
CHAPTER 5 | Academic Research and Development
Science & Engineering Indicators 2018
Infrastructure for Academic R&D
Physical infrastructure is an essential resource for the conduct of R&D. Traditionally, the capital infrastructure for R&D
consisted primarily of research space (e.g., laboratories, computer rooms) and instrumentation. Accordingly, the square
footage of a designated research space and counts of instruments have been the principal indicators of the status of research
infrastructure.
Advances in information technology have brought significant changes to the methods of scientific research and the
infrastructure necessary to conduct R&D. The technologies, human interfaces, and associated processing capabilities resulting
from these innovations are often called cyberinfrastructure. The value of research facilities, research equipment, and
cyberinfrastructure to the academic R&D infrastructure is highlighted in the sections that follow.
Research Facilities
Research Space
Research-performing universities and colleges in the United States had 214.7 million net assignable square feet (NASF) of
research space available at the end of 2015 (Appendix Table 5-8).[1] This was 1.4% greater than the NASF at the end of 2013, which was the lowest 2-year percentage increase since data collection began in 1988. Since 2005, the average biennial growth
rate (3%) in research space has been less than half of the average biennial growth rate from 1996 to 2005 (7.1%) ( Figure 5-6).
Change in S&E research space in academic institutions, by 2-year period: FYs 1988–2015
National Science Board | 5 | 42
CHAPTER 5 | Academic Research and Development
Science & Engineering Indicators 2018
Period
Perc
ent c
hang
e
Yearly comparison
Change in S&E research space
1988–90
1990–92
1992–94
1994–96
1996–98
1999–2001
2001–03
2003–05
2005–07
2007–09
2009–11
2011–13
2013–15
0
2
4
6
8
10
12
NASF = net assignable square feet.
Note(s)
The biennial survey cycle ran on even years from 1988 to 1998 and on odd years from 1999 to 2013.
Source(s)
National Science Foundation, National Center for Science and Engineering Statistics, Survey of Science and Engineering Research
Facilities.
Science and Engineering Indicators 2018
The biological and biomedical sciences continued to account for the largest share (26%) of academic research space in
2015. In this field, there was a 2.3% decline in research space between 2013 and 2015, compared with an 8.5% average growth
biennially from 2007 to 2013 ( Figure 5-7; Appendix Table 5-8).[2] The health sciences (18%), engineering (16%), agricultural
sciences (13%), and physical sciences (11%) comprised the next largest shares of S&E research space. Research space in the
smaller S&E fields increased by almost 4% from 2013 to 2015, with no single field showing a net loss of space. Engineering is
the only major field where total research space increased consistently from 2007 to 2015. This is similar to the trend in R&D
expenditures over the same period, when the only major fields with continuous growth in expenditures were engineering and
geosciences, atmospheric sciences, and ocean sciences (see Appendix Table 5-5).
National Science Board | 5 | 43
CHAPTER 5 | Academic Research and Development
Science & Engineering Indicators 2018S&
E fie
ld
Millions of net assignable square feet
FY 2007 FY 2015
Agricultural sciences
Biological and biomedical sciences
Computer and information sciences
Engineering
Health sciences
Mathematics and statistics
Physical sciences
Psychology
Social sciences
Other S&E field
0 10 20 30 40 50 60
Note(s)
Natural resources and conservation is included with agricultural sciences for FY 2015. These fields were combined prior to FY 2015.
Source(s)
National Science Foundation, National Center for Science and Engineering Statistics, Survey of Science and Engineering Research
Facilities. See Appendix Table 5-8.
Science and Engineering Indicators 2018
In 2015, 80% of research space was reported by academic institutions as being in superior or satisfactory condition
( Table 5-9).[3] Sixteen percent of space required major renovations within the next 2 years, while the remaining 4% required
replacement. These percentages have changed very little over the past decade.[4]
Between 76% and 84% of research space was rated as either superior or satisfactory across all but two major fields in
2015. Of research space in the computer and information sciences, 91% (4.5 million square feet) was rated as superior or
satisfactory, while 72% of space in the natural resources and conservation field (3.5 million square feet) was similarly rated.
FIGURE 5-7
Research space at academic institutions, by S&E field: FYs 2007 and 2015
National Science Board | 5 | 44
CHAPTER 5 | Academic Research and Development
Science & Engineering Indicators 2018
Condition of S&E research space in academic institutions, by field: FY 2015
(Percent of net assignable square feet)
Field NASF (millions)aCondition (% NASF)
Superior Satisfactory Requires renovations Requires replacement
All research space 210.9 35 45 16 4
Agricultural sciences 27.6 26 50 19 5
Biological and biomedical sciences 54.6 40 42 14 4
Computer and information sciences 4.5 50 41 7 2
Engineering 34.1 35 45 16 4
Geosciences, atmospheric sciences, and
ocean sciences8.1 30 47 17 6
Health sciences 38.4 40 43 14 4
Mathematics and statistics 1.8 30 54 15 2
Natural resources and conservation 3.5 29 43 19 9
Physical sciences 22.2 32 44 18 5
Psychology 5.4 34 45 18 4
Social sciences 5.9 25 55 17 3
Other 4.8 43 38 14 5
NASF = net assignable square feet.
a Includes NASF located at only those institutions that also rated the condition of their space. Consequently, this table accounts for approximately 3.8 million fewer NASF than other tables.
Note(s)
Detail may not add to total because of rounding. Condition was assessed relative to the use of the current research program.
Source(s)
National Science Foundation, National Center for Science and Engineering Statistics, Survey of Science and Engineering Research
Facilities, FY 2015.
Science and Engineering Indicators 2018
TABLE 5-9
National Science Board | 5 | 45
CHAPTER 5 | Academic Research and Development
Science & Engineering Indicators 2018
New Construction
New research space is added each year by starting new construction projects and repurposing existing space. Similarly,
some space is withdrawn from use through decommissioning and repurposing. The net result has been an increase in
research space for more than two decades. As part of this process, academic institutions broke ground on 5.2 million square
feet of new S&E research space construction projects in 2014–15, which was 21% less than the construction space started in
2012–13 (6.6 million square feet) ( Table 5-10). This continued a trend dating to 2002–03, where smaller amounts of new
research space construction have been reported for five of the last six survey cycles. Construction projects for the biological
and biomedical sciences (1.5 million square feet), engineering (1.0 million square feet), and the health sciences (1.0 million
square feet) accounted for two-thirds of new research space construction started in 2014 or 2015.
National Science Board | 5 | 46
CHAPTER 5 | Academic Research and Development
Science & Engineering Indicators 2018
New construction of S&E research space in academic institutions, by field and time of construction: FYs 2006–17
(Millions of net assignable square feet and percent share of total new construction)
Field
Started in FY
2006 or FY
2007
Started in FY
2008 or FY
2009
Started in FY
2010 or FY
2011
Started in FY
2012 or FY
2013
Started in FY
2014 or FY
2015
Planned to start in
FY 2016 or FY
2017
Net assignable square feet (millions)
All fields 8.8 9.9 8.1 6.6 5.2 9.6
Agricultural sciences 0.5 0.4 0.4 0.4 0.4 0.5
Biological and biomedical
sciences2.9 3.5 2.0 2.0 1.5 2.3
Computer and
information sciences0.6 0.3 0.1 0.2 0.1 0.2
Engineering 1.3 2.1 1.3 1.4 1.0 1.5
Geosciences,
atmospheric sciences,
and ocean sciences
0.3 0.1 0.3 0.2 0.2 0.4
Health sciences 1.7 1.9 2.8 1.6 1.0 2.6
Mathematics and
statistics* * * * * *
Natural resources and
conservationna na na na * *
Physical sciences 0.7 0.9 0.6 0.6 0.7 1.0
Psychology 0.1 0.3 0.1 * 0.1 0.1
Social sciences 0.1 0.2 0.1 0.1 * 0.3
Other 0.7 0.3 0.3 0.1 0.2 0.7
Research animal spacea 1.0 0.8 0.6 0.7 0.5 na
Share of total new construction square feet (%)
All fields 100.0 100.0 100.0 100.0 100.0 100.0
Agricultural sciences 5.7 4.0 4.9 6.1 7.7 5.2
TABLE 5-10
National Science Board | 5 | 47
CHAPTER 5 | Academic Research and Development
Science & Engineering Indicators 2018
Field
Started in FY
2006 or FY
2007
Started in FY
2008 or FY
2009
Started in FY
2010 or FY
2011
Started in FY
2012 or FY
2013
Started in FY
2014 or FY
2015
Planned to start in
FY 2016 or FY
2017
Biological and biomedical
sciences33.0 35.4 24.7 30.3 28.8 24.0
Computer and
information sciences6.8 3.0 1.2 3.0 1.9 2.1
Engineering 14.8 21.2 16.0 21.2 19.2 15.6
Geosciences,
atmospheric sciences,
and ocean sciences
3.4 1.0 3.7 3.0 3.8 4.2
Health sciences 19.3 19.2 34.6 24.2 19.2 27.1
Mathematics and
statistics* * * * * *
Natural resources and
conservationna na na na * *
Physical sciences 8.0 9.1 7.4 9.1 13.5 10.4
Psychology 1.1 3.0 1.2 * 1.9 1.0
Social sciences 1.1 2.0 1.2 1.5 * 3.1
Other sciences 8.0 3.0 3.7 1.5 3.8 7.3
Research animal spacea 11.4 8.1 7.4 10.6 9.6 na
* = > 0 but < 50,000 net assignable square feet. na = not applicable; see notes.
a Research animal space is listed separately and is included in individual field totals.
Note(s)
S&E fields and their disciplines were revised in FY 2015. Specifically, "Agricultural sciences and natural resources sciences" has been
split into "Agricultural sciences" and "Natural resources and conservation." "Physical sciences" and its subfields “Earth, atmospheric, and
ocean sciences” and “Astronomy, chemistry, and physics” are now reported under "Geosciences, atmospheric sciences, and ocean
sciences" and "Physical sciences," respectively. Data were not collected separately for "Natural resources and conservation" before the
FY 2015 survey and are included in the "Agricultural sciences" field for earlier cycles. Data are not collected on planned new
construction of research animal space. Detail may not add to total because of rounding. Research animal space is listed separately and
is included in individual field totals.
Source(s)
National Science Foundation, National Center for Science and Engineering Statistics, Survey of Science and Engineering Research
Facilities.
National Science Board | 5 | 48
CHAPTER 5 | Academic Research and Development
Science & Engineering Indicators 2018
Science and Engineering Indicators 2018
Academic institutions initiated new construction in all fields during 2014 and 2015, although the growth rate of new
construction projects slowed over the past decade. These institutions anticipated that an additional 9.6 million square feet of
new research space construction would be started in 2016 or 2017. This is the highest projected total since 10.3 million square
feet were planned for 2010 and 2011. However, not all planned projects are started during the projected time frame because
of various factors, such as changing budgets and priorities. In 2013, academic institutions reported 8.8 million square feet of
planned new research space construction for 2014 or 2015. However, the actual amount reported in 2015 for that period was
5.2 million square feet—59% of what was planned. Data from the previous two cycles of the Survey of Science and Engineering
Research Facilities indicate that 80% of planned new research space was started within the anticipated time frames.
Twenty-two percent of the nation’s 570 research-performing colleges and universities (126 institutions) initiated new
construction of S&E research space in 2014–15, with estimated completion costs of $5.7 billion (Appendix Table 5-9).[5]
Although the new construction costs were an estimated 5.4% greater than projects started in 2012–13, they were lower than
the amounts reported in every other 2-year period since 1998–99.
Academic institutions provide the majority of funds for construction of new research space, typically accounting for more
than 60% of the cost (Appendix Table 5-9).[6] For the construction of new research space initiated in 2014–15, 64% of the funding came from institutions’ internal sources, 20% from state and local governments, and the remaining 16% from the
federal government. Although the $905 million of federal support is the most since data collection began for 1986–87, more
than 60% of that funding was slated for the Facility for Rare Isotope Beams at Michigan State University. The facility is
projected to be complete in 2022.[7]
Repair and Renovation
Academic institutions expended $4.1 billion on major repairs and renovations of S&E research space in 2014–15 (Appendix
Table 5-10).[8] They anticipated another $3.9 billion in costs for planned repair and renovation of research space with start dates in 2016–17. More than $902 million were planned to improve space in biological and biomedical sciences as well as
more than $884 million for improvements to health and clinical sciences space. In addition to these slated improvements,
academic institutions reported $4.9 billion in repair and renovation projects from their institutional plans that were not yet
funded or scheduled to start in 2016–17. Almost $4 billion in further needed improvements were identified that were not
actually included in their institutional plans.
The total backlog of deferred improvements was greater than all projects started or planned for 2014–17. The costs for
deferred repairs and renovations have consistently been greater than those started or planned for similar cycles in the past.
This is due in part to the longer time frames of institutional plans, which often run beyond 5 years, and to the fact that the
total backlog also accounts for projects not included in institutional plans.
In contrast to new construction, spending on repairs and renovations increased biennially since the 1990s, except for a dip
in 2008–09. Federal funding for repairs and renovations fluctuated greatly over this period. State government funding grew
continually for two decades to a peak of $855 million in 2010–11 before declining by more than 40% to $503 million in 2014–
15. Academic institutions have been the main contributors to research space repair and renovation funding, typically
providing 70% or more of the funds. With the latest dip in federal and state government support for these projects,
institutional funds accounted for 86% of research space repair and renovation funding for projects started in 2014–15
(Appendix Table 5-11).[9]
National Science Board | 5 | 49
CHAPTER 5 | Academic Research and Development
Science & Engineering Indicators 2018
Research Equipment
In 2016, universities spent about $2.1 billion for movable equipment necessary for the conduct of academic S&E research
projects (Appendix Table 5-12).[10] This spending accounted for 3.1% of the $67.7 billion total academic S&E R&D expenditures. Annual equipment spending increased 2.2%, on average, from 2014 to 2016 when adjusted for inflation, after
fluctuating by 10%–11% during the previous 3 years. The 2016 total is slightly below average, in constant dollars, for the 2002–
16 period.
Research equipment expenditures continue to be concentrated in just three fields, which accounted for 87% of the 2016
total: life sciences (40%), engineering (29%), and physical sciences (18%). The shares for these three fields have consistently
accounted for about 80% or more of total equipment expenditures, although the combined shares have been at or near the
highest on record for the past several years (Appendix Table 5-12).
When adjusted for inflation, the 2016 level of equipment spending in engineering was 7% greater than the 2015 total. The
2013 and 2014 totals were the highest levels of engineering equipment expenditures reached in decades, while the 2016 level
was above average for the 2006–16 period ( Figure 5-8). Total science equipment spending was 19% lower than the high point
reached in 2004 in constant dollars (Appendix Table 5-12).
National Science Board | 5 | 50
CHAPTER 5 | Academic Research and Development
Science & Engineering Indicators 2018
Fiscal year
Mill
ions
of c
onst
ant 2
009
dolla
rs
Engineering Health sciences Physical sciences Biological and biomedical sciencesGeosciences, atmospheric sciences, and ocean sciences Computer and information sciences
Gross domestic product deflators come from the U.S. Bureau of Economic Analysis and are available at https://www.bea.gov/
national/, accessed 10 February 2016.
Source(s)
National Science Foundation, National Center for Science and Engineering Statistics, Higher Education Research and Development
Survey (HERD). See Appendix Table 5-12.
Science and Engineering Indicators 2018
Unlike funding for new construction of research space, which relies heavily on institutional funds, most academic research
equipment funding typically comes from the federal government. These federal funds are received as part of research grants
or as separate equipment grants. Prior to 2014, federal support for research equipment had not fallen below 50% since data
were initially collected in 1981. The federal share of research equipment funding reached 63% as recently as 2011. In 2014, the
federal government supported 45% of total academic S&E research equipment funding. This share ticked slightly higher in
2015, to 47%, but fell again to 45% in 2016 (Appendix Table 5-13).
The federal share of funding varies significantly by S&E field and subfield. Atmospheric sciences and meteorology (85%),
physics (74%), and industrial and manufacturing engineering (69%) were the only fields receiving around 70% or more federal
FIGURE 5-8
Current fund expenditures for S&E research equipment at academic institutions, by selected S&E field: FYs 2006–16
National Science Board | 5 | 51
CHAPTER 5 | Academic Research and Development
Science & Engineering Indicators 2018
funding for R&D equipment, while two fields (political science and government, 13%; economics, 8%) received less than 20%
federal support.
Cyberinfrastructure
Advances in computing technology and information technology have changed the nature of scientific research and the
infrastructure for conducting it over the past three decades. Cyberinfrastructure includes resources such as high-capacity
networks, which are used to transfer information, and data storage systems, which are used for short-term access or long-
term curation. It may also involve high-performance computing (HPC) systems used to analyze data, create visualization
environments, or facilitate remote use of scientific instrumentation (NSF 2012). Cyberinfrastructure helps researchers process,
transfer, manage, analyze, and store large quantities of data.
Rapid changes in the field and the often decentralized nature of many research project requirements have made
quantifying these resources very difficult. Many researchers access computing, storage, software, and networking resources
on their own rather than through the resources their universities provide. Increasingly, academic institutions are centralizing
their cyberinfrastructure resources to increase efficiency.
The Extreme Science and Engineering Discovery Environment (XSEDE) is part of a continuing federal effort to provide the
academic research community with a range of HPC, networking, visualization, data storage, software, and support services.
NSF announced the 5-year, $121 million project in 2011 as a partnership of 17 institutions supporting 16 supercomputers
across the country, with the anticipation of expanding resources throughout the lifetime of the project (NSF 2011). XSEDE
enabled more than 6,000 scientists to conduct research, at no added cost, from its initiation in 2011 through 2016.
Federal investment in cyberinfrastructure for academic, federal, and industry research gained visibility and momentum
with the National Strategic Computing Initiative (NSCI), created by executive order of the president in 2015 (White House,
Office of the Press Secretary 2015). The strategic plan, outlined in 2016, explained the initiative as
a whole-of-Nation effort to sustain and enhance U.S. leadership in high-performance computing. The NSCI seeks to
accomplish five strategic objectives in a government collaboration with industry and academia: (1) accelerate the
successful deployment and application of capable exascale computing; (2) ensure that new technologies support
coherence in data analytics as well as simulation and modeling; (3) explore and accelerate new paths for future
computing architectures and technologies, including digital computing and alternative computing paradigms; (4)
holistically expand capabilities and capacity of a robust and enduring HPC ecosystem; and (5) establish an enduring
public-private collaboration to ensure shared benefit across government, academia, and industry. (NSCI Executive
Council 2016:3)[11]
The strategic plan highlighted the critical roles of academia, government, and industry in the process. The goal is to ensure
access to HPC resources for academic and industry researchers so that the United States can maintain its science and
technology leadership role.
[1]Research space here is defined as the space used for sponsored R&D activities at academic institutions and for which there is separate budgeting and accounting. Research space is measured in net assignable square feet (NASF); this is the sum of all areas on all floors of a building assigned to, or available to be assigned to, an occupant for a specific use, such as research or instruction. NASF is measured from the inside faces of walls. Multipurpose space that is partially used for research is prorated to reflect the proportion of time and use devoted to research. Totals exclude research space at FFRDCs associated with universities.
National Science Board | 5 | 52
CHAPTER 5 | Academic Research and Development
Science & Engineering Indicators 2018
[2]Changes were made to some S&E fields between FYs 2005 and 2007, which include several field name changes, the order in which fields are listed in survey questions, and the disciplines included in several fields. Consequently, there is a break in data continuity at the field level from FYs 2005 to 2007.
[3]For the FY 2015 Survey of Science and Engineering Research Facilities, 570 academic institutions were asked to identify the percentage of research NASF (including research animal space) that fell into each of the four following condition categories in the next 2 years (FYs 2016–17): superior condition—suitable for the most scientifically competitive research in this field over the next 2 years; satisfactory condition—suitable for continued use over the next 2 years for most levels of research in this field but may require minor repairs or renovation; requires renovation—will no longer be suitable for current research without undergoing major renovation within the next 2 years; requires replacement—should stop using space for current research within the next 2 years.
[4] Tables containing ratings of research space condition for past facilities surveys can be found at https://nsf.gov/statistics/srvyfacilities/.
[5] On the FY 2014 HERD, 570 academic institutions reported at least $1 million in R&D expenditures. These institutions were used to create the frame for the FY 2015 Survey of Science and Engineering Research Facilities. As noted earlier in the chapter, 640 institutions reported at least $1 million in R&D expenditures on the FY 2015 HERD.
[6]Institutional sources include universities’ operating funds, endowments, private donations, tax-exempt bonds and other debt financing, and indirect costs recovered from federal and nonfederal sources.
[7]Adjusted for inflation, the previous highest total of federal funding for new construction of S&E research space reported in this survey was $829 million (in inflation-adjusted 2015 dollars) during FYs 1990–91. For information on federal funding of the Facility for Rare Isotope Beams, see Howell (2014) and https://frib.msu.edu/index.php.
[8]Only projects whose prorated cost was estimated to be $250,000 or more for at least one S&E field were included.
[9] Data from 1986 to 2015 for new construction and repair and renovation funding are available in (NSF/NCSES 2017). The tables at the NSF/NCSES website display more years because they have a limited breakdown of type of institutional control (public versus private).
[10]Because of rising capitalization thresholds, the dollar threshold for inclusion in the equipment category has changed over time. Generally, university equipment that costs less than $5,000 would be classified under the supplies cost category.
[11]Exascale refers to computing systems capable of producing at least a billion billion calculations per second or floating operations per second.
Academically employed research doctorate holders in S&E hold a central role in the nation’s academic R&D enterprise.
Through the R&D they undertake, S&E doctorate holders produce new knowledge and contribute to marketplace innovation.
They also teach and provide training opportunities for young people who may then go on to earn S&E doctorates; some of
these young doctorate holders will then train the next generation of scientists and engineers, while others will contribute
through their employment in business or in government.
This section examines trends in the size and demographic composition of the doctoral S&E academic workforce and its
deployment across institutions, positions, and fields. The workforce includes those with a research doctorate in science,
engineering, or health who are employed in 2- or 4-year colleges or universities,[1] including medical schools and university research institutes, in the following positions: full and associate professors (referred to as senior faculty); assistant professors
(referred to as junior faculty); postdoctorates (postdocs); other full-time positions, such as instructors, lecturers, adjunct
faculty, research associates, and administrators; and part-time positions of all kinds. Unless otherwise specified, these
individuals earned their doctorate at a U.S. university or college. Particular attention is paid to the component of this
workforce that is more focused on research, including those employed in postdoc positions and researchers receiving federal
support. A central message of this section is that, whether looked at across 15–20 years or across four decades, the
demographic composition of the academically employed S&E workforce, like the S&E workforce overall, has changed
substantially. There also have been noteworthy changes in the types of positions or job titles held by S&E doctorates
employed at academic institutions.
Longer-term comparisons (from 1973 to 2015) are made to illustrate fluctuations over multiple decades and trends that
continue to unfold. Shorter-term comparisons (generally from the early to mid-1990s to 2015) are made to illustrate what the
past two decades have brought forth.[2] Comparisons over the 12-year period from 2003 to 2015 are used in the discussion of minorities in the academically employed workforce because the race and ethnicity categories before this time are not directly
comparable to those from 2003 forward. Because individuals in faculty and nonfaculty positions both conduct R&D, much of
the discussion addresses the overall academic employment of U.S.-trained S&E doctorate holders, regardless of position or
rank. However, at various points, full-time faculty and those who work outside of the full-time faculty population are discussed
separately. (For an overview of the data sources used, see sidebar Data on Doctoral Scientists and Engineers in Academia,
and see sidebar Foreign-Trained Academic S&E Doctoral Workforce.)
National Science Board | 5 | 54
CHAPTER 5 | Academic Research and Development
Science & Engineering Indicators 2018
Data on Doctoral Scientists and Engineers in AcademiaData on academically employed research doctorate holders are drawn primarily from the Survey of Doctorate Recipients
(SDR), a biennial National Science Foundation (NSF) survey of individuals, including those born in foreign countries, who
received their research doctorate in an S&E field from a U.S. institution. This survey provides the most comprehensive
data available on these individuals. Data are provided on educational background, employment status, occupation, and
demographic characteristics. Unless specifically stated, estimates of S&E doctorates come from the SDR. The latest
survey is available at https://www.nsf.gov/statistics/srvydoctoratework/#qs.
In 2015, the SDR was expanded with a much larger sample to produce better estimates of employment outcomes by the
detailed field of degree taxonomy used in the Survey of Earned Doctorates, the SDR’s sampling frame. As in prior years,
underrepresented populations were oversampled, including women and certain racial and ethnic groups (blacks,
Hispanics, and Native Americans or American Indians). As a result, more precise estimates by finer categories of field are
available for all U.S.-trained S&E doctorate holders and for subpopulations that historically have been underrepresented
in S&E employment. The expanded SDR also provides full representation of foreign-born S&E doctorate holders,
especially those who became naturalized citizens, because the sampling frame included all respondents who had earned
a degree from a U.S. academic institution since 1960, regardless of their residency in 2015.
Because the SDR covers only U.S.-trained individuals, it substantially undercounts postdoctoral researchers (postdocs),
most of whom were trained outside the United States, and provides no estimates of foreign-trained doctoral holders in
other positions in academia, such as full-time faculty. Two other surveys referenced in this section supplement SDR data
to provide coverage of the foreign-trained doctorate recipients. To obtain more complete counts of postdocs, this section
supplements SDR’s estimated counts with counts provided in the Survey of Graduate Students and Postdoctorates in
Science and Engineering, an annual survey cosponsored by NSF and the National Institutes of Health. The latest survey is
available at https://nsf.gov/statistics/srvygradpostdoc/.
To provide more data on the role of foreign-trained doctorate holders in academic R&D, this section draws from NSF’s
National Survey of College Graduates (NSCG). Although the NSCG provides less detail on academic employment, it
provides estimates of the foreign-trained component. See the sidebar Foreign-Trained Academic S&E Doctoral Workforce
for data on foreign-trained individuals’ presence in academic employment. The latest NSCG surveys are available at
Foreign-Trained Academic S&E Doctoral WorkforceU.S. universities and colleges have long employed S&E doctorate holders from foreign countries; most received their
doctorate from a U.S. institution, but many earned it overseas. In 2015, approximately 68,000 foreign-trained S&E
doctorate holders worked in U.S. higher education institutions. Approximately 70% of the foreign-trained doctorate
holders were men, and 30% were women.
Because the Survey of Doctorate Recipients (SDR) uses a more restrictive definition of the research doctorate, some
complications exist in comparing National Survey of College Graduates S&E fields with those from the SDR, particularly
with regard to the life sciences and psychology. Taking these complications into consideration, the field distribution of
the foreign-trained doctorate holders nonetheless varies from the U.S.-trained doctorate holders. The majority (just over
55%) of the foreign-trained individuals hold doctorates in the life sciences, while the majority of their U.S.-trained
counterparts hold doctorates in the life sciences (34%) or the social sciences (18%) ( Table 5-B; Appendix Table 5-14). In
2015, female foreign-trained S&E doctorate holders were largely concentrated in the life sciences, whereas their male
counterparts had large concentrations in the life sciences and physical sciences ( Table 5-B).
Foreign-trained doctorate holders have a substantial presence in conducting academic R&D, with about 90% reporting
that research was their primary or secondary work activity in 2015 and more than one-half (52%) reporting support from
federal grants and contracts. A smaller percentage of foreign-trained S&E doctorate holders is heavily engaged in
teaching. In 2015, about 28% reported that teaching was their primary or secondary work activity ( Table 5-C).
SIDEBAR
National Science Board | 5 | 56
CHAPTER 5 | Academic Research and Development
Science & Engineering Indicators 2018
Foreign-trained S&E doctorate holders employed in academia, by degree field and sex: 2015(Number)
Degree field Total Male Female
Full-time positions
All fields 64,000 46,000 18,000
Physical sciences 16,000 15,000 s
Computer and mathematical sciences 6,000 4,000 s
Life sciences 36,000 22,000 14,000
Social sciences and psychology 3,000 2,000 s
Engineering 3,000 3,000 s
Part-time positions
All fields 4,000 2,000 2,000
s = suppressed for reasons of confidentiality and/or reliability.
Note(s)
Detail may not add to total because of suppression. Numbers are rounded to the nearest 100.
Source(s)
National Science Foundation, National Center for Science and Engineering Statistics, special tabulations (2017) of the 2015
National Survey of College Graduates (NSCG).
Science and Engineering Indicators 2018
TABLE 5-B
National Science Board | 5 | 57
CHAPTER 5 | Academic Research and Development
Science & Engineering Indicators 2018
Foreign-trained S&E doctorate holders employed in academia, by research and teaching focus: 2015(Percent)
Field Federal support R&D Teaching
Full-time positions
All fields 51.6 90.6 28.1
Physical sciences 31.3 93.8 25.0
Computer and mathematical sciences 33.3 83.3 50.0
Life sciences 66.7 91.7 19.4
Social sciences and psychology s 66.7 66.7
Engineering 66.7 100.0 66.7
Part-time positions
All fields 25.0 50.0 75.0
s = suppressed for reasons of confidentiality and/or reliability.
Note(s)
The percentage conducting R&D is the percentage of S&E doctorate holders reporting that their primary or secondary work
activity is R&D. The percentage teaching is the percentage of S&E doctorate holders reporting that their primary or secondary
work activity is teaching.
Source(s)
National Science Foundation, National Center for Science and Engineering Statistics, special tabulations (2017) of the 2015
National Survey of College Graduates (NSCG).
Science and Engineering Indicators 2018
Trends in Academic Employment of S&E Doctorate Holders
Academic employment of S&E doctorate holders grew over the past three decades and reached just under 400,000 in 2015.
Of this total, the large majority—almost 330,000—were U.S. trained. Among these, about one-third (97,000) were born outside
of the United States. This section will focus on the U.S.-trained segment because we have more detailed data available for this
group. There was an increase of about 20,000 over the estimated employment numbers for the U.S.-trained segment in 2013
(Appendix Table 5-14). In recent decades, growth in the number of U.S.-trained doctoral scientists and engineers in the
academic sector has been slower than the rate of growth in the business and government sectors, resulting in a decline in the
TABLE 5-C
National Science Board | 5 | 58
CHAPTER 5 | Academic Research and Development
Science & Engineering Indicators 2018
academic sector’s share of all U.S.-trained S&E doctorates, from 55% in the early 1970s to just under 50% in the mid-1990s to
about 45% in 2015.
Trends in Types of Academic Positions Held
The doctoral academic workforce discussed in this section includes doctorate holders in S&E who are employed at 2- and
4-year colleges and universities, including medical schools and university research institutes. This workforce includes full and
associate professors (senior faculty); assistant professors (junior faculty); postdocs; individuals in other full-time positions,
such as instructors, lecturers, adjunct faculty, research associates, and administrators; and those employed in part-time
positions of all kinds.
When looking at broad trends by position title over the past 40 years, very different patterns emerge. The total number of
U.S.-trained, academically employed doctorate holders in S&E almost tripled over the period from 1973 to 2015, rising from
118,000 to just under 330,000, while the number of full-time faculty more than doubled (from 103,000 to 228,000) (Appendix
Table 5-14). By contrast, the number of other full-time positions increased by more than 700% from 1973 to 2015, rising
rapidly from a low base of 7,600 (6% of the total) to 62,600 (19% of the total).
Full-time faculty positions as senior or junior faculty continue to be the norm in academic employment, but S&E doctorate
holders are increasingly employed in other types of positions ( Figure 5-9). The proportion of full-time faculty among all U.S.-
trained, academically employed S&E doctorate holders fell from almost 90% (103,000 of 118,000 total) in the early 1970s to
about 80% by the mid-1990s and then dropped further, to just under 70%, in 2015 (228,000 of 330,000 total). The decline in
the proportion of full-time faculty was evident among doctorate holders in all S&E fields (Appendix Table 5-14). The proportion
of part-time positions increased from 2% in 1973 (2,900) to 6% of all academic S&E doctorate holders in 2015 (19,800).
However, an increase in the share of U.S.-trained postdoctoral positions in most years through 2006 has reversed.[3] From the early 1970s to 2015, the proportion of U.S.-trained postdocs increased from 4% in 1973 (4,200) to 9% in 2006 (23,300), then
declined to 6% in 2015 (19,200). There has also been a decrease in the percentage of U.S.-trained doctorate holders in tenured
positions.
National Science Board | 5 | 59
CHAPTER 5 | Academic Research and Development
Science & Engineering Indicators 2018
Year
Perc
ent
Full-time faculty Other full-time positions Postdoctorates Part-time positions
19731975
19771979
19811983
19851987
19891991
19931995
19971999
20012003
20062008
20102013
20150
100
25
50
75
Note(s)
Academic employment is limited to U.S. doctorate holders employed at 2- or 4-year colleges or universities, medical schools, and
university research institutes. Full-time faculty includes full, associate, and assistant professors and instructors (from 1973 to 1995)
and full, associate, and assistant professors (from 1997 to 2015). Other full-time positions include positions such as research
associates, adjunct appointments, instructors (from 1997 to 2015), lecturers, and administrative positions. Part-time positions
exclude those held by students or retired people. Percentages may not add to 100% because of rounding.
Source(s)
National Science Foundation, National Center for Science and Engineering Statistics, special tabulations (2017) of the 1973–2015
Survey of Doctorate Recipients (SDR).
Science and Engineering Indicators 2018
From the early 1970s through 2015, growth in the academic employment of life scientists, psychologists, and engineers
was greater than for doctorate holders in other S&E fields ( Figure 5-10). Starting from a very small base around 1980, there
was also consistent, rapid growth in the number of computer and information scientists. Growth in academic employment
slowed in the early to mid-1990s for social sciences, physical sciences, and mathematics and statistics. It has increased since
then in social sciences and mathematics and statistics and, recently, in the physical sciences (Appendix Table 5-14). Similar to
spending patterns discussed in the first section of this chapter, Spending for Academic R&D, the most recent decade saw
FIGURE 5-9
S&E doctorate holders employed in academia, by type of position: 1973–2015
National Science Board | 5 | 60
CHAPTER 5 | Academic Research and Development
Science & Engineering Indicators 2018
greater growth in the number of engineers in academic employment than their peers in most fields of science, while hiring of
computer and information scientists continued to grow rapidly from a small base ( Figure 5-10).
Year
Thou
sand
s
Engineering Social sciences Psychology Physical sciencesMathematics and statistics Life sciences Computer and information sciences
1973 1983 1993 2003 20150
100
200
300
400
Note(s)
Data for computer sciences are not available for 1973. Academic employment is limited to U.S. doctorate holders employed at 2- or
4-year colleges or universities, excluding those employed part time who are students or retired. Physical sciences include earth,
atmospheric, and ocean sciences; life sciences include biological, agricultural, environmental, and health sciences. Numbers are
rounded to the nearest 100.
Source(s)
National Science Foundation, National Center for Science and Engineering Statistics, special tabulations (2017) of the 1973–2015
Survey of Doctorate Recipients (SDR).
Science and Engineering Indicators 2018
Trends in Tenure Status
Among U.S.-trained S&E doctorate holders employed in academia, the proportion that has achieved tenure has diminished
since 1995. In 1995, about 53% (118,000) of U.S.-trained S&E doctorate holders in academic employment held tenured
positions; this decreased to 47% in 2015 (154,000) as nontenured positions of various types grew as a proportion of expanding
FIGURE 5-10
S&E doctorate holders employed in academia, by field: Selected years, 1973–2015
National Science Board | 5 | 61
CHAPTER 5 | Academic Research and Development
Science & Engineering Indicators 2018
overall doctoral academic employment ( Figure 5-11).[4] Somewhat higher percentages of individuals in 1995 (17%; 37,000
individuals) as in 2015 (15%; 48,000 individuals) were untenured but on a tenure track.
Year
Perc
ent
Tenured Tenure track Not on tenure track No tenure system
s = suppressed for reasons of confidentiality and/or reliability.
Note(s)
Academic employment is limited to U.S. doctorate holders employed at 2- or 4-year colleges or universities, medical schools, and
university research institutes. Percentages may not add to 100% because of rounding. Others include S&E doctorate holders at
institutions where no tenure is offered or there is no tenure for the position held.
Source(s)
National Science Foundation, National Center for Science and Engineering Statistics, special tabulations (2017) of the Survey of
Doctorate Recipients (SDR).
Science and Engineering Indicators 2018
The reduction from 1995 to 2015 in tenured positions’ share of total positions occurred across most (but not all) Carnegie
classifications (see Chapter 2 sidebar Carnegie Classification of Academic Institutions for a discussion of Carnegie
classifications). In 1995, an estimated 47% of academically employed S&E doctorate holders at the most research-intensive
institutions (research I institutions) held tenured positions (42,300 individuals); this percentage decreased to 40% in 2015
(46,400 individuals). Reductions in share also occurred at less research-intensive institutions (research II institutions). However,
TABLE 5-12
National Science Board | 5 | 64
CHAPTER 5 | Academic Research and Development
Science & Engineering Indicators 2018
at medical schools and medical centers, largely similar percentages of academically employed doctorate holders occupied
tenured positions in 1995 (30%; 10,800 individuals) as in 2015 (27%; 14,200 individuals).[5] A similar trend was seen at baccalaureate institutions (58%, or 12,800 individuals, in tenured positions in 2015, compared with 61%, or 9,700 individuals,
in 1995).
Just over one-third of academically employed doctorate holders earned their degree before 1995 (119,000). The remainder
(210,000) are here considered early- to mid-career doctorate holders in that they earned their degree in 1995 or later. This
younger cohort was less likely than the older group to be employed in tenured positions and more likely to hold positions
outside of the tenure system. Overall, more than two-thirds of those who earned their doctorate before 1995 held tenured
positions (85,700 individuals), while only one-third of the more recently degreed were tenured (67,900). Tenure status for the
two groups varied somewhat by field ( Table 5-13).
National Science Board | 5 | 65
CHAPTER 5 | Academic Research and Development
Science & Engineering Indicators 2018
Tenure status of S&E doctorate holders employed in academia, by career stage and field of doctorate: 2015
(Percent)
Field of doctorateDoctorate awarded before 1995 Doctorate awarded in 1995 or later
Mathematics and statistics 86.5 1.1 11.2 44.6 24.0 31.4
Computer and information sciences 83.3 s 12.5 43.3 28.4 28.4
Life sciences 66.8 2.2 30.8 23.8 20.4 55.8
Psychology 59.2 2.8 38.0 32.7 20.0 47.3
Social sciences 80.0 0.9 18.7 44.6 25.5 29.6
Engineering 78.9 0.7 20.4 34.4 25.2 40.4
s = suppressed for reasons of confidentiality and/or reliability.
Note(s)
Academic employment is limited to U.S. doctorate holders employed at 2- or 4-year colleges or universities, medical schools, and
university research institutes. Percentages may not add to 100% because of rounding. Others include S&E doctorate holders at
institutions where no tenure is offered or there is no tenure for the position held.
Source(s)
National Science Foundation, National Center for Science and Engineering Statistics, special tabulations (2017) of the 2015 Survey of
Doctorate Recipients (SDR).
Science and Engineering Indicators 2018
Women in the Academic S&E Workforce
The past 40 years have seen 10-fold growth in women’s participation in the academic doctoral S&E workforce. In 1973, only
about 11,000 U.S.-trained female S&E doctorates were employed in academia, contrasting sharply with about 123,000 in 2015.
Over the past two decades alone, academic employment of women with S&E doctorates rose from about 52,000 in 1995 to
123,000 in 2015. Over the four decades, the number of their male counterparts almost doubled, growing from 107,000 to
about 206,000 (Appendix Table 5-15).
These differential rates of increase are reflected in the steadily rising proportion of women with S&E doctorates in the
academic workforce. Despite the impressive gain, women with S&E doctorates still account for a minority of the people
employed in academia. Women constituted 37% of all U.S.-trained, academic S&E doctoral employment and 31% of full-time
TABLE 5-13
National Science Board | 5 | 66
CHAPTER 5 | Academic Research and Development
Science & Engineering Indicators 2018
senior faculty in 2015, up from 9% and 6%, respectively, in 1973 (Appendix Table 5-15). Women’s share of academic S&E
employment increased markedly over time in all full-time position categories ( Table 5-14). Until recently, women have held a
noticeably larger proportion of junior faculty positions than senior ones, reflecting a trend over the past half-century in a rising
proportion of doctoral degrees earned by women, coupled with their slightly greater propensity to enter academic
employment. The proportion of women in all faculty ranks rose substantially between 1973 and 2015, reaching 25% of full
professors, 40% of associate professors, and 43% of assistant professors ( Figure 5-12). By contrast, women's share of part-
time positions was similar in 1973 (48%) and 2015 (52%).
Women as a percentage of S&E doctorate holders employed in academia, by position: Selected years, 1973–2015
(Percent)
Position 1973 1983 1993 2003 2015
All positions 9.1 15.0 21.9 30.3 37.4
Full-time senior faculty 5.8 9.3 14.2 22.8 30.9
Full-time junior faculty 11.3 23.5 32.2 39.7 42.5
Other full-time positions 14.5 23.1 30.2 34.8 43.9
Postdocs 14.3 30.1 30.8 38.0 42.7
Part-time positions 48.3 41.7 61.0 54.5 52.0
Note(s)
Academic employment is limited to U.S. doctorate holders employed at 2- or 4-year colleges or universities, medical schools, and
university research institutes. Senior faculty includes full and associate professors; junior faculty includes assistant professors and
instructors in 1973, 1983, and 1993; in 2003 and 2015, junior faculty includes assistant professors. Other full-time positions include
positions such as research associates, adjunct appointments, instructors (in 2003 and 2015), lecturers, and administrative positions.
Part-time positions exclude those employed part time who are students or retired.
Source(s)
National Science Foundation, National Center for Science and Engineering Statistics, special tabulations (2017) of the 2003 and 2015
Survey of Doctorate Recipients (SDR).
Science and Engineering Indicators 2018
TABLE 5-14
National Science Board | 5 | 67
CHAPTER 5 | Academic Research and Development
Science & Engineering Indicators 2018
Year
Perc
ent
Full professor Associate professor Junior faculty
1973 1983 1993 2003 20150
10
20
30
40
50
Note(s)
Academic employment is limited to U.S. doctorate holders employed at 2- or 4-year colleges or universities, medical schools, and
university research institutes, excluding those employed part time who are students or retired. Junior faculty includes assistant
professors and instructors in 1973, 1983, and 1993; in 2003 and 2015, junior faculty includes assistant professors.
Source(s)
National Science Foundation, National Center for Science and Engineering Statistics, special tabulations (2017) of the 2003 and 2015
Survey of Doctorate Recipients (SDR).
Science and Engineering Indicators 2018
Also reflecting the long-term trend of a rising proportion of doctoral degrees earned by women is the fact that women
constitute a much larger share of the younger cohort of academic doctorate holders degreed since 1995 (44%; 91,800) than
their older counterparts degreed before 1995 (26%; 31,500). In 2015, the younger cohort of women constituted 34% of full
professors and 43% of associate professors and assistant professors, while their older counterparts held 22% of full
professorships, 32% of associate professorships, and 39% of assistant professorships ( Figure 5-13).
Women’s presence varied across S&E fields. Women are relatively more concentrated in the life sciences, social sciences,
and psychology, with correspondingly lower shares in engineering, physical sciences, mathematics and statistics, and
computer and information sciences. Women’s share of doctorate holders in each of these fields, however, grew during the
FIGURE 5-12
Women as a percentage of S&E doctorate holders employed full time in academia, by academic rank: Selected years, 1973–2015
National Science Board | 5 | 68
CHAPTER 5 | Academic Research and Development
Science & Engineering Indicators 2018
1973–2015 period (Appendix Table 5-15). Although, as noted previously, there has been an overall reduction over the past 20
years in the proportion of U.S.-trained S&E doctorate holders who have achieved tenure, the experiences of men and women
have differed ( Table 5-15). There were reductions over this period in the proportion of men in tenured positions across most
S&E fields; the proportion of women, on the contrary, rose or remained similar.
Although a smaller proportion of women than men held tenured positions, among the younger cohort (those degreed
since 1995), women held the majority of full-time faculty positions in psychology (58%) and were at parity with men in full-time
faculty positions in the life sciences (about 50%).
When doctorate awarded
Perc
ent
Full professor Associate professor Assistant professor
Doctorate awarded before 1995 Doctorate awarded in 1995 or later0
10
20
30
40
50
Note(s)
Academic employment is limited to U.S. doctorate holders employed at 2- or 4-year colleges or universities, medical schools, and
university research institutes, excluding those employed part time who are students or retired.
Source(s)
National Science Foundation, National Center for Science and Engineering Statistics, special tabulations (2017) of the 2015 Survey of
Doctorate Recipients (SDR).
Science and Engineering Indicators 2018
FIGURE 5-13
Women as a percentage of younger and older S&E doctorate holders employed full time in academia, by academic rank: 2015
National Science Board | 5 | 69
CHAPTER 5 | Academic Research and Development
Science & Engineering Indicators 2018
Tenured S&E doctorate holders employed in academia, by sex and field: 1995 and 2015
(Percent)
TenuredTotal Female Male
1995 2015 1995 2015 1995 2015
All fields 52.6 46.6 34.5 37.2 58.3 52.3
Physical sciences 48.2 44.4 23.9 37.4 51.5 46.3
Mathematics and statistics 70.0 62.7 44.4 50.0 73.5 66.9
Computer and information sciences 40.6 53.8 33.3 47.4 42.3 55.6
Life sciences 45.4 37.8 30.4 29.6 52.0 44.8
Psychology 50.8 42.4 33.9 35.4 63.9 51.8
Social sciences 63.5 58.3 47.3 50.9 69.4 62.9
Engineering 54.1 50.6 25.0 40.0 56.3 53.0
Note(s)
Academic employment is limited to U.S. doctorate holders employed at 2- or 4-year colleges or universities, medical schools, and
university research institutes, excluding those working part time because they are students or are retired.
Source(s)
National Science Foundation, National Center for Science and Engineering Statistics, special tabulations (2016) of the Survey of
Doctorate Recipients (SDR).
Science and Engineering Indicators 2018
Minorities in the Academic S&E Workforce
Similar to women, members of underrepresented minority groups (i.e., blacks, Hispanics, and American Indians or Alaska
Natives) have increased their presence in academic employment over time, but to a much lesser degree (Appendix Table
5-16).[6] Combined, these groups constituted 8.9% of total doctoral academic S&E employment in 2015, up from about 7.9% in
2003.[7] Underrepresented minorities held 8.6% of full-time faculty positions in 2015, up from 7.0% in 2003 and 1.9% in 1973
( Table 5-16). Compared with white and Asian or Pacific Islander S&E doctorate holders employed in academia,
underrepresented minorities in 2015 were somewhat more concentrated in psychology and the social sciences and somewhat
less so in the physical sciences and mathematics and statistics (Appendix Table 5-16).
TABLE 5-15
National Science Board | 5 | 70
CHAPTER 5 | Academic Research and Development
Science & Engineering Indicators 2018
Underrepresented minorities as a percentage of S&E doctorate holders employed in academia, by position: Selected years, 1973–2015
(Percent)
Position 1973 1983 1993 2003 2015
All positions 2.0 3.7 5.0 7.9 8.9
Full-time faculty 1.9 3.6 5.0 7.0 8.6
Postdocs 2.4 4.8 4.5 7.0 8.9
Other positions 2.9 4.1 5.3 7.3 9.8
Note(s)
Underrepresented minorities include blacks or African Americans, Hispanics or Latinos, and American Indians or Alaska Natives.
Because of changes in the survey questionnaire, data from 2003 to 2015 are not directly comparable with earlier years' data. Academic
employment is limited to U.S. doctorate holders employed at 2- or 4-year colleges or universities, medical schools, and university
research institutes. Faculty includes full, associate, and assistant professors plus instructors in 1973, 1983, and 1993. In 2003 and 2015,
faculty includes full, associate, and assistant professors. Other positions include part-time positions and full-time positions such as
research associates, adjunct appointments, instructors (in 2003 and 2015), lecturers, and administrative positions. Other positions
exclude those employed part time who are students or retired.
Source(s)
National Science Foundation, National Center for Science and Engineering Statistics, special tabulations (2017) of the 2003 and 2015
Survey of Doctorate Recipients (SDR).
Science and Engineering Indicators 2018
In 2003 and 2015, a slightly higher percentage of women (9.1% in 2003; 10.5% in 2015) than men (6.3% in 2003; 7.6% in
2015) who are underrepresented minorities held faculty positions in academic institutions.[8] Black and Hispanic women each held 4%–5% of full-time faculty positions held by women in both 2003 and 2015, while black and Hispanic men each held 3%–
4% of such positions held by men ( Figure 5-14). American Indian or Alaska Native men and women held about the same
percentage of full-time faculty positions in 2003 and 2015 (less than 1%). Similar percentages (around 43%) of
underrepresented minorities held tenured positions in 2003 and 2015; however, a smaller share held tenure-track positions in
2015 than in 2003 ( Figure 5-15).
TABLE 5-16
National Science Board | 5 | 71
CHAPTER 5 | Academic Research and Development
Science & Engineering Indicators 2018
S&E doctorate holders
Perc
ent
2003 2015
Asian men Asian women Black men Black women Hispanic men Hispanic women0
2
4
6
8
10
12
14
16
18
20
Note(s)
Asian includes Native Hawaiian and Other Pacific Islander. Academic employment is limited to U.S. doctorate holders employed at 2-
or 4-year colleges or universities, medical schools, and university research institutes.
Source(s)
National Science Foundation, National Center for Science and Engineering Statistics, Survey of Doctorate Recipients (SDR).
Science and Engineering Indicators 2018
FIGURE 5-14
Black, Hispanic, and Asian S&E doctorate holders employed in academia as a percentage of full-time faculty positions, by sex: 2003 and 2015
National Science Board | 5 | 72
CHAPTER 5 | Academic Research and Development
Science & Engineering Indicators 2018Te
nure
sta
tus
Percent
2003 2015
Tenured
Tenure track
Not on tenure track
No tenure system
0 5 10 15 20 25 30 35 40 45 50
Note(s)
Academic employment is limited to U.S. doctorate holders employed at 2- or 4-year colleges or universities, excluding those
employed part time who are students or retired. No tenure system includes no tenure system for the position or no tenure system at
the institution. Detail may not add to 100% due to rounding. Underrepresented minorities include blacks, Hispanics, and American
Indians or Alaska Natives.
Source(s)
National Science Foundation, National Center for Science and Engineering Statistics, special tabulations (2017) of the 2003 and 2015
Survey of Doctorate Recipients (SDR).
Science and Engineering Indicators 2018
The proportion of Asians or Pacific Islanders employed in the S&E academic doctoral workforce grew dramatically over the
past several decades, rising from 4% in 1973 to 13% in 2003 and 18% in 2015.[9] Asians or Pacific Islanders were heavily represented among those with degrees in engineering and computer and information sciences, where they constituted 32%
and 33%, respectively, of these segments of the doctoral workforce in 2015. They constituted far smaller employment
proportions among social scientists (10%) and psychologists (7%) (Appendix Table 5-16).
Unlike blacks or Hispanics, a higher percentage of male Asians or Pacific Islanders held full-time faculty positions than their
female counterparts in 2003 and 2015. Asian or Pacific Islander men were in about 12.0% of male-occupied full-time faculty
FIGURE 5-15
Tenure status of underrepresented minority S&E doctorate holders employed in academia: 2003 and 2015
National Science Board | 5 | 73
CHAPTER 5 | Academic Research and Development
Science & Engineering Indicators 2018
positions in 2003 and about 17.5% of these positions in 2015. Asian or Pacific Islander women held about 9.3% of female-
occupied faculty positions in 2003 and about 13.6% in 2015 ( Figure 5-14).
Comparing early- to mid-career doctorate holders with their counterparts in later stages of their academic careers
evidences real change over time for underrepresented minorities in faculty employment. Those who received their doctorate
within the past two decades (in 1995 or later) are more diverse in race and ethnicity than their older counterparts (who
received their doctorate in 1994 or earlier). As noted previously, some 19,600 underrepresented minorities together held 8.6%
of full-time faculty positions in 2015 ( Table 5-16). However, a larger proportion of the younger cohort (10.2%; 13,500
individuals) than the older cohort (6.5%; 6,200 individuals) held such positions. Also, a higher share of female (11.8%; 6,400)
than male (9.1%; 7,100) early- to mid-career doctorate holders in full-time faculty employment were underrepresented
minorities.
Foreign-Born S&E Doctorate Holders in the Academic Workforce
Academia has long employed foreign-born doctorate holders, many with doctorates from U.S. universities, as faculty and
other staff. The following discussion focuses on foreign-born individuals who earned their S&E doctorate in the United States.
Academic employment of these foreign-born, U.S.-trained individuals has increased continuously since the 1970s, at a rate
faster than that of their native-born counterparts, increasing the foreign-born proportion of academic S&E employment with
U.S. doctorate training from 12% in 1973 to about 30% in 2015 ( Figure 5-16).[10] Particularly high proportions are found in
engineering (53%) and computer and information sciences (52%) (Appendix Table 5-17). Just over half (51%) of U.S.-trained
postdocs were born overseas, compared with 28% of full-time faculty.[11]
In 2015, about 59,000 U.S.-trained Asian or Pacific Islanders were employed in universities and colleges (Appendix Table
5-16). Of these, 10% were native-born U.S. citizens; the rest were foreign born, with roughly equal proportions of naturalized
U.S. citizens (44%) and noncitizens (46%). In 2015, Asians or Pacific Islanders represented 49% of the foreign-born, U.S.-trained
S&E faculty employed full-time in the United States and 65% of the foreign-born, U.S.-trained S&E doctorate holders with
Academic employment is limited to U.S. doctorate holders employed at 2- or 4-year colleges or universities, medical schools, and
university research centers, excluding those employed part time who are students or retired. Numbers are rounded to the nearest
100.
Source(s)
National Science Foundation, National Center for Science and Engineering Statistics, special tabulations (2017) of the 1973–2015
Survey of Doctorate Recipients (SDR).
Science and Engineering Indicators 2018
Age Composition of the Academic Doctoral Workforce
The trend toward relatively fewer full-time faculty positions and relatively more other full-time and part-time positions is
especially noteworthy because of the steady increase over the past 20 years in the proportion of full-time faculty positions
that are held by those older than 60 years of age.
In 1995, individuals 60–75 years of age constituted about 11% of full-time faculty that year; this percentage increased to
25% in 2015.[12] In 1994, the Age Discrimination in Employment Act of 1967 (ADEA) became fully applicable to universities and colleges, prohibiting the forced retirement of faculty at any age. From this point through 2015, as more individuals born during
the period of high birth rates from 1946 to 1964 (the “Baby Boomers”) began to move through middle age into their 50s and
60s, the proportion of academically employed doctorate holders in the oldest age groups increased ( Table 5-17; Appendix
FIGURE 5-16
U.S.-trained S&E doctorate holders employed in academia, by birthplace: 1973–2015
National Science Board | 5 | 75
CHAPTER 5 | Academic Research and Development
Science & Engineering Indicators 2018
Table 5-18). (See Chapter 3 section Age and Retirement of the S&E Workforce for a discussion of the age profile and retirement
patterns of the broader S&E workforce.)
S&E doctorate holders employed in academia, by age: 1995 and 2015
(Percent)
Age 1995 2015
Younger than 40 29.0 26.1
40–59 61.0 51.7
60–75 10.0 22.3
Note(s)
Academic employment is limited to U.S. doctorate holders employed at 2- or 4-year colleges or universities, medical schools, and
university research institutes. Percentages may not add to 100% because of rounding.
Source(s)
National Science Foundation, National Center for Science and Engineering Statistics, special tabulations (2016) of the Survey of
Doctorate Recipients (SDR).
Science and Engineering Indicators 2018
Many of the oldest doctorate full-time faculty work at research-intensive universities, where those ages 60–75 years
constituted about 11% of the total in 1995 and about 26% by 2015. Over the same period, there was a decline in the
proportion of much younger doctorate holders (ages 30–44 years) employed as full-time faculty at research-intensive
universities (from about 42% to about 34%). A comparison of the age distribution of full-time faculty positions at research
universities and other universities and colleges shows that there has been a relatively sharp increase at both institution types
since the mid-1990s—when ADEA became applicable to the professoriate—in the percentage of these positions held by those
ages 65–75 years ( Figure 5-17).
TABLE 5-17
National Science Board | 5 | 76
CHAPTER 5 | Academic Research and Development
Science & Engineering Indicators 2018
Year
Perc
ent
Research universities Other higher education institutions
19731975
19771979
19811983
19851987
19891991
19931995
19971999
20012003
20062008
20102013
20150
5
10
15
Note(s)
Academic employment is limited to U.S. doctorate holders employed at 2- or 4-year colleges or universities, medical schools, and
university research institutes. Faculty positions include full, associate, and assistant professors and instructors from 1973 to 1995;
from 1997 to 2015, faculty positions include full, associate, and assistant professors.
Source(s)
National Science Foundation, National Center for Science and Engineering Statistics, Survey of Doctorate Recipients (SDR), and
special tabulations (2016) of the 1997–2015 SDR. See Appendix Table 5-18.
Science and Engineering Indicators 2018
Academic Researchers
The interconnectedness of research, teaching, and public service activities in academia makes it difficult to assess the
precise size and characteristics of the academic research workforce by examining the employment trends in academic
positions. Individuals with the same academic job titles may be involved in research activities to differing degrees or not be
involved in research. Therefore, self-reported research involvement is a somewhat better measure than position title for
gauging research activity.[13] This section limits the analysis to two groups of academic S&E doctorate holders, including those who reported that research is their primary work activity (i.e., the activity that occupies the most hours of their work time
FIGURE 5-17
Full-time faculty ages 65–75 at research universities and other higher education institutions: 1973–2015
National Science Board | 5 | 77
CHAPTER 5 | Academic Research and Development
Science & Engineering Indicators 2018
during a typical workweek) and those who reported that research is their primary or secondary work activity (i.e., the activity
that occupies the most or second most hours of their work time during a typical workweek). Separate breakouts are provided
for all doctorate holders and for full-time faculty. Caution should be exercised in interpreting data about primary work activity
because of potential subjectivity in estimating hours devoted to research versus other activities as one’s career progresses.[14]
Doctoral S&E Researchers
Since 1973, the number of academic researchers (based on primary or secondary work activity) grew from just over 80,000
to more than 220,000 (Appendix Table 5-19). In 2015, of those identified as such researchers, just under 160,000 were
employed in full-time faculty positions.[15]
Looking across all doctoral academic positions and across the past four decades, the proportion of researchers has
fluctuated between about 60% and 75%. A similar pattern of fluctuation occurred among full-time faculty. In 2015, 67% of S&E
doctorate holders in academia and 70% of full-time faculty classified research as their primary or secondary activity.
In 2015, researchers accounted for a larger proportion of the academic doctoral workforce in engineering (77%) than in
other fields (between 55% and just under 70%; see Appendix Table 5-19). In physical sciences, life sciences, and psychology,
the proportion of researchers declined slightly between the early to mid-1990s and 2015. Turning to the subset who identify
research as their primary work activity, somewhat larger shares of doctorate holders reported this in 2015 than in 1993 (41%
versus 38%). The same was true for full-time faculty (39% in 2015; 33% in 1993). Looking across the past four decades, the
proportion of academically employed S&E doctorate holders who identified research as their primary activity has fluctuated
from just below 25% to just over 40%. For full-time faculty, this proportion ranged from just under 20% to just under 40%.
Among full-time doctoral S&E faculty, there was a shift in priority from teaching to research from 1973 to 2015, with the
proportion of full-time faculty identifying research as their primary work activity climbing from 19% to 39% and the proportion
of faculty with teaching as their primary activity falling from 68% to 45% ( Figure 5-18).
National Science Board | 5 | 78
CHAPTER 5 | Academic Research and Development
Science & Engineering Indicators 2018
Year
Perc
ent
Research Teaching Other
1973 1983 1993 2003 20150
20
40
60
80
Note(s)
Academic employment is limited to U.S. doctorate holders employed full-time at 2- or 4-year colleges or universities, excluding
adjuncts and postdoctorates. Full-time faculty includes full, associate, and assistant professors and instructors for 1973, 1983, and
1993; for 2003 and 2015, full-time faculty includes full, associate, and assistant professors. Research includes basic or applied
research, development, or design. Other includes a wide range of activities. Percentages may not add to 100% because of rounding.
Source(s)
National Science Foundation, National Center for Science and Engineering Statistics, special tabulations (2016) of the 2015 Survey of
Doctorate Recipients (SDR). See Appendix Table 5-18.
Science and Engineering Indicators 2018
The balance of emphasis between teaching and research varied across the disciplines. A higher share of faculty with
doctorate degrees in life sciences and engineering identified research as their primary work activity, and a higher share of
faculty with doctorate degrees in mathematics and statistics and in social sciences reported teaching as their primary activity.
Since the early 1990s, the proportion of doctorate holders who reported research as a primary work activity declined among
life scientists from a high base but grew among mathematicians and statisticians, engineers, and social scientists from much
lower bases (Appendix Table 5-19).
Career stage plays a role in the reported primacy of research, teaching, or other activities. In 2015, among early- to mid-
career doctorate holders—those who had earned their doctorate in 1995 or later—43% reported research as their primary
FIGURE 5-18
Primary work activity of full-time doctoral S&E faculty: Selected years, 1973–2015
National Science Board | 5 | 79
CHAPTER 5 | Academic Research and Development
Science & Engineering Indicators 2018
work activity, 40% reported teaching, and the remainder (17%) reported some other activity as primary. Individuals in the
older cohort (who earned their doctorate in 1994 or earlier) were slightly more likely to identify teaching as their primary
activity (42%) and slightly less likely to report research (36%); they were also more likely to report that their primary activity
was neither research nor teaching but some other activity such as management and administration or computer applications
(22%).
In 2015, recently degreed S&E doctoral faculty—those who received their doctorate since 2012—were less likely than
faculty with a doctorate from 2004 to 2011 to report research as their primary activity. Among those who had earned their
degree since 2012, 35% identified research as their primary work activity, a lower proportion than that reported by faculty who
had earned their S&E doctorate degree 4–7 years earlier (43%) or 8–11 years earlier (44%) ( Table 5-18). A similar pattern
across career stages prevailed in some, but not all, degree fields.[16]
Full-time S&E faculty reporting research as primary work activity, by years since doctorate and degree field: 2015
(Percent)
Years since
doctorate
All degree
fields
Physical
sciences
Mathematics and
statistics
Computer and
information
sciences
Life
sciencesPsychology
Social
sciencesEngineering
All years since
doctorate39.0 38.9 32.1 43.7 43.8 33.1 31.5 47.3
1–3 35.3 16.7 28.6 42.9 30.0 30.0 40.0 40.0
4–7 42.6 41.2 30.0 58.3 40.5 38.2 37.7 57.1
8–11 43.5 46.5 40.9 58.3 44.4 34.2 37.1 53.3
12 or more 37.6 37.7 30.5 36.6 44.7 32.2 28.5 43.6
Note(s)
Academic employment is limited to U.S. doctorate holders employed full-time at 2- or 4-year colleges or universities, medical schools,
and university research institutes, excluding adjuncts and postdocs. Faculty includes full, associate, and assistant professors. Research
includes basic or applied research, development, and design. Physical sciences include earth, atmospheric, and ocean sciences; life
sciences include biological, agricultural, environmental, and health sciences. Caution should be taken in interpreting results because of
the small population size for some fields and years.
Source(s)
National Science Foundation, National Center for Science and Engineering Statistics, special tabulations (2017) of the 2015 Survey of
Doctorate Recipients (SDR). See Appendix Table 5-19.
Science and Engineering Indicators 2018
TABLE 5-18
National Science Board | 5 | 80
CHAPTER 5 | Academic Research and Development
Science & Engineering Indicators 2018
Academic Employment in Postdoc Positions
About 45,000 S&E doctorate holders were employed in academic postdoc positions in 2015 (see sidebar Postdoctoral
Researchers).[17] The estimate comes from NSF’s Survey of Graduate Students and Postdoctorates in Science and Engineering, which reported a total of about 64,000 postdocs in 2015, with about two-thirds (more than 45,000) holding
positions in S&E and almost one-third (just under 19,000) holding positions in clinical medicine or other health-related fields
(Arbeit and Kang 2017).[18] The U.S.-trained component of academically employed postdocs with S&E degrees climbed from 4,200 in the early 1970s to 23,300 in 2006 and then declined to 19,200 in 2015 (Appendix Table 5-14). During that time, the
proportion of postdocs varied, gradually increasing to just under 9% of all U.S.-trained, academically employed S&E doctorate
holders in 2006 and then dropping to just under 6% in 2015. Postdocs were more prevalent in life sciences, physical sciences,
and engineering than in social sciences, psychology, mathematics and statistics, and computer and information sciences.
Looking over the dozen years from 2003 to 2015, there was growth in the proportion of U.S.-trained postdocs in engineering
but not in other fields ( Figure 5-19; Appendix Table 5-14). The demographic profile of U.S.-trained individuals employed in
academic postdoc positions has changed dramatically over the past 40 years. In particular, the proportions of postdocs held
by women, racial and ethnic minorities, and foreign-born individuals have climbed ( Table 5-19).
National Science Board | 5 | 81
CHAPTER 5 | Academic Research and Development
Science & Engineering Indicators 2018
Degree field
Perc
ent
1973 1983 2003 2015
Life sciences Psychology Social sciences Engineering0
2
4
6
8
10
12
Note(s)
Data for computer sciences are not available for 1973. Data for computer sciences for 2003 are suppressed for reasons of
confidentiality and/or reliability. Academic employment is limited to U.S. doctorate holders employed at 2- or 4-year colleges or
universities, medical schools, and university research institutes, excluding those employed part time who are students or retired.
Physical sciences include earth, atmospheric, and ocean sciences; life sciences include biological, agricultural, environmental, and
health sciences.
Source(s)
National Science Foundation, National Center for Science and Engineering Statistics, special tabulations (2017) of the 2015 Survey of
Doctorate Recipients (SDR).
Science and Engineering Indicators 2018
FIGURE 5-19
S&E doctorate holders employed in academia in a postdoctoral position, by S&E degree field: Selected years, 1973–2015
National Science Board | 5 | 82
CHAPTER 5 | Academic Research and Development
Science & Engineering Indicators 2018
S&E doctorate holders employed in academia in postdoc positions, by demographic group: Selected years, 1973–2015
(Percent distribution)
Demographic group 1973 1983 1993 2003 2015
Sex
Female 16.7 30.1 30.8 37.6 42.7
Male 83.3 69.9 69.2 62.4 57.3
Race or ethnicity
White 85.7 81.9 68.4 63.1 52.6
Asian or Pacific Islander 11.9 13.3 27.1 30.6 36.5
Underrepresented minority 2.4 4.8 4.5 7.0 8.9
Place of birth
United States 82.5 81.7 60.9 57.0 49.0
Foreign 17.5 18.3 39.1 43.0 50.5
Note(s)
Academic employment is limited to U.S. doctorate holders employed at 2- or 4-year colleges or universities, medical schools, and
university research institutes, excluding those employed part time who are students or retired. Underrepresented minorities include
blacks or African Americans, Hispanics or Latinos, and American Indians or Alaska Natives. Percentages may not add to 100% because
of rounding.
Source(s)
National Science Foundation, National Center for Science and Engineering Statistics, special tabulations (2017) of the 2003 and 2015
Survey of Doctorate Recipients (SDR).
Science and Engineering Indicators 2018
A temporary postdoc appointment has become a common stop along the career path of S&E doctorate holders,
particularly during their early career stages. In 2015, 35% of recently degreed, U.S.-trained S&E doctorate holders in academia
were employed in postdoc positions, about the same percentage as those employed in full-time faculty positions (36%)
(Appendix Table 5-20). For this discussion, recently degreed individuals are those who received their doctorate within 1–3
years before the 2015 Survey of Doctorate Recipients data collection. Among U.S.-trained, academically employed S&E
doctorate holders 4–7 years beyond receipt of their doctoral degree, a smaller proportion (16%) was employed in academic
postdoc positions, and 52% held full-time faculty positions (Appendix Table 5-20).
In 2015, more than three-fourths (76%) of recently degreed, U.S.-trained academic postdocs were employed at the most
research-intensive universities ( Table 5-20).
TABLE 5-19
National Science Board | 5 | 83
CHAPTER 5 | Academic Research and Development
Science & Engineering Indicators 2018
S&E doctorate holders employed in academia in postdoc positions, by Carnegie classification of employer and years since doctorate: 2015
(Percent distribution)
Institution type Postdocs (thousands)Years since doctorate
8 or more 4–7 8 or less
All institutions 19.2 100.0 100.0 100.0
Doctorate-granting, very high research 14.1 75.9 74.1 74.7
Other doctorate-granting institutions 1.7 7.2 7.1 8.0
Medical schools and medical centers 2.2 9.6 11.8 11.5
Other universities and colleges 1.2 7.2 5.9 6.3
Note(s)
Academic employment is limited to U.S. doctorate holders employed at 2- or 4-year colleges or universities, medical schools, and
university research institutes, excluding those employed part time who are students or retired. Institutions are designated by the 2005
Carnegie classification code. For information on these institutional categories, see the Carnegie Classification of Institutions of Higher
Education, http://carnegieclassifications.iu.edu/downloads.php, accessed 13 February 2017. Detail may not add to total because of
rounding.
Source(s)
National Science Foundation, National Center for Science and Engineering Statistics, special tabulations (2017) of the 2015 Survey of
Doctorate Recipients (SDR).
Science and Engineering Indicators 2018
TABLE 5-20
National Science Board | 5 | 84
CHAPTER 5 | Academic Research and Development
Science & Engineering Indicators 2018
Postdoctoral ResearchersA postdoctorate (postdoc) is a temporary position awarded in academia, industry, government, or a nonprofit
organization primarily for gaining additional education and training in research. Ideally, the individual employed in a
postdoc position gains these skills under the guidance of an adviser, with the administrative and infrastructural support
of a host institution and with the financial support of a funding organization. However, the conditions of postdoc
employment vary widely between academic and nonacademic settings, across disciplines, and even within institutions,
and formal job titles can be an unreliable guide to actual work roles.
Postdoctoral researchers are important to the S&E enterprise and perform a substantial portion of the nation’s research.
Most have recently earned their doctoral degree, so they bring new techniques and perspectives that broaden their
research teams’ experience and make them more competitive in the job market. In addition to conducting research,
postdoctoral researchers also educate, train, and supervise students engaged in research; help write grant proposals
and papers; and present research results at professional society meetings (COSEPUP 2014).
Federal Research Support of S&E Doctorate Holders Employed in Academia
The federal government provides academic researchers with a substantial portion of overall research support. This support
may include assistance in the form of fellowships, traineeships, and research grants. This section presents data for U.S.-
trained S&E doctorate holders in academic employment who reported on the presence or absence (but not magnitude or
type) of federal support for their work. Comparisons are made over the approximately 40-year period between the early
1970s and 2015 and between the roughly 25-year period between the very early 1990s and 2015.
Academic Scientists and Engineers Who Receive Federal Research Support
The proportion of S&E doctorate holders and researchers in academia who receive federal research support has varied
over time, according to reported primacy of research activity and type of academic position held (Appendix Table 5-21). In
general, a larger share of doctorate holders and researchers received such support in the late 1980s and very early 1990s than
in the early 1970s or in 2015.[19] In 2015, 41% of all U.S.-trained S&E doctorate holders in academia and 52% of those for
whom research was a primary or secondary activity reported federal government support.[20] About the same percentage (52%) of those for whom research was a primary or secondary responsibility received federal support in 1973 and 2015. By
contrast, the percentage in 1991 was somewhat higher (58%). The fraction of full-time faculty who received federal research
support from 1973 to 2015 fluctuated similarly, with a somewhat higher percentage in 1991 (48%) than in 1973 (42%) or in
2015 (40%). By contrast, a larger proportion of academic doctorate holders employed in nonfaculty positions received federal
support in 1973 (60%) and in the very early 1990s (59%) than in 2015 (42%).
Federal research support varied by doctoral field. Over the past 40 years, doctorate holders in engineering, physical
sciences, and life sciences have been more likely to report receiving federal funding support than their counterparts in
mathematics and statistics, psychology, or social sciences (Appendix Table 5-21). The pattern of funding support for individuals
with a doctorate in engineering and physical sciences was quite similar overall, with percentages ranging from about 50% in
the early 1970s to a peak of about 60% in 1991, followed by an eventual decline to around 53% in 2015. Federal funding for
individuals with a doctorate in life sciences, with some dips in 1985 and 1993–97 that reflected changes to the survey
question, generally remained around 60% in most years until the last decade, when it began to decline. In 2015, such funding
SIDEBAR
National Science Board | 5 | 85
CHAPTER 5 | Academic Research and Development
Science & Engineering Indicators 2018
stood at 51%. Federal support for academic R&D in the relatively small field of computer and information sciences has grown
from about 35% to 45% since its first measurement in the late 1970s.
Federal research support is more prevalent in medical schools and in the most research-intensive universities (under
Carnegie classification of very high research activity institutions) (Appendix Table 5-22). Just over 60% of S&E doctorate holders
employed at the most research-intensive universities received federal support in 2015. At medical schools, about 62% of all
doctorate holders and just over 60% of full-time faculty received federal research support in 2015. The percentage with federal
support was just over 40% at high research activity institutions; at other universities and colleges, it ranged from about 16% to
33%.
Differences exist by sex, race, and ethnicity in doctorate holders’ success in receiving federal research support. Among S&E
doctorate holders employed at the nation’s most research-intensive universities, white and Asian or Pacific Islander men were
more likely than their female counterparts to be supported by federal grants or contracts in 2015 ( Figure 5-20; Appendix
Table 5-23).
Available data on the rate at which reviewed research grant applications are funded indicate that funding success rates
have declined since 2001 at NIH and NSF ( Table 5-21). There was an increase during most years in the number of research
grant applications that NIH and NSF received.
National Science Board | 5 | 86
CHAPTER 5 | Academic Research and Development
Science & Engineering Indicators 2018
Sex, race, and ethnicity
Perc
ent
S&E doctorate holders
White men White women URM men URM women0
20
40
60
80
URM = underrepresented minority (black or African American, Hispanic or Latino, and American Indian or Alaska Native).
Note(s)
Academic employment is limited to U.S. doctorate holders employed at 2- or 4-year colleges or universities, medical schools, and
university research institutes.
Source(s)
National Science Foundation, National Center for Science and Engineering Statistics, Survey of Doctorate Recipients (SDR), 2015. See
Appendix Table 5-23.
Science and Engineering Indicators 2018
FIGURE 5-20
S&E doctorate holders employed in very high research activity institutions with federal research support, by sex, race, and ethnicity: 2015
National Science Board | 5 | 87
CHAPTER 5 | Academic Research and Development
Science & Engineering Indicators 2018
NIH and NSF research grant applications and funding success rates: 2001–16
NIH = National Institutes of Health; NSF = National Science Foundation.
Note(s)
Available data vary by agency and are not directly comparable with one another. NIH data shown are for R01-equivalent grants, calculated according to the NIH success rate definition, which counts initial grant applications and
resubmitted grant applications received in the same fiscal year as one application (see https://report.nih.gov/success_rates/index.aspx). NIH grant applications exclude grants funded by the American Recovery and Reinvestment Act of
2009 (ARRA). NSF data shown are based on research grant applications received and are counted in the fiscal year in which the award or decline action was taken. NSF data include ARRA grants.
Source(s)
National Institutes of Health, Office of Extramural Research, Office of the Director; National Science Foundation, Office of Budget, Finance, and Award Management.
Science and Engineering Indicators 2018
TABLE 5-21
National Science Board | 5 | 88
CHAPTER 5 | Academic Research and Development
Science & Engineering Indicators 2018
Federal Support of Early Career S&E Doctorate Holders
The very recently degreed S&E doctorate holders—those who earned their doctorates within the previous 1–3 years—have
received relatively less federal support in recent years than in past decades. This holds for those in full-time faculty positions
(24% in 2015 versus 38% in 1991) and for postdocs (72% in 2015 versus 84% in 1991) (Appendix Table 5-24). In addition, the
very recently degreed doctorate holders in full-time faculty positions were less likely to receive federal support than their
counterparts who had received their doctorate 4–7 years earlier. This was not the case for those in postdoc positions,
however, where similar percentages from each group received federal support.
As with recent doctorate recipients, the proportion of full-time faculty and postdocs 4–7 years beyond their doctorate who
received federal support also declined from the early 1990s ( Figure 5-21). Looking across the academic doctoral workforce
without regard to faculty or postdoc position, the proportion of early career doctorate holders with federal support in 2015
was generally higher in some fields (life sciences, physical sciences, and engineering) than in others (mathematics and
statistics, psychology, and social sciences), a long-standing pattern.
National Science Board | 5 | 89
CHAPTER 5 | Academic Research and Development
Science & Engineering Indicators 2018
Percent
1991 2015
All fields
Physical sciences
Mathematics and statistics
Computer and information sciences
Life sciences
Psychology
Social sciences
Engineering
0 10 20 30 40 50 60 70 80
Note(s)
In this figure, early career faculty are those within 4–7 years of having received their doctorate. Academic employment is limited to
U.S. doctorate holders employed at 2- or 4-year colleges or universities, medical schools, and university research institutes. See
Appendix Table 5-24.
Source(s)
National Science Foundation, National Center for Science and Engineering Statistics, Survey of Doctorate Recipients (SDR).
Science and Engineering Indicators 2018
[1] For purposes of this discussion, health sciences are combined with biological, agricultural, and environmental life sciences to create the broad field of life sciences.
[2] In the discussion covering the age composition of the academic doctoral workforce, comparisons are made between 1995 and 2015 because the Age Discrimination in Employment Act of 1967 applied to the professoriate starting in 1994. In the section on federal support of doctoral researchers, comparisons are made between 1973, the very early 1990s, and 2015 because of the availability of relatively comparable data for these years.
[3] Among the U.S.- and foreign-trained postdocs overall, there was much greater growth in postdocs from 2000 to 2010 (3.9% average annual growth) than from 2010 to 2015 (0.4% average annual growth).
FIGURE 5-21
Early career S&E doctorate holders employed in full-time faculty positions with federal support, by field: 1991 and 2015
National Science Board | 5 | 90
CHAPTER 5 | Academic Research and Development
Science & Engineering Indicators 2018
[4] These other positions included positions at universities and colleges where no tenure system exists and where there are various non-tenure-track positions.
[5] Gaining tenured status has posed particular challenges for doctorate holders employed at medical schools and centers. In 1995, 26% of S&E doctorate holders employed at medical schools and centers (9,600) reported that no tenure system existed for their position; this percentage had increased to 34% by 2015 (17,600). Furthermore, Stephan (2012) notes in How Economics Shapes Science that at many medical schools, tenured faculty do not have a commitment for their salary if they do not get grant support; see also Association of American Medical Colleges (2010).
[6] Analysis of trends in minority and underrepresented minority representation in the U.S.-trained academic doctoral workforce is complicated by changes to the Survey of Doctorate Recipients question about race and ethnicity. Specifically, since the early 2000s, respondents have been allowed to report more than one race. Because of this change, data from 2003 to 2015 are not directly comparable with earlier years’ data (Milan 2012).
[7] Underrepresented minorities constituted 31% of the U.S. population in 2014, up from 27% in 2004.
[8] Estimates of the percentage of underrepresented minorities by sex in the U.S.-trained academic doctoral workforce are based on small samples and are particularly sensitive to sampling error.
[9] Asians or Pacific Islanders include Native Hawaiians and Other Pacific Islanders. They constituted a small share of the U.S. population in 2004 (4.2%) and 2014 (5.4%).
[10] In 2015, foreign-born individuals constituted 13% of the U.S. population. They were a higher share (29%) of college-educated workers employed in S&E occupations throughout the economy.
[11] In 2015, the majority of postdocs employed in U.S. higher education institutions received their doctorate overseas.
[12] Some academically employed S&E doctorate holders were older than 75 years of age in 1995 and in 2015, but the Survey of Doctorate Recipients does not report on this because it drops respondents from the survey sample after they have reached 75 years of age. Among the overall U.S. population, individuals age 60–75 constituted just under 25% of the population ages 25–75, very similar to their proportion of full-time faculty in higher education.
[13] The Survey of Doctorate Recipients presents respondents with a list of work activities and asks them to identify the activities that occupied the most and second-most hours during their typical workweek. This measure was constructed slightly differently before 1993, and the data are not strictly comparable across the two periods. Before 1993, the survey question asked respondents to select their primary and secondary work activity from a list of activities. Beginning in 1993, respondents were given the same list and asked on which activity they spent the most hours and on which they spent the second-most hours.
[14] Research and teaching are coincident activities in graduate S&E education, and variations in reporting primary (as opposed to secondary) work activities may reflect what is most salient to respondents at different career stages. For example, for early career doctorate holders focused on earning tenure, the activities of running a laboratory and supervising students and postdocs may be more likely to be thought of primarily as research. Later in one’s career, as one’s focus shifts to facilitating the success of younger colleagues, the same activities may be thought of primarily as teaching.
National Science Board | 5 | 91
CHAPTER 5 | Academic Research and Development
Science & Engineering Indicators 2018
[15] University-reported data from HERD indicate that approximately 158,000 people paid from R&D salaries and wages were designated as principal investigators in academic FY 2015 and that an additional 745,000 people, including students paid from R&D accounts, were in positions other than principal investigators. Universities reported salaries, wages, and fringe benefits totaling $29.9 billion in FY 2015 for these research personnel.
[16] Caution should be taken in interpreting results because of the small population size for some fields and years since receiving the doctorate as well as the subjectivity involved in estimating primary work activity.
[17] Estimates of postdocs vary according to data source. HERD data report an estimated 66,000 postdocs in 2015 across all S&E and non-S&E fields. Pilot Early Career Doctorates Survey data indicate that about 50,000 S&E postdocs were employed at U.S. academic institutions.
[18] The Survey of Graduate Students and Postdoctorates in Science and Engineering does not include estimates of postdocs employed outside of the academic sector, and comprehensive data are not available on postdocs employed by businesses. See NSF’s Survey of Postdocs at Federally Funded Research and Development Centers for data on postdocs at FFRDCs (https://www.nsf.gov/statistics/srvyffrdcpd/) and the Profile of Early Career Doctorates: 2015 (https://nsf.gov/statistics/2017/nsf17313/nsf17313.pdf) for data on individuals within 10 years of having received their doctorate.
[19] Data on federal support of academic researchers for 1985 and 1993–97 cannot be compared with results for the earlier years or with those from 1999 to 2015 because of changes in the survey question. In 1985, the question focused on 1 month and, from 1993 to 1997, on 1 week. In most other survey years, the reference was to the entire preceding year. Because the volume of academic research activity is not uniform over the entire academic year, a 1-week (or 1-month) reference period seriously understates the number of researchers supported at some time during an entire year.
[20] A larger share of the nation’s foreign-trained academic doctoral personnel working full time (52%) received federal support in 2015.
Data are presented according to publication year. Results are computed using full counting. Other OA includes access
provided by the researcher or institution and about 15% of OA publications for which the provider was not identified. Total
OA shows relative magnitude only.
Source(s)
Science-Metrix; Clarivate Analytics; 1science, accessed November 2016.
Science and Engineering Indicators 2018
Across Fields
The levels of publisher-provided and total OA vary across research fields (note that the research fields presented in this
sidebar are those used in the Web of Science database and are slightly different from those used in other sections of this
chapter). The health sciences field has the highest share of OA publications for publisher-provided OA (29%) and total OA
(53%) ( Figure 5-C). Some 46% of economics and social sciences publications are available in total OA, but only 6% of
papers are provided in OA by the publisher specifically. The domain of arts and humanities has the lowest share of
FIGURE 5-B
Annual percentage of U.S. publications available in publisher-provided open access and total open access: 2006–15
National Science Board | 5 | 96
CHAPTER 5 | Academic Research and Development
Science & Engineering Indicators 2018
publications available in total OA (25%), although the level of publisher-provided OA in this field is similar to levels for
economics and social sciences (6%).
The trend toward more and more articles moving to OA is expected to continue as funding organizations increasingly
require free access for research results.
Research domain
Perc
ent
Publisher-provided OA Other OA
World average Health sciences Natural sciences Applied sciences Arts and humanities0
20
40
60
OA = open access.
Note(s)
Data are presented according to publication year. Results are computed using full counting. Other OA includes access
provided by the researcher or institution and about 15% of OA publications for which the provider was not identified.
Source(s)
Science-Metrix; Clarivate Analytics; 1science, accessed November 2016.
Science and Engineering Indicators 2018
* This sidebar reports levels of OA that were assessed by matching the content of a database of OA papers produced by
1science to the Web of Science bibliometric database (produced by Clarivate Analytics; formerly produced by Thomson
Reuters).
† For a discussion of the legal complexities, see “Steady, strong growth is expected for open-access journals,” Physics Today, http://physicstoday.scitation.org/doi/10.1063/PT.3.3550, accessed 30 May 2017.
FIGURE 5-C
Percentage of publications available in publisher-provided open access and total open access, by research domain: 2006–15
Bibliometric Data and TerminologyScopus Database. The counts, coauthorships, and citations discussed in the S&E output section are derived from
information about research articles, conference papers, reviews, and short surveys (hereafter referred to collectively as
“publications”) that are published in peer-reviewed scientific and technical journals, books, and conference proceedings.
This information characterizes the publication, the journal, proceedings, or book in which it appears; lists its author(s)
and their institutional affiliations; and is collected in Elsevier’s Scopus database. The publications exclude editorials,
errata, letters, and other material whose purpose is not to present or discuss scientific data, theories, methods,
apparatuses, or experiments. The publications also exclude working papers, which are not generally peer reviewed.*
The publications output database, also known as bibliometric data, undergoes a thorough review and processing to
create the data for Science and Engineering Indicators (Science-Metrix 2017a). Before National Center for Science and
Engineering Statistics (NCSES) analysis, a set of filters was applied to the Scopus database (see sidebar Bibliometric
Data Filters). Additionally, for more information about the difference between Scopus and the data used in Science and Engineering Indicators before 2016, see sidebar New Data Source for Indicators Expands Global Coverage (NSB 2016).
Although the full text of publications in Scopus does not need to be written in English, the publication’s name and the
abstract must be available in English for indexing.
Journal Selection. Elsevier selects journals for the Scopus database based on an international group of subject-matter
experts, who evaluate candidate journals based on editorial policy, content quality, peer-review policies, peer-review
process and capacity, citation by other publications, editor standing, regularity of publication, and content availability.
Book Selection. The books included in the Scopus database are fully referenced and represent original research. They are
selected based on publisher characteristics. These include the reputation and impact of the publisher, the size and
subject area of the booklist, the publication and editorial policies, the quality of content, and the robustness of peer
review.
Conference Selection. Elsevier selects conference materials for the Scopus database by subject field based on quality and
relevancy, including the reputations of the sponsoring organization and the publisher of the proceedings.
More information on the selection of journals, books, and conferences is found at https://www.elsevier.com/online-tools/
scopus/content-overview and https://www.elsevier.com/solutions/scopus/content/content-policy-and-selection.
Using the Scopus database, NCSES adds additional classifications and creates metrics listed as follows:
Field Classification. NCSES’s WebCASPAR (Integrated Science and Engineering Resources Data System) classifies
bibliometric data into the 13 broad fields of S&E. The WebCASPAR taxonomy classifies journals, and each publication is
tagged with the field and subfield of the title under which it appears. However, many titles in Scopus are not classified in
WebCASPAR; therefore, NCSES extends Scopus by associating these additional publication titles with the WebCASPAR
fields with which they have the greatest affinity (methodological details available in http://www.science-metrix.com/sites/
S&E articles in all fields, by country or economy: 2006 and 2016
(Number and percent)
RankCountry or
economy
Country or economy
economic status2006 2016
Average annual
change (%)
2016 world
total (%)
2016 cumulative
world total (%)
- World na 1,567,422 2,295,608 3.9 na na
1 China Developing 189,760 426,165 8.4 18.6 18.6
2 United States Developed 383,115 408,985 0.7 17.8 36.4
3 India Developing 38,590 110,320 11.1 4.8 41.2
4 Germany Developed 84,434 103,122 2.0 4.5 45.7
5 United Kingdom Developed 88,061 97,527 1.0 4.3 50.0
6 Japan Developed 110,503 96,536 -1.3 4.2 54.2
7 France Developed 62,448 69,431 1.1 3.0 57.2
8 Italy Developed 50,159 69,125 3.3 3.0 60.3
9 South Korea Developed 36,747 63,063 5.5 2.8 63.0
10 Russia Developing 29,369 59,134 7.2 2.6 65.6
11 Canada Developed 49,259 57,356 1.5 2.5 68.1
12 Brazil Developing 28,160 53,607 6.6 2.3 70.4
13 Spain Developed 39,271 52,821 3.0 2.3 72.7
14 Australia Developed 33,100 51,068 4.4 2.2 75.0
15 Iran Developing 10,073 40,974 15.1 1.8 76.7
16 Turkey Developing 19,547 33,902 5.7 1.5 78.2
17 Poland Developed 21,267 32,978 4.5 1.4 79.7
18 Netherlands Developed 24,461 29,949 2.0 1.3 81.0
19 Taiwan Developed 25,246 27,385 0.8 1.2 82.2
20 Switzerland Developed 16,385 21,128 2.6 0.9 83.1
21 Malaysia Developing 3,230 20,332 20.2 0.9 84.0
22 Sweden Developed 16,634 19,937 1.8 0.9 84.8
23 Belgium Developed 13,036 16,394 2.3 0.7 85.6
TABLE 5-22
National Science Board | 5 | 102
CHAPTER 5 | Academic Research and Development
Science & Engineering Indicators 2018
RankCountry or
economy
Country or economy
economic status2006 2016
Average annual
change (%)
2016 world
total (%)
2016 cumulative
world total (%)
24 Czech Republic Developed 8,839 15,963 6.1 0.7 86.3
25 Mexico Developing 9,322 14,529 4.5 0.6 86.9
26 Portugal Developed 7,136 13,773 6.8 0.6 87.5
27 Denmark Developed 8,536 13,471 4.7 0.6 88.1
28 Austria Developed 9,155 12,366 3.1 0.5 88.6
29 Israel Developed 11,040 11,893 0.7 0.5 89.1
30 South Africa Developing 5,636 11,881 7.7 0.5 89.7
31 Singapore Developed 8,205 11,254 3.2 0.5 90.1
32 Egypt Developing 3,958 10,807 10.6 0.5 90.6
33 Norway Developed 7,093 10,726 4.2 0.5 91.1
34 Greece Developed 10,684 10,725 0.0 0.5 91.6
35 Finland Developed 9,204 10,545 1.4 0.5 92.0
36 Romania Developed 3,523 10,194 11.2 0.4 92.5
37 Thailand Developing 4,270 9,581 8.4 0.4 92.9
38 Saudi Arabia Developing 1,898 9,232 17.1 0.4 93.3
39 Pakistan Developing 2,809 9,181 12.6 0.4 93.7
40 Argentina Developing 5,600 8,648 4.4 0.4 94.1
41 Indonesia Developing 619 7,729 28.7 0.3 94.4
42 New Zealand Developed 5,607 7,465 2.9 0.3 94.7
43 Ukraine Developing 5,296 7,375 3.4 0.3 95.0
44 Ireland Developed 4,857 6,834 3.5 0.3 95.3
45 Chile Developing 3,122 6,746 8.0 0.3 95.6
46 Hungary Developed 5,530 6,208 1.2 0.3 95.9
47 Colombia Developing 1,368 6,120 16.2 0.3 96.2
48 Slovakia Developed 2,644 5,359 7.3 0.2 96.4
49 Tunisia Developing 1,980 5,266 10.3 0.2 96.6
50 Algeria Developing 1,288 4,447 13.5 0.2 96.9
National Science Board | 5 | 103
CHAPTER 5 | Academic Research and Development
Science & Engineering Indicators 2018
na = not applicable.
Note(s)
The countries or economies shown each produced 5,052 publications or more in 2016. The countries or economies are ranked based
on the 2016 total. Serbia ranked 50th for 2016 but was removed from the table as growth could not be computed from 2006 since
Serbia and Montenegro divided in 2006. Articles are credited on a fractional-count basis (i.e., for articles from multiple countries or
economies, each country or economy receives fractional credit on the basis of the proportion of its participating authors). Detail may
not add to total because of countries or economies that are not shown. Proportions are based on the world total, excluding unclassified
addresses (data not presented). Average annual change, or compound annual growth rate, is average growth rate = (year 2 publications
/year 1 publications)(1/number of years) - 1. See Appendix Table 5-26 for groupings of regions, countries, or economies. For more information on the International Monetary Fund economic classification of countries, see https://www.imf.org/external/pubs/ft/weo/
2016/01/weodata/groups.htm. See Appendix Table 5-27.
Source(s)
National Science Foundation, National Center for Science and Engineering Statistics; SRI International; Science-Metrix; Elsevier, Scopus
abstract and citation database, accessed July 2017.
Science and Engineering Indicators 2018
This chapter presents analysis of about 2.3 million peer-reviewed S&E publications from the Scopus database as of July
2017 ( Table 5-22). The publication output discussion by geography, field, or institutional level uses fractional counting, which
credits coauthored publications according to the collaborating institutions or countries, based on the proportion of their
participating authors. As part of our data analysis, we employ filters on the raw Scopus S&E publication data to remove
publications with questionable quality (see sidebar Bibliometric Data Filters).
National Science Board | 5 | 104
CHAPTER 5 | Academic Research and Development
Science & Engineering Indicators 2018
Bibliometric Data FiltersThe goal of the bibliometric data analysis presented in this chapter is to measure valid peer-reviewed research output.
Recently, bibliometric experts noted an increase of low-quality publications, including journals, conference proceedings,
or books lacking substantive peer review.* NCSES removed two publication sets from the Scopus database to exclude low-quality publications from the bibliometric data included in this report:
• Journals and proceedings flagged by the Directory of Open Access Journals (DOAJ) for failing to adhere to its list of
best practices or being suspected of editorial misconduct.†
• Elsevier’s list of titles that they removed from the Scopus database from 2014 onward are removed retroactively for
the Indicators database for all publication years.‡
The need for NCSES filtering has increased in recent years. Figure 5-D shows that the number of publications removed
was 1% or less for most years, then approached 3% (more than 60,000 publications) in 2011, and grew beyond 3%
(81,000–98,000 publications) each year from 2012 to 2014. The number of publications filtered for the Indicatorsdatabase dropped back down to the 1% range in 2015–16 as Elsevier began instituting filters on the Scopus database.
Directory of Open Access Journals 106 67,497 0 0 106 67,497
Total 307 211,595 15 238,208 322 449,803
Note(s)
"Titles" includes journals, books, and conference proceedings, and "Publications" includes the individual items appearing in the
titles. Prepared by Science-Metrix using Scopus (Elsevier). Total does not sum to individual sources because there is some overlap
between Directory of Open Access Journals and Scopus filters.
Source(s)
Science-Metrix; Elsevier, Scopus abstract and citation database, accessed July 2017.
Science and Engineering Indicators 2018
* For an example of journals requiring robust and novel submissions, see https://www.nature.com/authors/policies/peer_review.html. Articles on predatory publication are https://www.nytimes.com/2016/12/29/upshot/fake-academe-
† The DOAJ list of excluded journals is available at https://docs.google.com/spreadsheets/d/183mRBRqs2jOyP0qZWXN8dUd02D4vL0Mov_kgYF8HORM/edit. Note that DOAJ also flags serials that are no longer
available in open access (OA); although an important and evolving phenomenon in the research landscape, OA status is
not associated here with any specific demarcation of quality, whether low or high. Thus, the titles flagged by DOAJ for
OA-related reasons alone are not filtered out of the database for Science and Engineering Indicators 2018.
‡ Elsevier’s principles of quality can be found at https://www.elsevier.com/solutions/scopus/content/content-policy-and-selection and https://doaj.org/bestpractice. In 2014, during its periodic reevaluation of items flagged for follow-up, the
Scopus Content Selection and Advisory Board elected to remove 42 titles as of 2014. The 42 titles are retroactively
removed from the Indicators database to create a valid time series for bibliometric analysis, even though Elsevier does
not claim that these titles were necessarily of low quality before 2014.
Publication counts are from a selection of journals, books, and conference proceedings in S&E from Scopus. Publications are
classified by their year of publication and are assigned to a region, country, or economy on the basis of the institutional address(es)
listed in the article. Articles are credited on a fractional-count basis (i.e., for articles from multiple regions, countries, or economies,
each region, country, or economy receives fractional credit on the basis of the proportion of its participating authors). Some
publications have incomplete address information for coauthored publications in the Scopus database and cannot be fully assigned
to a region, country, or economy. These unassigned counts, 0.1% of the world total in 2016, are used to calculate this figure but are
not shown. See Appendix Table 5-27.
Source(s)
National Science Foundation, National Center for Science and Engineering Statistics; SRI International; Science-Metrix; Elsevier,
Scopus abstract and citation database, accessed July 2017.
Science and Engineering Indicators 2018
China has continued its steady growth since the mid-2000s and is now the largest global producer (with an 18.6% global
share). India’s publication volume has grown rapidly, from 2.5% of global output in 2006 to 4.8% in 2016. Overall, 50 countries
—a quarter of those that produced S&E publications in 2016—account for 96.9% of global output.
FIGURE 5-22
S&E articles, by global share of selected region, country, or economy: 2006–16
National Science Board | 5 | 111
CHAPTER 5 | Academic Research and Development
Science & Engineering Indicators 2018
Between 2006 and 2016, total world S&E publication output grew at an average annual compound rate of 3.9%; the total
for developing countries grew more than twice as fast (about 8.6%).[3] China’s 8.4% growth rate led the developing countries,
resulting in China’s collective global share climbing from 12.1% in 2006 to 18.6% in 2016.[4] The strong growth in the developing world points to rapidly increasing science and technology capabilities.
Among other large emerging economies, the 2006–16 average publication growth rate in India was 11.1%; Brazil averaged
6.6%, but this was from a much lower base of total publications. India’s and Brazil’s 2016 global shares increased to 4.8% and
2.3%, respectively, with India becoming the third largest producer of S&E publications ( Table 5-22). The change in the
absolute number of publications seen during the last 10 years provides context to the growth rate. The absolute increase in
the number of publications between 2006 and 2016 is much larger for China (236,406) and India (71,729) than for Brazil
(25,447). Rapid growth of S&E publications in Brazil, India, and China coincided with increased R&D expenditures and growth
in S&E degrees awarded at the bachelor’s- and doctoral-degree levels (see Chapter 2 section International S&E Higher
Education). Smaller developing countries with more than 5,000 publications in 2016 and over 15% growth rate from 2006 to
2016 included Iran, Malaysia, Saudi Arabia, Indonesia, and Colombia.
The output of the EU, the world’s largest producer, grew 2.5% from 2006 to 2016, faster than the average for developed
countries (1.7%). Among EU member countries, growth rates were lower for the three largest producers—France (1.1%),
Germany (2.0%), and the United Kingdom (1.0%)—and were generally much higher in smaller member countries. Several
former Eastern Bloc countries, including the Czech Republic, Romania, and Slovakia, had publication growth rates above 6.0%
for 2006–16. Like that of the United States, the EU’s global share fell, from 30.7% in 2006 to 26.7% in 2016.
In Japan, absolute numbers of S&E publication output declined at a 1.3% average rate over 2006–16, decreasing Japan’s
global share from 7.0% to 4.2% during this period. Publication output from other developed economies outside of the EU and
the United States grew, particularly in Australia, Norway, South Korea, and Singapore.
The distribution of S&E publication output by field indicates the priorities of scientific research in different locations. The
S&E publication portfolios of five major producers—the United States, the EU, China, Japan, and India—have distinct
differences by field ( Table 5-23; Appendix Table 5-28 through Appendix Table 5-40). Nearly half of U.S. publications are
focused on biological sciences, medical sciences, or other life sciences, compared with 38.6% for the world at large in 2016.
The United States also produces a higher proportion of S&E publications than the rest of the world in psychology and social
sciences. In this context, it is useful to acknowledge that publications in the Scopus database must have an abstract in the
English language to be included in the publication counts (Archambault et al. 2009), meaning that publication counts in the
social sciences, where publications are more likely in the national language, may be underestimated where English is not the
country’s national language.
National Science Board | 5 | 112
CHAPTER 5 | Academic Research and Development
Science & Engineering Indicators 2018
S&E research portfolios of selected region, country, or economy, by field: 2016
(Percent)
Field World United States EU China Japan India
All articles (number) 2,295,608 408,985 613,774 426,165 96,536 110,320
Engineering 18.4 12.3 14.6 28.9 17.1 24.2
Astronomy 0.6 0.8 0.9 0.3 0.5 0.4
Chemistry 7.9 5.1 6.7 12.3 9.1 10.1
Physics 8.7 6.7 8.3 9.9 12.4 9.0
Geosciences 5.7 5.0 5.5 7.1 3.8 4.9
Mathematics 2.3 2.0 2.6 2.0 1.7 1.9
Computer sciences 8.3 6.4 8.6 8.7 8.1 14.1
Agricultural sciences 2.2 1.2 2.0 2.2 1.5 2.6
Biological sciences 15.3 17.9 15.0 14.0 15.2 14.5
Medical sciences 22.1 29.3 24.4 13.3 27.9 15.3
Other life sciences 1.2 2.4 1.3 0.2 0.4 0.4
Psychology 1.7 3.5 2.1 0.3 0.6 0.2
Social sciences 5.3 7.2 8.0 1.0 1.5 2.4
EU = European Union.
Note(s)
Article counts are from a selection of journals in S&E from Scopus. Articles are classified by their year of publication and are assigned to
a region, country, or economy on the basis of the institutional address(es) listed in the article. Articles are credited on a fractional-count
basis. See Appendix Table 5-26 for regions, countries, and economies included in the EU. Percentages may not add to 100% because of
rounding.
Source(s)
National Science Foundation, National Center for Science and Engineering Statistics; SRI International; Science-Metrix; Elsevier, Scopus
abstract and citation database, accessed July 2017. See Appendix Table 5-28 through Appendix Table 5-40.
Science and Engineering Indicators 2018
Like the United States, the EU is more focused on biological sciences, medical sciences, and other life sciences; these three
fields together account for 40.7% of the EU’s publications, compared with the 38.6% of world publications. Relative to the
United States, the EU has higher shares of publications in physics, chemistry, and engineering. Relative to the world total,
TABLE 5-23
National Science Board | 5 | 113
CHAPTER 5 | Academic Research and Development
Science & Engineering Indicators 2018
China’s S&E publications are more heavily focused on engineering, chemistry, physics, and geosciences. Engineering
publications made up 28.9%, and chemistry publications made up another 12.3%, of China’s publication output in 2016.
Engineering publications as a share of total publication output volume for India in 2016 (24.2%) are also above the world
proportion (18.4%). India’s portfolio has the highest concentration in computer sciences of the regions, countries, and
economies discussed here, with a 14.1% share, and is above world average concentration in chemistry.
Recent bibliometric research has focused on merging administrative data sets to explore publication data by gender,
potentially revealing differences between countries and research fields (see sidebar S&E Publication Patterns, by Gender).
Publication Output, by U.S. Sector
This report divides the U.S. institutional landscape into six sectors, each of which produced S&E publications: the federal
government, industry, academia, federally funded research and development centers (FFRDCs), private nonprofit
organizations, and state and local governments.[5]
In the United States, the academic sector is the largest producer of S&E publications, accounting for three-fourths of U.S.
S&E publication output. This sector was largely responsible for the growth of U.S. S&E publication output between 2006 and
2016. The number of academic S&E publications increased from 271,502 to 307,413 between these years, rising from 70.9% to
75.2% as a share of all U.S. publications ( Figure 5-23). Public universities accounted for 44.2% of all U.S. publications, and
private universities accounted for 25.3% (Appendix Table 5-41).
National Science Board | 5 | 114
CHAPTER 5 | Academic Research and Development
Science & Engineering Indicators 2018
Year
Num
ber
U.S. academic institution U.S. nonacademic institution Unknown institution sector
Articles refer to publications from a selection of journals, books, and conference proceedings in S&E from Scopus. Articles are
classified by their year of publication and are assigned to fields of science by matching the journal in Scopus to the National Science
Foundation's subfields (Appendix Table 5-25). Articles are credited on a fractional-count basis (i.e., for articles from multiple regions,
countries, and economies, each region, country, or economy receives fractional credit on the basis of the proportion of its
participating authors). See Appendix Table 5-41.
Source(s)
National Science Foundation, National Center for Science and Engineering Statistics; SRI International; Science-Metrix; Elsevier,
Scopus abstract and citation database, accessed July 2017.
Science and Engineering Indicators 2018
S&E publications in U.S. non-academic institutions fell from 87,513 in 2006 to 76,012 in 2016. Trends in non-academic
sectors include the following (Appendix Table 5-41):
• Industry publications reached a high of 33,498 in 2005 and then declined to 24,565, or 6.0% of the U.S. total, in 2016.
• Federal government publications grew in the early 2000s, peaking at 22,580 in 2012 and declining to 19,556 in 2016, accounting for 4.8% of the U.S. total in 2016.
• Publications from FFRDCs grew to a peak of 10,927 in 2012 and have declined to 9,107 in 2016.
FIGURE 5-23
U.S. academic and nonacademic S&E articles: 2003–16
National Science Board | 5 | 115
CHAPTER 5 | Academic Research and Development
Science & Engineering Indicators 2018
• Publications with institutional addresses in the private nonprofit sector decreased slightly (from 21,555 in 2006 to 21,248 in 2016), accounting for 5.2% of U.S. publications in 2016.
As noted previously, life sciences (biological sciences, medical sciences, and other life sciences) dominate the research
portfolios of U.S. sectors, accounting for nearly half or more of all publications produced in the federal government, academic,
private nonprofit, and state and local government sectors (Appendix Table 5-41). The dominance of life sciences is especially
pronounced in the nonprofit sector, with 86.9% of publications in these fields: 63.1% in medical sciences, 19.8% in biological
sciences, and 4.1% in other life sciences. With a much larger number of total publications, academia has 49.2% of its S&E
literature in life sciences. The exception to the life sciences focus is the research portfolio of industry (28.2% engineering) and
FFRDCs (29.6% physics); most of the FFRDCs are controlled by DOE or DOD.[6] The largest science fields in the FFRDC portfolio are physics (within physical sciences) (29.6%), chemistry (14.1%), and engineering (24.6%).
National Science Board | 5 | 116
CHAPTER 5 | Academic Research and Development
Science & Engineering Indicators 2018
Share of U.S. S&E articles, by sector and field: 2016
Medical sciences 24.5 14.8 28.8 4.5 63.1 38.8 32.8
Other life sciences 1.3 1.7 2.3 0.1 4.1 3.7 5.0
Physics 8.4 11.3 6.2 29.6 0.9 0.5 4.7
Psychology 1.4 0.7 4.1 0.1 1.6 1.9 3.4
Social sciences 2.9 1.5 8.3 0.6 3.4 3.6 8.5
FFRDC = federally funded research and development center.
Note(s)
Articles refer to publications from a selection of journals, books, and conference proceedings in S&E from Scopus. Articles are classified
by their year of publication and are assigned to fields of science by matching the journal in Scopus to the National Science Foundation's
subfields (Appendix Table 5-25). Articles are credited on a fractional-count basis (i.e., for articles from multiple countries, economies, or
sectors, each country, economy, or sector receives fractional credit on the basis of the proportion of its participating authors). The sum
of sectors may not add to the field total because of rounding.
Source(s)
National Science Foundation, National Center for Science and Engineering Statistics; SRI International; Science-Metrix; Elsevier, Scopus
abstract and citation database, accessed July 2017. See Appendix Table 5-41.
TABLE 5-24
National Science Board | 5 | 117
CHAPTER 5 | Academic Research and Development
Science & Engineering Indicators 2018
Science and Engineering Indicators 2018
Coauthorship and Collaboration in S&E Literature
Coauthorship on S&E research publications is based on multiple institutional addresses associated with the same
publication. Such interconnections among researchers in different institutional settings may indicate researchers’ growing
capacity to address complex problems by drawing on diverse skills and perspectives. Collaborative S&E research facilitates
knowledge transfer and sharing among individuals, institutions, and nations. Between 2006 and 2016, international
collaboration increased; domestic-only collaboration held steady as a share of the total, and single-institution authorship
declined ( Figure 5-24).
National Science Board | 5 | 118
CHAPTER 5 | Academic Research and Development
Science & Engineering Indicators 2018
Type of authorship
Perc
ent
2006 2016
Multiple institutional authorship0
20
40
60
80
Note(s)
Article counts refer to publications from a selection of journals, books, and conference proceedings in S&E from Scopus. Articles are
classified by their year of publication and are assigned to a region, country, or economy on the basis of the institutional address(es)
listed in the article. Articles are credited on a whole-count basis (i.e., each collaborating region, country, or economy is credited with
one count). Articles with multiple institutions are counts of articles with two or more institutional addresses. Articles with multiple
domestic institutions only are counts of articles with more than one institutional address within a single region, country, or economy.
Articles with international institutions are counts of articles with institutional addresses from more than one country or economy.
See Appendix Table 5-42.
Source(s)
National Science Foundation, National Center for Science and Engineering Statistics; SRI International; Science-Metrix; Elsevier,
Scopus abstract and citation database, accessed July 2017.
Science and Engineering Indicators 2018
Collaboration among U.S. Sectors
U.S. coauthorship data at the sector level—academic, nonprofit, industry, FFRDCs, and federal and state government—
indicate collaboration among U.S. sectors and between U.S. sectors and foreign institutions. Over the period 2006–16, the
share of publications produced in collaboration with other U.S. sectors or with foreign institutions increased in all sectors
FIGURE 5-24
Share of world articles in all fields with authors from multiple institutions, domestic-only institutions, and international coauthorship: 2006 and 2016
National Science Board | 5 | 119
CHAPTER 5 | Academic Research and Development
Science & Engineering Indicators 2018
( Table 5-25).[7] The proportion of academic publications coauthored with other U.S. sectors and foreign institutions
increased from 41.4% in 2006 to 51.0% in 2016. The share of academic publications coauthored with foreign institutions
increased from 24.9% to 37.2% over this period. FFRDCs, where the research conducted focuses primarily on the physical
sciences, have the highest percentage of international coauthorship of U.S. sectors, at 45.6% in 2016.
National Science Board | 5 | 120
CHAPTER 5 | Academic Research and Development
Science & Engineering Indicators 2018
Shares of U.S. sector publications coauthored with other U.S. sectors and foreign institutions: 2006 and 2016
(Percent)
Year
U.S. sector
AcademicFederal
governmentIndustry FFRDCs
Private
nonprofit
State and local
government
2006
All publications (number) 355,041 43,086 57,340 19,414 46,395 3,954
Total coauthored 71.4 84.9 75.8 77.1 87.9 90.0
Total coauthored with another U.S.
sector or foreign institution41.4 74.9 64.5 71.7 75.9 81.2
Coauthored with another U.S.
sector21.1 65.3 51.6 57.6 64.7 77.4
Coauthored with academic
sectorna 54.4 42.4 49.5 57.1 63.8
Coauthored with nonacademic
sector21.1 25.8 20.2 19.7 20.8 37.4
Coauthored with foreign
institutions24.9 24.0 22.5 33.3 24.1 14.0
2016
All publications (number) 437,682 45,214 50,889 20,650 50,146 4,298
Total coauthored 76.0 88.6 81.5 86.6 89.2 91.7
Total coauthored with another U.S.
sector or foreign institution51.0 81.9 73.2 82.5 81.3 87.2
Coauthored with another U.S.
sector20.4 71.0 55.7 66.2 70.6 83.6
Coauthored with academic
sectorna 63.5 49.1 60.8 66.7 74.0
Coauthored with nonacademic
sector20.4 25.8 19.4 18.8 18.5 37.2
Coauthored with foreign
institutions37.2 33.5 34.9 45.6 32.9 19.1
TABLE 5-25
National Science Board | 5 | 121
CHAPTER 5 | Academic Research and Development
Science & Engineering Indicators 2018
na = not applicable.
FFRDC = federally funded research and development center.
Note(s)
Article counts are from a selection of journals, books, and conference proceedings in S&E from Scopus. Articles are classified by their
year of publication and are assigned to a sector on the basis of the institutional address(es) listed in the article. Articles are credited on
a whole-count basis (i.e., each collaborating institution type is credited one count in each qualifying group). The sum of articles
coauthored with various sectors could exceed the total number of articles coauthored with another sector or foreign sector because of
articles coauthored by multiple sectors. Counts of publications coauthored with another U.S. sector are limited to copublications
involving the U.S. sector at stake and another different sector. For instance, the number of coauthored publications with the
nonacademic sectors for FFRDCs does not include publications coauthored by two FFRDCs. Articles from unknown U.S. sectors are not
shown. See Appendix Table 5-45.
Source(s)
National Science Foundation, National Center for Science and Engineering Statistics; SRI International; Science-Metrix; Elsevier, Scopus
abstract and citation database, accessed July 2017.
Science and Engineering Indicators 2018
International Collaboration
The percentage of worldwide publications produced with international collaboration—that is, by authors with institutional
addresses from at least two countries—rose from 16.7% to 21.7% between 2006 and 2016 ( Figure 5-24). This increase in part
reflects increasing global capabilities in R&D and an expanding pool of trained researchers, as well as improvements in
communications technology. These collaborations may also reflect the strengthening of a network of international scholars
who increasingly collaborate with each other (Wagner, Park, and Leydesdorff 2015). Finally, the research challenges of climate
change, food, water, and energy security are fundamentally global, rather than national, in scope, thereby calling for
international research collaboration (Royal Society 2011). Although these factors affect the overall trend, the patterns of
international scientific collaboration also reflect wider relationships among countries, including linguistic and historical factors,
as well as geographic, economic, and cultural relations (Glänzel and Schubert 2005; Narin, Stevens, and Whitlow 1991).
Percentages of international collaboration, by field
The increase in international coauthorship occurs in every broad field of science. Astronomy is the most international field,
with more than half of its publications internationally coauthored (54.0%) in 2016 ( Figure 5-25). Geosciences, mathematics,
biological sciences, and physics also have percentages of international collaboration above the average of 24.2% across all
fields. Factors influencing variations among fields include the existence of formal international collaborative programs and the
use of costly research equipment (e.g., atomic colliders, telescopes), which result in cost sharing and collaboration among
countries. However, even fields with relatively low percentages of international collaboration have experienced increases in
collaboration between 2006 and 2016. For example, over the time period, social sciences grew from 11.4% to 15.4%, and
engineering grew from 13.7% to 17.7%.
National Science Board | 5 | 122
CHAPTER 5 | Academic Research and Development
Science & Engineering Indicators 2018
S&E field
Perc
ent
2006 2016
Astronomy
Geoscience
s
Biological s
cience
s
Mathematic
s
Physics
Chemistry
Agricu
ltura
l scie
nces
Psych
ology
Computer scie
nces
Medical s
cience
s
Engineerin
g
Other li
fe science
s
Socia
l scie
nces
0
20
40
60
Note(s)
Articles refer to publications from a selection of journals, books, and conference proceedings in S&E from Scopus. Articles are
classified by their year of publication and are assigned to a region, country, or economy on the basis of the institutional address(es)
listed in the article. Articles with international collaboration are counts of articles with institutional addresses from more than one
country or economy. Articles are credited on a whole-count basis (i.e., each collaborating region, country, or economy is credited with
one count).
Source(s)
National Science Foundation, National Center for Science and Engineering Statistics; SRI International; Science-Metrix; Elsevier,
Scopus abstract and citation database, accessed July 2017.
Science and Engineering Indicators 2018
International collaboration, by region, country, or economy
Countries vary widely in the proportion of their internationally coauthored S&E publications. Scale effects play a role in this.
Countries with large populations or communities of researchers may have high rates of domestic coauthorship because of the
large pool of potential domestic coauthors in their field. Researchers in smaller countries have a lower chance of finding a
potential partner within national borders, so collaborators are more likely beyond their national borders. The EU program
Horizon 2020 (like its predecessor, the 7th Framework Programme for Research and Technological Development) actively
promotes and funds international collaboration within the EU.[8]
FIGURE 5-25
Share of world S&E articles with international collaboration, by S&E field: 2006 and 2016
National Science Board | 5 | 123
CHAPTER 5 | Academic Research and Development
Science & Engineering Indicators 2018
The aforementioned publication output data in Figure 5-22 show the 28 nations of the EU as one region.[9] By individual
country, Figure 5-26 shows the percentages of international collaboration for the largest producers of S&E publications in
2016. The nations within this group that had the highest percentages of international collaboration in 2016 were three EU
nations, the United Kingdom, France, and Germany, which are also the three largest European producers of S&E publications.
International collaboration increased for these European countries between 2006 and 2016.
Region, country, or economy
Perc
ent
2006 2016
United Kingdom France Germany United States Japan China India0
20
40
60
Note(s)
Articles refer to publications from a selection of journals, books, and conference proceedings in S&E from Scopus. Articles are
classified by their year of publication and are assigned to a region, country, or economy on the basis of the institutional address(es)
listed in the article. Articles are credited on a whole-count basis (i.e., each collaborating country or economy is credited with one
count). Articles with international institutions are counts of articles with institutional addresses from more than one country or
economy. See Appendix Table 5-42.
Source(s)
National Science Foundation, National Center for Science and Engineering Statistics; SRI International; Science-Metrix; Elsevier,
Scopus abstract and citation database, accessed July 2017.
Science and Engineering Indicators 2018
FIGURE 5-26
Share of S&E articles internationally coauthored, by selected region, country, or economy: 2006 and 2016
National Science Board | 5 | 124
CHAPTER 5 | Academic Research and Development
Science & Engineering Indicators 2018
China increased its collaboration percentage across the same period but was slightly below the world average for 2016
(21.7%). The share of Indian publications that are coauthored with another country declined from 18.5% in 2006 to 17.4% in
2016.
Collaboration partnerships
This section describes global partnership patterns, with special focus on patterns of U.S. involvement in international
collaboration.
U.S. institutional authors collaborate most frequently with authors from China, currently the largest producer of S&E
publications. China accounted for 22.9% of U.S. internationally coauthored publications in 2016 ( Table 5-26). Other
substantial partners for the United States include the United Kingdom (13.4%), Germany (11.2%), and Canada (10.2%).
China, South Korea, and Canada are notable among these countries for having unusually high percentages of U.S.
participation in their own internationally coauthored publications (46.1%, 47.6%, and 43.5%, respectively). For the other 12
countries in Table 5-26, the shares range from 25.3% to 36.1%.
National Science Board | 5 | 125
CHAPTER 5 | Academic Research and Development
Science & Engineering Indicators 2018
International coauthorship of S&E articles with the United States, by selected country or economy: 2016
(Percent)
Country or
economy
U.S. share of country's or economy's international
articles
Country's or economy's share of U.S. international
articles
World 38.6 na
China 46.1 22.9
United Kingdom 29.5 13.4
Germany 28.5 11.2
Canada 43.5 10.2
France 25.3 7.5
Italy 28.5 6.6
Australia 28.8 6.3
Japan 32.7 5.4
South Korea 47.6 5.0
Spain 25.0 5.0
Netherlands 29.8 4.7
Switzerland 31.4 4.4
Brazil 36.1 4.0
India 32.0 3.5
Sweden 28.7 3.3
na = not applicable
Note(s)
Articles refer to publications from a selection of journals, books, and conference proceedings in S&E from Scopus. Articles are classified
by their year of publication and are assigned to a country or economy on the basis of the institutional address(es) listed in the article.
Articles are credited on a whole-count basis (i.e., each collaborating country or economy is credited with one count). Articles with
international institutions are counts of articles with institutional addresses from more than one country or economy. See Appendix
Table 5-44.
Source(s)
TABLE 5-26
National Science Board | 5 | 126
CHAPTER 5 | Academic Research and Development
Science & Engineering Indicators 2018
National Science Foundation, National Center for Science and Engineering Statistics; SRI International; Science-Metrix; Elsevier, Scopus
abstract and citation database, accessed July 2017.
Science and Engineering Indicators 2018
A measure of the relative strength of collaborative ties between two countries can be obtained by dividing a country’s
share of collaboration with a specific country by its overall share of international collaborations. This index is 1.00 (unity) when
coauthorship between two countries is exactly proportional to their overall shares of international collaborations ( Table
5-27). Index values above 1.0 indicate stronger ties, while scores below 1.0 indicate weaker collaborative ties (see sidebar
Bibliometric Data and Terminology).
Geographical regional collaboration, as measured by this index of international collaboration, shows trends that reflect
geographic proximity and other historical factors ( Table 5-27; Appendix Table 5-43 and Appendix Table 5-44). In North
America, the Canada-U.S. index shows a percentage of collaboration that is 13% (1.13) greater than would be expected by size
of overall international collaboration alone and that has not changed much between 2006 and 2016.
National Science Board | 5 | 127
CHAPTER 5 | Academic Research and Development
Science & Engineering Indicators 2018
Index of international collaboration on S&E articles, by selected country or economy pair: 2006 and 2016
(International collaboration index)
Country or economy pair 2006 2016
North and South America
Canada–United States 1.14 1.13
Mexico–United States 0.98 1.04
Mexico–Argentina 2.89 4.64
Mexico–Chile 2.38 4.09
Argentina–Brazil 4.76 4.78
Argentina–Chile 8.15 8.31
Europe
France–Germany 0.87 1.16
France–UK 0.82 1.01
UK–Ireland 2.04 2.16
Belgium–Netherlands 2.81 3.09
Poland–Czech Republic 3.37 5.07
Hungary–Romania 5.09 10.55
Spain–Portugal 2.97 3.43
Scandinavia
Finland–Sweden 3.97 4.15
Finland–Norway 3.31 3.79
Sweden–Denmark 3.62 3.65
Middle East
Saudi Arabia–Egypt 40.65 13.69
Turkey–Iran 1.63 3.26
Turkey–Israel 1.02 2.08
Asia and South Pacific
TABLE 5-27
National Science Board | 5 | 128
CHAPTER 5 | Academic Research and Development
Science & Engineering Indicators 2018
Country or economy pair 2006 2016
China–Japan 1.51 1.09
South Korea–Japan 1.88 1.83
Australia–Malaysia 1.37 1.54
Australia–China 1.08 1.15
Australia–New Zealand 3.72 3.38
India–South Korea 1.48 2.16
UK = United Kingdom.
Note(s)
The international collaboration index shows the first country’s rate of collaboration with the second country, divided by the second
country's rate of international coauthorship. Articles are credited on a whole-count basis (i.e., each collaborating country or economy is
credited with one count). Articles with international institutions are counts of articles with institutional addresses from more than one
country or economy. See Appendix Table 5-43.
Source(s)
National Science Foundation, National Center for Science and Engineering Statistics; SRI International; Science-Metrix; Elsevier, Scopus
abstract and citation database, accessed July 2017.
Science and Engineering Indicators 2018
Proximity alone does not explain these relationships. Language may be a factor. The U.S.-Mexico index is relatively stable
and is just what would be expected by overall shares of international coauthorship alone—near unity. Mexico has very strong
collaboration with the Spanish-speaking South American nations of Argentina and Chile (4.64 and 4.09, respectively, for 2016).
In turn, Argentina is likely to collaborate with regional neighbors Brazil and Chile. Collaboration between the United Kingdom
and Ireland is more than twice what would be expected: 2.16 in 2016.
In addition to the above-average relationships that reflect geographic proximity, Appendix Table 5-43 shows other strong
collaboration relationships that reflect historical, linguistic, and educational ties between nations. For example, Spain had a
collaboration index measure in 2016 that was two to three times higher than expected with Mexico, Argentina, and Chile.
Despite the substantial geographic distances, the United Kingdom has a higher-than-expected collaboration index with
Australia and New Zealand. Malaysia has higher-than-expected collaboration ties with the Middle East nations Iran and Saudi
Arabia in 2016.
Strong collaboration relationships also evolve over time among countries with strong educational ties, such as the United
States and China, where the collaboration index has increased from 0.88 to 1.19 from 2006 to 2016. China is the largest
foreign country of origin for international recipients of U.S. S&E doctorates. China accounted for more than one-quarter of all
international S&E doctorate recipients from 1995 to 2015 (see Chapter 2 section International S&E Doctorate Recipients).
National Science Board | 5 | 129
CHAPTER 5 | Academic Research and Development
Science & Engineering Indicators 2018
S&E Publication Patterns, by GenderRecently, researchers have begun matching publication authorship data with name databases containing gender
identifiers such as Social Security (Lariviére et al. 2013) or Genderize.io (Elsevier 2017). This sidebar summarizes research
from Science-Metrix using Scopus bibliometric data and Namsor for estimating author gender (Science-Metrix 2017b).*
Because of the various sources of uncertainty associated with matching name with gender, the analyses presented in
this sidebar should be seen as exploratory research and interpreted with caution. Researchers are finding that although
male authors historically comprised a larger share of peer-reviewed scientific publications, female authorship is growing.
Science-Metrix estimates that from 2006 to 2015, female scientific authorship increased over 20% and reached nearly
34% in 2015 ( Figure 5-G). Other researchers (Lariviére et al. 2013) have coined the term “productivity paradox” to
discuss the current phenomenon where men publish more papers on average, even though there are more female than
male undergraduate and graduate students in many countries. Gender balance is said to occur when women make up
Data are presented according to publication year. The 2015 data are preliminary and do not represent total 2015
publications.
Source(s)
Science-Metrix; NamSor, accessed October 2016; Elsevier, Scopus abstract and citation database, accessed August 2016.
Science and Engineering Indicators 2018
The gender of authors differs across research fields.† Science-Metrix finds that over the last decade, the research field with the highest proportion of female authorship is public health and health services; this is also the only field where
women represent a larger share of authorship than men ( Figure 5-H). Psychology and cognitive sciences and social
sciences are all at or above the 40% mark. Six other fields are above 30%, and the remaining 8 fields are below 30%
(which is the overall average across Scopus for the 2006–15 period).
FIGURE 5-G
Trends in the proportion of female authors of S&E publications in Scopus: 2006–15
FIGURE 5-H
Proportion of female authors of S&E publications, by field: 2006–15
National Science Board | 5 | 131
CHAPTER 5 | Academic Research and Development
Science & Engineering Indicators 2018
Note(s)
Rectangle is the 95% confidence interval for NamSor only. The line is the 95% confidence interval due to the sampling error.
Source(s)
Science-Metrix; NamSor, accessed October 2016; Elsevier, Scopus abstract and citation database, accessed August 2016.
Science and Engineering Indicators 2018
Among the 20 countries that produce the most academic articles, female authorship in Scopus (over the 2006–15 period)
measured highest for South Korea and China, which all scored above the 40% mark ( Figure 5-I). In the United States,
women account for just under 30% of U.S. authorship. Two countries, South Korea and China, achieve gender parity with
40% or more of women in authorship, 6 more are near parity with above 30%, 11 more (including the United States) are
above 20%, and Japan is around 13%.
FIGURE 5-I
Proportion of female authors of S&E publications, by country: 2006–15
National Science Board | 5 | 132
CHAPTER 5 | Academic Research and Development
Science & Engineering Indicators 2018
Note(s)
The rectangle is the 95% confidence interval for NamSor only. The line is the 95% confidence interval due to the sampling error.
Twenty leading academic article-producing countries are included.
Source(s)
Science-Metrix; NamSor, accessed October 2016; Elsevier, Scopus abstract and citation database, accessed August 2016.
Science and Engineering Indicators 2018
These results summarize Science-Metrix research using a name-based gender identification tool in conjunction with the
Scopus database to estimate a probability for correctly identifying gender, based on an author’s full name (given name
and family name, though given name is usually more informative). For example, Helen is clearly female, but Riley is 40%
male. The name-gender matched data set therefore introduces some uncertainties into the analysis because some
names are not gender specific, especially for countries in East Asia, and those authorships that cannot be tagged with a
high degree of certainty are removed from the analyzed population.‡
Further uncertainties exist in the analysis because Scopus has some coverage limits in non-English speaking countries
(e.g., Russia), and some fields or editorial policies promote the use of initials rather than an author’s given name
(astronomy). Over time, the availability of full first names (as opposed to initials only) has risen in the Scopus database,
approaching 70% in 2002 and 2003, and has been consistently close to 80% since 2013.
* The Namsor tool is used to code gender and provides a probability for correctly identifying gender (http://www.namsor.com/).
† Note that definitions of fields and countries are those of Science-Metrix, not those used elsewhere in Indicators.
‡ To create estimates of sampling error for these proportions, Science-Metrix assumes that the authors who are identified by gender in the database are fully representative of the author population as a whole, including those for
whom gender cannot be determined. Confidence interval estimates have been calculated under this assumption, but
major differences between the gender distribution of those whose gender can be identified and those that are of
unknown gender could result in other sources of uncertainty.
Trends in Citation of S&E Publications
The publication counts and collaboration rates described previously provide partial indicators of the quantity of S&E
research output and the ties between researchers. Citations provide an additional indicator of the impact of research on
subsequent work (Martin and Irvine 1980). This section provides indicators of S&E publications that are cited in other S&E
publications. Citations indicate impact and are increasingly international in character, with publications authored in one
country citing those authored in other countries. An increase in citation trends potentially indicates stronger international ties,
or it can indicate changes in quality of research outside the country or region. Measured by average citation rates and by the
shares of the most highly cited publications, the developed world continues to maintain a substantial impact advantage over
the developing world. Nevertheless, the developing world is making rapid gains.
The next sections examine two aspects of publication citations in a global context: the overall citation rate of a country’s
scientific publications, and the share of the world’s most highly cited literature authored by different countries. The discussion
of publication citations will conclude with an examination of citations to publications authored by researchers at U.S. academic
institutions and in other U.S. sectors.
The rate of citations to S&E literature vary across fields of science and frequently peak within a few years after publication.
However, even old publications can “awaken” to receive citations many years after publication (Ke et al. 2015). The average of
relative citations (ARC) presented in this chapter is an index designed to allow for lags of varying length and to normalize
across fields of research (see sidebar Bibliometric Data and Terminology). In contrast, when looking at the share of a
country’s citations that come from an international source, data presented in this report are calculated based on only the
subsequent 24–36 months after publication, depending on the month in which a publication initially appears.
International Citation Patterns
Between 2004 and 2014, the share of citations to U.S. publications that come from abroad increased from 47.0% to 55.7%
( Figure 5-27). The relative shares of foreign citations increased in most countries of the world over that same period
(Appendix Table 5-47). By contrast, China’s international share of citations decreased, from 42.2% in 2004 to 37.7% in 2014.
However, the international share of a publication’s use in citations tends to decrease as a country’s domestic publication
volume grows. Thus, changes in international citations for China were to be expected; China dramatically increased its output
in recent years, so the associated decrease in its international share of citations supports the overall trend. The inverse
relationship also holds because the U.S. share of total world output has decreased and the international share of U.S. citations
has grown. Similarly, between 2004 and 2014, almost three-quarters (21) of the 28 countries in the EU increased their
international share of citations (Appendix Table 5-47), and the EU as a unit increased its external share of citations from 43.7%
to 48.1%, all while Europe’s share of global output has gradually decreased. One country that does not follow this pattern is
India, whose output volume and international share of citations have been increasing ( Figure 5-22 and Figure 5-27);
additionally, India’s international share of citations fluctuates year over year. Further investigation may determine whether
these observations result from changes in the database coverage over time or whether underlying changes in India’s research
Articles refer to publications from a selection of journals, books, and conference proceedings in S&E from Scopus. Articles are
classified by their year of publication and are assigned to a region, country, or economy on the basis of the institutional address(es)
listed in the article. Citations are presented for the year in which the cited article was published, showing the counts of subsequent
citations from peer-reviewed literature. At least 2 years of data after publication are needed for a meaningful measure. See Appendix
Table 5-47.
Source(s)
National Science Foundation, National Center for Science and Engineering Statistics; SRI International; Science-Metrix; Elsevier,
Scopus abstract and citation database, accessed July 2017.
Science and Engineering Indicators 2018
The patterns of international citations between country pairs shows the impact of one country’s S&E publications on
another country’s S&E researchers. The relative citation index normalizes cross-national citation data for variations in relative
size of publication output, much like the collaboration index (see sidebar Bibliometric Data and Terminology). The expected
value is 1.00, but unlike the collaboration index, citation index scores are not symmetric. For example, if country A cites
publications by country B 15% more often than expected, that does not mean that country B also cites publications by country
FIGURE 5-27
Share of citations to selected region, country, or economy that are received from authors abroad: 1996–2014
National Science Board | 5 | 135
CHAPTER 5 | Academic Research and Development
Science & Engineering Indicators 2018
A 15% more than expected. Table 5-28 shows the relative citation index for 2014 for major publishing locations in four
regions: North America, South America, the EU, and Asia. These data show the following:
• From among the major producers of S&E publications, U.S. publications cite publications from Canada (1.15) and the United Kingdom (1.13) more than expected, based on size.
• U.S.-based authors cite Chinese (0.31), Indian (0.20), and other Asian S&E publications less than expected.
• Publications by Mexican researchers are heavily cited in publications from Argentina and Chile. Likewise, Mexican researchers cite publications by South American authors more than they cite publications from other areas of the world.
• Inter-European influence is strong, with France, Germany, and United Kingdom country pairs exhibiting index values greater than 1.0 (with the exception of the United Kingdom citing France, which occurs at the expected rate).
Similar to the coauthorship patterns, these data indicate the strong influence that geographic, cultural, and linguistic ties
have on citation patterns.
National Science Board | 5 | 136
CHAPTER 5 | Academic Research and Development
Science & Engineering Indicators 2018
Relative citation index, by selected region, country, or economy pair: 2014
(Relative citation index)
Citing region, country, or economy
Cited region, country, or economy
North America South America EU Asia
Canada Mexico United States Argentina Brazil Chile France Germany United Kingdom China India Japan South Korea Taiwan
Citations refer to publications from a selection of journals, books, and conference proceedings in S&E from Scopus. Articles are classified by their year of publication and are assigned to a region, country, or economy on the basis of the
institutional address(es) listed in the article. Articles are credited on a fractional-count basis (i.e., for articles with collaborating institutions from multiple regions, countries, or economies, each region, country, or economy receives
fractional credit on the basis of the proportion of its participating institutions). Citation counts are based on all citations made to articles in their publication year and in the 2 following years (i.e., a 3-year citation window; for instance,
scores in 2012 are based on citations to articles published in 2012 that were made in articles published in 2012–14).
Source(s)
National Science Foundation, National Center for Science and Engineering Statistics; SRI International; Science-Metrix; Elsevier, Scopus abstract and citation database, accessed July 2017.
Science and Engineering Indicators 2018
National Science Board | 5 | 138
CHAPTER 5 | Academic Research and Development
Science & Engineering Indicators 2018
The ARC scores are calculated to allow for citation lags of varying lengths and to normalize for field of research (see sidebar
Bibliometric Data and Terminology). Appendix Table 5-50 provides the ARC scores for 1996–2014 for countries and regions
with enough publications to compute robust scores. Through 2014, the U.S. ARC score held steady around 1.40, or 40% more
citations than would be expected, based on the number of peer-reviewed publications and representation by field. China’s
ARC score rapidly increased across 2004–14, from 0.62 to 0.96, improving from 38% fewer citations than would be expected,
based on size, to just reaching the expected level of citations.
When viewed as a group, the countries of the EU increased from slightly more citations than would be expected based on
size (1.06) in 2004, to nearly 10% more (1.16) in 2014, based on ARC scores ( Figure 5-28). Appendix Table 5-50 provides
country-level measures for the EU that show that Belgium, Cyprus, Denmark, Estonia, Finland, Ireland, the Netherlands,
Sweden, and the United Kingdom had the highest ARC scores in 2014 (all at or above 1.50). In East and Southeast Asia,
Singapore had the highest ARC score, reaching 1.83 in 2014.
At the field level, the average impact of U.S. publications is also higher than would be expected. U.S. citation impacts for
computer sciences publications are especially high, at 69% higher than the world average value. Although the 2014 U.S.
citation impacts remain above the world average for all fields combined—and individually for each of the 13 broad fields of
science—average U.S. impact has been decreasing between 2004 and 2014 in engineering, mathematics, chemistry, social
sciences, and psychology, while U.S. physics ARC remained unchanged during that period ( Figure 5-29).
FFRDC = federally funded research and development center.
Note(s)
Articles refer to publications from a selection of journals, books, and conference proceedings in S&E from Scopus. Articles are
classified by their year of publication and are assigned to a region, country, or economy on the basis of the institutional address(es)
listed in the article. Citations are presented for the year in which the cited article was published, showing the counts of subsequent
citations from peer-reviewed literature. At least 3 years of data after publication are needed for a meaningful measure. Data are
incomplete for 2014.
Source(s)
National Science Foundation, National Center for Science and Engineering Statistics; SRI International; Science-Metrix; Elsevier,
Scopus abstract and citation database, accessed December 2016.
Science and Engineering Indicators 2018
[1] For more information on the International Monetary Fund economic classification of countries, see https://www.imf.org/external/pubs/ft/weo/2016/01/weodata/groups.htm.
[2]Country assignments refer to the institutional address of authors, with partial credit given for international coauthorship. See sidebar Bibliometric Data and Terminology for more information on how S&E article production and collaboration are measured.
FIGURE 5-32
Average relative citations for U.S. S&E articles, by sector: 2004–14
[3]Calculated from Appendix Table 5-27 and the International Monetary Fund definition of developing countries.
[4] The English-language bias in Scopus understates the “true” number of publications from China.
[5]In 2015, 7.4% of the U.S. publications could not be assigned to a sector based on the information in the Scopus database.
[6]See the Master Government List of Federally Funded R&D Centers at https://www.nsf.gov/statistics/ffrdclist/.
[7]Note that coauthorship counts use whole counting, which means that a publication with a foreign coauthor and a domestic author from a different sector will be counted as a coauthored paper with another U.S. sector and counted as coauthored with a foreign institution.
The nation’s universities and colleges play a key role in U.S. R&D by providing the following services:
• Educating and training S&E students in research practices and other advanced skills
• Performing a large share of the nation’s basic research
• Building and operating world-class research facilities and supporting the national research cyberinfrastructure
• Producing intellectual output through published research articles and patents
Over the past several decades, academic expenditures on R&D have continued to increase, with slowing growth trends in
recent years. Although the federal government has long provided the majority of funding for academic R&D through research
grants and contracts, its share of total academic R&D funding has declined in recent years. The percentage paid for by
universities and colleges, meanwhile, has increased markedly in recent years, but these funds do not replace federal research
funds in kind. Other important sources of academic R&D funding are state and local governments, businesses, and nonprofit
organizations.
Academic R&D expenditures have long been concentrated in a relatively small number of universities. For the last quarter
century, fewer than 12 universities each year have received about one-fifth of total academic R&D funding, about 20
universities have received close to one-third of this funding, and about 100 have received four-fifths of the total. (The
identities of the universities in each group have somewhat varied over time.)
For decades, more than half of all academic R&D spending has been in the broad field of life sciences. However, over the
past decade, spending on engineering R&D has outpaced growth in spending in the sciences in the aggregate.
About one-third of all U.S.-trained, academically employed S&E doctorate holders received their degree in life sciences. (In
2015, just over 55% of their foreign-trained counterparts had doctorates in life sciences.) The dominance of life sciences is also
seen in physical infrastructure, where two subfields of life sciences—biological sciences and biomedical sciences—account for
the bulk of growth in research space and where the largest share of new university research construction has been
undertaken to advance health and clinical sciences.
The structure of academic employment of S&E doctorate holders within the nation’s universities and colleges has
undergone substantial changes over the past 20–30 years. Although full-time faculty positions in the professoriate continue to
be the norm in academic employment, S&E doctorate holders are increasingly employed in part-time and nontenured
positions. Since 1995, the percentage of doctorate holders with tenured positions has decreased even as the academic
doctoral workforce has aged. The share of academic researchers receiving federal support, including early career S&E faculty,
has declined since 1991. Funding success rates have declined at NIH and NSF over the past 15 years.
Higher education has also experienced notable changes in demographic diversity. In particular, the proportion of academic
doctoral positions held by white, male, native-born citizens has declined. Women represent a growing proportion of academic
doctoral employment in S&E, as do the foreign born and foreign trained. The proportion of Asians or Pacific Islanders
employed in the S&E academic doctoral workforce has grown dramatically over the past three decades, while the shares held
by blacks, Hispanics, and American Indians or Alaska Natives have grown much more slowly; these latter groups remain
underrepresented in the academic doctoral workforce.
There have been further shifts in the degree to which the academic doctoral workforce is focused on research activities
versus teaching. Among full-time doctoral S&E faculty, priority shifted from teaching to research from 1973 to 2003; since
2003, however, the proportions of faculty who primarily teach and those who primarily conduct research have remained
National Science Board | 5 | 149
CHAPTER 5 | Academic Research and Development
Science & Engineering Indicators 2018
relatively stable. Of those in the academic doctoral workforce reporting research as their primary activity, two-thirds are
employed at the nation’s most research-intensive academic institutions. Those who primarily teach are more evenly
distributed across academia.
Overall, the United States remains the most influential individual nation in its contribution to S&E publications, based on
overall size of the U.S. contribution and its relative impact, as measured by citations in S&E publications. The bibliometric data
described in this chapter show U.S. research maintaining global strength in the life sciences, as demonstrated by publication
output and citations.
In terms of S&E research quantity, but not impact, China produced the most S&E publications in 2016. Growth trends in
S&E publications reflect the spread of overall economic and social development across the world. Building from a higher base,
the developed world, including the United States, the EU, and Japan, is growing more slowly in S&E publications, and
developing nations are increasing production more quickly.
In addition to the increased performance in the developing world, individual nations within the EU and the developed
world have emerged as research hubs, as demonstrated by their citations. International research collaboration is increasing,
reflecting traditional cross-country ties and new ones that stem from growing capabilities in the developing world. This
international collaboration and the accompanying rise in international citations indicate that S&E knowledge is flowing with
increasing ease across the world. Unlike the competition for finite resources, the creation of S&E research adds to the
knowledge base available for use worldwide—a communal supply on which more and more countries can capitalize as
research capacities increase globally.
Glossary
Definitions
Average of relative citations (ARC): The ARC is a citation measure normalized across fields of science and years of publication
to correct for differences in the frequency and timing of citations. Dividing each publication’s citation count by the average
citation count of all publications in that subfield in that same year creates a relative citation. Then, for a given geography or
sector, these relative citations for each publication are averaged to create an ARC.
Doctoral academic S&E workforce: Includes those with a research doctorate in science, engineering, or health who are
employed in 2- or 4-year colleges or universities, including medical schools and university research institutes, in the following
positions: full and associate professors (referred to as senior faculty); assistant professors (referred to as junior faculty);
postdoctorates (postdocs); other full-time positions, such as instructors, lecturers, adjunct faculty, research associates, and
administrators; and part-time positions of all kinds. Unless otherwise specified, these individuals earned their doctorate at a
U.S. university or college.
European Union (EU): The EU comprises 28 member nations: Austria, Belgium, Bulgaria, Croatia, Cyprus, Czech Republic,
Denmark, Estonia, Finland, France, Germany, Greece, Hungary, Ireland, Italy, Latvia, Lithuania, Luxembourg, Malta, the
Netherlands, Poland, Portugal, Romania, Slovakia, Slovenia, Spain, Sweden, and the United Kingdom. Unless otherwise noted,
Organisation for Economic Co-operation and Development data on the EU include all 28 nations.
Federally funded research and development center (FFRDC): R&D organization exclusively or substantially financed by the
federal government, to meet particular R&D objectives or, in some instances, to provide major facilities at universities for
research and associated training purposes. An industrial firm, a university, or a nonprofit institution administers each FFRDC.
National Science Board | 5 | 150
CHAPTER 5 | Academic Research and Development
Science & Engineering Indicators 2018
Fractional counting: Method of counting S&E publications in which credit for coauthored publications is divided among the
collaborating institutions or countries based on the proportion of their participating authors.
Index of highly cited articles: A country’s share of the top 1% most-cited S&E publications divided by the country’s share of all
S&E publications. An index greater than 1.00 means that a country contributed a disproportionately larger share of highly
cited publications; an index less than 1.00 means a smaller share.
Index of international collaboration: Country A’s rate of coauthorship in country B’s international collaborations, divided by
country B’s overall international collaboration rate. Values are symmetrical for country-country pairs. An index greater than
1.00 means that a country-country pair has a stronger-than-expected tendency to collaborate; an index less than 1.00 means
a weaker-than-expected tendency to collaborate.
Net assignable square feet (NASF): Unit for measuring research space. NASF is the sum of all areas on all floors of a building
assigned to, or available to be assigned to, an occupant for a specific use, such as research or instruction. NASF is measured
from the inside face of walls.
Relative citation index: Country A’s share of citations to country B’s S&E publications divided by total citations to country B’s
S&E publications. An index of greater than 1.00 means that the country has a higher-than-expected tendency to cite the other
country’s S&E literature; an index less than 1.00 means a lower-than-expected tendency to cite the other country’s literature.
Research space: The budgeted and accounted-for space used for sponsored R&D activities at academic institutions. Research
space is the net assignable square feet of space in buildings within which research activities take place. Research facilities are
located within buildings. A building is a roofed structure for permanent or temporary shelter of people, animals, plants,
materials, or equipment. Structures are included as research space if they are (1) attached to a foundation; (2) roofed; (3)
serviced by a utility, exclusive of lighting; and (4) a source of significant maintenance and repair activities.
Underrepresented minority: Racial and ethnic groups, including blacks, Hispanics, and American Indians or Alaska Natives,
which are considered to be underrepresented in academic S&E employment.
Key to Acronyms and Abbreviations
ADEA: Age Discrimination in Employment Act of 1967
ARC: average of relative citations
ARRA: American Recovery and Reinvestment Act
DOAJ: Directory of Open Access Journals
DOD: Department of Defense
DOE: Department of Energy
EPA: Environmental Protection Agency
EPSCoR: Established Program to Stimulate Competitive Research
EU: European Union
FFRDC: federally funded research and development center
FY: fiscal year
HERD: Higher Education Research and Development Survey
HHS: Department of Health and Human Services
National Science Board | 5 | 151
CHAPTER 5 | Academic Research and Development
Science & Engineering Indicators 2018
HPC: high-performance computing
NASA: National Aeronautics and Space Administration
NASF: net assignable square feet
NCSES: National Center for Science and Engineering Statistics
nec: not elsewhere classified
NIH: National Institutes of Health
NSCG: National Survey of College Graduates
NSCI: National Strategic Computing Initiative
NSF: National Science Foundation
OA: open access
R&D: research and development
RC: relative citation
S&E: science and engineering
SciELO: Scientific Electronic Library Online
SDR: Survey of Doctorate Recipients
UK: United Kingdom
URM: underrepresented minority (black or African American, Hispanic or Latino, and American Indian or Alaska Native)
USDA: Department of Agriculture
WebCASPAR: Integrated Science and Engineering Resources Data System
XSEDE: Extreme Science and Engineering Discovery Environment
References
Amano T, González-Varo JP, Sutherland WJ. 2016. Languages are still a major barrier to global science. PLOS Biology14(12):e2000933. http://journals.plos.org/plosbiology/article?id=10.1371%2Fjournal.pbio.2000933. Accessed 26 May 2016.
Arbeit CA, Kang KH. 2017. Field Composition of Postdocs Shifts as Numbers Decline in Biological Sciences and in Clinical Medicine. InfoBrief NSF 17-309. Arlington, VA: National Science Foundation, National Center for Science and Engineering
Statistics. Available at https://www.nsf.gov/statistics/2017/nsf17309/nsf17309.pdf. Accessed 1 June 2017.
Archambault É, Amyot D, Deschamps P, Nicol A, Provencher F, Rebout L, Roberge G. 2014. Proportion of open access papers published in peer-reviewed journals at the European and world levels—1996–2013. RTD-B6-PP-2011-2: Study to develop a set
of indicators to measure open access. Montreal, Canada: European Commission. Available at http://science-metrix.com/en/
publications/reports/proportion-of-open-access-papers-published-in-peer-reviewed-journals-at-the. Accessed 31 May 2017.
Archambault É, Campbell D, Gingras Y, Larivière V. 2009. Comparing bibliometric statistics obtained from the Web of Science
and Scopus. Journal of the American Society for Information Science and Technology 60:1320–26.
Association of American Medical Colleges (AAMC). 2010. Trends in tenure for clinical M.D. faculty in U.S. medical schools: A 25-
year review. Analysis in Brief 9(9). https://www.aamc.org/download/139778/data/aibvol9_no9.pdf. Accessed 1 June 2017.
Britt R. 2010. Universities Report $55 Billion in Science and Engineering R&D Spending for FY 2009; Redesigned Survey to Launch in 2010. InfoBrief NSF 10-329. Arlington, VA: National Science Foundation, Division of Science Resources Statistics.
Available at https://wayback.archive-it.org/5902/20160210165206/http://www.nsf.gov/statistics/infbrief/nsf10329/
nsf10329.pdf. Accessed 1 June 2017.
Committee on Science, Engineering, and Public Policy (COSEPUP). 2014. The Postdoctoral Experience Revisited. Washington,
DC: National Academies Press. https://www.nap.edu/catalog.php?record_id=18982. Accessed 24 February 2015.
Elsevier. 2017. Gender in the global research landscape. https://www.elsevier.com/__data/assets/pdf_file/0008/265661/
ElsevierGenderReport_final_for-web.pdf. Accessed 8 June 2017.
European Commission. 2015. She Figures 2015. Brussels, Belgium: European Commission. https://ec.europa.eu/research/
swafs/pdf/pub_gender_equality/she_figures_2015-final.pdf. Accessed 14 April 2017.
Glänzel W, Schubert A. 2005. Domesticity and internationality in co-authorship, references and citations. Scientometrics 65(3):
323–42.
Howell B. 2014. Michigan State FRIB project fully funded in federal appropriations bill. MLive Lansing 14 January. https://
www.mlive.com/lansing-news/index.ssf/2014/01/michigan_state_frib_project_fu_1.html. Accessed 11 October 2017.
Kamalski J, Plume A. 2013. Comparative benchmarking of European and US research collaboration and researcher mobility. A report prepared in collaboration between Science Europe and Elsevier’s SciVal Analytics. Amsterdam, Netherlands: Elsevier.
Ke Q, Ferrara E, Radicchi F, Flammini A. 2015. Defining and identifying sleeping beauties in science. PNAS 112(24):7426–31.
Lariviére V, Ni C, Gingras Y, Cronin B, Sugimoto C. 2013. Bibliometrics: Global gender disparities in science. Nature 11
December. http://www.nature.com/news/bibliometrics-global-gender-disparities-in-science-1.14321. Accessed 26 May 2017.
Liang L, Rousseau R, Zhong Z. 2012. Non-English journals and papers in physics: Bias in citations? Scientometrics 95(1):333–50.
Martin B, Irvine J. 1980. Assessing basic research: Some partial indicators of scientific progress in radio astronomy. Research Policy 12:61–90.
Milan L. 2012. Racial and Ethnic Diversity among U.S.-Educated Science, Engineering, and Health Doctorate Recipients: Methods of Reporting Diversity. InfoBrief NSF 12-304. Arlington, VA: National Science Foundation, National Center for Science
and Engineering Statistics. Available at https://www.nsf.gov/statistics/infbrief/nsf12304/. Accessed 29 May 2017.
Narin F, Hamilton K. 1996. Bibliometric performance measures. Scientometrics 36(3):293–310.
Narin F, Stevens K, Whitlow E. 1991. Scientific co-operation in Europe and the citation of multinationally authored papers.
Scientometrics 21(3):313–23.
National Research Council (NRC). 2012. Research Universities and the Future of America: Ten Breakthrough Actions Vital to Our Nation’s Prosperity and Security. Washington, DC: National Academies Press. Available at http://
sites.nationalacademies.org/pga/bhew/researchuniversities/. Accessed 7 June 2017.
National Science Board (NSB). 2016. Science and Engineering Indicators 2016. NSB-2016-1. Arlington, VA: National Science
Foundation. Available at https://www.nsf.gov/statistics/2016/nsb20161/#/. Accessed 25 May 2017.
National Science Foundation (NSF). 2011. XSEDE Project Brings Advanced Cyberinfrastructure, Digital Services and Expertise to Nation’s Scientists and Engineers. NSF News Release 11-152. Available at https://nsf.gov/news/news_summ.jsp?
cntn_id=121181. Accessed 31 May 2017.
National Science Foundation (NSF). 2012. Cyberinfrastructure for 21st Century Science and Engineering, Advanced Computing Infrastructure: Vision and Strategic Plan. NSF 12-051. Available at https://www.nsf.gov/pubs/2012/nsf12051/nsf12051.pdf.
Accessed 31 May 2017.
National Science Foundation, National Center for Science and Engineering Statistics (NSF/NCSES). 2017. Science and Engineering Research Facilities: Fiscal Year 2015. Detailed Statistical Tables NSF 17-5097. Arlington, VA. Available at https://
ncsesdata.nsf.gov/datatables/facilities/2015/. Accessed 29 May 2017.
National Strategic Computing Initiative Executive Council (NSCI Executive Council). 2016. National Strategic Computing