33
CHAPTER 5 AGGREGATE OUTPUT, PRICES, AND ECONOMIC GROWTH Presenter’s name Presenter’s title dd Month yyyy
| Date post: | 21-Dec-2015 |
| Category: |
Documents |
| Upload: | bruce-chapman |
| View: | 225 times |
| Download: | 1 times |

CHAPTER 5AGGREGATE OUTPUT, PRICES, AND ECONOMIC GROWTHPresenter’s namePresenter’s titledd Month yyyy

Copyright © 2014 CFA Institute 2
1. INTRODUCTION
• The focus of this chapter is on macroeconomics, which is the theory and analysis of a nation’s
- income and output;
- competitive and comparative advantages;
- productivity of the labor force;
- price levels and inflation; and
- government and central bank actions.
• Macroeconomics enables understanding of the effect that a nation’s economy, government actions, and economic trends have on industries and companies.

Copyright © 2014 CFA Institute 3
2. AGGREGATE OUTPUT AND INCOME
• The aggregate output of an economy is the value of all the goods and services produced in a period of time (e.g., one year or one quarter).
• The aggregate income of an economy is the value of all the payments earned by the suppliers of factors used in the production of goods and services in a period of time. Forms of payment include the following:
1. Compensation to employees
2. Rent (payment for the use of property)
3. Interest (payment of the use of funds)
4. Profit (return for the use of capital and the assumption of risk)
• The aggregate expenditure is the total amount spent on goods and services in an economy.
Copyright © 2014 CFA Institute 4
GROSS DOMESTIC PRODUCT
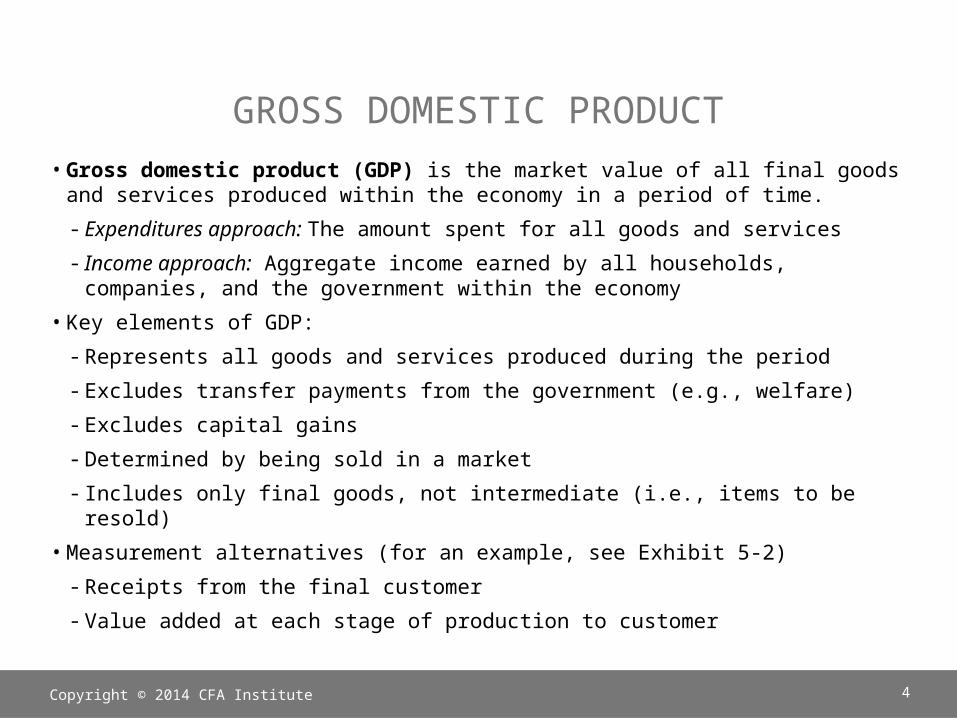
• Gross domestic product (GDP) is the market value of all final goods and services produced within the economy in a period of time.
- Expenditures approach: The amount spent for all goods and services
- Income approach: Aggregate income earned by all households, companies, and the government within the economy
• Key elements of GDP:
- Represents all goods and services produced during the period
- Excludes transfer payments from the government (e.g., welfare)
- Excludes capital gains
- Determined by being sold in a market
- Includes only final goods, not intermediate (i.e., items to be resold)
• Measurement alternatives (for an example, see Exhibit 5-2)
- Receipts from the final customer
- Value added at each stage of production to customer

Copyright © 2014 CFA Institute 5
METHODS OF CALCULATING GDP
Sales value Value added
Stage 1: Produce materialsPlasticTextile
$1.50 0.25$1.75 $1.75
Stage 2: Assemble dolls $4.00 2.25
Stage 3: Sell to wholesaler $7.00 3.00
Stage 4: Sell to retailer $10.00 3.00
Total expenditures $10.00
Total value added $10.00
Consider the manufacture and sale of a doll using both the expenditures method and the value-added method of measuring gross domestic product.
Copyright © 2014 CFA Institute 6
NOMINAL AND REAL GDP
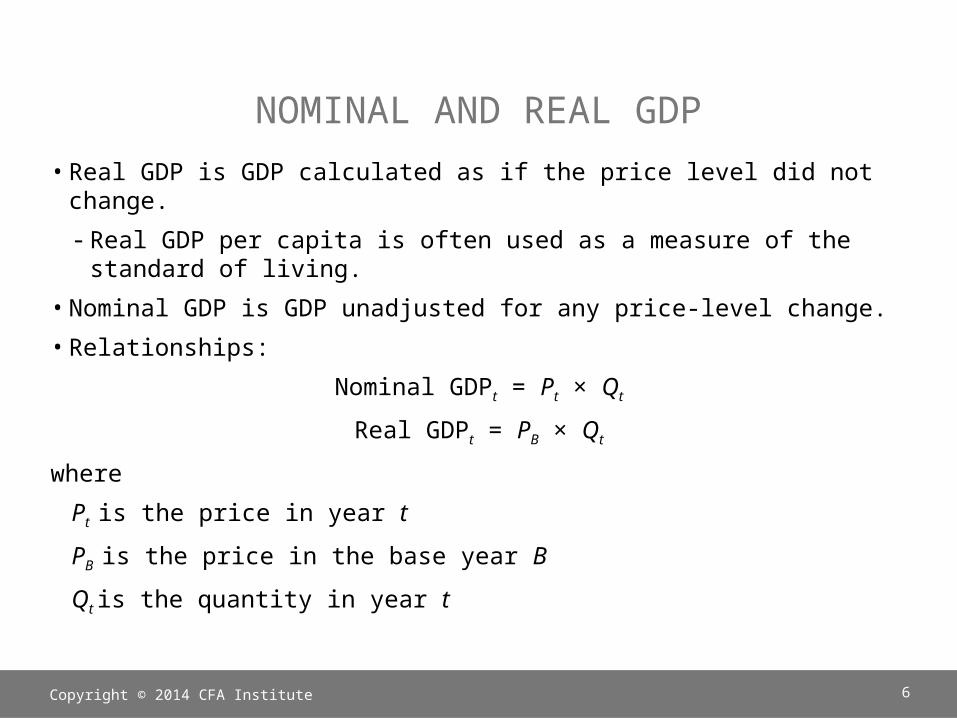
• Real GDP is GDP calculated as if the price level did not change.
- Real GDP per capita is often used as a measure of the standard of living.
• Nominal GDP is GDP unadjusted for any price-level change.
• Relationships:
Nominal GDPt = Pt × Qt
Real GDPt = PB × Qt
where
Pt is the price in year t
PB is the price in the base year B
Qt is the quantity in year t

Copyright © 2014 CFA Institute 7
GDP DEFLATOR
The GDP deflator or the implicit price deflator reflects the amount of the GDP
that is associated with the change in the price level:
Example: If nominal GDP is 16,988.3 billion and the GDP deflator is 106.775, what is real GDP?
billion

Copyright © 2014 CFA Institute 8
COMPONENTS OF GDP
Copyright © 2014 CFA Institute 9
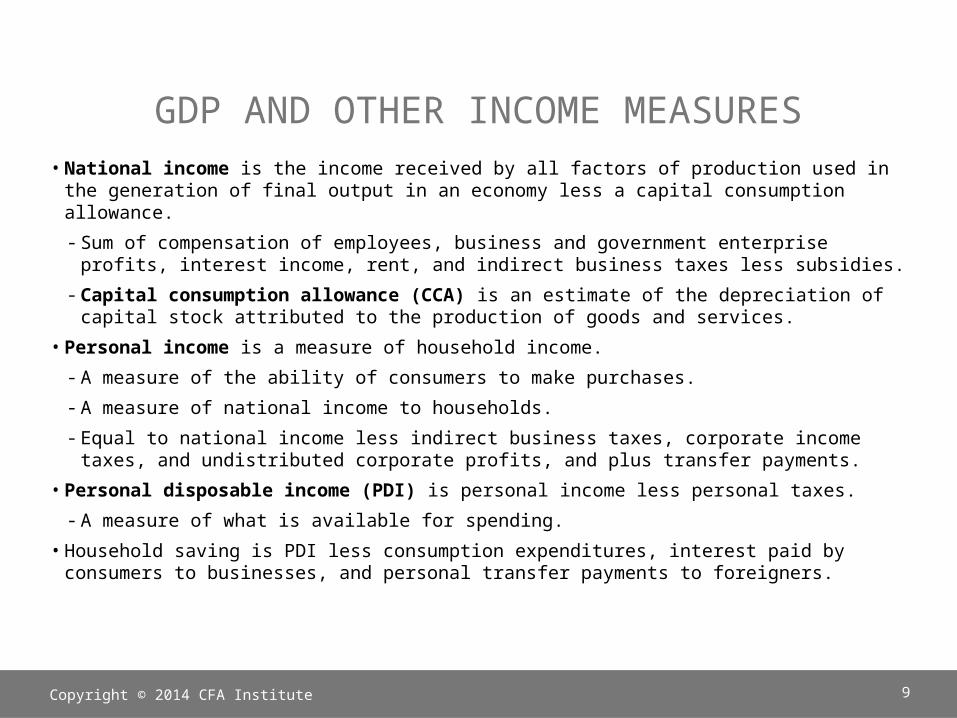
GDP AND OTHER INCOME MEASURES
• National income is the income received by all factors of production used in the generation of final output in an economy less a capital consumption allowance.
- Sum of compensation of employees, business and government enterprise profits, interest income, rent, and indirect business taxes less subsidies.
- Capital consumption allowance (CCA) is an estimate of the depreciation of capital stock attributed to the production of goods and services.
• Personal income is a measure of household income.
- A measure of the ability of consumers to make purchases.
- A measure of national income to households.
- Equal to national income less indirect business taxes, corporate income taxes, and undistributed corporate profits, and plus transfer payments.
• Personal disposable income (PDI) is personal income less personal taxes.
- A measure of what is available for spending.
• Household saving is PDI less consumption expenditures, interest paid by consumers to businesses, and personal transfer payments to foreigners.

Copyright © 2014 CFA Institute 10
THE FISCAL BALANCE
The fiscal balance is the difference between government expenditures (G) and taxes (T):
Fiscal balance = G – T
- If G > T, the fiscal balance is a deficit (spending more than taking in).
- If G < T, the fiscal balance is a surplus (taxing more than spending).
The role of automatic stabilizing:
- As income declines, the deficit grows.
- As income increases, the deficit shrinks or becomes a surplus.
Copyright © 2014 CFA Institute 11
THE TRADE BALANCE
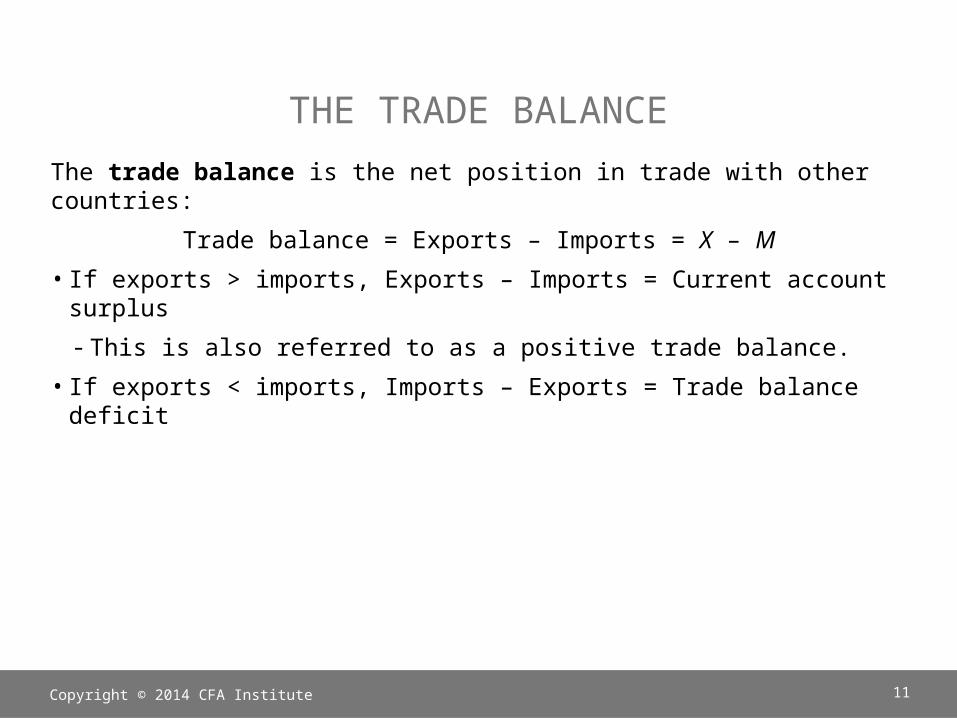
The trade balance is the net position in trade with other countries:
Trade balance = Exports – Imports = X – M
• If exports > imports, Exports – Imports = Current account surplus
- This is also referred to as a positive trade balance.
• If exports < imports, Imports – Exports = Trade balance deficit
Copyright © 2014 CFA Institute 12
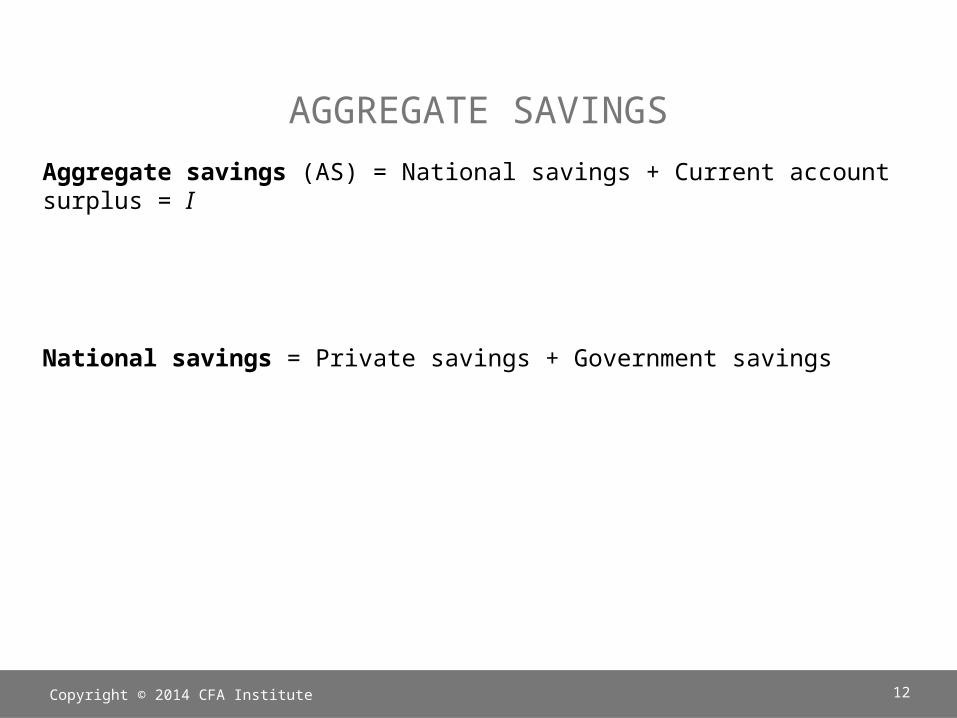
AGGREGATE SAVINGS
Aggregate savings (AS) = National savings + Current account surplus = I
National savings = Private savings + Government savings
Copyright © 2014 CFA Institute 13
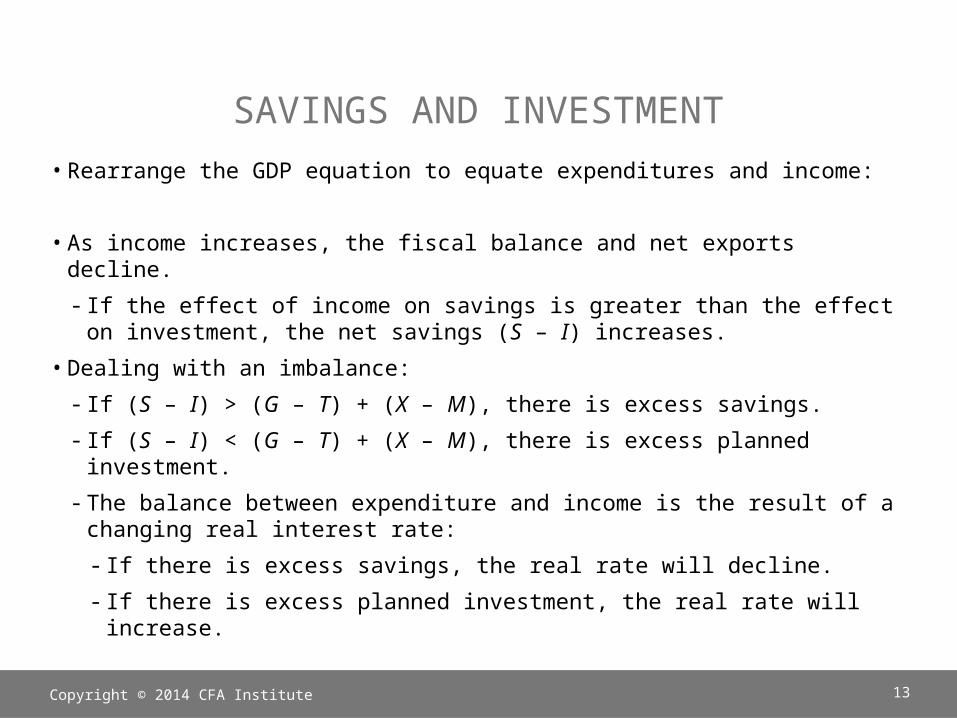
SAVINGS AND INVESTMENT
• Rearrange the GDP equation to equate expenditures and income:
• As income increases, the fiscal balance and net exports decline.
- If the effect of income on savings is greater than the effect on investment, the net savings (S – I) increases.
• Dealing with an imbalance:
- If (S – I) > (G – T) + (X – M), there is excess savings.
- If (S – I) < (G – T) + (X – M), there is excess planned investment.
- The balance between expenditure and income is the result of a changing real interest rate:
- If there is excess savings, the real rate will decline.
- If there is excess planned investment, the real rate will increase.

Copyright © 2014 CFA Institute 14
AGGREGATE DEMAND, AGGREGATE SUPPLY, AND EQUILIBRIUM
• Aggregate demand represents aggregate income and price level.
• Aggregate expenditures = Aggregate income
- This results in the investment–savings (IS) curve, which is the relationship between savings less investment (S – I) and income, Y.
- The IS curve represents the demand for money from the goods market.
• If we assume that planned expenditures equals actual income,
- there is equilibrium in the money markets, represented by the liquidity–money supply (LM) curve.
- The LM curve illustrates the supply of money/funds available for investing (that is, equilibrium in the money market):
MV = PYwhere M = money supply
V = velocity of moneyP = price levelY = income
Copyright © 2014 CFA Institute 15
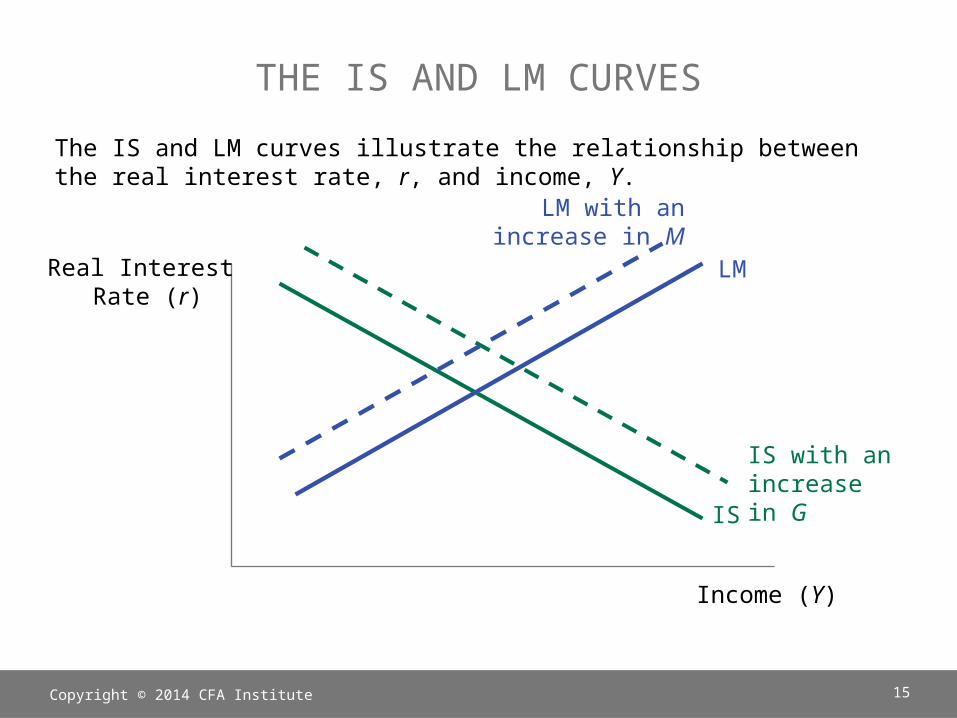
THE IS AND LM CURVES
The IS and LM curves illustrate the relationship between the real interest rate, r, and income, Y.
Real Interest Rate (r)
Income (Y)
IS
LM
IS with an increase in G
LM with an increase in M
Copyright © 2014 CFA Institute 16
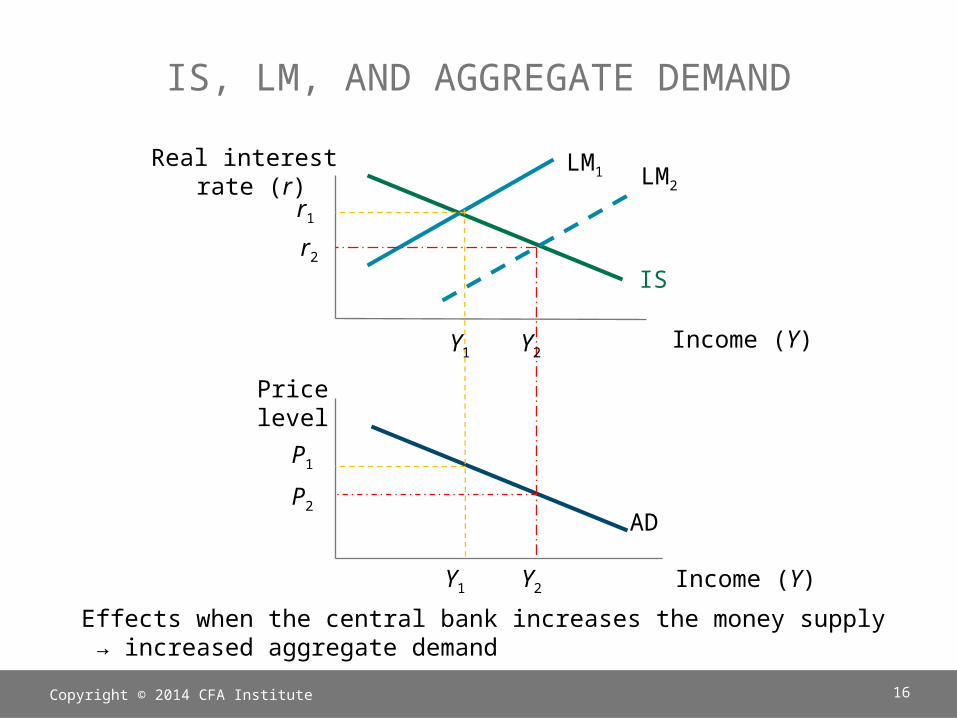
IS, LM, AND AGGREGATE DEMAND
Income (Y)
Income (Y)
Real interest rate (r)
Price level
LM1 LM2
IS
P1
P2
Y1 Y2
Y1 Y2
r1
r2
Effects when the central bank increases the money supply → increased aggregate demand
AD
Copyright © 2014 CFA Institute 17
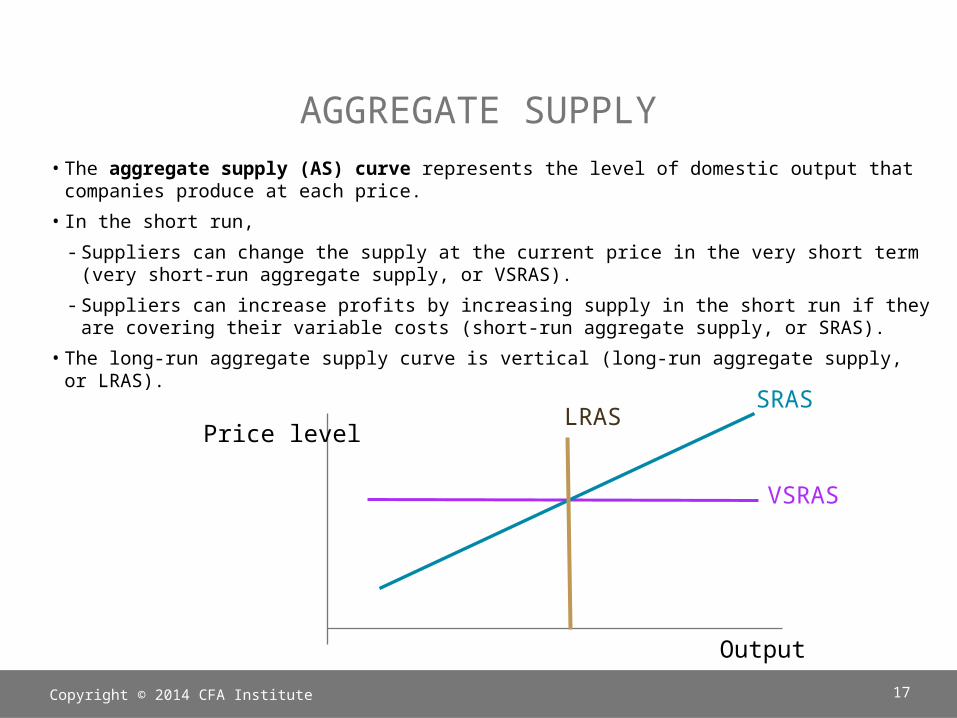
AGGREGATE SUPPLY
• The aggregate supply (AS) curve represents the level of domestic output that companies produce at each price.
• In the short run,
- Suppliers can change the supply at the current price in the very short term (very short-run aggregate supply, or VSRAS).
- Suppliers can increase profits by increasing supply in the short run if they are covering their variable costs (short-run aggregate supply, or SRAS).
• The long-run aggregate supply curve is vertical (long-run aggregate supply, or LRAS).
Output
Price level
VSRAS
LRASSRAS
Copyright © 2014 CFA Institute 18
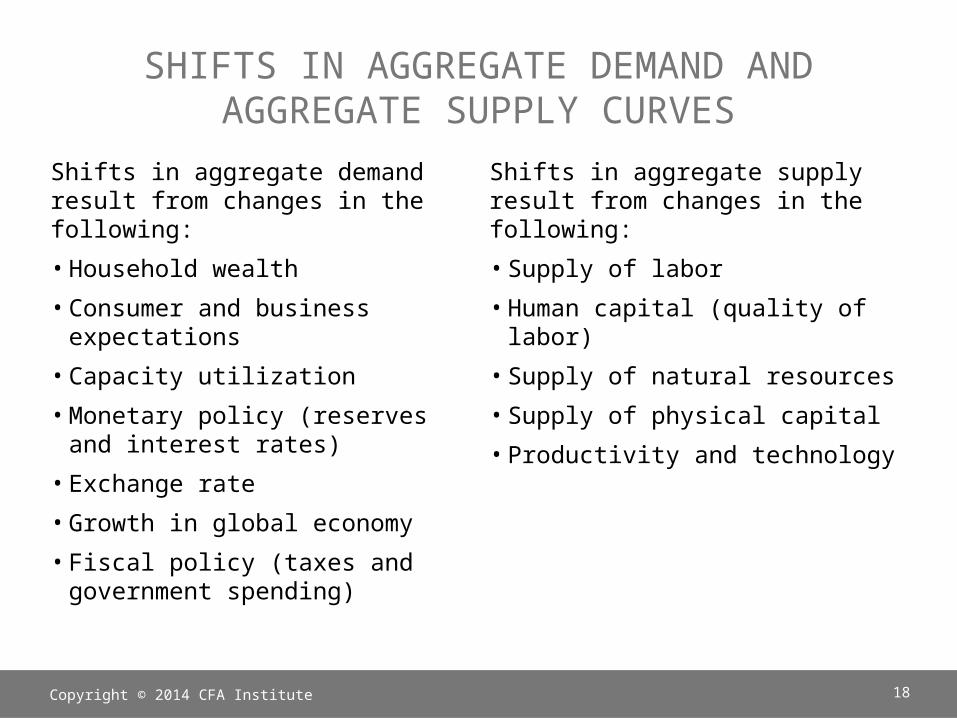
SHIFTS IN AGGREGATE DEMAND AND AGGREGATE SUPPLY CURVES
Shifts in aggregate demand result from changes in the following:
• Household wealth
• Consumer and business expectations
• Capacity utilization
• Monetary policy (reserves and interest rates)
• Exchange rate
• Growth in global economy
• Fiscal policy (taxes and government spending)
Shifts in aggregate supply result from changes in the following:
• Supply of labor
• Human capital (quality of labor)
• Supply of natural resources
• Supply of physical capital
• Productivity and technology

Copyright © 2014 CFA Institute 19
EFFECTS OF A SHIFT IN AGGREGATE DEMAND AND AGGREGATE SUPPLY ON BUSINESS CYCLES
• Equilibrium is the price level and output at which the aggregate demand and aggregate supply curves intersect.
• A business cycle consists of expansion and contraction.
- Shifts in aggregate demand and aggregate supply determine changes in the economy.
• A recession is an economic situation in which the growth in GDP is negative.
- Typical definition: two or more quarters of negative GDP growth
• Sensitivity of investments to the economy:
- A cyclical company is one in which the earnings are likely to decline in the event of an economic slowdown.
- A defensive company is one in which earnings may increase during an economic slowdown.

Copyright © 2014 CFA Institute 20
EFFECTS OF A SHIFT IN AGGREGATE DEMAND AND AGGREGATE SUPPLY ON BUSINESS CYCLES
At long-run full employment, the economy is at potential GDP, and equilibrium output is at an equilibrium where LRAS = SRAS = AD
Income, Output, Y
Pricelevel SRAS
LRAS
AD
P1

Copyright © 2014 CFA Institute 21
EFFECTS OF A SHIFT IN AGGREGATE DEMAND AND AGGREGATE SUPPLY ON BUSINESS CYCLES
A short-run recessionary gap exists when the economy is in a recession and equilibrium output is less than potential GDP.
Pricelevel SRAS
LRAS
AD1
P1
AD2
P2
Income, Output, YY1Y2

Copyright © 2014 CFA Institute 22
EFFECTS OF A SHIFT IN AGGREGATE DEMAND AND AGGREGATE SUPPLY ON BUSINESS CYCLES
A short-run inflationary gap exists when the economy drives GDP beyond the potential GDP. When price levels increase, short-run supply increases and the economy returns to the long-run equilibrium.
Income, Output, Y
SRAS
AD1
P1
AD2
P2
Y1 Y2
LRAS

Copyright © 2014 CFA Institute 23
EFFECTS OF A SHIFT IN AGGREGATE DEMAND AND AGGREGATE SUPPLY ON BUSINESS CYCLES
Short-run stagflation occurs when there is high unemployment and increased inflation brought on by a drop in aggregate supply. The downward pressure on wages and input prices eventually brings long-run full employment.
Income, Output, Y
SRAS
AD1
P1
P2
Y1Y2
LRAS

Copyright © 2014 CFA Institute 24
EFFECTS OF A SHIFT IN AGGREGATE SUPPLY AND AGGREGATE DEMAND ON THE ECONOMY:
SUMMARY
Change Change in GDP
Unemployment rate
Aggregate price level
↑ AD ↑ ↓ ↑
↓ AD ↓ ↑ ↓
↑ AS ↑ ↓ ↓
↓ AS ↓ ↑ ↑

Copyright © 2014 CFA Institute 25
4. ECONOMIC GROWTH AND SUSTAINABILITY
• The production function indicates the relationship between output and the inputs of technology, labor, and capital:
where
Y is the level of aggregate output
A is the technological knowledge
F indicates a functional relationship
L is the quantity of labor
K is the capital stock (that is, property, plant, equipment, and land) used to produce goods and services
• We use the production function to link output in an economy to the inputs.
• A is the total factor productivity (TFP), which is the growth in output not attributed to K or L.
Copyright © 2014 CFA Institute 26
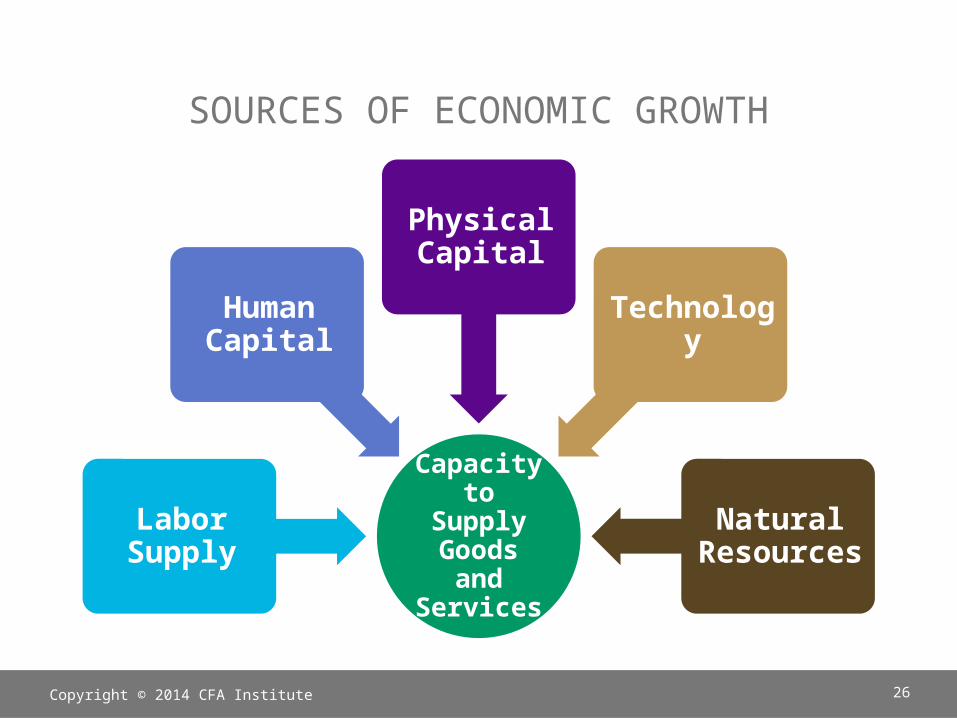
SOURCES OF ECONOMIC GROWTH
Capacity to Supply
Goods and Services
Labor Supply
Human Capital
Physical Capital
Technology
Natural Resources

Copyright © 2014 CFA Institute 27
SOURCES AND MEASURES OF ECONOMIC GROWTH
• The labor force is the portion of the working age population (that is, above age 16) that is employed or available for work.
- Human capital reflects the education, training, and life experience of the labor force.
• Labor productivity is the quantity of goods and services that a worker can produce in one hour of work:
• Labor productivity is affected by
- education and skill of workers,
- investments in physical capital, and
- improvements in technology.

Copyright © 2014 CFA Institute 28
SUSTAINABILITY OF ECONOMIC GROWTH
• Sustainable growth is the rate of growth that is achievable given the resources (labor and capital); it depends on productivity and the size of the labor force:
Example: If the labor force of a nation is expected to grow at a rate of 4% per year and the labor productivity is expected to grow at a rate of 1% per year, the expected rate of growth in potential GDP = 4% + 1% = 5%.
• We can derive the degree of slack in an economy by comparing actual growth in GDP with potential growth in GDP:
- If actual growth > potential growth → inflationary pressures
- If actual growth < potential growth → resource slack and low inflationary pressure

Copyright © 2014 CFA Institute 29
PRODUCTION FUNCTION AND GROWTH
• Economic growth depends on labor productivity.
• We can see the relation between production in an economy and labor productivity by starting with the production function:
and divide each side by 1/L:
• Therefore, the productivity relative to labor depends on the level of the labor force, the level of capital investment, and the mix of labor and capital.

Copyright © 2014 CFA Institute 30
INPUT GROWTH AND THE GROWTH OF TOTAL FACTOR PRODUCTIVITY
• Referring back to the production function,
,
we see that any growth in the output (that is, Y) depends on the inputs, but also the scale factor, A.
- A captures technology or total factor productivity (TFP), which is sometimes referred to as an index of the output per unit input.
- TFP is often viewed as the growth in GDP that is not explained by the growth in labor or capital.
• Therefore, growth in Y may come from growth in the inputs (K and L) but also from growth in TFP:
Copyright © 2014 CFA Institute 31
CONCLUSIONS AND SUMMARY
• GDP is the market value of all final, newly produced goods and services within a country in a given time period; valued by looking at either the total amount spent on goods and services produced in the economy or the income generated in producing those goods and services.
- Nominal GDP is the value of production using the prices of the current year.
- Real GDP measures production using the constant prices of a base year.
• Households earn income in exchange for providing the factors of production (labor, capital, and natural resources, including land).
• Businesses produce most of the economy’s output/income and invest to maintain and expand productive capacity.
• The government sector collects taxes from households and businesses and purchases goods and services from the private business sector.
• Capital markets provide a link between saving and investing in the economy.
• From the expenditure side, GDP includes personal consumption, gross private domestic investment, government spending, and net exports.
Copyright © 2014 CFA Institute 32
CONCLUSIONS AND SUMMARY
• National income is income received by all factors of production used in the generation of final output: GDP minus the capital consumption allowance.
• Personal income reflects pretax income received by households, whereas personal disposable income equals personal income minus personal taxes.
• Consumption spending is a function of disposable income, whereas investment spending depends on the average interest rate and the level of aggregate income.
• Aggregate demand and aggregate supply determine the level of real GDP and the price level.
• The aggregate supply curve is the relationship between the quantity of real GDP supplied and the price level, keeping all other factors constant. Movements along the supply curve reflect the impact of price on supply.
• The long-run aggregate supply curve is vertical because input costs adjust to changes in output prices, leaving the optimal level of output unchanged.
Copyright © 2014 CFA Institute 33
CONCLUSIONS AND SUMMARY
• The long-run aggregate supply curve shifts because of changes in labor supply, the supply of physical and human capital, and productivity/technology.
• The short-run supply curve shifts because of changes in potential GDP, nominal wages, input prices, expectations about future prices, business taxes and subsidies, and the exchange rate.
• The business cycle and short-term fluctuations in GDP are caused by shifts in aggregate demand and aggregate supply.
- Stagflation, a combination of high inflation and weak economic growth, is caused by a decline in short-run aggregate supply.
• The sustainable rate of economic growth is measured by the rate of increase in the economy’s productive capacity or potential GDP.
• Growth in real GDP measures how rapidly the total economy is expanding.
• The sources of economic growth include the supply of labor, the supply of physical and human capital, raw materials, and technological knowledge.
![[Company] Growth Strategy Final Presentation Month DD, YYYY](https://static.documents.pub/doc/80x56/56815d7d550346895dcb88a8/company-growth-strategy-final-presentation-month-dd-yyyy.jpg)


