Page 1
CHAPTER – 5
CHITIN co-
(ACETATE/SUCCINATE)
COPOLYMERS: SYNTHESIS,
CHARACTERIZATION AND
EVALUATION STUDIES
5.1 EXPERIMENTAL
5.1.1 MATERIALS
Chitin and succinic anhydride (SA) from Himedia, Mumbai, India and
perchloric acid from Merck, Mumbai, India were procured and used as received. All
other reagents/solvents were of suitable analytical grade and used as received.
5.1.2 SYNTHESIS OF CHITIN co-(ACETATE/SUCCINATE) (CAS)
COPOLYMERS
Chitin Chitin co-(acetate/succinate) copolymer
Fig. 5.1 Scheme for the synthesis of Chitin co-(acetate/succinate) copolymers
A variety of CAS copolymers were synthesized by reacting chitin with the
mixture of acetic anhydride (AA) and SA used in different proportions (Fig. 5.1). The
reaction was carried out under heterogeneous conditions by using perchloric acid as a
Page 2
catalyst. The mixture of AA and SA was used in excess (5 times) in each reaction for
the completion of esterification reaction. Reagents were used in the following
proportion: chitin/(AA+SA)/perchloric acid = 1/5/1 (mol/mol). Initially, the acylation
mixture was prepared by mixing the calculated quantity of perchloric acid at -10 °C
with the mixture of AA and SA used in the ratio as specified in the Table 5.1. The
fresh acylation mixture was slowly added to the conical flask containing chitin
powder placed in the freezing mixture and transferred to an electronic flask shaker for
about 30 minutes. The temperature was maintained at about 0 °C during this period
and then the reaction was allowed to continue further for 3 hours at room temperature
with shaking. The raw products were washed to remove the excess of the reagents and
dried. For the preparation of chitin disuccinate (CDS) and chitin diacetate (DAC),
only SA and AA were used in the acylation mixture, respectively.
Table 5.1 Ratio of reagents in the reaction mixture
Sr. No. Chitin AA SA Symbol
1. 1.0 0 5.0 CDS
2. 1.0 0.5 4.5 AA10/SA90
3. 1.0 1.0 4.0 AA20/SA80
4. 1.0 1.5 3.5 AA30/SA70
5. 1.0 2.0 3.0 AA40/SA60
6. 1.0 2.5 2.5 AA50/SA50
7. 1.0 3.0 2.0 AA60/SA40
8. 1.0 3.5 1.5 AA70/SA30
9. 1.0 4.0 1.0 AA80/SA20
10. 1.0 4.5 0.5 AA90/SA10
11. 1.0 5.0 0 DAC
5.1.3 CHARACTERIZATION OF THE SYNTHESIZED PRODUCTS
IR spectra of chitin and the synthesized products were recorded using KBr
method on Fourier Transform Infrared Spectrophotometer (IRAffinity-1, Shimadzu
Corporation, Japan). Chemical structures of the synthesized products were also
confirmed by using 1H-NMR spectroscopy.
1H-NMR spectra of the obtained products
were recorded on Brucker Ascend 400 spectrometer using DMSO-d6 as solvent and
TMS as reference.
Page 3
The calculation of degree of substitution by succinyl and acetyl groups (DSSc
and DSAc) was based on 1H-NMR spectroscopy by using the following formula,
respectively:
DSSc =
DSAc =
where IβCH2 is the integral intensity of the signal of methylene protons of succinyl
residues with the maximum at 2.42 ppm, IαCH3 is the integral intensity of the signal of
methyl protons of acetyl residues in the range of 2.47-2.52 ppm and IH2–H6 is the
integral intensity of the signals of H2–H6 protons of glucosoamide residues in the
range 3.02-4.62 ppm [Draczynski, 2011].
5.1.4 SOLUBILITY STUDIES
Solubility of the synthesized compounds was evaluated in a variety of solvents
such as methanol, ethanol, acetone, dimethylformamide (DMF), dimethyl sulfoxide
(DMSO), etc., by shake flask method. Excess quantity of the synthesized compounds
was added to 100 ml flask and shaken with the corresponding solvent on a mechanical
shaker for 24 hours. After 24 hours, the contents of the flask was filtered and analyzed
to assess the solubility.
5.1.5 FILM FORMATION STUDIES
5.1.5.1 Film Casting
The synthesized compounds (except CDS and DAC) were dissolved at a
concentration of 4% w/v in a mixture of IPA and DCM (2:3). DAC and CDS were
dissolved in formic acid at a concentration of 4% w/v as they were insoluble in IPA
and DCM. The resulting solutions were then filtered to remove any undissolved
material and 1.0% or 0.5% glycerine was added to the filtrate as a plasticizer. The
solution so obtained was used for film casting. The films were cast by solvent
evaporation method, where 10 ml of the above solutions were poured in glass Petri
dishes (diameter-9.5 cm) and stand undisturbed at room temperature. After 24 hours,
the films so cast were peeled off form the glass surface and stored in a desiccator.
Film of HPMC (15 cps) was also cast by dissolving in IPA and DCM (2:3) at a
concentration of 4% w/v and then following the same procedure.
Page 4
5.1.5.2 Mechanical Properties Study
Mechanical properties of the formulated films were examined using the
Texture Analyzer (TA.XT plus, Stable Micro Systems Ltd., UK). The films were cut
into specific dimensions (20.0 mm x 50.0 mm). The distance between the two jaws of
the texture analyzer was set to be 20.0 mm and the film samples were mounted
between them so that the effective film length was 20.0 mm. Both tensile strength and
extensibility were measured. For the study, the pre-test speed, test speed and post-test
speed were 0.20 mm/sec, 0.50 mm/sec and 0.60 mm/sec, respectively. The trigger
force was set to be 3.0 g [Bodmeier & Paeratakul, 1994; Laxmeshwar et al., 2012].
5.1.6 EVALUATION OF CHITIN co-(ACETATE/SUCCINATE)
COPOLYMERS AS FILM FORMERS FOR TABLET COATING
5.1.6.1 Coating of Tablets
The CAS copolymers were dissolved in a mixture of IPA and DCM (2:3) at a
concentration of 4% w/v. The resulting solutions were then filtered to remove any
undissolved material followed by addition of 0.5% glycerine (plastisizer) to the
filtrate. The solution so obtained was used for film coating of the marketed tablets of
metformin hydrochloride (Okamet-500, Cipla Ltd., India) by dip coating method. The
tablets were dipped into the above solution and dried at room temperature. After
drying of the tablets, they were again dipped into the above solution and dried at room
temperature. This process was repeated three times so that proper film formation can
take place. Similarly, HPMC (15 cps) coating was done on these marketed tablets.
5.1.6.2 Evaluation of Coated Tablets
5.1.6.2.1 Uniformity of weight
Randomly selected twenty tablets were weighed and average weight was
calculated. Then weight of each tablet was noted [I.P., 2007].
5.1.6.2.2 Hardness
Hardness of ten tablets was determined using Monsanto hardness tester (Perfit,
Ambala) [Lachman et al., 1987].
5.1.6.2.3 Friability
Friability of the coated and uncoated tablets was determined using Roche
friabilator. Twenty preweighed tablets were taken from each batch and placed in the
drum of friabilator (Campbell Electronics, Mumbai). The tablets were subjected to
Page 5
100 revolutions at 25 rpm. The tablets were then de-dusted and reweighed [Lachman
et al., 1987].
5.1.6.2.4 Disintegration time
Disintegration time of the coated and uncoated tablets was determined using
six tablets of each batch at 37±2 °C in distilled water using Disintegration Test
Apparatus (Campbell Electronics, Mumbai). The tablets were placed into the tubes of
the Disintegration Test Apparatus and the time taken for complete disintegration (no
hard core of the tablet should remain on sieve) was noted using a stop watch [I.P.,
2007].
5.1.6.2.5 Dissolution
Dissolution test for the coated and uncoated tablets was carried out using
900 ml of distilled water as the dissolution media and rotating the paddle at 50 rpm at
37±0.5 °C (USP type Dissolution Apparatus, Electrolab TDT-08L). An aliquot of
10 ml was withdrawn at intervals of 5, 10, 15, 30 and 45 minutes and filtered using
Whatman filter paper. After appropriate dilution with distilled water, the absorbance
was measured at 233 nm (Double Beam Spectrophotometer, Varian Cary-5000,
Netherland). The content of metformin hydrochloride, C4H11N5,HCl was calculated
by using the standard curve.
5.1.6.2.6 Assay
Ten tablets were weighed and powdered. A quantity of the powder equivalent
to 0.1 g of MFH was weighed accurately and to this 70 ml distilled water was added.
It was shaken for 15 min and diluted to 100.0 ml with distilled water. The solution
was mixed, filtered and 10.0 ml of the filtrate was diluted to 100.0 ml with distilled
water. 10.0 ml of this solution was diluted further to 100.0 ml with distilled water and
the absorbance of the resulting solution was measured at 233 nm with distilled water
as blank (Double Beam Spectrophotometer, Varian Cary-5000, Netherland). The
content of metformin hydrochloride, C4H11N5,HCl was calculated by using the
standard curve.
5.1.7 EVALUATION OF CHITIN co-(ACETATE/SUCCINATE)
COPOLYMERS AS MATRIX FORMING AGENT FOR SUSTAINED
RELEASE TABLETS
The synthesized CAS copolymers were evaluated as matrix forming agent in
tablet formulation by selecting MFH as a model drug.
Page 6
5.1.7.1 Preparation of Matrix Tablets of Metformin Hydrochloride
The release retardant efficiency of synthesized CAS copolymers was
evaluated by preparing the matrix tablets of MFH at a drug polymer ratio of 1:1 as per
the formula given in Table 5.2 and comparing with the marketed sustained release
tablet of MFH (Glycomet 500 SR, USV Limited, India). The weighed amount of
MFH was blended with corresponding CAS copolymer and magnesium stearate (1%
w/w) and the blend so obtained was directly compressed using IR hydraulic pellet
press (Type-KP, Kimaya Engineers, Thane, India) at a pressure of 75 Kg/cm2.
Table 5.2 Composition of sustained release tablets of metformin hydrochloride
Formulation Code F1 F2 F3 F4 F5 F6 F7 F8 F9
Metformin Hydrochloride
(mg) 100 100 100 100 100 100 100 100 100
AA10/SA90 (mg) 100 - - - - - - - -
AA20/SA80 (mg) - 100 - - - - - - -
AA30/SA70 (mg) - - 100 - - - - - -
AA40/SA60 (mg) - - - 100 - - - - -
AA50/SA50 (mg) - - - - 100 - - - -
AA60/SA40 (mg) - - - - - 100 - - -
AA70/SA30 (mg) - - - - - - 100 - -
AA80/SA20 (mg) - - - - - - - 100 -
AA90/SA10 (mg) - - - - - - - - 100
Magnesium Stearate (mg) 2 2 2 2 2 2 2 2 2
5.1.7.2 Study of Drug Polymer Interactions
The interactions between metformin hydrochloide and the synthesized CAS
copolymers in the compressed tablets were studied using the IR spectroscopy, which
is an effective and widely used technique for the study of compatibility between drug
and the excipients used to formulate a dosage form. IR spectra of metformin
hydrochloride, CAS copolymers and different batches of compressed tablets (F1, F2,
F3, F4, F5, F6, F7, F8 and F9) were recorded using KBr method on Fourier
Transform Infrared Spectrophotometer (IRAffinity-1, Shimadzu Corporation, Japan)
in the range of 4000-400 cm-1
.
Page 7
5.1.7.3 Evaluation of Matrix Tablets of Metformin Hydrochloride
5.1.7.3.1 Thickness and diameter
Thickness and diameter of the compressed tablets were measured using digital
Vernier Caliper (Aerospace, China) [Lachman et al., 1987].
5.1.7.3.2 Uniformity of weight
Twenty tablets were selected at random, weighed and average weight was
calculated. Then weight of each tablet was noted [I.P., 2007].
5.1.7.3.3 Hardness
Hardness of ten tablets was determined using Monsanto hardness tester (Perfit,
Ambala) [Lachman et al., 1987].
5.1.7.3.4 Friability
Friability of the compressed tablets was determined using Roche friabilator.
Twenty preweighed tablets were taken from each batch and placed in the drum of
friabilator (Campbell Electronics, Mumbai). The tablets were subjected to 100
revolutions at 25 rpm. The tablets were then de-dusted and reweighed [Lachman et
al., 1987].
5.1.7.3.5 Dissolution
Dissolution test for the prepared tablets and marketed tablet (Glycomet 500
SR) was carried out using 900 ml of distilled water as the medium and rotating the
paddle at 50 rpm at 37±0.5 °C (USP type Dissolution Apparatus, Electrolab TDT-
08L). An aliquot of 10 ml was withdrawn at intervals of 0.25, 0.5, 1, 1.5, 2, 3, 4, 5, 6,
7, 8, 10 and 12 hours and filtered using Whatman filter paper. After appropriate
dilution with distilled water, the absorbance was measured at 233 nm (Double Beam
Spectrophotometer, Varian Cary-5000, Netherland). The content of metformin
hydrochloride, C4H11N5,HCl was calculated by using the standard curve.
5.1.7.3.6 Assay
Ten tablets were weighed and powdered. A quantity of the powder equivalent
to 0.1 g of MFH was weighed accurately and to this 70 ml distilled water was added.
It was shaken for 15 min and diluted to 100.0 ml with distilled water. The solution
was mixed, filtered and 10.0 ml of the filtrate was diluted to 100.0 ml with distilled
water. 10.0 ml of this solution was diluted further to 100.0 ml with distilled water and
the absorbance of the resulting solution was measured at 233 nm (Double Beam
Spectrophotometer, Varian Cary-5000, Netherland). The content of metformin
hydrochloride, C4H11N5,HCl was calculated by using the standard curve.
Page 8
5.1.8 FORMULATION OF MICROSPHERES USING SYNTHESIZED
CHITIN co-(ACETATE/SUCCINATE) COPOLYMERS
The potential of the synthesized CAS copolymers for the formulation of
microspheres was also evaluated. Various batches of microspheres of the selected
model drug (MFH) were prepared using the synthesized CAS copolymers.
5.1.8.1 Preparation of Microspheres of Metformin Hydrochloride
MFH microspheres were prepared by emulsion solvent evaporation method
employing the synthesized CAS copolymers as polymer and Span 80 as the surfactant
in accordance to the formula given in Table 5.3.
Table 5.3 Composition of metformin hydrochloride microspheres
Formulation Code M1 M2 M3 M4 M5 M6 M7 M8 M9
Metformin
Hydrochloride (mg) 500 500 500 500 500 500 500 500 500
AA10/SA90 (mg) 1000 - - - - - - - -
AA20/SA80 (mg) - 1000 - - - - - - -
AA30/SA70 (mg) - - 1000 - - - - - -
AA40/SA60 (mg) - - - 1000 - - - - -
AA50/SA50 (mg) - - - - 1000 - - - -
AA60/SA40 (mg) - - - - - 1000 - - -
AA70/SA30 (mg) - - - - - - 1000 - -
AA80/SA20 (mg) - - - - - - - 1000 -
AA90/SA10 (mg) - - - - - - - - 1000
Magnesium
Stearate (mg) 125 125 125 125 125 125 125 125 125
The microspheres were prepared at a drug polymer ratio of 1:2. The
corresponding CAS copolymer (1000 mg) was added to ethanol (60 ml). After
shaking for 15-20 minutes, it was filtered to remove any undissolved material. To the
filtrate, 500 mg of MFH was added and shaken to dissolve it. The mixture so obtained
was added dropwise using a syringe and needle (24G) to a beaker containing a
mixture of 200 ml light liquid paraffin, 2 ml Span 80 (1%) and 125 mg magnesium
Page 9
stearate while stirring at 1000 rpm. The stirring was continued for 2 hours and then
the temperature was raised to 50 °C. The stirring was further continued for 2 hours.
The formed microspheres were filtered, washed with n-hexane and dried in a
desiccator [Haznedar & Dortunc, 2004].
5.1.8.2 Study of Drug Polymer Interactions
The interactions between MFH and the synthesized CAS copolymers in the
prepared microspheres were studied using the IR spectroscopy. IR spectra of MFH,
CAS copolymers and different batches of microspheres (M1, M2, M3, M4, M5, M6,
M7, M8 and M9) were recorded using KBr method on Fourier Transform Infrared
Spectrophotometer (IRAffinity-1, Shimadzu Corporation, Japan) in the range of
4000-400 cm-1
.
5.1.8.3 Evaluation of Formulated Microspheres of Metformin Hydrochloride
5.1.8.3.1 Determination of percent yield
The percent yield of microspheres of various batches was calculated by using
the weight of the dried microspheres with respect to the initial total weight of the drug
and polymer used for the preparation of the microspheres by using the following
formula:
Weight of dried microspheres
Percent Yield = x 100
Total weight of drug and polymer
5.1.8.3.2 Determination of drug entrapment efficiency
Microspheres were crushed and powdered by using a glass mortar and pestle.
Accurately weighed 50 mg of this powder was extracted in 100 ml of distilled water
by shaking on a mechanical shaker for 24 hours. After 24 hours, the solution was
filtered and the drug content in the filtrate was found by UV spectrophotometry by
measuring the absorbance at 233 nm after suitable dilution with distilled water
(Double Beam Spectrophotometer, Varian Cary-5000, Netherland).
Practical drug content
Drug entrapment efficiency (%) = x 100
Theoretical drug content
Page 10
5.1.8.3.3 Particle size analysis
The particle size of the microspheres was measured by optical microscopy. A
sample of microspheres drawn at random was placed on a glass slide and their size
was measured using an optical microscope with the help of a calibrated ocular
micrometer. The mean diameter was calculated by measuring the size of
approximately 100 particles.
5.1.8.3.4 In vitro drug release study
The drug release from the prepared microspheres was studied using 900 ml of
distilled water as the medium and rotating the paddle at 100 rpm at 37±0.5 °C (USP
type Dissolution Apparatus, Electrolab TDT-08L). An aliquot of 10 ml was
withdrawn at intervals of 0.25, 0.5, 1, 1.5, 2, 3, 4, 5, 6, 7, 8, 10 and 12 hours and
filtered using Whatman filter paper. After appropriate dilution with distilled water, the
absorbance was measured at 233 nm (Double Beam Spectrophotometer, Varian Cary-
5000, Netherland). The content of metformin hydrochloride, C4H11N5,HCl was
calculated by using the standard curve.
5.2 RESULTS AND DISCUSSION
5.2.1 SYNTHESIS OF CHITIN co-(ACETATE/SUCCINATE) COPOLYMERS
For the synthesis of CAS copolymers, perchloric acid was used as a catalyst of
the reaction being a very effective catalyst of esterification reaction of chitin
[Szosland, 1996] and this has also been observed in the present investigation (up to
90%). The esterification reaction was performed under heterogeneous conditions.
Temperature of the reaction plays great role in the degradation of chitin as
deacetylation of the acetamide group of chitin starts at higher temp. So, initially the
temperature was kept at about 0 °C to prevent the degradation of the chitin polymer
chain and later the temperature was maintained at room temperature till the
completion of the reaction.
5.2.2 CHARACTERIZATION OF THE SYNTHESIZED PRODUCTS
Analysis of chitin, CDS, DAC and other products of esterification was carried
out using 1H-NMR and FTIR spectroscopy. The obtained IR spectra of chitin, CDS
and DAC are presented in the Fig. 5.2.
Page 11
Fig. 5.2 IR spectra of chitin (A), CDS (B) and DAC (C)
The IR spectra of chitin is characterized by the intense broad band in the
region 3500-3250 cm-1
due to O-H stretching. The characteristic band of the amide
group present as acetamide moiety in the structure of chitin i.e. amide I band (C=O
stretching) is present at 1653 cm-1
and amide II band (N-H bending) at 1552 cm-1
. The
band due to N-H stretching of amide group is observed at 3267 cm-1
and C-H
stretching at 2881 cm-1
. The band of C-O-C stretching in the glucopyranose ring is
present at 1029 cm-1
and the specific bands of the β(1→4) glycosidic bridge at 1155,
897 cm-1
. In the IR spectra of CDS, no peak is observed at about 3450 cm-1
showing
that the –OH groups of chitin are now replaced with the ester groups. The new peaks
at 1747 cm-1
due to C=O stretching and at 1201 cm-1
due to C-O-C stretching of the
newly formed ester groups are present and there is seen absorption at 2885 cm-1
due
to the aliphatic C-H stretching. The O-H stretching of the carboxylic acid functional
group present in the newly introduced succinate moiety is present as a broad band in
Page 12
the region 3110-2930 cm-1
and its C=O stretching band at 1713 cm-1
. The IR spectra
of DAC shows the characteristic C=O stretching at 1750 cm-1
and C-O-C stretching at
1262 cm-1
due to the presence of newly introduced acetate groups in place of the
hydroxyl groups and less intense absorption in the 2950-2800 cm-1
region due to C-H
stretching as compared to CDS due to lesser content of aliphatic alkyl groups.
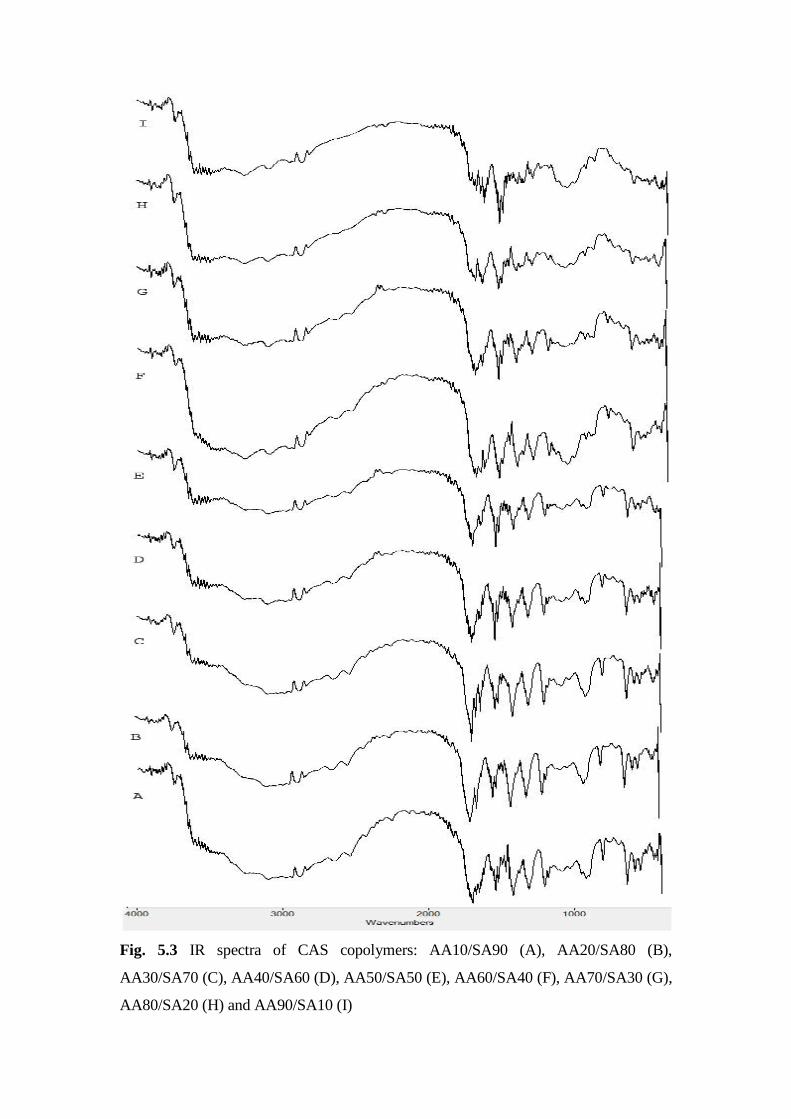
The IR spectra of other CAS copolymers recorded in the range of
4000-400 cm-1
are presented in Fig. 5.3. In all the spectra, there is almost no
absorption present at about 3450 cm-1
, while the C=O stretching at 1743 cm-1
, C-O-C
stretching at 1201 cm-1
of the newly introduced ester groups shows the substitution of
the hydroxyl group. The intensity of the peak at 2879 cm-1
of aliphatic C-H stretching
decreases with the decrease in the succinyl content in the formed product. The O-H
stretching of the carboxylic acid functional group present in the newly introduced
succinate moiety is present as a broad band in the region 3110-2935 cm-1
and its C=O
stretching band at 1714 cm-1
. In all the spectra of the CAS copolymers, CDS and
DAC, the bands corresponding to the amide group at 1653, 1552 cm-1
, C-O-C
stretching of glucopyranose ring at 1029 cm-1
and the specific bands of the β(1→4)
glycosidic bridge at 1155, 897 cm-1
remains unchanged showing that the basic
structure of chitin polymer chain is preserved under the applied reaction conditions
and also no change is occurring in the degree of acetylation of chitin.
In the 1H-NMR spectrum of chitin, the signals of methyl protons of acetamide
moiety at 2.3 ppm, overlapped signals of H2-H6 protons of polysaccharide chain in
the range of 3.2-4.1 ppm and the signal of H1 proton at 4.5 ppm are reported in the
literature [Draczynski, 2011]. Fig. 5.4 shows the 1H-NMR spectrum of one of the
synthesized CAS copolymer (AA30/SA70). The signals of the protons belonging to
the polysaccharide residues are present in the range of 3.02-5.19 ppm. The signal of
protons of β-CH2 of the newly introduced succinyl residue appears at 2.42 ppm. The
signals of the protons of α-CH2 of succinyl residue and α-CH3 of newly introduced
acetyl residue overlap with each other in the range of 2.47-2.52 ppm. The methyl
protons of the acetamide group of the chitin backbone are present at 2.23-2.28 ppm.
The signals corresponding to the protons of the glucopyranose ring of chitin are
present at the following positions: H2 at 3.02-3.16 ppm, H3 at 4.41-4.45 ppm, H4 at
4.55-4.62 ppm, H5 at 4.22 ppm, H6 at 4.02 ppm and H1 at 5.14-5.19 ppm. The –NH
proton of the acetamide moiety of chitin is present with the maximum at 8.06 ppm,
while the proton of the –COOH group of the succinate residue appear at 12.15 ppm.
Page 13
Fig. 5.3 IR spectra of CAS copolymers: AA10/SA90 (A), AA20/SA80 (B),
AA30/SA70 (C), AA40/SA60 (D), AA50/SA50 (E), AA60/SA40 (F), AA70/SA30 (G),
AA80/SA20 (H) and AA90/SA10 (I)
Page 14
Fig. 5.4 1H-NMR spectrum of CAS copolymer (AA30/SA70)
The presence of the signals corresponding to the ring protons of the
glucopyranose ring, signals of –NH proton and methyl protons of acetamide group of
the chitin polymer backbone is in confirmation with the results of the IR spectroscopy
revealing that the basic structure of the chitin is preserved under the employed
conditions of the reaction. The presence of the signals for the acetyl and succinyl
groups confirms the substitution of the hydroxyl group of the chitin chain. From the
integration of the signals corresponding to the β-CH2 of the succinyl residue, α-CH3
of the acetyl residue and H2-H6 of the glucopyranose ring in the range of 3.02-4.62
ppm, the DSSc and DSAc were calculated. 1H-NMR spectrum of other synthesized
CAS copolymers was recorded as before and based on these spectra, the determined
values of the DSSc and DSAc and their corresponding theoretical values are presented
in the Table 5.4.
Results of the 1H-NMR analysis reveals that under the applied reaction
conditions, the esterification of chitin proceeds to completion in the presence of
Page 15
perchloric acid as a catalyst with the substitution of the hydroxyl groups by ester
groups and the final products i.e. CDS, DAC and other CAS copolymers were
obtained in good yield with total DS about 2. The slight variation in the value of total
DS may be due to the experimental errors. The content of acetyl groups in the
synthesized CAS copolymers was higher than the theoretical values based on the
composition of acylation mixture, which shows higher reactivity of acetic anhydride
in comparison to succinic anhydride and our results also confirms the already
published data [Luyen & Rossbach, 1995; Maim et al., 1957]. The results of 1H-NMR
spectroscopy confirm the changes in the chemical structure of chitin produced by the
reaction and these are also in accordance with the results of the IR spectroscopy.
Table 5.4 Degree of substitution by succinyl and acetyl groups on chitin polymer chain
Sr.
No.
Symbol of
CAS
copolymer
DSd based on 1H-NMR spectroscopy Theoretical DS
DSAc DSSc Total DS DSAc DSSc
1. CDS 0 2.00 2.00 0 2.00
2. AA10/SA90 0.22 1.76 1.98 0.20 1.80
3. AA20/SA80 0.46 1.53 1.99 0.40 1.60
4. AA30/SA70 0.70 1.30 2.00 0.60 1.40
5. AA40/SA60 1.06 0.93 1.99 0.80 1.20
6. AA50/SA50 1.34 0.64 1.98 1.00 1.00
7. AA60/SA40 1.43 0.55 1.98 1.20 0.80
8. AA70/SA30 1.55 0.44 1.99 1.40 0.60
9. AA80/SA20 1.74 0.25 1.99 1.60 0.40
10. AA90/SA10 1.92 0.08 2.00 1.80 0.20
11. DAC 1.99 0 1.99 2.00 0
5.2.3 SOLUBILITY STUDIES
DAC was found to be soluble only in acidic solvents such as formic acid and
methanesulfonic acid, which is in accordance with the already published data [Luyen
& Rossbach, 1995; Nishi et al., 1979]. In addition to the above solvents, CAS
copolymers were found to be soluble in DMF and DMSO while they were less soluble
in methanol, ethanol and acetone.
Page 16
5.2.4 FILM FORMATION STUDIES
5.2.4.1 Film Casting
Firstly, the casting of film of the synthesized compounds was tried without the
addition of the plasticizer. The formed films were brittle in nature and it was not
possible to peel off them from the glass surface without breakage. So, glycerine was
used as a plasticizer at a concentration of 1.0%. Now the formed films were tacky, so
again they were not peelable (break during detachment). Then, glycerine was added at
a concentration of 0.5%, which gives good results. The formed films were not brittle
and can be peeled off easily for further studies. Film of HPMC was cast for the
purpose of comparison as they are widely used as film formers in tablet coating.
5.2.4.2 Mechanical Properties Study
Mechanical properties of the cast films were evaluated and compared with
HPMC by using texture analyzer by mounting the films of the specific dimensions.
The tensile strength, extensibility and percent elongation of the films cast from CAS
copolymers and HPMC are shown in Table 5.5 and the tensile strength curves are
shown in Fig. 5.5.
Table 5.5 Tensile strength, extensibility and percent elongation of the cast films
Sr. No. Formulation Tensile Strength
(Newton)
Extensibility
(mm)
Elongation
(%)
1. CDS 14.020 20.774 3.87
2. AA10/SA90 14.782 21.272 6.36
3. AA20/SA80 6.992 22.319 11.60
4. AA30/SA70 10.858 20.972 4.86
5. AA40/SA60 3.092 23.636 18.18
6. AA50/SA50 3.035 23.778 18.89
7. AA60/SA40 9.240 22.780 13.90
8. AA70/SA30 9.603 24.326 21.63
9. AA80/SA20 12.277 24.563 22.82
10. AA90/SA10 9.215 23.292 16.46
11. DAC 5.835 23.279 16.40
12. HPMC 40.118 20.822 4.11
Page 17
A
B
C
D
E
F
G
H
I
J
K
L
Fig. 5.5 Tensile strength curves of films cast from CDS (A), AA10/SA90 (B),
AA20/SA80 (C), AA30/SA70 (D), AA40/SA60 (E), AA50/SA50 (F), AA60/SA40
(G), AA70/SA30 (H), AA80/SA20 (I), AA90/SA10 (J), DAC (K) and HPMC (L)
20.00 20.25 20.50 20.75 21.00 21.25 21.50 21.75
1.5
1.4
1.3
1.2
1.1
1.0
0.9
0.8
0.7
0.6
0.5
0.4
0.3
0.2
0.1
0.0
-0.1
Force (kg)
Distance (mm)
1F1D
S1
20.0 20.5 21.0 21.5 22.0 22.5
1.6
1.4
1.2
1.0
0.8
0.6
0.4
0.2
0.0
-0.2
Force (kg)
Distance (mm)
1F1D
H2
20 21 22 23 24 25
0.75
0.70
0.65
0.60
0.55
0.50
0.45
0.40
0.35
0.30
0.25
0.20
0.15
0.10
0.05
0.00
-0.05
Force (kg)
Distance (mm)
1F1D
PH2
20.0 20.5 21.0 21.5 22.0 22.5 23.0
1.2
1.1
1.0
0.9
0.8
0.7
0.6
0.5
0.4
0.3
0.2
0.1
0.0
-0.1
Force (kg)
Distance (mm)
1F1D
S 4
20 21 22 23 24 25 26
0.325
0.300
0.275
0.250
0.225
0.200
0.175
0.150
0.125
0.100
0.075
0.050
0.025
0.000
-0.025
Force (kg)
Distance (mm)
1F1D
S 5
20 21 22 23 24 25 26
0.325
0.300
0.275
0.250
0.225
0.200
0.175
0.150
0.125
0.100
0.075
0.050
0.025
0.000
-0.025
Force (kg)
Distance (mm)
1F1D
S 6
20 21 22 23 24 25
1.0
0.9
0.8
0.7
0.6
0.5
0.4
0.3
0.2
0.1
0.0
-0.1
Force (kg)
Distance (mm)
1F1D
S 7
20 21 22 23 24 25 26
1.0
0.9
0.8
0.7
0.6
0.5
0.4
0.3
0.2
0.1
0.0
-0.1
Force (kg)
Distance (mm)
1F1D
S 8
20 21 22 23 24 25 26 27
1.3
1.2
1.1
1.0
0.9
0.8
0.7
0.6
0.5
0.4
0.3
0.2
0.1
0.0
-0.1
Force (kg)
Distance (mm)
1F1D
S 9
20 21 22 23 24 25 26 27
1.0
0.9
0.8
0.7
0.6
0.5
0.4
0.3
0.2
0.1
0.0
-0.1
Force (kg)
Distance (mm)
1F1D
S 10
20 21 22 23 24 25
0.60
0.55
0.50
0.45
0.40
0.35
0.30
0.25
0.20
0.15
0.10
0.05
0.00
-0.05
Force (kg)
Distance (mm)
1F1D
H24
20.0 20.2 20.4 20.6 20.8 21.0
4.5
4.0
3.5
3.0
2.5
2.0
1.5
1.0
0.5
0.0
-0.5
Force (kg)
Distance (mm)
1F1D
PH9
Page 18
As shown in Table 5.5, the maximum tensile strength was shown by the films
cast from AA10/SA90, in which the ratio of acetyl and succinyl residues was found to
be 1:8. Higher tensile strength indicates more resistance of the film to breakdown.
However, the maximum percent elongation is shown by the films cast from
AA80/SA20, in which the ratio of acetyl and succinyl residues was found to be 7:1. A
decrease in the value of tensile strength is observed in the series with the increase in
the acetyl content in the synthesized copolymers upto AA50/SA50, after which the
tensile strength starts increasing in the series. This trend is opposite to the one shown
by the films cast using CAPC copolymers. In case of CAPC copolymers, before
AA40/PA60 in the series, there was an increase in the value of tensile strength with an
increase in the content of acetyl residue in the polymer chain, while a decrease in the
value of tensile strength was seen with the increase in the content of acetyl residue
after AA40/PA60 in the series. The tensile strength of the films of all the synthesized
compounds is much less than HPMC film and the maximum tensile strength observed
for the film cast from AA10/SA90 is about 37% of HPMC film. Least percentage
elongation is observed in case of CDS film, while it is highest in case of AA80/SA20
film.
5.2.5 EVALUATION OF CHITIN co-(ACETATE/SUCCINATE)
COPOLYMERS AS FILM FORMERS FOR TABLET COATING
The film formation ability of the synthesized CAS copolymers has been
demonstrated in the previous section, therefore they were evaluated as film formers
for tablet coating. MFH was selected as a model drug. Marketed uncoated tablets of
MFH was used for the study and 0.5% glycerine was used as plasticizer as without the
addition of the plasticizer the formed film was brittle in nature. Three coats of film
former was given so that proper film formation takes place. The coated and uncoated
tablets are shown in Fig. 5.6.
5.2.5.1 Evaluation of Coated Tablets
Table 5.6 shows the results of physical characterization of the coated and
uncoated tablets of MFH. The tablets were found to have uniform physical
appearance, average weight and drug content. The tablets possessed adequate
hardness and passed the friability test.
Page 19
A
B
C
D
E
F
G
H
I
J
K
Fig. 5.6 Okamet-500 tablets coated with AA10/SA90 (A), AA20/SA80 (B),
AA30/SA70 (C), AA40/SA60 (D), AA50/SA50 (E), AA60/SA40 (F), AA70/SA30 (G),
AA80/SA20 (H), AA90/SA10 (I), HPMC (J) and Uncoated tablets (K)
Page 20
Table 5.6 Physical characteristics of coated and uncoated tablets
Coated
Tablet
Weight
(mg)
Hardness
(Kg)
Friability
(%)
Disintegration
Time (min)
Assay
(% MFH)
AA10/SA90 530.2 ± 13.4 8.0 ± 1.0 0.45 12.4 ± 0.6 99.92
AA20/SA80 531.5 ± 12.7 11.5 ± 0.5 0.23 16.7 ± 0.8 100.08
AA30/SA70 532.5 ± 5.3 10.0 ± 0.5 0.31 14.2 ± 0.5 99.54
AA40/SA60 526.4 ± 7.7 12.8 ± 0.6 0.18 17.2 ± 1.1 99.82
AA50/SA50 531.7 ± 4.5 12.5 ± 0.7 0.26 11.8 ± 0.4 100.85
AA60/SA40 531.2 ± 3.0 12.0 ± 0.5 0.34 18.8 ± 0.6 100.23
AA70/SA30 533.4 ± 5.5 11.5 ± 1.5 0.41 21.3 ± 0.5 99.36
AA80/SA20 525.1 ± 9.1 11.5 ± 0.6 0.28 28.5 ± 0.5 98.99
AA90/SA10 527.8 ± 4.2 10.8 ± 1.4 0.32 32.2 ± 0.6 101.14
HPMC 537.5 ± 7.1 12.3 ± 1.1 0.29 7.5 ± 0.5 100.38
Uncoated 522.1 ± 10.6 10.5 ± 0.8 0.84 5.5 ± 0.5 102.43
All the batches of tablets passed the disintegration test as per pharmacopoeial
requirement except AA90/SA10 coated tablets. The DT is also high in case of the
tablets coated with AA80/SA20, but it is within the pharmacopoeial limit. The more
DT observed in these two cases may be due to negligible water solubility of these
coating agents. The DT of the tablets coated with AA50/SA50 was found to be lowest
in the series. However, the DT of all the batches of tablets coated with the synthesized
CAS copolymers was higher than the HPMC coated tablets. Usually, it is observed
that the tablets having low DT are more friable and possess less crushing strength.
However, in our case, no such correlation was observed.
Fig. 5.7 shows the comparative cumulative release profile of MFH from
various batches of coated and uncoated MFH tablets. The drug release from the
coated tablets was less as compared to the uncoated tablets in the start of dissolution
because the presence of film on the coated tablets hinders the release of the drug.
After the dissolution of film in the dissolution media, there remains no barrier for the
dissolution of the drug which is evident by the fact that after 10-15 minutes, an abrupt
increase is seen in the release of the drug from the coated tablets. All the batches of
tablets released almost 100% of drug within 45 minutes. As per pharmacopoeial
requirement, 70% of MFH must dissolve in 45 minutes [I.P., 2007]. Since all the
Page 21
batches of tablets showed more than 70% dissolution within 45 minutes, the tablets
passed the dissolution test requirement of the pharmacopoeia. Thus, the results of the
present study indicate the synthesized CAS copolymers, except AA90/SA10, as
promising film formers for tablet coating.
Fig. 5.7 Cumulative release profile of various batches of coated and uncoated
metformin hydrochloride tablets
5.2.6 EVALUATION OF CHITIN co-(ACETATE/SUCCINATE)
COPOLYMERS AS MATRIX FORMING AGENT FOR SUSTAINED
RELEASE TABLETS
The synthesized CAS copolymers were evaluated as matrix forming agent in
sustained release tablets by selecting MFH as a model drug. Various batches of
directly compressed MFH tablets at a drug polymer ratio of 1:1 were prepared and
compared with marketed sustained release tablet of MFH (Glycomet 500 SR, USV
Limited, India). The compressed tablets are shown in Fig. 5.8.
5.2.6.1 Study of Drug Polymer Interactions
To study the interactions between MFH and the CAS copolymers in the tablet
formulation, the IR spectra of MFH and different batches of compressed tablets (F1,
F2, F3, F4, F5, F6, F7, F8 and F9) were recorded which are shown in Fig. 5.9.
0
20
40
60
80
100
120
0 5 10 15 20 25 30 35 40 45 50
Time (min)
Cu
mu
lati
ve %
dru
g r
ele
ase
AA10/SA90 AA20/SA80 AA30/SA70 AA40/SA60 AA50/SA50 AA60/SA40
AA70/SA30 AA80/SA20 AA90/SA10 HPMC Uncoated
Page 22
F1
F2
F3
F4
F5
F6
F7
F8
F9
Fig. 5.8 Compressed tablets of metformin hydrochloride
IR spectrum of MFH is characterized by the presence of N-H stretching
vibrations of amine group at 3369 and 3296 cm-1
and the N-H bending vibration at
1558 cm-1
. C-N stretching vibrations are observed at 1064 cm-1
, while C-H stretching
vibrations due to the presence of methyl group at 2814 cm-1
. The band due to the
presence of C=N is seen at 1622 cm-1
. In the spectra of various batches of compressed
tablets (F1, F2, F3, F4, F5, F6, F7, F8 and F9), all the above specific bands of MFH
are present at their respective positions indicating that no interaction occurs between
MFH and CAS copolymers present in various batches of the compressed tablets.
Page 23
Fig. 5.9 IR spectra of metformin hydrochloride (A) and different batches of compressed
tablets F1 (B), F2 (C), F3 (D), F4 (E), F5 (F), F6 (G), F7 (H), F8 (I) and F9 (J)
Page 24
Moreover, the bands of the synthesized CAS copolymers in the IR spectra of
compressed tablets are also seen at their respective positions. The C=O stretching at
1743 cm-1
and C-O-C stretching at 1201 cm-1
due to the presence of the ester groups
in the CAS copolymers are present in all the IR spectra of the prepared tablets. The
O-H stretching of carboxylic acid functional group present in the succinate moiety as
a broad band in the region 3110-2935 cm-1
and its C=O stretching band at 1714 cm-1
are present in all the spectra of the prepared tablets. Also, in all the spectra of the
prepared tablets, the bands of amide group at 1653, 1552 cm-1
, C-O-C stretching of
glucopyranose ring at 1029 cm-1
and the specific bands of the β(1→4) glycosidic
bridge at 1155, 897 cm-1
remains unaffected showing that no interaction has taken
place between MFH and the CAS copolymers in the tablet formulation. Thus, on the
basis of IR spectroscopy, it can be concluded that no interaction is taking place
between MFH and CAS copolymers in all the batches of the compressed tablets.
5.2.6.2 Evaluation of Matrix Tablets of Metformin Hydrochloride
Table 5.7 shows the results of physical characterization of the compressed
tablets. The directly compressed MFH tablets were found to have uniform physical
appearance, average weight and drug content. The diameter of all the batches of
compressed tablets was found to be uniform (13.0 mm). The tablets possessed
adequate hardness and passed the friability test.
Table 5.7 Physical characteristics of compressed tablets of metformin hydrochloride
Batch Thickness
(mm)
Weight
(mg)
Hardness
(Kg)
Friability
(%)
Assay
(% MFH)
F1 1.30 ± 0.01 204.9 ± 2.1 4.0 ± 0.5 0.58 100.04
F2 1.33 ± 0.05 199.2 ± 5.4 4.0 ± 1.1 0.62 98.95
F3 1.30 ± 0.01 201.8 ± 5.6 5.0 ± 0.5 0.49 99.68
F4 1.30 ± 0.08 204.9 ± 2.7 4.5 ± 1.2 0.72 99.15
F5 1.36 ± 0.09 202.9 ± 0.5 4.5 ± 0.7 0.45 99.41
F6 1.40 ± 0.01 206.3 ± 3.1 5.5 ± 0.8 0.34 100.25
F7 1.40 ± 0.01 201.5 ± 0.2 4.0 ± 0.7 0.68 99.72
F8 1.35 ± 0.02 200.5 ± 2.3 6.0 ± 0.9 0.35 98.64
F9 1.36 ± 0.03 201.2 ± 2.2 5.5 ± 0.7 0.48 99.36
Page 25
Fig. 5.10 Cumulative drug release profile of various batches of compressed
metformin hydrochloride tablets and Glycomet 500 SR tablet
Comparative cumulative release profile of MFH from various batches of
formulated matrix tablets of MFH and the marketed tablet (Glycomet 500 SR) is
shown in Fig. 5.10. All the batches of tablets including the marketed formulation
released almost 100% of the drug. The formulations F1, F2 and F3 released more than
80% of the drug with in 1.5 hours; hence they can not be regarded as sustained release
formulations. The release of the drug from the formulations F4 and F5 is more than
80% with in 2 hours, so they are also not promising as a sustained release
formulation. In case of formulation F6, still the more than 80% drug release is with in
3 hour, while more than 80% drug release is with in 4 hours in case of the
formulations F7 and F8. The drug release curve of the formulation F9 containing
AA90/SA10 CAS copolymer is close to the drug release curve of the marketed tablet
formulation, with the difference that more than 80% drug release is with in 5 and 8
hours, respectively. Among the synthesized CAS copolymers, the tablets prepared
with AA90/SA10 showed highest sustained release of MFH, however, the sustained
release is not up to the mark. The sustained release of the drug observed in this case
may be due to the poor water solubility of this copolymer; hence it is resistant to the
release of the drug in the aqueous environment and is promising candidate for design
and development of sustained release formulations. Thus, the results of the present
0
20
40
60
80
100
120
0 2 4 6 8 10 12 14
Time (h)
Cu
mu
lati
ve %
dru
g r
ele
ase
F1 F2 F3 F4 F5 F6 F7 F8 F9 Glycomet 500 SR
Page 26
study indicate that the synthesized CAS copolymers have potential for the
development of sustained release formulations with the highest potential vesting in
AA90/SA10 CAS copolymer for tablet formulation of MFH.
5.2.7 FORMULATION OF MICROSPHERES USING SYNTHESIZED
CHITIN co-(ACETATE/SUCCINATE) COPOLYMERS
The synthesized CAS copolymers were used for the formulation of
microspheres by selecting MFH as a model drug. Various batches of MFH
microspheres were successfully prepared by emulsion solvent evaporation technique
at a drug polymer ratio of 1:2 using Span 80 as surfactant and magnesium stearate as
rigidizing agent. The temperature during the formation of microspheres was raised so
that the solvent can evaporate easily and completely.
5.2.7.1 Study of Drug Polymer Interactions
For the development of successful formulation, compatibility study of
excipients with the drug must be carried out. To study the interactions between MFH
and the CAS copolymers in the prepared microspheres formulation, the IR spectra of
MFH and different batches microspheres were recorded in the range of 4000-400 cm-1
which are shown in Fig. 5.11. The IR spectrum of MFH is characterized by the
presence of N-H stretching vibrations of amine group at 3369 and 3296 cm-1
and the
N-H bending vibration at 1558 cm-1
. C-N stretching vibrations are observed at
1064 cm-1
, while C-H stretching vibrations due to the presence of methyl group at
2814 cm-1
. The band due to the presence of C=N is seen at 1622 cm-1
.
In the spectra of various batches of prepared microspheres (M1, M2, M3, M4,
M5, M6, M7, M8 and M9), all the above specific bands of MFH are present at their
respective positions indicating that no interaction occurs between MFH and the
synthesized CAS copolymers present in various batches of the prepared microspheres.
Moreover, the bands of the synthesized CAS copolymers in the IR spectra of prepared
microspheres are also seen at their respective positions. The C=O stretching at
1743 cm-1
and C-O-C stretching at 1201 cm-1
due to the presence of the ester groups
in the CAS copolymers are present in all the IR spectra of the prepared microspheres.
The O-H stretching of the carboxylic acid functional group present in the succinate
moiety as a broad band in the region 3110-2935 cm-1
and its C=O stretching band at
1714 cm-1
are present in all the spectra of the prepared microspheres.
Page 27
Fig. 5.11 IR spectra of metformin hydrochloride (A) and different batches of the
prepared microspheres M1 (B), M2 (C), M3 (D), M4 (E), M5 (F), M6 (G), M7 (H),
M8 (I) and M9 (J)
Page 28
Also, in all the spectra of the prepared microspheres, the bands of amide group
at 1653, 1552 cm-1
, C-O-C stretching of glucopyranose ring at 1029 cm-1
and the
specific bands of the β(1→4) glycosidic bridge at 1155, 897 cm-1
remains unaffected
showing that no interaction has taken place between MFH and the CAS copolymers in
the microsphere formulation. Thus, on the basis of the IR spectroscopy, it can be
concluded that no interaction is taking place between MFH and the synthesized CAS
copolymers in all the batches of the prepared microspheres.
5.2.7.2 Evaluation of Formulated Microspheres of Metformin Hydrochloride
5.2.7.2.1 Determination of percent yield
The percent yield of the microspheres was calculated after thoroughly drying
which is presented in Table 5.8. In the prepared batches, the yield of microspheres
varied from 46.82-70.29% which is appreciable.
Table 5.8 Percent yield of the formulated metformin hydrochloride microspheres
Sr. No. Batch No. Yield (%)
1. M1 62.45
2. M2 53.78
3. M3 49.23
4. M4 58.47
5. M5 61.08
6. M6 70.29
7. M7 50.52
8. M8 46.82
9. M9 52.64
5.2.7.2.2 Determination of drug entrapment efficiency
Drug entrapment efficiency is a measure of the efficacy of the polymer for the
entrapment of the drug. The drug entrapment efficiency of various batches of the
formulated MFH microspheres is shown in Table 5.9. All the batches of the prepared
microspheres show drug entrapment efficiency more than 50%. Formulation M1
shows maximum entrapment efficiency, whereas the formulation M5 shows minimum
entrapment of the drug in the polymer.
Page 29
Table 5.9 Drug entrapment efficiency of various batches of the formulated metformin
hydrochloride microspheres
Sr. No. Batch No. Drug entrapment efficiency (%)
1. M1 63.44
2. M2 62.52
3. M3 58.49
4. M4 54.35
5. M5 50.17
6. M6 60.43
7. M7 52.78
8. M8 61.54
9. M9 50.48
5.2.7.2.3 Particle size analysis
The prepared microspheres were examined for the particle size using optical
microscopy and the average particle size is presented in Table 5.10.
Table 5.10 Average particle size of various batches of the formulated metformin
hydrochloride microspheres
Sr. No. Batch No. Average particle size (µm)
1. M1 98.32 ± 24.23
2. M2 61.87 ± 20.58
3. M3 88.26 ± 16.54
4. M4 96.48 ± 10.35
5. M5 70.55 ± 14.24
6. M6 58.21 ± 15.32
7. M7 78.96 ± 9.42
8. M8 65.19 ± 18.86
9. M9 96.74 ± 13.96
5.2.7.2.4 In vitro drug release study
The comparative cumulative release profile of MFH from various batches of
formulated microspheres is shown in Fig. 5.12. All the batches of prepared
Page 30
microspheres released more than 90% of drug with in 6 hours. The formulations M1,
M2 and M3 released more than 80% of the drug with in 1.5 hours; hence they can not
be regarded as sustained release formulations. The release of the drug from the
formulation M4 is more than 80% with in 2 hours, so it is also not promising as a
sustained release formulation. In case of formulation M5, M6 and M7, still more than
80% drug release is with in 3 hours, while the formulation M8 released more than
80% of the drug with in 4 hours. The highest sustained release of the drug is shown by
the microspheres of the batch M9 preapred using AA90/SA10 CAS copolymer which
released more than 80% of MFH with in 5 hours. The results of the dissolution study
shows that as the content of acetyl group in the synthesized CAS copolymers
increases, the drug release is also prolonged. Thus, the results of the present study
indicate that in all the batches of prepared microspheres although the drug release is
somewhat in a sustained manner, but maximum sustained release of MFH is observed
from the microspheres prepared using the synthesized AA90/SA10 CAS copolymer.
Fig. 5.12 Cumulative drug release profile of various batches of prepared metformin
hydrochloride microspheres
0
20
40
60
80
100
120
0 2 4 6 8 10 12 14
Time (h)
Cu
mu
lati
ve %
dru
g r
ele
ase
M1 M2 M3 M4 M5 M6 M7 M8 M9


![Succinate Dehydrogenase-a Comparative Review · Membrane-bound succinate dehydrogenase [SDH; E.C.1.3.99.1 succinate:(acceptor) oxido-reductase] is present in all aerobic cells. Ever](https://static.documents.pub/doc/80x56/5e54371d86904d694572eef0/succinate-dehydrogenase-a-comparative-review-membrane-bound-succinate-dehydrogenase.jpg)


