67
Chapter 5 Cost Allocation
| Date post: | 28-Dec-2015 |
| Category: |
Documents |
| Upload: | rodney-jackson |
| View: | 224 times |
| Download: | 2 times |

Chapter 5
Cost Allocation

IntroductionCost allocation is an inescapable problem
in nearly every organisation and in nearly every facet of accounting.
This chapter emphasises the allocation of costs to divisions, plants, departments, and contracts.
The chapter also addresses the allocation of costs to products and customers.

Learning Objectives1. Outline four purposes for allocating costs to cost objects2. Describe how a costing system can have multiple cost
objects3. Discuss key decisions faced when collecting costs in
indirect cost pools4. Describe how the single-rate cost-allocation method
differs from the dual-rate method5. Explain how the choice of budgeted versus actual
allocation rates changes the risks that managers face6. Distinguish among direct allocation, step-down and
reciprocal methods of allocating support department costs
7. Distinguish between the incremental and stand-alone cost-allocation methods
8. Criterias used to guide cost-allocation decisions

Learning Objective 1
Outline four purposes for allocating costs to cost objects

Learning Objective 1(continued) Purposes of Cost Allocation
Indirect costs are costs that are related to a particular cost object but cannot be traced to it in an economically feasible (cost effective) way.
Why do managers allocate indirect costs to these cost objects? There are four essential purposes of cost allocation:
1 To provide information for economic decisions2 To motivate managers and other employees3 To justify costs or compute reimbursement4 To measure income and assets for reporting to external
parties


Learning Objective 1 (continued) Provide Information
What economic decisions may require cost allocation information?
– To decide whether to add a new product– To decide whether to manufacture a component part or to
purchase it from another manufacturer– To decide on the selling price for a product
Motivation Managers and employees need to be encouraged to
design products that are simpler to manufacture or less costly to service.
Sales representatives need to be motivated to push high-margin products or services.

Learning Objective 1 (continued) Justify Costs
It is important to cost products at a “fair” price, especially in government defence contracts.
A consulting firm that is paid a percentage of the cost savings resulting from the implementation of its recommendations needs to justify costs in order to compute reimbursement.
Reporting Inventory costs must be determined for financial reporting and for
reporting to tax authorities. Under generally accepted accounting principles, stock costs
include manufacturing costs but exclude research and development, marketing, distribution, and customer service costs.

Describe how a costing system can have multiple cost objectsDescribe how a costing system can have multiple cost objects
Learning objective 2Learning objective 2


Learning Objective 3
Discuss key decisions faced when collecting costs in indirect cost pools

Learning Objective 3 (continued)
Cost Allocation and Costing Systems Costs incurred in different parts of an
organisation can be assigned, and then reassigned, when costing products, services, customers, or contracts.
Sandy Corporation manufactures clothes washers and dryers in two international divisions:
– Clothes Washer Division in Paris (CWD)– Clothes Dryer Division in Prague (CDD)

Learning Objective 3 (continued) Sandy Corporation collects costs at the following levels in
its organisation: Corporate costs:
– Treasury costs: £600,000 interest on debt used to finance the construction of new assembly equipment which cost £4,000,000 in the Paris Division and £2,000,000 in the Prague Division.
– Human resources costs: £1,200,000 in recruitment and ongoing employee training and development.
– Corporate administration costs: £4,800,000 in executives’ salaries, rent, and general administration.

Learning Objective 3 (continued)
Division costs:
Paris Prague Direct costs£2,200,000 £4,000,000 Indirect costs
1,980,000 2,500,000 Total £4,180,000 £6,500,000

Learning Objective 3 (continued) Allocating Corporate Costs
Some companies allocate all corporate costs to divisions because ...
– it sparks interest on the part of division managers regarding how corporate costs are planned and controlled, and ...
– to calculate the full costs of products. Other companies do not allocate corporate costs to
divisions. They maintain that division managers generally have no
say or role in incurring these costs. Other companies allocate only those costs for which
there is widespread agreement, such as human resources.

Learning Objective 3 (continued) If Sandy Corporation allocates corporate costs to
divisions, how many cost pools should it use to allocate corporate costs?
– One single cost pool?– Numerous individual corporate cost pools?
A key factor is the concept of homogeneity. In a homogeneous cost pool, all costs have the same or
a similar cause-and-effect or benefits- received relationship with the cost-allocation base.
If each cost category has a different cost driver, companies may prefer to maintain separate cost-pools for these costs.

Learning Objective 3 (continued) If Sandy Corporation allocates corporate costs to
divisions, which allocation basis should it use? The one that has the best cause-and-effect relationship
with costs.
Which allocation basis should Sandy Corporation use to allocate treasury costs?– Cost of new Assembly Department equipment
Treasury costs: £600,000 Paris Division:
£600,000 × (£4,000,000 ÷ £6,000,000) = £400,000 Prague Division:
£600,000 × (£2,000,000 ÷ £6,000,000) = £200,000

Learning Objective 3 (continued) Sandy Corporation analysis indicates that the demand for
corporate human resource management costs for recruitment and training varies with direct labour costs.
These costs are allocated to divisions on the basis of the total direct labour costs incurred in each division.
Suppose direct labour costs in the Paris Division are £1,200,000 and £1,800,000 in the Prague Division.
How does Sandy Corporation allocate its £1,200,000 of human resources costs? Paris Division:
£1,200,000 × (£1,200,000 ÷ £3,000,000) = £480,000 Prague Division:
£1,200,000 × (£1,800,000 ÷ £3,000,000) = £720,000 Sandy Corporation does not allocate corporate
administration costs to the divisions.

Learning Objective 3 (continued)
Paris Prague Treasury costs: £600,000 (2/3) and (1/3) £400,000 £200,000 Human resources costs: £1,200,000 (40%) and (60%) 480,000 720,000 Total allocated to divisions £880,000 £920,000

Learning Objective 3 (continued) Corporate treasury and human resources costs are
reallocated by the divisions to Assembly. Corporate human resource management costs are
reallocated by the divisions to the Department of Human Resources.
Division costs are reallocated to the departments within the division.
The Paris division of Sandy Corporation has two operating departments – Assembly and Finishing, plus two support departments – Maintenance and Human Resources.
The Paris Division management decided to reallocate the £400,000 treasury costs to the Assembly Department, and the £480,000 human resources costs to its Human Resources Department.

Learning Objective 3 (continued)
Paris Division Paris Division
Assemblydirect costs: £1,300,000Corporate costs: 400,000Total costs £1,700,000
Assemblydirect costs: £1,300,000Corporate costs: 400,000Total costs £1,700,000
Finishingdirect costs:
£900,000
Finishingdirect costs:
£900,000
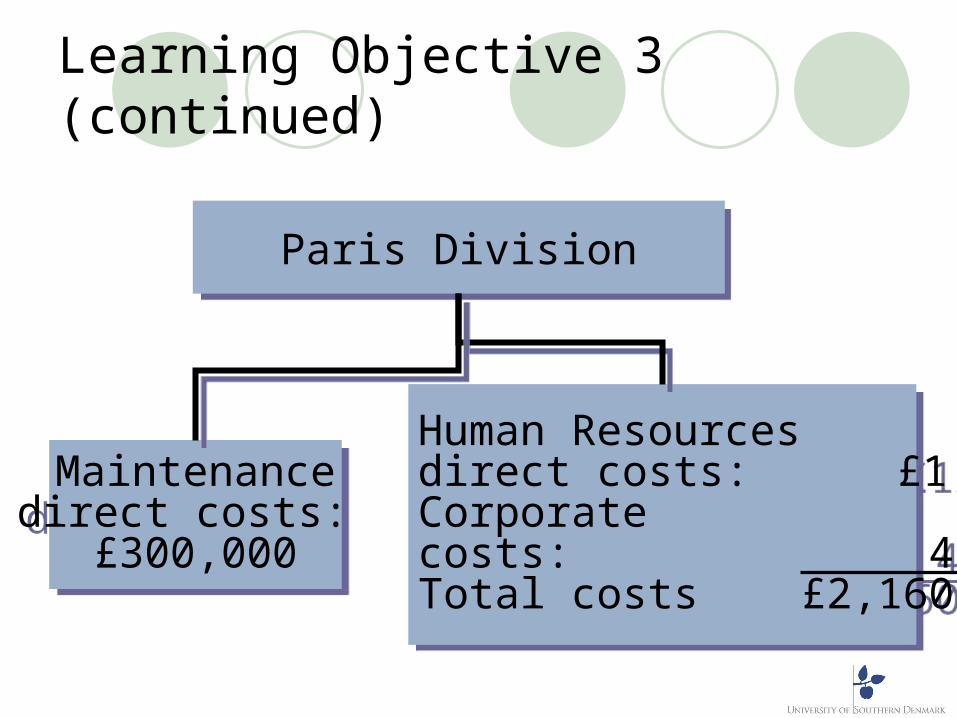
Learning Objective 3 (continued)
Maintenancedirect costs:
£300,000
Maintenancedirect costs:
£300,000
Human Resourcesdirect costs: £1,680,000Corporate costs: 480,000Total costs £2,160,000
Human Resourcesdirect costs: £1,680,000Corporate costs: 480,000Total costs £2,160,000
Paris DivisionParis Division

Paris Division £5,060,000
Paris Division £5,060,000
Assembly Department £1,700,000
Assembly Department £1,700,000
Finishing Department £900,000
Finishing Department £900,000
Maintenance Department£300,000
Maintenance Department£300,000
Human Resources Department £2,160,000
Human Resources Department £2,160,000
Learning Objective 3 (continued)

Learning Objective 4
Describe how the single-rate cost-allocation method differs from the dual-rate method

Learning Objective 4 (continued) Single-Rate and Dual-Rate Methods
The single-rate cost allocation method pools together all costs in a cost pool and allocates these costs to cost objects using the same rate per unit of the single allocation base.
There is no distinction between costs in the cost pool in terms of cost behaviour.
The dual-rate cost allocation method classifies costs in each cost pool into two cost pools – a variable cost cost-pool and a fixed-cost cost-pool.
Each of these pools uses a different cost-allocation base.


Learning Objective 5
Explain how the choice of budgeted versus actual allocation rates changes the risks that managers face

Learning Objective 5 (continued) Budgeted versus Actual Rates
The decision of whether to use budgeted cost rates or actual cost rates affects the level of uncertainty user divisions face.
Budgeted rates let the user department know in advance the cost rates they will be charged.
Users are better equipped to determine the amount of the service to request.
Budgeted rates also help motivate the manager of the supplier department to improve efficiency.
During the budget period, the supplier department, not the user departments, bears the risk of any unfavourable cost variances. Why?
– because the user departments do not pay for any costs that exceed the budgeted rates

Learning Objective 5 (continued) When cost allocations are made using budgeted rates, managers of
divisions to which costs are allocated face no uncertainty about the rates to be used in that budget period.
When actual rates are used for cost allocation, managers do not know the rates to be used until the end of the budget period.
When budgeted usage is the allocation base, user divisions will know in advance their allocated costs.
This information helps the user divisions with both short-run and long-run planning.
The main justification given for the use of budgeted usage to allocate fixed costs relates to long-run planning.
Organisations commit to infrastructure costs on the basis of a long-run planning horizon.
The use of budgeted usage to allocate these fixed costs is consistent with the long-run horizon.

Learning Objective 6
Distinguish among direct allocation, step-down and reciprocal methods of allocating support department costs

Learning Objective 6 (continued) Allocating Support Department Costs
Organisations distinguish between operating departments and support departments.
An operating department (a production department in manufacturing companies) adds value to a product or service.
A support department (service department) provides the services that assist other operating and support departments in the organisation.
Three methods are widely used to allocate the costs of support departments to operating departments:
1 Direct allocation method2 Step-down method3 Reciprocal method

Learning Objective 6 (continued) Direct method: Allocates support department
costs to operating departments only. Step-down (sequential allocation) method:
Allocates support department costs to other support departments and to operating departments.
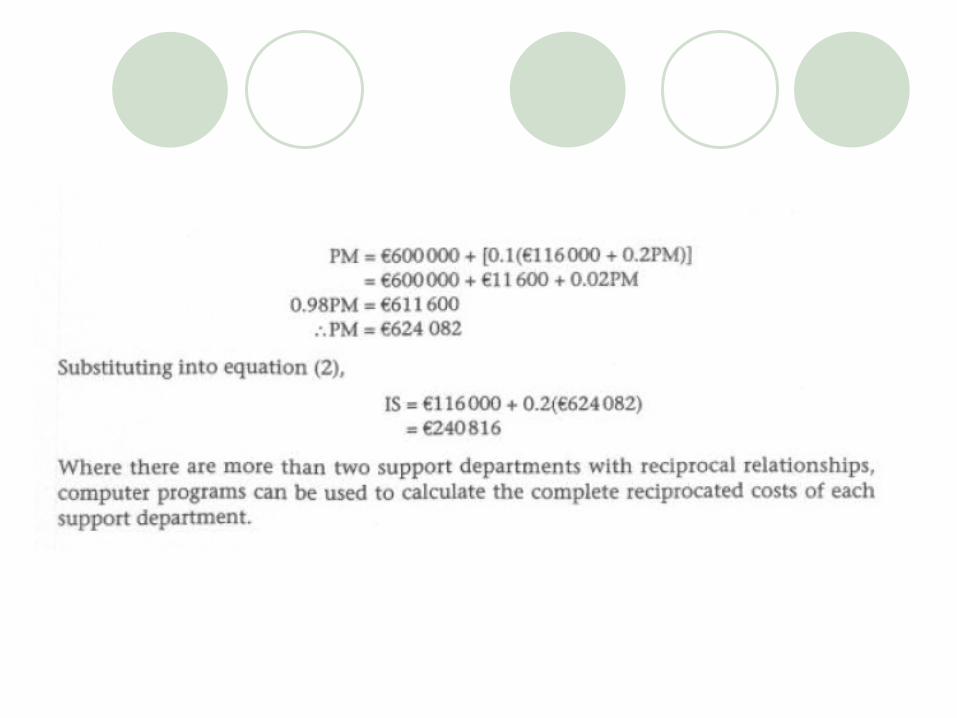
Reciprocal allocation method: Allocates costs by including the mutual services provided among all support departments.
The direct method and the step-down method are less accurate than the reciprocal method when support departments provide services to one another reciprocally.

Learning Objective 6 (continued) The following information pertains to the Paris
Division of Sandy Corporation: Recall that the Paris Division has two operating
departments – Assembly and Finishing, and two support departments – Maintenance and Human Resources.
Total square feet = 255,000 Total number of employees = 95 Maintenance is allocated using square feet. Human Resources are allocated using number of
employees.

Learning Objective 6 (continued)
Human Maintenance
ResourcesBudgeted costsbefore allocations: £300,000 £2,160,000Square feet: 5,000 30,000Number of employees: 8 15
Assembly FinishingBudgeted costsbefore allocations: £1,700,000 £900,000Square feet: 110,000 110,000Number of employees: 48 24

Learning Objective 6 (continued)Direct Method
– allocates support department costs to operating departments only.
The allocation ratio for allocating Maintenance to Assembly is 110,000/220,000 × £300,000 = £150,000.
The allocation ratio for allocating Maintenance to Finishing is 110,000/220,000 × £300,000 = £150,000.
The allocation ratio for allocating Human Resources to Assembly is 48/72 × £2,160,000 = £1,440,000.
The allocation ratio for allocating Human Resources to Finishing is 24/72 × £2,160,000 = £720,000.

Learning Objective 6 (continued)
Assembly Finishing Original costs: £1,700,000 £900,000 Maintenance Allocated: 150,000 150,000 Human Resources Allocated: 1,440,000 720,000
Total £3,290,000 £1,770,000

Learning Objective 6 (continued)
Step-down Method – allocates support department costs to other
support departments and to operating departments.
Which support department should be allocated first? The support department providing the greatest
percentage of support to other support departments is allocated first.

Learning Objective 6 (continued) Maintenance provides 12% of its services to
Human Resources. Human Resources provides 10% of its services to
Maintenance. The ratio to allocate Maintenance to Human Resources is
30,000/250,000 (or 12%) × £300,000 = £36,000. The ratio to allocate Maintenance to Assembly is
110,000/250,000 (or 44%) × £300,000 = £132,000. The ratio to allocate Maintenance to Finishing is
110,000/250,000 (or 44%) × £300,000 = £132,000.

Learning Objective 6 (continued)
Costs before Allocated allocation costs Maintenance £ 300,000 (£300,000) Human Resources£2,160,000 £36,000 Assembly £1,700,000 £132,000 Finishing £900,000 £132,000

Learning Objective 6 (continued) Human Resources costs to be allocated
become £2,160,000 + £36,000 = £2,196,000. The ratio to allocate the £2,196,000 Human
Resources costs to:– Assembly is 48/72 × £2,196,000 = £1,464,000.– Finishing is 24/72 × £2,196,000 = £732,000.

Learning Objective 6 (continued)
Costs before Allocated Allocated allocation costs costs Human Resources: £2,160,000 36,000 (2,196,000) Assembly: £1,700,000 132,000 1,464,000 Finishing: £ 900,000 132,000 732,000

Learning Objective 6 (continued)
Total cost after allocation: Assembly Department = £1,700,000 + £132,000
+ £1,464,000 = £3,296,000 Finishing Department = £900,000 + £132,000
+ £732,000 = £1,764,000

Learning Objective 6 (continued)
Reciprocal M HR A F Maintenance - 12% 44% 44% Human Resources 10% - 60% 30%
Maintenance cost = £300,000 + 0.10HR Human Resource cost = £2,160,000 + 0.12M

Learning Objective 6 (continued) Maintenance cost (M)
= £300,000 + 0.10(£2,160,000 + 0.12M) M = £300,000 + £216,000 + 0.012M 0.988M = £516,000 M = £522,267 HR = £2,160,000 + 0.12(£522,267) HR = £2,160,000 + £62,672 HR = £2,222,672

Learning Objective 6 (continued)
M HR A F Before allocation: £300,000 £2,160,000 £1,700,000 £ 900,000 Allocation: (522,267) 62,672 229,797 229,797 Allocation: 222,267 (£2,222,672) 1,333,603 666,802 Total £3,263,400£1,796,599
Total cost Assembly Department: £3,263,400 Total cost Finishing Department: £1,796,599

Learning Objective 6 (continued)
Overview of Methods Overhead rate for the Assembly Department is
determined using direct labour cost as a denominator.
Overhead rate for the Finishing Department is determined using machine-hours as the denominator.

Learning Objective 6 (continued)
Comparison of Methods Assembly Finishing Direct Labour cost: £698,880 £349,440 Machine-hours: 24,000
23,500
What are the various overhead rates using the three methods?
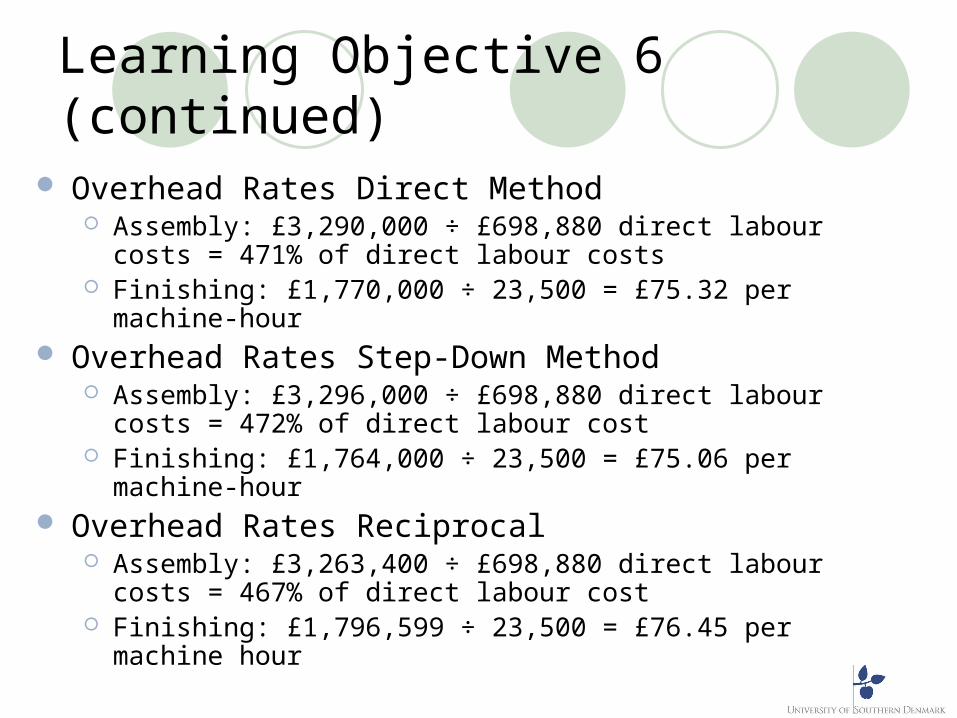
Learning Objective 6 (continued) Overhead Rates Direct Method
Assembly: £3,290,000 ÷ £698,880 direct labour costs = 471% of direct labour costs
Finishing: £1,770,000 ÷ 23,500 = £75.32 per machine-hour Overhead Rates Step-Down Method
Assembly: £3,296,000 ÷ £698,880 direct labour costs = 472% of direct labour cost
Finishing: £1,764,000 ÷ 23,500 = £75.06 per machine-hour Overhead Rates Reciprocal
Assembly: £3,263,400 ÷ £698,880 direct labour costs = 467% of direct labour cost
Finishing: £1,796,599 ÷ 23,500 = £76.45 per machine hour

Learning Objective 6 (continued)Comparison of Rates
Assembly Finishing Direct method: 471% £75.32 Step-down method: 472% £75.06 Reciprocal method: 467% £76.45


Learning Objective 7
Distinguish between the incremental and stand-alone cost-allocation methods

Learning Objective 7 (continued) Allocating Common Costs
A common cost is a cost of operating a facility, activity, or like cost object that is shared by two or more users.
Two methods for allocating common costs are:1 Stand-alone cost allocation method2 Incremental cost allocation method
The stand-alone cost allocation method uses information pertaining to each user of a cost object as a separate entity to determine the cost-allocation weights. A consultant in London is planning to go to Nice and
meet with an international client. The round-trip London/Nice/London airfare costs £540.

Learning Objective 7 (continued) The consultant is also planning to attend a business
meeting with a UK client in Barcelona. The round-trip London/Barcelona/London airfare costs
£360. The consultant decides to combine the two trips into a
London/Barcelona/Nice/London itinerary that will cost £760.
How much should the consultant charge to the UK client? £360 ÷ (£360 + £540) = 0.40 0.40 × £760 = £304 Therefore, the consultant should charge the
International client £760 – £304 = £456.

Learning Objective 7 (continued) The incremental cost allocation method ranks the
individual users of a cost object and then uses this ranking to allocate costs among those users. The first-ranked user of the cost object is termed the primary party
and is allocated costs up to the cost of it as a stand-alone user. The second-ranked user is termed the incremental party and is
allocated the additional cost that arises from there being two users instead of only the primary user.
Assume that the business meeting in Nice is viewed as the primary party.
What would be the cost allocation? International client (primary)
£540 Barcelona client (incremental) £760 – £540 = £220

Learning Objective 8
Criterias used to guide cost-allocation decisions

Learning ObjectiveCriterias used to guide cost-allocation decisions
Cause-and-effect: Using this criterion, managers identify the variable or variables that cause resources to be consumed.
For example, managers may use hours of testing as the variable when allocating the costs of quality-testing areas to products.
Allocation based on this criterion is likely to be the most credible to operating personnel.
Benefits-received: Using this criterion, managers identify the beneficiaries of the outputs of the cost object.
The costs of the cost object are allocated among the beneficiaries in proportion to the benefits each receives.
For example, the cost of a corporate-wide advertising programme may be allocated on the basis of division revenues.

Fairness or equity: This criterion is often cited on government contracts when cost allocations are the basis for establishing a price satisfactory to the government and its suppliers.
Cost allocation is viewed as a “reasonable” or “fair” means of establishing a selling price in the minds of the contracting parties.
Ability to bear: This criterion advocates allocating costs in proportion to the cost object’s ability to bear them.
An example is the allocation of corporate executive salaries on the basis of division operating income.
Learning Objective)

Learning Objective Role of Dominant Criteria
The criteria used to guide cost-allocation decisions affect both the number of indirect cost pools and the cost-allocation base for each indirect cost pool.
Managers must first choose the purpose for a particular cost allocation and then select the appropriate criterion to implement the allocation.
The cause-and-effect and the benefits-received criteria guide most decisions related to cost allocations.
Fairness and ability to bear are less frequently used criteria than cause-and-effect or benefits- received.
Learning Objective Why are fairness and ability to bear less frequently used? Fairness is an especially difficult criterion to obtain agreement
on. What one party views as fair, another party may view as unfair. The ability to bear criterion raises issues related to cross-
subsidisation across users of resources in an organisation. Cost-Benefit Approach
Companies place great importance on the cost-benefit approach when designing and implementing their cost-allocation system.
The costs of designing and implementing a system are highly visible.
The benefits from using a well-designed system are difficult to measure and are frequently less visible.


