CHAPTER 5 ELECTRONIC NAVIGATION SYSTEMS INTRODUCTION On modern sea-going vessels there are a number of electronic navigation systems and equipment which are designed to assist the navigator to navigate his vessel safely. They are (not exhaustive list) a. The gyro compass. b. Ship’s log. c. Echo sounder (depth recorder). d. Radar. e. Automatic radar plotting assistant (ARPA). f. Automatic identification system (AIS). g. Global positioning system (GPS). h. Electronic chart display and information system (ECDIS). i. Radio direction finding system. j. Hyperbolic radio navigation system. Whilst it is not intended to cover the above equipment/systems in great technical detail, the principles on which they operate and a broad description of each will be discussed. The last item on the above list has been included, although few vessels actually still use the system these days or are fitted with the specific equipment. GYRO COMPASS Except for small recreational vessels, most vessels are equipped with two types of compass, namely a gyro and a magnetic compass. The former is used as the primary compass with the latter as back-up in the event of gyro or power failure. Since the latter makes use of the earth’s magnetic field and is not reliant on electrical power it will not be discussed in this module. Except for small vessels, most sea-going vessels carry two gyro compasses which operate independently of one another, thus providing the navigator with a back-up in the event that one of the gyros fails. They operate on the principle of a very fast spinning wheel which has the attribute of rigidity in space and keeps its direction provided no external force is applied to it. Good examples of this phenomena are the bicycle and the motorbike which make use of the gyroscopic effect of their swiftly rotating wheels to remain in a balanced upright position.
Transcript
CHAPTER 5
ELECTRONIC NAVIGATION SYSTEMS
INTRODUCTION
On modern sea-going vessels there are a number of electronic navigation systems and equipment
which are designed to assist the navigator to navigate his vessel safely. They are (not exhaustive
list)
a. The gyro compass.
b. Ship’s log.
c. Echo sounder (depth recorder).
d. Radar.
e. Automatic radar plotting assistant (ARPA).
f. Automatic identification system (AIS).
g. Global positioning system (GPS).
h. Electronic chart display and information system (ECDIS).
i. Radio direction finding system.
j. Hyperbolic radio navigation system.
Whilst it is not intended to cover the above equipment/systems in great technical detail, the
principles on which they operate and a broad description of each will be discussed. The last item
on the above list has been included, although few vessels actually still use the system these days
or are fitted with the specific equipment.
GYRO COMPASS
Except for small recreational vessels, most vessels are equipped with two types of compass,
namely a gyro and a magnetic compass. The former is used as the primary compass with the
latter as back-up in the event of gyro or power failure. Since the latter makes use of the earth’s
magnetic field and is not reliant on electrical power it will not be discussed in this module.
Except for small vessels, most sea-going vessels carry two gyro compasses which operate
independently of one another, thus providing the navigator with a back-up in the event that one
of the gyros fails. They operate on the principle of a very fast spinning wheel which has the
attribute of rigidity in space and keeps its direction provided no external force is applied to it.
Good examples of this phenomena are the bicycle and the motorbike which make use of the
gyroscopic effect of their swiftly rotating wheels to remain in a balanced upright position.
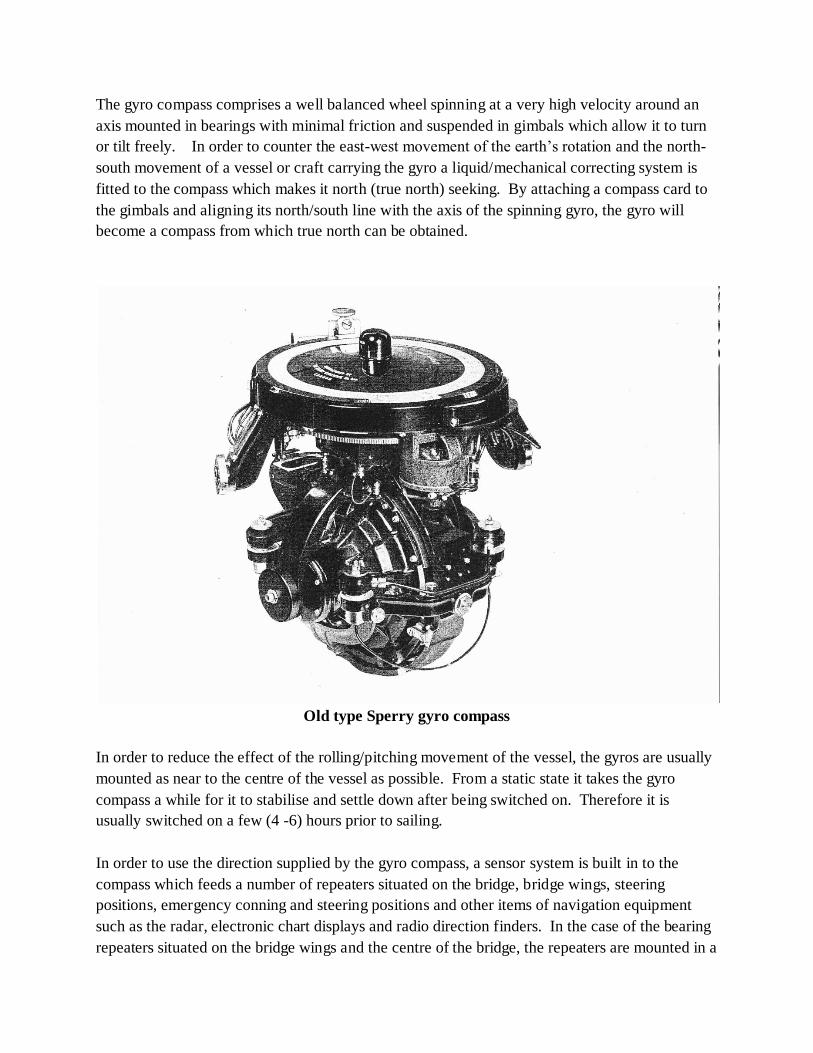
The gyro compass comprises a well balanced wheel spinning at a very high velocity around an
axis mounted in bearings with minimal friction and suspended in gimbals which allow it to turn
or tilt freely. In order to counter the east-west movement of the earth’s rotation and the north-
south movement of a vessel or craft carrying the gyro a liquid/mechanical correcting system is
fitted to the compass which makes it north (true north) seeking. By attaching a compass card to
the gimbals and aligning its north/south line with the axis of the spinning gyro, the gyro will
become a compass from which true north can be obtained.
Old type Sperry gyro compass
In order to reduce the effect of the rolling/pitching movement of the vessel, the gyros are usually
mounted as near to the centre of the vessel as possible. From a static state it takes the gyro
compass a while for it to stabilise and settle down after being switched on. Therefore it is
usually switched on a few (4 -6) hours prior to sailing.
In order to use the direction supplied by the gyro compass, a sensor system is built in to the
compass which feeds a number of repeaters situated on the bridge, bridge wings, steering
positions, emergency conning and steering positions and other items of navigation equipment
such as the radar, electronic chart displays and radio direction finders. In the case of the bearing
repeaters situated on the bridge wings and the centre of the bridge, the repeaters are mounted in a
special metal stand called a pelorus. They are mounted on gimbals to allow for the pitching and
rolling of the ship and are equipped with a removable azimuth circle to facilitate the taking of
bearings.
Gyro compass repeater mounted on the bridge wings
. The accuracy of the compass should be checked regularly against terrestrial navigation marks
(transits) and when out of sight of land, by taking amplitudes and azimuths of the sun. Regular
comparisons should also be taken of the heading of the gyro with that of the magnetic compass
especially after altering course.
Gyro compass strip repeater usually mounted inside the bridge
SHIP’S LOG
The ship’s log is basically the “speedometer and odometer” of a vessel. And performs exactly
the same function as that of a motor car, ie it records the speed of the vessel and the distance
travelled. Initially logs were purely mechanical and required no electrical power to operate.
They only recorded the distance covered by the ship, whilst the speed was calculated by
accurately measuring the time difference between successive readings of the log and dividing the
distance covered by the time taken. An example of this type of log was the Trident towed log.
Since it was a purely mechanical device, it will not be covered in this module.
It should be noted that when ordering a particular speed to proceed at, use is made of the shafr
revolutions to speed table. This table is compiled during the sea trials conducted after a vessel is
built when the vessel carries out speed trials over a specially measured and demarcated range.
The table provides the number of shaft revolutions required to propel the vessel at every speed
within the vessel’s speed range.
Of the electromechanical and electronic logs there are various types
a. The Pitometer log.
b. The Chernikeeff log.
c. The Electromagnetic log.
d. The Doppler log.
Pitometer Log
The Pitometer log is a “pressure type” log which measures the difference between the static
water pressure at the depth of the log sensor and the pressure caused by the movement of the ship
through the water.
An analog pitometer log
The pressure sensors are contained in a hollow metal rod with an oval cross section which
projects approximately 1 metre below the bottom of the hull. The unit is fitted near the pivoting
point of the vessel and can be drawn into the hull, after which the aperture can be closed. This is
done when the vessel is due to enter harbour or when proceeding in very shallow water when the
log may be damaged.
The device which measures the pressure difference converts it to a distance and speed recorder
where the results are displayed visually. In the past the processing and display of this data was
done using analogue technology. These days it is processed and displayed digitally and can be
fed to any other navigational system requiring a log input. An important item to note is that the
speed and distance provided by the log is through the water and not over the ground.
Chernikeeff log.
An analog Chernikeeff log
In the case of the Chernikeeff log, an impeller is fitted at the lower end of a similar rod to that of
the Pitometer. The rod projects approximately ½ metre below the bottom of the hull. Like the
Pitometer, it too can be withdrawn into the hull and the aperture closed.
The rotation of the impeller by the flow of water operates a make-and-break mechanism in the
shaft which transmits the impulse electrically to the distance recorder which displays the distance
covered. By counting the number of impulses over a predetermined time interval, the speed is
determined and displayed. As for the Pitometer log, the processing and display of the data is
done digitally these days. The problem with a Chernikeeff log is the fact that it has a moving
part, namely the impeller, which is susceptible to jamming by underwater debris.
Modern digital display for the ship’s log
Electromagnetic log.
Again the electromagnetic log consists of a metal rod similar to that of the Pitometer, which
projects below the bottom of the hull. An iron-core coil is mounted in a glass fibre housing at
the bottom end of the rod. The coil is fed with an alternating current and, when moved through
the water, produces a voltage in the surrounding water. The voltage, which is proportional to the
flux and the relative speed of the rod through the water, is detected by two electrodes on the rod,
and fed to a processor which converts it to distance and speed. This is then fed to displays on the
bridge and to any navigation system requiring a log input.
An Electromagnetic log
Doppler log.
Up to now we have been discussing logs which provide the distance covered and the speed
measured through the water. Since this does not take into account the effect of tidal streams and
currents, it does not reflect the true movement of the vessel over the ground. In order to
determine our position and movement geographically, we need a sensor that can measure
movement relative to the sea bed.
By using similar technology to that used by the echo sounder (transmission and reception of
sound through water), the Doppler log is able to measure movement of the vessel in relation to
the sea bed. In the case of the echo sounder the propagation time of the transmitted sound pulse
and its echo is measured and together with the known speed of sound through the water, the
depth of water can be measured. In the case of the Doppler log, the difference in the frequency
between the transmitted pulse and that of its echo is measured (the Doppler shift) and from this is
calculated the speed of the vessel over the ground.
Unlike the echo sounder, the Doppler transducer transmits a continuous beam of sound at an
angle of 60° to the keel of the ship in a forward direction. A second transducer receives the
returning echoes resulting from the multi-path reflections from the sea bed. The difference
between the frequency of the transmitted pulse and that of the echoes is measured and the speed
of the vessel is determined.
The frequency used by the Doppler log is higher than that of the echo sounder. The reasons for
this are
a. The shorter wavelength results in better diffusion of the reflection (multi-path
reflections).
b. The shorter wavelength results in a smaller beam angle and reduces the physical
dimensions of the radiating face of the transducer.
c. The radiated power of the sound beam spreads less and makes the echo stronger.
Because of the absorption by particles of the water at a depth of between 200 and 400 metres, the
Doppler log only works to about 200 metres. The minimum depth at which it will operate is
about ½ metre from the transducer. The velocity range is between 0 and somewhere between 30
and 100 knots in the fore and aft line and between 0 and between 8 and 10 knots athwartships.
The frequency range in water is 100 to 600 Khz.
ECHO SOUNDER
An echo sounder is the instrument used to determine the depth of water beneath the keel. In
order to do this it transmits pulses of sound which bounce off the sea bed. How does it work?
The echo sounder system comprises four components, namely a transmitter, a receiver, a
transducer and a display unit. The transmitter creates a short pulse of AC current which it passes
to the transducer which is situated at the bottom of the ship. The transducer converts this pulse
into sound (like a loudspeaker) which it transmits towards the sea bed. When it reaches the sea
bed, this pulse is reflected back to the transducer which now acts like a microphone and coverts
it back into an electrical current. This is then passed to the receiver where it is amplif ied and
converted into a useable format and displayed on the display unit. In the receiver there is also a
very accurate timing device which measures the time taken between transmission of the pulse
and reception of the echo. Since the speed of sound in water is known (approx 150 metres per
second) the receiver can now calculate the depth of water between the transducer and the sea bed
and this is what is displayed to the operator.
Basic diagram of the components of an echo sounder.
The display unit can be one of the following:
a. Flashing LED display. An arm rotated in a circular display at a constant speed.
When the arm is at the top of the display it initiates the transmission of the pulse.
When a signal is received a light emitting diode (LED) is switched on giving a
flash at approx the same spot each time. This indicates the depth.
b. Digital display. Here the depth is displayed digitally (in figures) in metres.
c. Paper Recorders. With a paper recorder a mark is burned on a roll of paper
indicating the depth at regular intervals. With this display a chart of the bottom is
produced.
d. Video Display. With this display a similar picture is produced as that of the paper
recorder. One can either have it in monochrome (shades of one colour) or in full
colour. The colour option allows the operator to determine the nature of the
bottom.
Except on digital displays, various range scales can be displayed, ie 0 to 10 metres, 0 to 20
metres, etc. Echo sounders usually operate in the 10 to 55 Khz frequency range. The human ear
can only hear sound in the 8 Hz to 18 Khz range. The echo sounder frequency range is therefore
referred to as ultra sonic.
RADAR
Radar has already been covered in a module devoted entirely to it, so it will not be discussed any
further.
AUTOMATIC RADAR PLOTTING AID (ARPA)
As mentioned previously, most radars today are equipped with ARPA. ARPA performs many of
the functions covered in the radar module automatically and continuously. This saves the officer
of the watch from having to do so manually and enables him to focus on his other duties. What
are the capabilities of ARPA?
Capabilities
a. It can track targets much faster and requires less plotting interval.
b. Twenty or more targets can be tracked at a time
c. Vectors are displayed and constantly updated, so the situation is graphically
displayed with the latest information.
d. Full details regarding each target being plotted can be displayed on command.
e. The history of each target’s movement can be graphically displayed.
f. It automatically acquires targets for tracking, which otherwise might have been
missed by the officer of the watch.
g. It provides a warning in the event of collision risk, loss of target, target entering a
guard zone, etc.
h. It provides a facility to predict the outcome of a manoeuvre under consideration.
Display of plotting data
Apart from the basic display of bearing and range of each target normally displayed by the radar,
additional information is required to determine risk of collision and the avoiding action to be
taken. ARPA can provide this information automatically. When graphic information is
displayed, risk of collision will become apparent with the use of relative vectors. If more
detailed information is required for decision making, then true vectors can be used.
ARPA will start plotting targets either if acquired manually through the use of a joystick or
similar pointing device, or by any target entering a predetermined zone. Once a target is
acquired, it will continue to be plotted until it is removed by the operator. ARPA will display the
following information:
a. Relative vectors. This information is displayed relative to the observer’s vessel.
The length of the vector relates to a time interval and it’s direction will indicate
it’s closest point of approach. The relative vector is therefore the OA line in a
plotting triangle. If the direction of the vector points towards own ship, then risk
of collision exists. Both the time interval represented by the vector and the length
of the vector can be altered by the operator.
b. True vectors. True vectors represent the WA line of a plotting triangle. The
length of each vector represents the distance the target will travel during the
selected interval and its direction represents the true course of the target. In true
vector display, the observer’s own ship also displays its own true vector. Risk of
collision in this mode can be recognised if the end of the target’s vector lies in a
direction which points to the end of the observer’s own true vector.
c. History of the target. The progress of the targets on the screen can be displayed
by invoking a history analysis (time-spaced dots representing past positions of the
target). It should be noted that various inputs of the data to the ARPA cause the
short term display to alter continuously. For this reason, any change in the
target’s course or speed might not be immediately apparent. The history analysis
is of importance in this case.
d. Potential collision points. Some manufacturers feature Points of Potential
Collision (PPC’s) or predicted Areas of Danger (PAD’s) which are locations or
areas highlighted on the screen where collisions could occur, thus prompting the
officer of the watch to avoid them.
e. Numerical data of each target. A full report of each target can be called up,
giving details of the target’s CPA, TCPA, course and speed. It is continuously
being updated by the computer, so it will always be recent and valid.
f. Trial manoeuvres. It is possible to display a hypothetical situation on the radar
screen (either in true vectors or relative vectors) resulting from an alteration being
contemplated involving the course and/or speed of the observer’s own vessel. In
this way a rapid decision can be reached and executed in confidence. This does
not mean however, that further close monitoring after performing the manoeuvre
would no longer be necessary.
Other ARPA Facilities
a. Guard zones. Ares on the screen which can be considered to be more important
by the operator can be demarcated in order to alert the officer to the presence of
previously undetected targets that have entered this zone.
b. Area rejection boundaries. Areas can be selected where automatic acquisition is
inhibited. In congested traffic, this has the advantage of allowing more room in
the processor’s memory for plotting target’s elsewhere.
c. Alarms. Also called operational warnings. The operator is alerted:
i. whenever a target presents a danger of collision or close quarters
situation;
ii. if a target enters a guard zone;
iii. whenever a target is lost;
iv. if data is incorrectly entered by the operator; and
v. it can sound an alarm to indicate system malfunctions.
d. Ground referencing. The secret of accurate plotting and forecasting is the
accuracy of the ship’s own speed and course fed into the processor. One option is
to feed the data in manually, based on the observation of the navigator. However
this can be burdensome. The facility of linking the velocity computations to a
fixed target, such as a buoy or an identifiable prominent stationary topographical
feature, will provide the computer with a known zero speed reference. With a
ground reference display, land echoes will seem to drift.
e. Navigational lines. Lines and mapping details can be prepared and stored for
future use which delineate channels, course lines, traffic separation schemes,
navigational hazards, approach limits, etc. When ground referencing is invoked,
the coast appears to drift and maps become displaced relative to the coastline.
f. Integrated navigation. The digital data from the ARPA can be fed via NMEA
connectors to a fully integrated navigation system such as ECDIS on the bridge.
Thus electronic charts can be superimposed on the radar screen and acquired
targets can be represented on electronic charts. Other systems such as AIS can
also be connected to the integrated system, providing information regarding the
identification, course, speed, intentions, destination, etc can also be displayed.
Errors and problems of an ARPA
Certain inaccuracies in the ARPA plot could be caused by input errors, ie from the radar. Others
could be errors in the computations and errors of interpretation.
a. Radar errors. These could be
i. bearing errors;
ii. range errors;
iii. gyro errors,
iv. course errors; and
v. speed errors.
b. ARPA errors. These could be
I, Random track errors. These are caused by input errors from the radar
which causes unstable computations and erratic target behaviour.
ii. Target swap. When targets become very close to one another it could
confuse the ARPA computer and cause it to swap the data computed for
one to the other vessel.
iii. Target loss. The target data may be transferred to a transient echo (sea
clutter) which then disappears.
iv. Missed targets. Weak echoes might miss the attention of the automatic
acquisition facility.
v. Ground referencing problems. When a vector is computed from ground
referenced data, the track relates to the ship’s and the target’s movement
over the ground. There is no way therefore to gauge the effect of the
current on the vectors and the aspect of the target could be affected.
c. Interpretational errors. These could be
i. Misreading a relative vector to indicate a true course and speed, or trying
to obtain a CPA from a true vector.
ii. Relying too much on presented data can be dangerous. All machines can
have faults and if this is not taken into account, the consequences could be
dangerous.
AUTOMATIC IDENTIFICATION SYSTEM (AIS)
In the past a ship’s identity and details had to be obtained by establishing communications with it
either by flashing light or radio. As can be imagined this was time consuming and in a heavy
traffic area a bit hazardous. This has now been replaced by an automated system referred to as
AIS. Since December 2004 it has become mandatory for sea going vessels to have the system
fitted. Besides being more convenient, the new system provides more information which enables
the officer of the watch to make more informed decisions when proceeding through congested or
busy seaways.
There are two types of onboard AIS:
a. Class A AIS which consists of
i. one 12.5 watt VHF transceiver;
ii. one integral GPS receiver;
iii. two VHF TDMA (time division multiple access) receivers;
iv. one VHF DSC (digital selective calling) receiver; and
v. a standard marine data interface (IEC 61162/NMEA 0183) to shipboard
display and sensor systems.
Class A AIS
b. Class B AIS which consists of:
i. one 2 watt VHF transmitter;
ii. a GPS receiver;
iii. two VHF receivers, one of which must be able to decode DSC
transmissions as well.
Class B AIS
Large ocean going vessels such as those subject to the SOLAS convention are obliged to use the
class A system, while smaller vessels and recreational craft use class B.
How does it work?
The AIS transponder works in an autonomous and continuous mode. Although only one radio
channel is necessary it transmits and receives over two radio channels to avoid interference
problems and to allow channels to be shifted without communications loss from other ships.
Class A AIS can tune over the whole 156.025 – 162.025 MHz band, while class B AIS is
restricted to 161.5 – 162.025 MHz.
Class A stations determine their own transmission schedule, based upon data link traffic history
and knowledge of future actions by other stations. Class B is a “polite” listen-before-
transmitting system that will transmit on the first available slot. There are 2250 time slots
established every 60 seconds and the AIS stations fit their transmissions into one of these slots
during each transmission. They automatically and continuously synchronise their transmissions
to avoid overlapping each other.
Diagram of the TDMA principle upon which the AIS depends
TDMA: Time Division Multiple Acssess)
The coverage of these transmissions depends upon the height of the antenna mainly and is
typical of VHF transmissions, ie 20 to 30 miles. The transmissions consists mainly of the
vessel’s identity, type of vessel, its callsign, its dimensions and manoeuvring information, its
cargo, its destination, its geographical position, its course and speed and its ETA at its
destination. On class A ships the system is integrated with other sensor and display systems, ie
radar and ECDIS and by merely clicking on a contact, all the information relating to that vessel
is displayed. On class B vessels the information is displayed on an alpha numeric visual display.
Example of the information which the AIS system displays (left side of screen)
GLOBAL POSITIONING SYSTEM
The global positioning system utilises a constellation of 31 satellites orbiting the earth at very
high altitudes. It was developed in 1973 and became operational in 1994. Initially only 24
satellites were used but in 2000 it was decided to upgrade the system to GPSIII, The system is
owned by the United States of America who provided all the development work, the launching of
the satellites and at present maintains the system. The initial cost was in the order of 10 billion
US dollars. Although it was initially developed for the US military, it was made available for
civilian and commercial use as well. The initial signal for civilian and commercial use was
purposefully degraded to prevent an adversary using it for military purposes. In 2000 however,
this was removed and the accuracy is the same for both military and civilians. The satellites are
high enough to avoid the problems experienced by the land based systems and they use
technology which provides pin point accuracy anywhere in the world, 24 hours a day. The
accuracy for everyday use is within 20 metres. Not only can it be used for surface navigation
but, because it can locate things in three dimensions, it can be used for aircraft (and missiles) as
well.
Typical GPS marine display
Concept (How does it work?)
The principle behind the GPS system (each sphere represents the transmission coverage of
a satellite0
Basically the user (navigator) measures the distance between the satellite and himself. If he only
used one satellite this would provide him with a position anywhere on a sphere constructed
around the satellite (ie. the satellite is in the centre). If he used two he would narrow his position
down to a circle which would result from the intersection of the two spheres. Using a third
satellite would narrow it down further to two positions which would result from the intersection
of the third sphere with the circle produced by the first two satellites.. How do we know which
of the two points is our position? Usually one of the two points produced is a ridiculous position
and can be discarded. By using various techniques, the computer inside the GPS receiver can
distinguish the correct position from the incorrect one.
Measurement of distance
How do we measure the distance from the satellite? The GPS system measures the time a radio
signal takes to travel from the satellite to the receiver. Since radio signals travel at the same
speed as light (300 000 kilometres per second) all the receiver has to do is figure out exactly
when the satellite transmitted its signal and measure the time it takes to reach it. This is done by
installing very accurate clocks in both the satellites and the receivers and synchronising them.
The clocks in the satellite are very sophisticated and extremely accurate and are also very
expensive. Since it is not feasible from the cost point of view, to install the same type of clock in
the ordinary GPS receiver, they are not as accurate as that in the satellites. In order to make up
for the difference in accuracy between the satellites and the receivers, a technique is used to
correct the errors caused by a lack of accurate synchronisation. This involves the use of data
from a fourth satellite which provides a fix which the receiver realises is incorrect and through
repeated correction/adjustment of the data from the four satellites is able to correct the error.
System overview
a. The space segment.
There are a total of 31 satellites (with two older deactivated satellites as ready spares)
kept in 12 hour orbital planes. They are kept within one metre of their designated
positions by the use of special onboard sensors and four hydrazine thrusters. The
satellites are kept at an altitude of 20 200 kilometres. The orbits are chosen so that every
satellite can be monitored and controlled by earth stations situated in United States
territory. The orbital configuration of the satellite was designed so that at least four
satellites with an elevation of greater than 9.5° will be in view of the receiving antennas
at any point of the earth’s surface at any time.
b. The ground segment. The ground segment consists of the following:
a. Master Control Station situated at Schriever Air Force base situated 25 km ESE of
Colorado Springs.
b. Four dedicated ground antennas situated at Kwajalein, Ascension Island, Diego
Garcia and Cape Canaveral.
c. Six dedicated monitoring stations situated at Hawaii, Ascension Island, Diego
Garcia, Kwajalein, Colorado Springs and Cape Canaveral.
Satellite orbital parameters are constantly monitored by one or more of the ground tracking
stations which pass the measured data to the MCS at Colorado Springs. From this data the MCS
predicts future orbital data which is fed via the dedicated ground antennas to each satellite where
it is stored in RAM and transmitted as a data frame to GPS receivers inside the coverage area of
the satellite.
ELECTRONIC CHART DISPLAY AND INFORMATION SYSTEM (ECDIS)
ECDIS is an integrated electronic navigation system which combines the data obtained from a
number of electronic navigation sensors and displays it on a video display unit/monitor both in
the form of a graphic image and alpha-numeric information. The sensors providing the data
inputs to ECDIS are the following:
a. The global positioning system (GPS and/or DGPS).
b. The automatic identification system (AIS).
c. The radar and automatic radar plotting aid (ARPA).
d. The ship’s gyro compass.
e. The echo sounder.
f. The ship’s log.
The system makes use of electronic (digital) navigation charts (ENC’s) in place of the normal
paper charts which they are intended to replace. The position of the ship is plotted in real time
and kept continuously up to date. The ship’s track can be planned and plotted on the electronic
chart either by use of the computer “mouse” and cursor or alpha-numeric keyboard. The voyage
or passage plan can then be stored in the system’s memory and when retrieved and executed,
provides the planned track as would be the case with a paper chart.
Being in digital format, the track is plotted on a seamless series of charts. In the case of paper
charts, the position would have to be transferred to the next chart in the series as the vessel
proceeded along its planned track. The system can be instructed to provide a plotted position at
predetermined time intervals, as would be the case with paper charts when positions are plotted
manually.
One can also set other navigational parameters in the system, ie the maximum allowable
deviation from the planned track, safety depth contours, arrivals at predetermined waypoints,
alter course positions, etc. When these parameters are breeched, or a vessel reaches the
predetermined waypoints/positions, it activates a visual and audio alarm to alert the officer of the
watch/ navigator.
The ship’s physical parameters (length, beam, draught, tonnage type and power of the engines,
types of steering, manoeuvring characteristics, etc are also entered into the system so that it can
predict the outcome of an intended manoeuvre, ie determining alter course positions.
Electronic charts can be constructed using either of two types of data, namely vector or raster. In
the case of raster charts, a paper chart is scanned and converted to a digitised replica. This
digitised image cannot be interrogated or changed, ie what is on the paper chart is displayed as
is. In the case of the vector chart, all the information and symbols on the chart as well as their
characteristics are digitally encoded individually and stored in the system’s data base. This
enables the operator to decide what he wants displayed and the level of detail he requires. This
is to prevent the display being cluttered with unwanted or unnecessary data. To make vector
charts is more costly and more time consuming than raster charts. Because of this, it will still
take some time before all charts are replaced with vector charts. Until then ECDIS will also
allow the display of approved raster charts which comply with IMO performance standards.
Whereas chart corrections and updating was carried out manually, the correction of Electronic
Navigation Charts can be done off-line (by CD-ROM or diskette) or on-line (via radio links or
internet).
In addition to the purely navigational aspect, the system is designed to allow the overlay of the
radar/ARPA picture on the chart graphics. The rest of the information provided by ARPA and
the AIS system is displayed next to the graphic display in alpha-numeric format. By looking at
one video display unit/monitor the navigator or officer of the watch can observe all the
information provided by the various navigation sensors, instead of looking at the data displays of
each one individually in different locations. As in the case of the navigational mode, the system
can be set to provide visual and audible alarms when a dangerous situation develops, ie a vessel
on a collision course or having a CPA closer than. It is a wonderful navigational tool which will
save the officer of the watch much time, especially in a congested seaway where he can apply
himself more efficiently in keeping a proper lookout of his environment. There is always a
danger, however, that he or she becomes complacent and relies too heavily on the system for
watchkeeping, instead of using it as an aid to or enhancement of his/her physical/visual
watchkeeping. The phenomenon when a collision has occurred despite the availability of
electronic navigation systems has been referred to as an “electronically assisted collision”. One
must always be aware of the possibility of a malfunction in the system and regular checks by an
independent navigational source must be conducted. One should also continuously reconcile the
electronic picture with that obtained visually by the watchkeeper.
The International Maritime Organisation (IMO) decided that it will be mandatory for all
seagoing commercial vessels to carry ECDIS. Implementation was carried out in phases
commencing 1 July 2012.
It should be noted that not all Electronic chart Systems (ECS) are ECDIS and only an ECDIS
approved by the IMO is approved for navigational use. It is also an IMO requirement that a
suitable and independent back=up navigation system be available in addition to the ECDIS.
Side by side displays of the radar picture and the electronic chart display
MARINE RADIO BEACONS
One of the systems which were used along the Namibian and South African coasts was a series
of marine radio beacons situated along the coastline and which provided vessels navigating in
our waters with a means of obtaining radio bearings. Six of these stations were situated in
Namibia and twenty four in South Africa.
The system operated in the MF (medium frequency) band (280 – 315 KHz) and had a range of
between 25 and 100 nautical miles. Since the bearings obtained were great circle bearings, they
had to be corrected for convergency before they could be plotted on a Mercator chart. The
systems two main shortcomings were
a. The signal was prone to distortion when it passed over the coastline. Radio waves
travel more slowly over land than over the sea.
b. At night the sky waves interfere with the ground waves, causing fading when the
two signals are received simultaneously. The sky waves also cause bearing
errors.
The distribution of radio beacons and radar transponders was as indicated above
RADAR TRANSPONDER BEACONS
Another system which operated along the South African and Namibian coast was a series of
Radio Transponder Beacons. There were five on the Namibian coast and fifteen on the South
African coast.
The beacons operated in the 10 GHz (10cm) and 3 GHz (10 cm) radar bands. The beacons
would emit a characteristic signal when activated by the emissions of a ship’s radar. This would
provide a range and bearing of the beacon on the radar Planned Position Indicator (PPI). What
you would observe on the PPI is a line of dots extending from slightly beyond the radar echo (if
any) of the beacon outwards towards the circumference of the PPI. The range would be taken to
the beginning of the line but, since there is a delay in the response of the beacon, the range
obtained would be approximately 75 to 100 metres greater than the actual range from the ship.
The beacons have an average nominal range of 12 nautical miles. In order to identify the beacon
the transmission received on the PPI would be in the form of a morse code letter, ie C (-.-.).
DECCA POSITION FIXING SYSTEM
This system was operated by the SA Air Force until the end of 1998. It covered the sea area off
Namibia and South Africa and consisted of five Decca “chains”. The chains were situated as
follows:
a. Namibia – centred on Usakos.
b. Namaqualand – centred on Noordoewer,
c. Cape Province – centred on Matroosberg.
d. Eastern province – centred on Addo.
e. Kwazulu-Natal – centred on Matatiele.
Each chain consisted of a master and three slave stations. The master was situated in a central
position and each slave was separated by more than 90° from each other measured from the
master, and between 60 and 100 nautical miles from the master. The transmissions from the
slaves were phase-locked with that of the master, ie they transmitted at the same time. The
receiver on the ship received all the transmissions, measured the difference in phase between
them and provided the results on three phase meters (one for each slave). The hydrographer
provided charts with curves of equal phase difference for each of the slaves (red, green and
purple). The readings of the phase meters were compared with these curves and where the three
particular curves intersected was the position of the ship.
The system operated in the LF (Low Frequency) band (70 to 130 KHz). The range of the
transmissions varied between day and night:
a. Day – 250 nautical miles from the master station.
b. Night – 100 nautical miles.
The system was also prone to the same shortcomings affecting radio beacons, ie coastal effect
and sky wave interference. The accuracy was also affected by instrumental errors, lane width
and the angle of cut of the curves (hyperbolae).
Diagram shows the disposition of master and slave stations of the 5 Decca chains covering
the RSAand Namibian coasts
OTHER ELECTRONIC NAVIGATION SYSTEMS
Other electronic navigation systems employed in the past include Consol, Loran and Omega
(similar to Decca) and the forerunner to GPS, the American Transit system. The latter consisted
of 5ive low orbit (1100 kms) satellites orbiting the earth in approximately one and three quarter
hours. The system made use of the Doppler effect, ie changes in frequency of the satellite’s
transmissions as they passed within range of the receiver was measured and compared. This was
compared with a computed position obtained by DR in the receiver’s computer and a fairly
accurate position obtained. In order for the computer to produce a Dr position, it required inputs
of start position and regular updates of courses and speeds. The chief shortcoming of this system
was the limited number of satellites and their low altitude orbits. The orbits had to be between
10° and 70° above the receiver’s horizon to provide usable data. Because of this, fixes were
erratic, during a watch of four hours one might only obtain one fix and at other times there were
a number in one hour.
There are a number of other satellite navigation systems such as the Russian GLONASS
(GLObal Navigation Satellite System) and the planned European “Galileo” positioning system,
Chinese “Compass” navigation system and the Indian regional navigational satellite system.
Glonass has also been made available for private/commercial use.
Technology is advancing at a tremendous rate and it is essential that the maritime industry keep
pace with the latest developments in electronic navigational equipment. However, no matter
how advanced the technology becomes, it is only as good as the people who use it. The human
element is still the core to safety at sea and will remain so for the foreseeable future.