Chapter 5 Phylogeography of Kloss’s Gibbon (Hylobates Klossii) Populations and Implications for Conservation Planning in the Mentawai Islands Danielle J. Whittaker Introduction The Kloss’s gibbon (Hylobates klossii) has long been recognized as distinct among the members of the genus Hylobates due to its small size and completely black pelage with no markings. Unlike most other gibbon species, the male and female do not duet; instead, neighboring males chorus before dawn, while the females sing after dawn. The only other gibbon to share these behavioral characteristics is the closely related Javan silvery gibbon (H. moloch) (Takacs et al. 2005; Geissmann and Nijman 2006; Whittaker et al. 2007). The Kloss’s gibbon is endemic to the Mentawai Islands, located off the west coast of Sumatra in Indonesia, and is endangered as a result of continuing deforestation and hunting (Whittaker 2006). Since the 1970s, researchers have advocated increasing protection of this unusual species (McNeely 1978; World Wildlife Fund 1980; Tenaza 1988; Fuentes 1996/1997; Kobold et al. 2003; Paciulli 2004; Whittaker 2005a, 2006), but conservation planning has suffered from a lack of knowledge about intraspecific variation throughout the Mentawais. There are four endemic primates in the Mentawai Islands, which have a total landmass of less than 7,000 km 2 . The four Mentawai Islands are not connected to neighboring Sumatra: during the Tertiary period, the force of the subduction of the Indian plate under the Sunda plate pushed up this chain of islands from the ocean floor. The Mentawais have long been isolated from mainland Sunda- land by the 1,500-m deep Mentawai Basin, except for brief periods when sea levels were at their lowest, the last occurring between one million and 500,000 years ago (Batchelor 1979; Karig et al. 1980; Moore et al. 1980; Whitten et al. 2000). This long history of isolation likely accounts for the islands’ high level of endemism: 65% of non-volant mammals in the Mentawai Islands are endemic at the genus or species level (World Wildlife Fund 1980). D.J. Whittaker (*) Department of Biology, Indiana University, 1001 East Third Street, Bloomington, IN 47405, USA e-mail: [email protected]S. Lappan and D.J. Whittaker (eds.), The Gibbons, Developments in Primatology: Progress and Prospects, DOI 10.1007/978-0-387-88604-6_5, Ó Springer ScienceþBusiness Media, LLC 2009 73
Transcript
Chapter 5
Phylogeography of Kloss’s Gibbon (HylobatesKlossii) Populations and Implications
for Conservation Planning in theMentawai Islands
Danielle J. Whittaker
Introduction
The Kloss’s gibbon (Hylobates klossii) has long been recognized as distinct
among the members of the genusHylobates due to its small size and completely
black pelage with no markings. Unlike most other gibbon species, the male and
female do not duet; instead, neighboring males chorus before dawn, while the
females sing after dawn. The only other gibbon to share these behavioral
characteristics is the closely related Javan silvery gibbon (H. moloch) (Takacs
et al. 2005; Geissmann and Nijman 2006; Whittaker et al. 2007). The Kloss’s
gibbon is endemic to the Mentawai Islands, located off the west coast of
Sumatra in Indonesia, and is endangered as a result of continuing deforestation
and hunting (Whittaker 2006). Since the 1970s, researchers have advocated
increasing protection of this unusual species (McNeely 1978; World Wildlife
Fund 1980; Tenaza 1988; Fuentes 1996/1997; Kobold et al. 2003; Paciulli 2004;
Whittaker 2005a, 2006), but conservation planning has suffered from a lack of
knowledge about intraspecific variation throughout the Mentawais.There are four endemic primates in theMentawai Islands, which have a total
landmass of less than 7,000 km2. The four Mentawai Islands are not connected
to neighboring Sumatra: during the Tertiary period, the force of the subduction
of the Indian plate under the Sunda plate pushed up this chain of islands from
the ocean floor. The Mentawais have long been isolated from mainland Sunda-
land by the 1,500-m deep Mentawai Basin, except for brief periods when sea
levels were at their lowest, the last occurring between one million and 500,000
years ago (Batchelor 1979; Karig et al. 1980; Moore et al. 1980; Whitten et al.
2000). This long history of isolation likely accounts for the islands’ high level of
endemism: 65% of non-volant mammals in the Mentawai Islands are endemic
at the genus or species level (World Wildlife Fund 1980).
D.J. Whittaker (*)Department of Biology, Indiana University, 1001 East Third Street, Bloomington,IN 47405, USAe-mail: [email protected]
S. Lappan and D.J. Whittaker (eds.), The Gibbons, Developments in Primatology:Progress and Prospects, DOI 10.1007/978-0-387-88604-6_5,� Springer ScienceþBusiness Media, LLC 2009
73
There are four Mentawai Islands: Siberut, Sipora, North Pagai, and SouthPagai.The largest andnorthernmost islandofSiberut is home to theonlyprotectedarea in the Mentawais, Siberut National Park, which at 1,926 km2 comprisesnearly half of the island. Logging concessions and oil palm plantations make upmuch of the area outside the park (Whittaker 2005b, 2006). Sipora is the mostdeveloped of the four islands and is home to the regency capital, Tua Pejat. Only10–15% of this island’s forest cover remains (Fuentes 1996/1997). Much of theinterior of the Pagai Islands is a large logging concession (83,330 ha) that has beencontrolled since 1971 by PT Minas Pagai Lumber Corporation; this companypractices selective logging and replanting, andmany patches of forest appear to besuitable habitat for primates (Paciulli 2004; Whittaker 2005a, b, 2006).
The other three primate species in the Mentawai Islands are the simakobumonkey (Simias concolor), the Mentawai langur (Presbytis potenziani), andthe Mentawai macaque (Macaca pagensis). Each of these species currentlyincludes two different subspecies: one subspecies in Siberut (S. concolor siberu,P. potenziani siberu, andM. pagensis siberu) and one in the three southern islands(S. c. concolor,P. p. potenziani, andM. p. pagensis). Researchers have based theseclassifications primarily on pelage differences, as all three Siberut populationshave darker coloration (Chasen and Kloss 1927; Whitten and Whitten 1982).Recent studies of morphological differences (Kitchener and Groves 2002) andmitochondrial variation (Roos et al. 2003) in Mentawai macaques suggest thatthe two populations are actually different species, M. pagensis in the south andM. siberu in Siberut. However, the level of genetic differentiation observed(5.9%) is not dramatically different from the range of estimated mtDNAsequence divergence found between rhesus macaque populations (0.2–4.5%),even without physical isolation (Melnick and Hoelzer 1992).
Kloss’s gibbon populations have no subspecific designations, because theyexhibit no obvious phenotypic variation: all Kloss’s gibbons have completelyblack fur with no markings. Furthermore, to date researchers have conductedbehavioral studies on the island of Siberut only, so behavioral differencesamong populations are unknown. However, the fourMentawai primate speciespresumably share the same biogeographic history, and thus distribution ofgenetic variation in Kloss’s gibbons should follow the same pattern as morpho-logical variation in the Mentawai monkeys. This study tests the hypothesis thatthe Siberut population of Kloss’s gibbons is genetically distinct from the south-ern population on Sipora and the Pagais.
All four species of Mentawai primates are threatened by legal and illegallogging, hunting for meat, and the illegal pet trade. As noted above, the onlyprotected area in theMentawai Islands is Siberut National Park. In recognitionof the possibly unique subspecies of primates living in the southern islands,researchers have suggested a few sites in the Pagai Islands for protected areastatus: Sinakak islet in South Pagai, and Betumonga in North Pagai (Tenaza1987, 1988; Fuentes 1996/1997; Paciulli 2004). Unfortunately, both areas havebeen logged in recent years.
Conservation planning aims to preserve genetic diversity within a species. Ifgenetically distinct units are identified within a species, ideally conservation
74 D.J. Whittaker
strategies should consider each unit. ‘‘Evolutionarily Significant Units’’ (ESUs)are defined as genetically, ecologically, or morphologically distinct lineages(Vogler and DeSalle 1994). In this study, I test the hypothesis that populationsof Hylobates klossii have diverged into multiple ESUs. The results are applic-able to conservation planning: if there are multiple units within the species,multiple conservation areas should be set aside for their protection.
Methods
Sampling
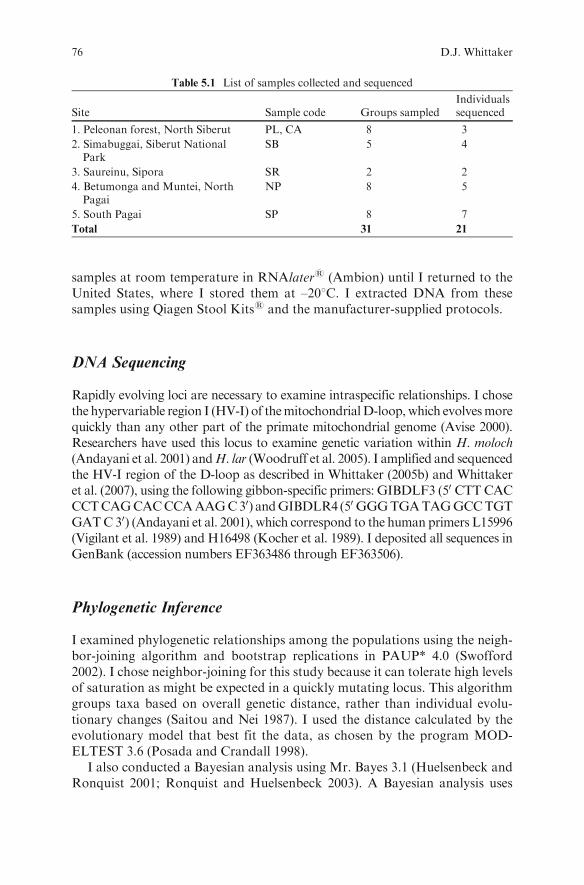
I visited the Mentawai Islands from January to May 2001 and August toDecember 2003 and non-invasively collected fecal samples from 31 wild gibbongroups at five sites on all four islands (Fig. 5.1, Table 5.1). I stored the fecal
Fig. 5.1 Map of the Mentawai Islands, showing sampling sites (created using online mapcreation at http://www.aquarius.ifm-geomar.de/). Numbers correspond to sites listed in Table 5.1
5 Kloss’s Gibbon Phylogeography 75
samples at room temperature in RNAlater1 (Ambion) until I returned to theUnited States, where I stored them at –208C. I extracted DNA from thesesamples using Qiagen Stool Kits1 and the manufacturer-supplied protocols.
DNA Sequencing
Rapidly evolving loci are necessary to examine intraspecific relationships. I chosethe hypervariable region I (HV-I) of themitochondrialD-loop,which evolvesmorequickly than any other part of the primate mitochondrial genome (Avise 2000).Researchers have used this locus to examine genetic variation within H. moloch(Andayani et al. 2001) andH. lar (Woodruff et al. 2005). I amplified and sequencedthe HV-I region of the D-loop as described in Whittaker (2005b) and Whittakeret al. (2007), using the following gibbon-specific primers: GIBDLF3 (50 CTTCACCCTCAGCACCCAAAGC30) andGIBDLR4 (50GGGTGATAGGCCTGTGATC30) (Andayani et al. 2001), which correspond to the human primers L15996(Vigilant et al. 1989) and H16498 (Kocher et al. 1989). I deposited all sequences inGenBank (accession numbers EF363486 through EF363506).
Phylogenetic Inference
I examined phylogenetic relationships among the populations using the neigh-bor-joining algorithm and bootstrap replications in PAUP* 4.0 (Swofford2002). I chose neighbor-joining for this study because it can tolerate high levelsof saturation as might be expected in a quickly mutating locus. This algorithmgroups taxa based on overall genetic distance, rather than individual evolu-tionary changes (Saitou and Nei 1987). I used the distance calculated by theevolutionary model that best fit the data, as chosen by the program MOD-ELTEST 3.6 (Posada and Crandall 1998).
I also conducted a Bayesian analysis using Mr. Bayes 3.1 (Huelsenbeck andRonquist 2001; Ronquist and Huelsenbeck 2003). A Bayesian analysis uses
Table 5.1 List of samples collected and sequenced
Site Sample code Groups sampledIndividualssequenced
1. Peleonan forest, North Siberut PL, CA 8 3
2. Simabuggai, Siberut NationalPark
SB 5 4
3. Saureinu, Sipora SR 2 2
4. Betumonga and Muntei, NorthPagai
NP 8 5
5. South Pagai SP 8 7
Total 31 21
76 D.J. Whittaker
Markov Chain Monte Carlo simulations to consider various genealogies andcalculate the posterior probability of each tree topology, producing a credibilityscore for each node based on a likelihood model. I used MODELTEST tochoose the parameters for this likelihood model.
I used sequences from H. pileatus andHoolock hoolock as outgroups for theanalysis (Roos and Geissmann 2001; Whittaker et al. 2007). Several recentanalyses have suggested that Hoolock is likely basal to the hylobatid radiation,and that H. pileatus is the basal taxon of the genus Hylobates (Zehr 1999;Takacs et al. 2005; Whittaker et al. 2007).
Phylogenetic Species Concept
In contrast to the Biological Species Concept (BSC), which defines a species as agroup of actually or potentially interbreeding populations, a concept that can bedifficult to operationalize, the Phylogenetic Species Concept (PSC) focuses onhow to recognize a species and defines a species as the smallest diagnosable uniton the basis of fixed, or reciprocally monophyletic, character states (Platnick1979; Cracraft 1983; Nixon and Wheeler 1990). Under the BSC, geographicallyisolated populations that display phenotypic differentiation are often consideredsubspecies. No criteria are established that specify what level of differentiation issufficient to designate populations as subspecies, and some systematists haveargued that this largely subjective system should either be abandoned entirely orreplaced with a more careful system of defining ‘‘evolutionarily significant units’’(ESUs), particularly for the purpose of making conservation decisions (Ryder1986; Vogler and DeSalle 1994). In practice, ESUs are defined as genetically,ecologically, or morphologically distinct lineages; this definition also meets therequirements for the PSC, and the PSC can be used to identify populations forconservation. In the present study, I focus on identifying whether populations aregenetically distinct under the PSC.
Population aggregation analysis (PAA) is a character-based method thatidentifies genetically distinct lineages by analyzing patterns of distribution ofgenetic variation. Under this method, one creates a profile for each populationdescribing the presence or absence of each attribute in each individual. Onlyattributes that are fixed in populations are informative for this analysis. Theanalysis then groups together populations based on these attributes. Aftersuccessive rounds of grouping local populations together, the result is eitherone group with no diagnosable units or two or more distinct populations thatunder the PSC could be considered species (Davis and Nixon 1992). The unitsidentified by PAA have likely been isolated long enough that different char-acters have become fixed in each population. Thus, the identification of theseunits suggests a historical absence of gene flow between the populations (Davisand Nixon 1992; Goldstein et al. 2000). I conducted a PAA usingMacClade 4.0(Maddison and Maddison 2000).
5 Kloss’s Gibbon Phylogeography 77
Population Genetics
To examine patterns of current gene flow, I conducted an analysis of molecularvariance (AMOVA) at three levels: within local populations, among localpopulations within island groups, and among island groups of populations(Excoffier et al. 1992). I defined the island groups as: (1) Siberut, includingNorth Siberut and Siberut National Park; (2) Sipora; and (3) the Pagais,including North and South Pagai. From these data, I also calculated FST,which describes the proportion of total genetic variance accounted for byvariation among populations. I used Arlequin 2.0 (Schneider et al. 2000) forboth of these analyses.
Results
I sampled a total of 31 gibbon groups. Because of their preferred height in thecanopy, gibbons’ feces are usually splattered by the time they reach the ground.DNA is present in the epithelial cells shed from the lining of the intestinal tract,and these cells are found on the outer surface of the fecal bolus. However, manyof the gibbon samples had been badly splattered and the portions collected maynot have had enough epithelial cells present to give a sufficient amount ofgibbon DNA. I successfully sequenced only 21 individuals, yielding a 479base-pair region of the mitochondrial D-loop. In this sample, 15 haplotypeswere found, with 37 polymorphic sites. Of these, 35 were transitions, one atransversion, and one an insertion/deletion.
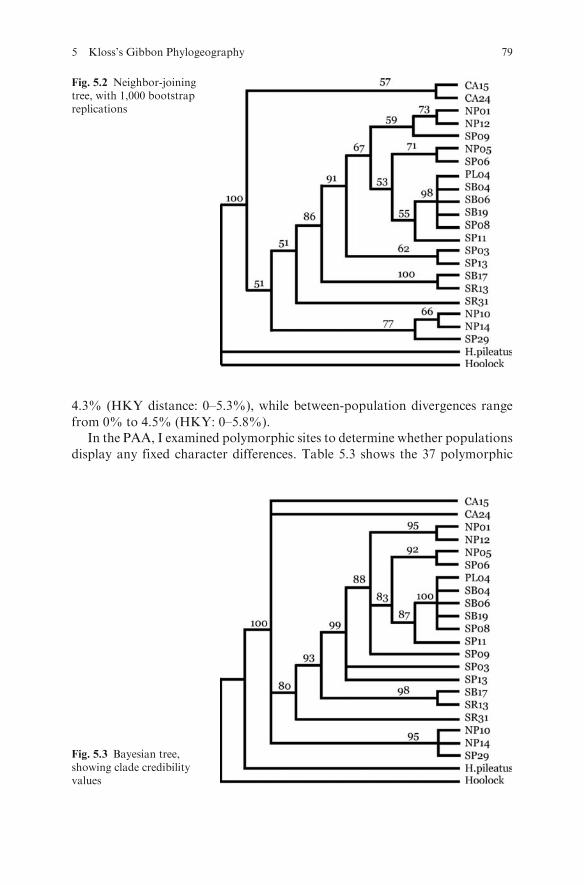
According to MODELTEST, the nucleotide substitution patterns observedin the data correspond to the HKY+G model (Hasegawa et al. 1985). Thismodel assumes that transitions are more likely than transversions, that purineand pyrimidine transitions are equally likely, and that the substitution rate isheterogeneous across sites, following a gamma distribution (shape parameterfor this dataset: 0.3740). I constructed the neighbor-joining tree using theHKY85 distance measure, which in addition to total nucleotide differencesincorporates base frequencies and treats transitions and transversions differ-ently (Hasegawa et al. 1985). This tree (Fig. 5.2) shows no resolution and noseparation of populations, with individuals from Siberut and the Pagais foundthroughout the tree.
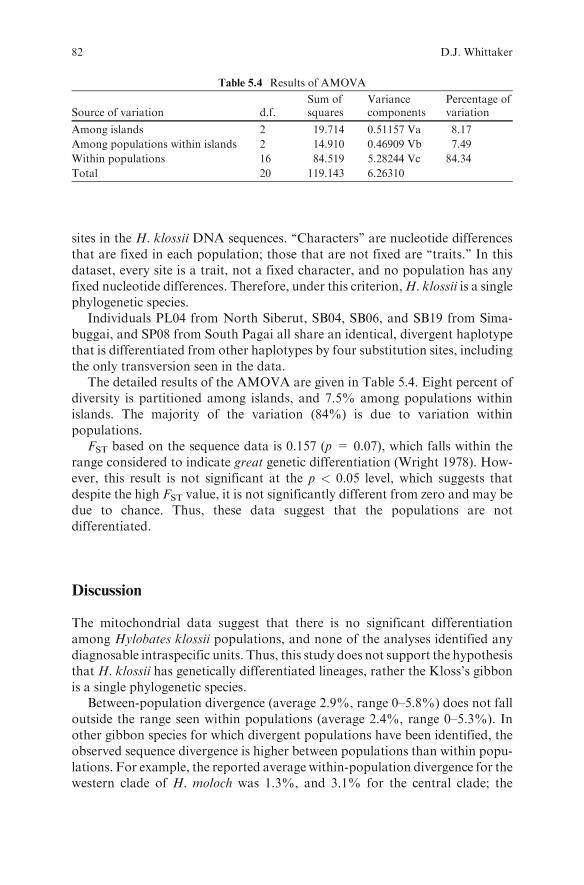
I ran the Bayesian analysis with four chains for 300,000 generations, sam-pling every 100th generation, with a burn-in percentage of 25% or 750 samples.The Bayesian tree, like the neighbor-joining tree, also fails to separate differentpopulations into different clades (Fig. 5.3).
Table 5.2 presents pairwise nucleotide sequence divergence estimates, usingboth uncorrected p distance (the total number of nucleotide differences dividedby the total number of sites) and the HKY85 distance (Hasegawa et al. 1985;Swofford et al. 1996). Within-population divergences (p) range from 0% to
78 D.J. Whittaker
4.3% (HKY distance: 0–5.3%), while between-population divergences range
from 0% to 4.5% (HKY: 0–5.8%).In the PAA, I examined polymorphic sites to determine whether populations
display any fixed character differences. Table 5.3 shows the 37 polymorphic
Fig. 5.2 Neighbor-joiningtree, with 1,000 bootstrapreplications
sites in the H. klossii DNA sequences. ‘‘Characters’’ are nucleotide differencesthat are fixed in each population; those that are not fixed are ‘‘traits.’’ In thisdataset, every site is a trait, not a fixed character, and no population has anyfixed nucleotide differences. Therefore, under this criterion,H. klossii is a singlephylogenetic species.
Individuals PL04 from North Siberut, SB04, SB06, and SB19 from Sima-buggai, and SP08 from South Pagai all share an identical, divergent haplotypethat is differentiated from other haplotypes by four substitution sites, includingthe only transversion seen in the data.
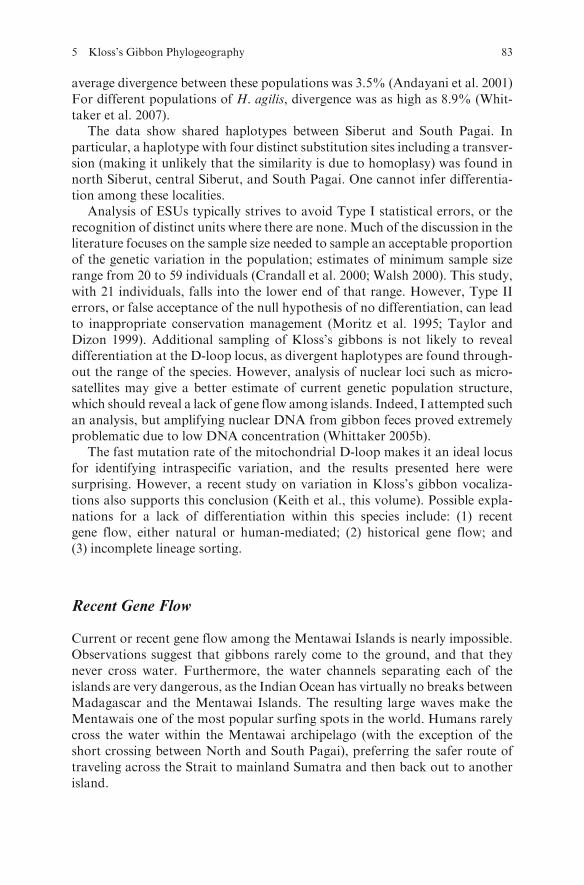
The detailed results of the AMOVA are given in Table 5.4. Eight percent ofdiversity is partitioned among islands, and 7.5% among populations withinislands. The majority of the variation (84%) is due to variation withinpopulations.
FST based on the sequence data is 0.157 (p = 0.07), which falls within therange considered to indicate great genetic differentiation (Wright 1978). How-ever, this result is not significant at the p < 0.05 level, which suggests thatdespite the high FST value, it is not significantly different from zero and may bedue to chance. Thus, these data suggest that the populations are notdifferentiated.
Discussion
The mitochondrial data suggest that there is no significant differentiationamong Hylobates klossii populations, and none of the analyses identified anydiagnosable intraspecific units. Thus, this study does not support the hypothesisthat H. klossii has genetically differentiated lineages, rather the Kloss’s gibbonis a single phylogenetic species.
Between-population divergence (average 2.9%, range 0–5.8%) does not falloutside the range seen within populations (average 2.4%, range 0–5.3%). Inother gibbon species for which divergent populations have been identified, theobserved sequence divergence is higher between populations than within popu-lations. For example, the reported average within-population divergence for thewestern clade of H. moloch was 1.3%, and 3.1% for the central clade; the
Table 5.4 Results of AMOVA
Source of variation d.f.Sum ofsquares
Variancecomponents
Percentage ofvariation
Among islands 2 19.714 0.51157 Va 8.17
Among populations within islands 2 14.910 0.46909 Vb 7.49
Within populations 16 84.519 5.28244 Vc 84.34
Total 20 119.143 6.26310
82 D.J. Whittaker
average divergence between these populations was 3.5% (Andayani et al. 2001)For different populations of H. agilis, divergence was as high as 8.9% (Whit-taker et al. 2007).
The data show shared haplotypes between Siberut and South Pagai. Inparticular, a haplotype with four distinct substitution sites including a transver-sion (making it unlikely that the similarity is due to homoplasy) was found innorth Siberut, central Siberut, and South Pagai. One cannot infer differentia-tion among these localities.
Analysis of ESUs typically strives to avoid Type I statistical errors, or therecognition of distinct units where there are none. Much of the discussion in theliterature focuses on the sample size needed to sample an acceptable proportionof the genetic variation in the population; estimates of minimum sample sizerange from 20 to 59 individuals (Crandall et al. 2000; Walsh 2000). This study,with 21 individuals, falls into the lower end of that range. However, Type IIerrors, or false acceptance of the null hypothesis of no differentiation, can leadto inappropriate conservation management (Moritz et al. 1995; Taylor andDizon 1999). Additional sampling of Kloss’s gibbons is not likely to revealdifferentiation at the D-loop locus, as divergent haplotypes are found through-out the range of the species. However, analysis of nuclear loci such as micro-satellites may give a better estimate of current genetic population structure,which should reveal a lack of gene flow among islands. Indeed, I attempted suchan analysis, but amplifying nuclear DNA from gibbon feces proved extremelyproblematic due to low DNA concentration (Whittaker 2005b).
The fast mutation rate of the mitochondrial D-loop makes it an ideal locusfor identifying intraspecific variation, and the results presented here weresurprising. However, a recent study on variation in Kloss’s gibbon vocaliza-tions also supports this conclusion (Keith et al., this volume). Possible expla-nations for a lack of differentiation within this species include: (1) recentgene flow, either natural or human-mediated; (2) historical gene flow; and(3) incomplete lineage sorting.
Recent Gene Flow
Current or recent gene flow among the Mentawai Islands is nearly impossible.Observations suggest that gibbons rarely come to the ground, and that theynever cross water. Furthermore, the water channels separating each of theislands are very dangerous, as the Indian Ocean has virtually no breaks betweenMadagascar and the Mentawai Islands. The resulting large waves make theMentawais one of the most popular surfing spots in the world. Humans rarelycross the water within the Mentawai archipelago (with the exception of theshort crossing between North and South Pagai), preferring the safer route oftraveling across the Strait to mainland Sumatra and then back out to anotherisland.
5 Kloss’s Gibbon Phylogeography 83
While gibbons are popular pets in the Mentawais, the probability that petgibbons have been reintroduced into the wild across islands is very low. Petgibbons, which are typically acquired as infants, rarely survive to adulthood,and reintroduction of any pet primate is difficult (Cheyne, this volume). Pri-mates that have been reared by humans have never learned how to interact withconspecifics, avoid predators, and rear young. Even with an extensive rehabi-litation and reintroduction program, primates usually cannot acquire theseabilities later in life, and rehabilitated adults often are unable to raise offspringsuccessfully (Yeager and Silver 1999). Furthermore, few Mentawai peopletravel between Siberut and the southern islands. The inhabitants of the Pagaisand Sipora characterize the Siberut peoples as ‘‘primitive,’’ and warn research-ers against traveling there for fear of getting shot at with bows and arrows.MostSiberut peoples, on the other hand, are cash-poor and have few opportunities totravel outside of Siberut, or even outside of their own region within Siberut.
Historical Gene Flow
The Mentawai Islands have been isolated from Sumatra for 500,000 to onemillion years by the 1,500-m deep Mentawai Strait (Whitten et al. 2000).However, sea levels between the individual Mentawai Islands are currentlyonly 10–25 m deep, as shown in nautical maps (London Admiralty 1993).Eustatic sea levels were about 25 m lower than current levels approximately7,000 years ago (Milliman and Emory 1968), which would have been lowenough to connect all four Mentawai Islands into a single landmass. Geneflow could thus have occurred among the Mentawai primate populations asrecently as 7,000 years ago, resulting in the genetic pattern seen here.
Incomplete Lineage Sorting
Genetic differentiation of mtDNA between populations occurs when ancestrallineages are ‘‘pruned’’ so that each population consists of descendants of dif-ferent lineages, resulting in reciprocal monophyly (Avise 2000). Such pruningoccurs much later than the physical separation of the populations. Thus, despitea geographic separation, the Kloss’s gibbons of Siberut and of the southernislands may have retained ancestral mtDNA haplotypes. Since the Mentawaismay have been a single landmass as recently as 7,000 years ago, enough timemay not have passed to allow lineage sorting.
Implications for the Other Mentawai Primates
If Kloss’s gibbons show no significant genetic differentiation, the subspecifictaxonomy of the Mentawai colobines and macaque may also be questioned. As
84 D.J. Whittaker
discussed in the Introduction, the designations rely on small differences incoat color in the colobines and, for the macaques, differentiation in the mito-chondrial genome is not much greater than that seen between populationsof other macaque species, due to the extreme female philopatry of maca-ques. Even so, Kitchener and Groves (2002) argue that the two macaquepopulations are morphologically very distinct, suggesting full species-levelseparation.
Due to different generation times, it is possible that the other Mentawaispecies may display genetic differentiation while the gibbons do not. Gibbonshave longer life histories and longer generation times than macaques andcolobines. Generation time is equal to the length of time from the birth of afemale to her age at first birth. While life history data are not available for allspecies, members of the same genus or family tend to have similar character-istics. Average generation time has been estimated at 54 months (range 46–65)for macaque species (Harvey et al. 1987), and 51 months (range 48–55) forAsian colobines (including Nasalis larvatus, the closest relative of Simias con-color) (Harvey et al. 1987; Ross 1992). The estimated generation time forhylobatids is twice as long, at 110 months (range 108–112) (Harvey et al.1987). For every 1,000 years of separation, 222 generations would have passedfor the macaques and leaf monkeys, and only 110 for the gibbons. In this way,the differentMentawai primates could have the same biogeographic history butdifferent levels of genetic differentiation, due to lineage sorting in the colobinesand macaques but not in the gibbons.
Conservation Planning
The 2008 IUCN Red List listed the Kloss’s gibbon as Endangered IUCN 2008.Based on the mitochondrial data presented here and the analysis of vocaliza-tions presented elsewhere in this volume (Keith et al.), conservationists shouldmanage the species H. klossii as a single unit. Despite this conclusion, multiplereserves may be preferable for long-term conservation. The ‘‘single large orseveral small’’ (SLOSS) debate has focused on just this problem. Large reservesare generally agreed to be better than small reserves, but multiple reservesregardless of size may be able to preserve more genetic variation within a singlespecies or a higher number of species. Furthermore, reliance on multiplereserves may reduce loss due to disease or environmental stochasticity such asearthquakes or fires. However, isolated small reserves that cannot exchangeindividuals and genes with other reserves are less likely to succeed over the longterm (Shafer 1990).
A number of efforts have been made to set aside areas for conservation in thePagais, all of which have been unsuccessful thus far (Tenaza 1987, 1988;Fuentes 1996/1997; Paciulli 2004). The largest population of Kloss’s gibbonsis found in Siberut National Park, where there are 13,000–15,000 gibbons
5 Kloss’s Gibbon Phylogeography 85
(Whittaker 2005a). Although this area has formal protection, there are anumber of problems such as lack of enforcement of hunting laws, insufficientpersonnel, and encroachment of surrounding logging operations (Whittaker2006). This large population has the greatest chance of surviving, as long as it isnot neglected. Conservation efforts should focus on enforcing the existing lawsto protect this population, rather than attempting to create new conservationareas.
However, because the other Mentawai primates do exhibit differences in thesouthern islands, conservation plans should not ignore these populations.Additionally, mitochondrial DNA and vocal analyses may be overlookingdifferentiation among Kloss’s gibbon populations. Although efforts to setaside areas for conservation in the Pagais have been unsuccessful, potentiallyviable primate populations exist within the selectively logged and regeneratingareas of the PT Minas Pagai Lumber logging concession (Paciulli 2004; Whit-taker 2006). In addition to this 130 km2 of ‘‘Limited Production Forest,’’ thecompany has set aside about 78 km2 of Buffer Zone and Conservation Areas topreserve genetic diversity of the tree stocks. Collaborating with this company toreduce hunting within the logging concession may be the best way to preservethe primates in the Pagai Islands (Whittaker 2006).
Acknowledgments This research was supported by a Doctoral Dissertation ImprovementGrant from the National Science Foundation (BCS-0335949), grants from the Charles A. andAnne Morrow Lindbergh Foundation, Primate Conservation, Inc., and Conservation Inter-national, and by the City University of New York Graduate Center, and the New YorkConsortium in Evolutionary Primatology (NYCEP). I am grateful to the Indonesian Instituteof Sciences (LIPI) and the government of the Republic of Indonesia for granting permission toconduct research in Indonesia, as well as my Indonesian sponsors Noviar Andayani andAmsir Bakar. Thanks also to Juan CarlosMorales, DonMelnick, Todd Disotell, John Oates,Rob DeSalle, and Roberto Delgado for guidance, comments, and access to laboratoryfacilities. Finally, thank you to Susan Lappan for thoughtful comments throughout thisresearch project.
References
Andayani, N., Morales, J.C., Forstner, M.R.J., Supriatna, J. andMelnick, D.J. 2001. Geneticvariability in mitochondrial DNA of the Javan gibbon (Hylobates moloch): implicationsfor the conservation of critically endangered species. Conservation Biology 15:770–775.
Avise, J.C. 2000. Phylogeography: The History and Formation of Species. Cambridge, MA:Harvard University Press.
Batchelor, B.C. 1979. Discontinuously rising late Cainozoic sea-levels with special referenceto Sundaland, Southeast Asia. Geologie en Mijnbouw 58:1–10.
Chasen, F.N. and Kloss, C.B. 1927. Spolia Mentawiensia – Mammals. Proceedings of theZoological Society of London 1927:797–840.
Cracraft, J. 1983. Species concepts and speciation analysis. Current Ornithology 1:159–187.Crandall, K.A., Bininda-Emonds, O.R.P., Mace, G.M. and Wayne, R.K. 2000. Considering
evolutionary processes in conservation biology: an alternative to ’evolutionarily signifi-cant units’. Trends in Ecology and Evolution 15:290–295.
86 D.J. Whittaker
Davis, J.L. and Nixon, K.C. 1992. Populations, genetic variation, and the delimitation ofphylogenetic species. Systematic Biology 41:421–435.
Excoffier, L., Smouse, P.T. and Quattro, J.M. 1992. Analysis of molecular variance inferredfrommetric distance among DNA haplotypes: application to human mitochondrial DNArestriction data. Genetics 131:479–491.
Fuentes, A. 1996/1997. Current status and future viability for the Mentawai primates.Primate Conservation 17:111–116.
Geissmann, T. and Nijman, V. 2006. Calling in wild silvery gibbons (Hylobates moloch) inJava (Indonesia): behavior, phylogeny, and conservation. American Journal of Primatol-ogy 68:1–19.
Goldstein, P.Z., DeSalle, R., Amato, G. and Vogler, A.P. 2000. Conservation genetics at thespecies boundary. Conservation Biology 14:120–131.
Harvey, P.H., Martin, D.R. and Clutton-Brock, T.H. 1987. Life histories in comparative per-spective. In Primate Societies, B.B. Smuts,D.L.Cheney,R.M. Seyfarth,R.W.WranghamandT.T. Struhsaker (eds.), pp. 181–196. Chicago: Chicago University Press.
Hasegawa, M., Kishino, H. and Yano, T. 1985. Dating of the human-ape splitting by amolecular clock of mitochondrial DNA. Journal of Molecular Evolution 21:160–174.
Huelsenbeck, J.P. and Ronquist, F. 2001. MRBAYES: Bayesian inference of phylogeny.Bioinformatics 17:754–755.
IUCN. 2008. IUCN2008Red List of Threatened Species.<www.iucnredlist.org>. Downloadedon 10 February 2009.
Karig, D.E., Moore, G.F., Curray, J.R. and Lawrence, M.B. 1980. Morphology and shallowstructure of the lower trench slope off Nias Island, Sunda Arc. In The Tectonic andGeologic Evolution of Southeast Asian Seas and Islands, D.E. Hayes (ed.), pp. 179–208.Washington, D.C.: American Geophysical Union.
Kitchener, A.C. and Groves, C. P. 2002. New insights into the taxonomy ofMacaca pagensisof the Mentawai Islands, Sumatra. Mammalia 66:533–542.
Kobold, S., Ziegler, T. and Maennel, R. 2003. The primates of Mentawai and the SiberutConservation Project. ZGap Mitteilungen 19:7–9.
Kocher, T.D., Thomas, W.K., Meyer, A., Edwards, S.V., Paabo, S., Villablanca, F.X. andWilson, A.C. 1989. Dynamics of mitochondrial DNA evolution in animals: amplificationand sequencing with conserved primers. Proceedings of the National Academy of SciencesUSA 86:6196–6200.
London Admiralty. 1993. Pulau Nyamuk to Bengkulu: from the Netherlands governmentcharts to 1926, with additions and corrections to 1978.
Maddison,W.P. andMaddison, D.R. 2000. MacClade: Analysis of Phylogeny and CharacterEvolution. Version 4.0. Sunderland, MA: Sinauer Associates.
McNeely, J.A. 1978. Siberut: Conservation of Indonesia’s Island Paradise. Tigerpaper5:16–20.
Melnick, D.J. andHoelzer, G.A. 1992. Differences in male and female macaque dispersal leadto contrasting distributions of nuclear and mitochondrial DNA variation. InternationalJournal of Primatology 13:379–393.
Milliman, J.D. and Emory, K.O. 1968. Sea levels during the past 35,000 years. Science162:1121–1123.
Moore, G.F., Curray, J.R., Moore, D.G. and Karig, D.E. 1980. Variations in geologicstructure along the Sunda fore arc, northeastern Indian Ocean. In The Tectonic andGeologic Evolution of Southeast Asian Seas and Islands (American Geophysical UnionMonograph 23), D.E. Hayes (ed.), pp. 145–160. Washington, D.C.: American Geophysi-cal Union.
Moritz, C., Lawery, S. and Slade, R. 1995. Using allele frequency and phylogeny to defineunits for conservation and management. In Evolution and the Aquatic Ecosystem: Defin-ing Unique Units in Population Conservation, J.L. Nielsen (ed.), pp. 249–262. Bethesda:American Fisheries Society.
5 Kloss’s Gibbon Phylogeography 87
Nixon, K.C. and Wheeler, Q.D. 1990. An amplificaiton of the phylogenetic species concept.Cladistics 6:211–223.
Paciulli, L.M. 2004. The effects of logging, hunting, and vegetation on the densities of thePagai, Mentawai Islands primates. (Unpubl. Ph.D. thesis, State University of New York).
Platnick, N.I. 1979. Philosophy and the transformation of cladistics. Systematic Zoology28:1–17.
Posada, D. and Crandall, K.A. 1998. MODELTEST: testing the model of DNA substitution.Bioinformatics 14:817–818.
Ronquist, F. and Huelsenbeck, J.P. 2003. MRBAYES 3: Bayesian phylogenetic inferenceunder mixed models. Bioinformatics 19:1572–1574.
Roos, C.I. and Geissmann, T. 2001. Molecular phylogeny of the major hylobatid divisions.Molecular Phylogenetics and Evolution 19:486–494.
Roos, C.I., Ziegler, T., Hodges, K.J., Zischler, H. and Abegg, C. 2003. Molecular phylogenyof Mentawai macaques: taxonomic and biogeographic implications. Molecular Phyloge-netics and Evolution 29:139–150.
Ross, C. 1992. Basal metabolic rate, body weight, and diet in primates: an evaluation of theevidence. Folia Primatologica 58:7–23.
Ryder, O.A. 1986. Species conservation and systematics: the dilemma of subspecies. Trends inEcology and Evolution 1:9–10.
Saitou, N. and Nei, M. 1987. The neighbor-joining method: a new method for reconstructingphylogenetic trees. Molecular Biology and Evolution 4:406–425.
Schneider, S., Roessli, D. and Excoffier, L. 2000. Arlequin: A software for PopulationGenetics Data Analysis. Geneva: Genetics and Biometry Lab, Department of Anthropol-ogy, University of Geneva.
Shafer, C.L. 1990. Nature preserves: island theory and conservation practice. Washington D.C.: Smithsonian Institution Press.
Swofford, D.L. 2002. PAUP*. Phylogenetic analysis using parsimony (* and other methods).Version 4. Sunderland, MA: Sinauer Associates.
Swofford, D.L., Olsen, G.J., Waddell, P.J. and Hillis, D.M. 1996. Phylogenetic inference. InMolecular Systematics, D.M. Hillis, C. Moritz and B.K. Mable (eds.), pp. 407–514.Sunderland, MA: Sinauer.
Takacs, Z., Morales, J.C., Geissmann, T. and Melnick, D.J. 2005. A complete species-levelphylogeny of the Hylobatidae based on mitochondrial ND3-ND4 gene sequences. Mole-cular Phylogenetics and Evolution 36:456–467.
Taylor, B.L. and Dizon, A.E. 1999. First policy then science: why a management unit basedsolely on genetic criteria cannot work. Molecular Ecology 8:S11–S16.
Tenaza, R.R. 1987. The status of primates and their habitats in the Pagai Islands, Indonesia.Primate Conservation 8:104–110.
Tenaza, R.R. 1988. Status of primates in the Pagai Islands, Indonesia: A progress report.Primate Conservation 9:146–149.
Vigilant, L., Pennington, R., Harpending, H., Kocher, T.D. and Wilson, A.C. 1989. Mito-chondrial DNA sequences in single hairs from a southernAfrican population. Proceedingsof the National Academy of Sciences USA 86:9350–9354.
Vogler, A.P. and DeSalle, R. 1994. Diagnosing units of conservation management. Conserva-tion Biology 8:354–363.
Walsh, P.D. 2000. Sample size for the diagnosis of conservation units. Conservation Biology14:1533–1537.
Whittaker, D.J. 2005a. New population estimates for the endemic Kloss’s gibbon Hylobatesklossii on the Mentawai Islands, Indonesia. Oryx 39:458–461.
Whittaker, D.J. 2005b. Evolutionary genetics of Kloss’s gibbons (Hylobates klossii): systematics,phylogeography, and conservation. (unpubl. Ph.D. thesis, The City University of NewYork).
Whittaker, D.J. 2006. Conservation action plan for the Mentawai primates. Primate Con-servation 20:95–105.
88 D.J. Whittaker
Whittaker, D.J., Morales, J.C. and Melnick, D.J. 2007. Resolution of the Hylobates phylo-geny: congruence of mitochondrial D-loop sequences with molecular, behavioral, andmorphological data sets. Molecular Phylogenetics and Evolution 45:620–628.
Whitten, A.J. and Whitten, J.E.J. 1982. Preliminary observations of the Mentawai macaqueon Siberut Island, Indonesia. International Journal of Primatology 3:445–459.
Whitten, A.J., Damanik, S.J., Anwar, J. and Hisyam, N. 2000. The Ecology of Sumatra.Hong Kong: Periplus.
Woodruff, D.S., Monda, K. and Simmons, R.E. 2005. Mitochondrial DNA sequence varia-tion and subspecific taxonomy in the white-handed gibbon, Hylobates lar. The NaturalHistory Journal of Chulalongkorn University Supplement 1:71–78.
World Wildlife Fund. 1980. Saving Siberut: A Conservation Master Plan. Bogor, Indonesia:WWF Indonesia Programme.
Wright, S. 1978. Variability Within and Among Natural Populations. Chicago: University ofChicago Press.
Yeager, C.P. and Silver, S.C. 1999. Translocation and rehabilitation as primate conservationtools: are they worth the cost? In In The Nonhuman Primates, P. Dolhinow and A.Fuentes (eds.), pp. 164–169. Mountain View, CA: Mayfield Publishing Company.
Zehr, S.M. 1999. A nuclear and mitochondrial phylogeny of the lesser apes (Primates, genusHylobates). (unpubl. Ph.D. thesis, Harvard University).